Article

Measurement of Telomere Length in Colorectal Cancers for Improved Molecular Diagnosis

1
CHRU Hôpital de Tours Trousseau, avenue de la République, 37170 Chambray-lès-Tours, France
2
UMR CNRS 7292, UFR Pharmacy, University of Tours, Parc Grandmont, 31 avenue Monge, 37200 Tours, France
*
Author to whom correspondence should be addressed.
Current address: GReD, CNRS UMR6293, INSERM U1103, Université Clermont-Auvergne; Faculté de Médecine; 28 place Henri Dunant, 63001 Clermont-Ferrand, France.
Int. J. Mol. Sci. 2017, 18(9), 1871; https://doi.org/10.3390/ijms18091871
Submission received: 31 July 2017 / Revised: 18 August 2017 / Accepted: 25 August 2017 / Published: 29 August 2017
(This article belongs to the Special Issue Role of Telomeres and Telomerase in Cancer and Aging)

Abstract

:
All tumors have in common to reactivate a telomere maintenance mechanism to allow for unlimited proliferation. On the other hand, genetic instability found in some tumors can result from the loss of telomeres. Here, we measured telomere length in colorectal cancers (CRCs) using TRF (Telomere Restriction Fragment) analysis. Telomeric DNA content was also quantified as the ratio of total telomeric (TTAGGG) sequences over that of the invariable Alu sequences. In most of the 125 CRCs analyzed, there was a significant diminution in telomere length compared with that in control healthy tissue. Only 34 tumors exhibited no telomere erosion and, in some cases, a slight telomere lengthening. Telomere length did not correlate with age, gender, tumor stage, tumor localization or stage of tumor differentiation. In addition, while telomere length did not correlate with the presence of a mutation in BRAF (V-raf murine sarcoma viral oncogene homolog B), PIK3CA (phosphatidylinositol 3-kinase catalytic subunit), or MSI status, it was significantly associated with the occurrence of a mutation in KRAS. Interestingly, we found that the shorter the telomeres in healthy tissue of a patient, the larger an increase in telomere length in the tumor. Our study points to the existence of two types of CRCs based on telomere length and reveals that telomere length in healthy tissue might influence telomere maintenance mechanisms in the tumor.

Graphical Abstract

1. Introduction

Colorectal cancer (CRC) is the second leading cause of cancer-related death in Europe [1]. Most colorectal cancers arise through genetic instability of the genome. A genetic model of colorectal carcinogenesis that was proposed around 15 years ago remains a paradigm in studies on solid tumor progression [2]. However, despite progress in the understanding of the molecular background of these cancers, effective molecular classification remains a challenge. Microsatellite instability (MSI), chromosomal instability (CIN) as well as CpG island methylator phenotype (CIMP) seem to play a major role in these cancers [1,3]. Consequently, most of the classifications adopted to date are based on MSI, CIN and CIMP and attempt, in addition, to correlate these with the presence of mutations in KRAS (Kirsten rat sarcoma viral oncogene homolog) or BRAF (V-raf murine sarcoma viral oncogene homolog B) [1,4]. Mutational inactivation of APC (adenomatous polyposis coli), a tumor suppressor gene, is considered one of the earliest events in CRC tumorigenesis and is followed by the occurrence of activating mutations in KRAS. Microsatellites are short repetitive DNA sequences that are subject to frame-shift mutations and base-pair substitutions during DNA replication and are involved in DNA repair. MSI, or instability of microsatellite sequences, is related to defects in the mismatch repair system of DNA (known as MMR system) and these defects, initially associated with Lynch syndrome, generate two distinct types of phenotypes referred to as MSI-high (MSI-H) and MSI-low (MSI-L) [1]. Loss of MLH1 (mutS homolog 1) function, for instance, originally associated with Lynch syndrome, also occurs in 15% to 20% of sporadic CRCs. Lynch syndrome is the result of germline mutations in one of the alleles of MMR genes (mainly MSH2 (MutS protein homolog 2) and MLH1 genes). The somatic mutation of the second allele leads to an alteration of the MMR system and the appearance of mutations leading to a carcinogenesis process. In sporadic CRCs, the cause is the hypermethylation of the two alleles of the MLH1 gene. MSI-H accounts for around 22% of CRC cases [5]. Many studies have considered MSI status as a major prognostic biomarker because, for instance, MSI-H is associated with increased survival [1]. CIN refers to genome rearrangements consisting of abnormal chromosome complement or number. Tumors with CIN account for around 60% of CRC cases [6].
The linear chromosomes of eukaryotic organisms require particular protection at their extremities. Telomeres represent the ends of these linear chromosomes; they contain repeated TG-rich sequences not coding for proteins. Telomeric DNA sequences specifically associate with specialized proteins such as, for instance in vertebrates, proteins of the shelterin complex. These telomeric proteins provide protection of the telomeric ends, as they prevent their erosion and degradation [7]. Thus, telomeres protect chromosome ends from DNA repair activities that reseal chromosome internal DNA breaks occurring during DNA damage [8]. It is now currently admitted that telomere dysfunction is at the origin of a number of degenerative disorders and that these telomere syndromes predispose to cancer [9]. In vertebrates, shelterin is a complex of six telomeric proteins (TRF1 (Telomere Repeat-binding Factor 1), TRF2 (Telomere Repeat-binding Factor 2), POT1 (Protection of Telomeres protein 1), TIN2 (TRF1-Interacting nuclear Factor 2), TPP1/PIP1 (Telomere Protection Protein 1/POT1-Interacting Protein 1) and RAP1 (Repressor/Activator site-binding Protein 1) that prevent inappropriate recombination and fusion between telomeres, and also have major roles in telomere replication and length regulation. In recent years, the human shelterin complex and in particular one its components, TRF2, have been found to play a major role in cancer biology [9,10]. Thus, TRF2, but also TRF1 and TIN2, are overexpressed in certain cancers and, in addition, several mutations in genes encoding the components of the shelterin complex have been identified in cancers [11,12]. Moreover, at the telomeres, the DNA damage response and cell cycle control machineries, which are altered in cancer cells, are regulated by the shelterin complex proteins [8]. Finally, TRF2 and RAP1 also bind to internal telomere sequences and modulate transcription of a number of genes, some of which might be potentially important to the survival of cancer cells [11,12].
Telomere sequences naturally erode with ongoing cell divisions, due to intrinsic mechanisms associated with the fixed 5′ to 3′ polarity of replication of the DNA of the genome. Below a certain threshold, shortened telomeres result in a DNA damage-induced cell cycle arrest, which is the equivalent of replicative senescence in cultured cells. By limiting the replicative potential of cells, telomere length serves as “biological clock” and telomere erosion acts as a barrier against tumorigenesis in healthy tissue. Paradoxically, telomere erosion or telomere dysfunction also induces chromosomal instability and favors the emergence of tumors [13]. However, following cancer initiation, tumor cells must overcome the telomere-controlled replicative senescence barrier, and all, without exception, have an absolute need for maintaining functional telomeres to sustain continuous and unlimited cell proliferation. In around 90% of cancer types, this occurs through up-regulation of telomerase, a reverse transcriptase with a built-in RNA template specialized in telomeric DNA replication that is naturally repressed in most somatic tissues [14]. In the remaining 10% of cancer types, an alternative pathway called the ALT (Alternative Lengthening of Telomeres) pathway, functioning either by amplifying telomere sequences by homologous recombination or by sister chromatid exchange is used [15,16].
Measurements of telomere length have been reported in several studies on human CRCs during the past 25 years or so (see, for instance, [17,18,19]). In the present study, we measured telomere length in 125 CRCs using TRF (Telomere Restriction Fragment) Southern-blot analysis [20]. There are currently several methods starting with genomic DNA for measuring telomere length in cells, among which TRF analysis, qPCR (quantitative Polymerase Chain Reaction) amplification of telomere repeats relative to a single copy gene), PCR-based single telomere length analysis (STELA) and flow FISH (fluorescent in situ hybridization of telomere repeats in individual cells or chromosomes) are the most common [21]. Among these methods, TRF analysis is often considered as the gold standard [21]. One of the advantages of TRF analysis is to obtain an absolute value for telomere length in kilobases (Kb). Tumor cells that have positive telomerase activity or normal somatic cells have a telomere length of 5–10 Kb, while tumor cells that have developed the ALT pathway have long (>20 Kb) and heterogeneous (0.5–50 Kb) telomeres as compared to the shorter and more homogeneous telomeres of telomerase positive tumor cells [16]. In addition, 3D techniques based on 3D telomere fluorescence in situ hybridization followed by quantitative analysis have allowed analyzing telomere organization in the nucleus throughout the cell cycle [22,23]. It was reported that specific 3D nuclear telomeric profiles were associated with cancer and allowed for the identification of patient subgroups [22,24].
In the present study, we have measured telomere length in 125 CRC tumors and in adjacent healthy tissue using TRF analysis. Then, we have investigated the possible links between telomere maintenance in CRC and some clinical, anatomopathological and molecular parameters used in current practice. This study is an explorative one, with no pre-specified hypotheses and, therefore, there was no independent validation cohort.

2. Results

2.1. Description of the Tumors Analyzed

A total of 135 patients suffering from CRC were included in the present study, among which 125 provided enough tumoral DNA for telomere length/telomeric DNA content analyses. The cohort analyzed for telomere maintenance parameters comprised 69 (55.2%) men and 56 (44.8%) women. Mean patient age was 72 years (standard deviation 11.9). Right and transverse colon were the sites for the primary tumor in 50 (40.0%) of the cases, while left colon and rectum were the primary sites in 70 (56.0%) and 5 (4.0%) cases, respectively. The distribution of tumor localization according to tumor stage is presented in Table 1. The distribution of mutations in the KRAS, BRAF and PIK3CA genes, as well as the occurrence of microsatellite instability (MSI), depending on tumor stage is given in Table 2.

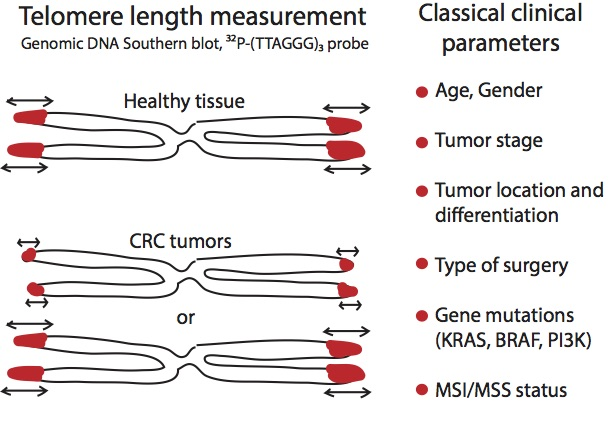
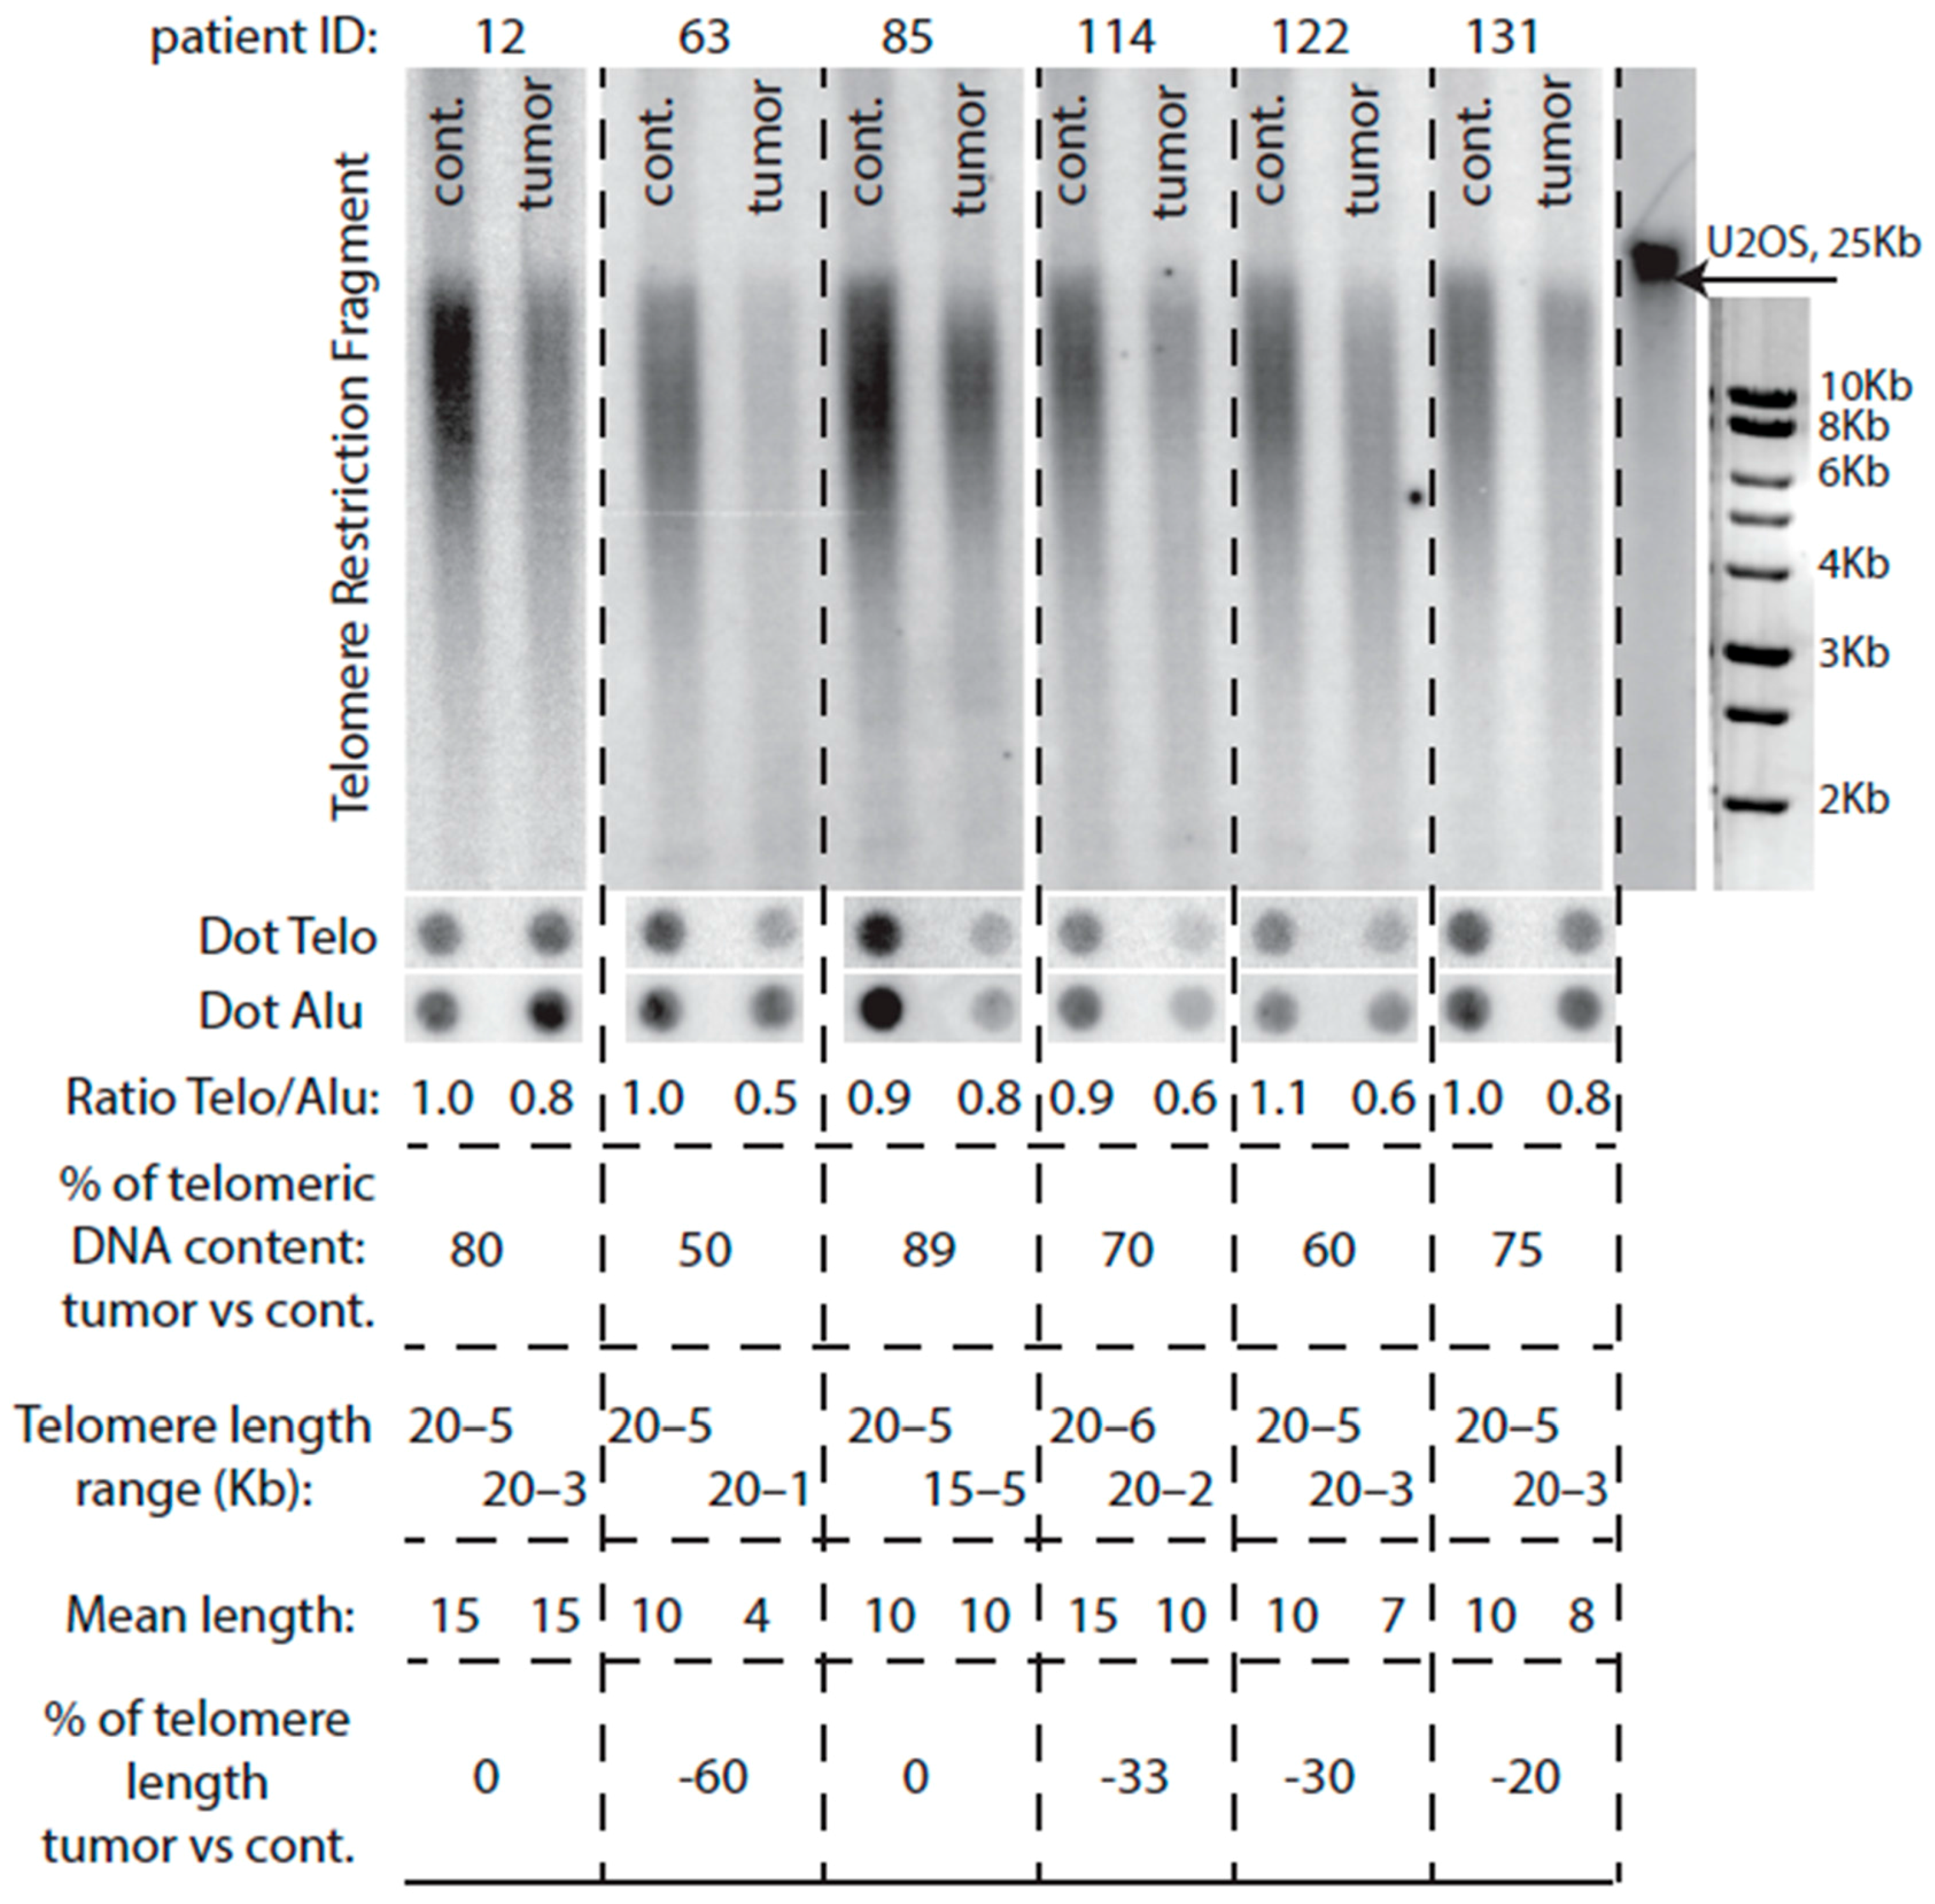
2.2. Telomeres Are Globally Much Shorter in Tumors Than in Healthy Tissue

Telomere length was measured by TRF analysis (Figure 1A) and, in addition, the amount of telomeric sequences, TTAGGG, was quantified by measuring the TTAGGG sequences/Alu sequences ratio (Figure 1B). Mean telomere length was significantly smaller in the CRC samples compared to adjacent healthy mucosa samples (7.2 Kb in tumors samples vs. 9.7 Kb in adjacent mucosa; n = 125; p < 0.0001; Table S1). When considered stage by stage (TNM classification), telomere length in the tumors was also significantly smaller than in the healthy surrounding tissue (Table 3). On the other hand, the total amount of telomeric sequences, determined as the TTAGGG sequences/Alu sequences ratio is given for each tumor in the column “percent of telomeric DNA content tumor vs. cont.” of Table S2. We arbitrarily defined 80% as being the threshold above which tumors were considered as exhibiting either no telomere erosion or at most moderate telomere erosion because of TRF-measured telomere length. Not taking 100% as the actual expected number indicating absence of telomere erosion resulted from the fact that we observed that 100% did not always correlate with actual maintenance of telomere length in the tumor. Hence, this decision to lower this threshold to 80% to evaluate more accurately the correlation between Telo/Alu measurement and TRF measurement (Table S2). Raw data of representative examples are also presented in Figure 1B. Diminution of the Telo/Alu sequences ratio in most of the colorectal tumors analyzed here confirmed the concomitant telomere shortening measured by TRF analysis (see Section 2.4).
Mean telomere length did not vary between the different tumoral TNM classification stages (6.8 Kb for stage I, 7.6 Kb for stage II, 7.2 Kb for stage III and 6.8 Kb for stage IV; p = 0.7). In addition, there was an absence of correlation between telomere length and the presence or absence of metastasis (7.3 Kb vs. 6.8 Kb; p = 0.3), or tumor location (p = 0.6).

2.3. A Class of Colorectal Cancers Does Not Exhibit Telomere Erosion

In practice, there were several ways to try to discern different classes of tumors based on the size of their telomeres. One way of doing it was to apply an arbitrarily defined value for telomere length and then class tumors as being either above or below this value. We could have taken, for instance, the mean value of telomere length of the 125 healthy tissues as that threshold numerical value. However, this was not satisfying, as telomere length in healthy tissue can greatly vary from one patient to another. Furthermore, we reasoned that it would be biologically more sounded to compare telomere length in a given tumor with telomere length in healthy tissue from the same patient. This could potentially help to explain the importance of telomere length deregulation in the tumor. We therefore defined the event of telomere erosion as our leading criterion to establish two classes of CRC tumors: those exhibiting clear telomere erosion and those with either no apparent change in telomere length or even slight telomere elongation. Separating “no change in telomere length tumors” and “longer telomeres tumors” in two distinct groups would have led to too few cases for each group, thus diminishing the impact of the statistical analysis. These two classes were therefore arbitrarily grouped together. In addition, doing this way was technically more reliable, since it is very difficult to appreciate the mean value of telomere length on the Southern blots due to their very heterogeneous lengths (Figure 1A). On the other hand, defining a tumor as exhibiting telomere erosion or not is much easier, because, in most cases, this event is readily discernable by eye.
Out of the 125 tumors analyzed by TRF, 91 exhibited telomeres that were shorter than in the healthy surrounding tissue taken from the same patient, while in the remaining 34 patients telomere length in the tumor was either roughly identical to that in the normal tissue or slightly larger (Figure 1A; Table S1). In fact, five out of 34 only of these tumors belonging to the later class actually exhibited elongated telomeres (tumors #3, #40, #58, #88 and #90; Table S2). In the rest of this study, we arbitrarily used these two classes of tumors to conduct additional statistical tests. In the 91 tumor samples with shortened telomeres, mean telomere length was statistically significantly shorter than in their normal adjacent tissue (6.5 Kb in the tumors versus 10.0 Kb in the normal surrounding tissue; p < 0.0001; Table 4). In the 34 tumors with elongated telomeres or telomeres of the same length as the control, mean telomere length was 9.2 Kb versus 8.8 Kb in the normal adjacent tissue, not significantly different (p = 0.50; Table 4).

2.4. Comparison of Telomere Restriction Fragment and Telo/Alu Methods to Measure Telomere Length

We note that among the 34 tumors with either slightly elongated telomeres or telomeres roughly of the same size as in healthy tissue, as measured by TRF analysis, only 18 simultaneously exhibited an increased Telo/Alu ratio, meaning that 16 tumors had telomeres equal or larger than in control but a Telo/Alu ratio <80%, the threshold chosen for absence of telomere erosion in the tumor, as defined above (Figure 2; Table S2). Conversely, 24 other tumors that exhibited Telo/Alu ratio >80% (compared with control tissue) did not have, by TRF analysis, telomeres longer than that of the healthy control tissue, meaning that 67/91 tumors that had eroded telomeres also exhibited Telo/Alu ratio <80% (Table S2). These results suggest that, although measurement of the total amount of telomeric sequences by the Telo/Alu ratio method does not always reflect the presence of long telomeres, it nevertheless remains that the vast majority of tumors with eroded telomeres, 67/91, also exhibited a dramatically decreased amount ot total telomeric sequences.

2.5. Mutated KRAS Preferentially Associates with Short Telomeres

The 91 tumor samples with significantly eroded telomeres were next compared to the 34 tumor samples with good telomere maintenance for additional clinical parameters. There was no significant difference in mean telomere length between the two groups concerning age (p = 0.3), gender (p = 0.8), tumor location (p = 0.3), stage (CRC TNM classification) (p = 0.8), tumor differentiation stage (p = 0.9) or degree of lymphocytic infiltration (p = 0.5). Interestingly, we observed significantly less cases with mutated KRAS status in the 34 samples with good telomere maintenance than in the 91 samples with eroded telomeres (~17% vs. ~39%, respectively; p < 0.05), the amount of mutated KRAS in the total population (n = 125) being ~34%. On the other hand, there was no difference between the two groups concerning the occurrence of mutations in BRAF (p = 0.7), PIK3CA (p = 0.7) or the MSI status (p = 0.6).

2.6. Telomere Lengthening in the Tumor Preferentially Occurs in Patients with Short Telomeres

Interestingly, too, telomeres in the healthy control tissues of the 34 tumors exhibiting telomeres equal in size or larger than in control were significantly shorter than their control counterparts in the 91 patients with eroded telomeres (8.8 Kb for the former vs. 10.0 Kb for the latter, p = 0.021); thus, the shorter the telomeres in healthy tissue of a patient, the larger an increase in telomere length in the tumor. This observation may suggest that the mechanisms of cancer-initiated telomere lengthening might differ depending on the actual size of the telomeres of the healthy cells prior to cancer initiation (see Discussion). When we looked into more detail at the profiles of the TRF Southern blots, we observed that, in some cases, telomeres in the control (healthy tissue) samples of the patients with tumors with telomeres equal or larger than in control were more heterogeneous in size than telomeres in the corresponding tumor (Figure 3). The significance of this observation is not yet known.

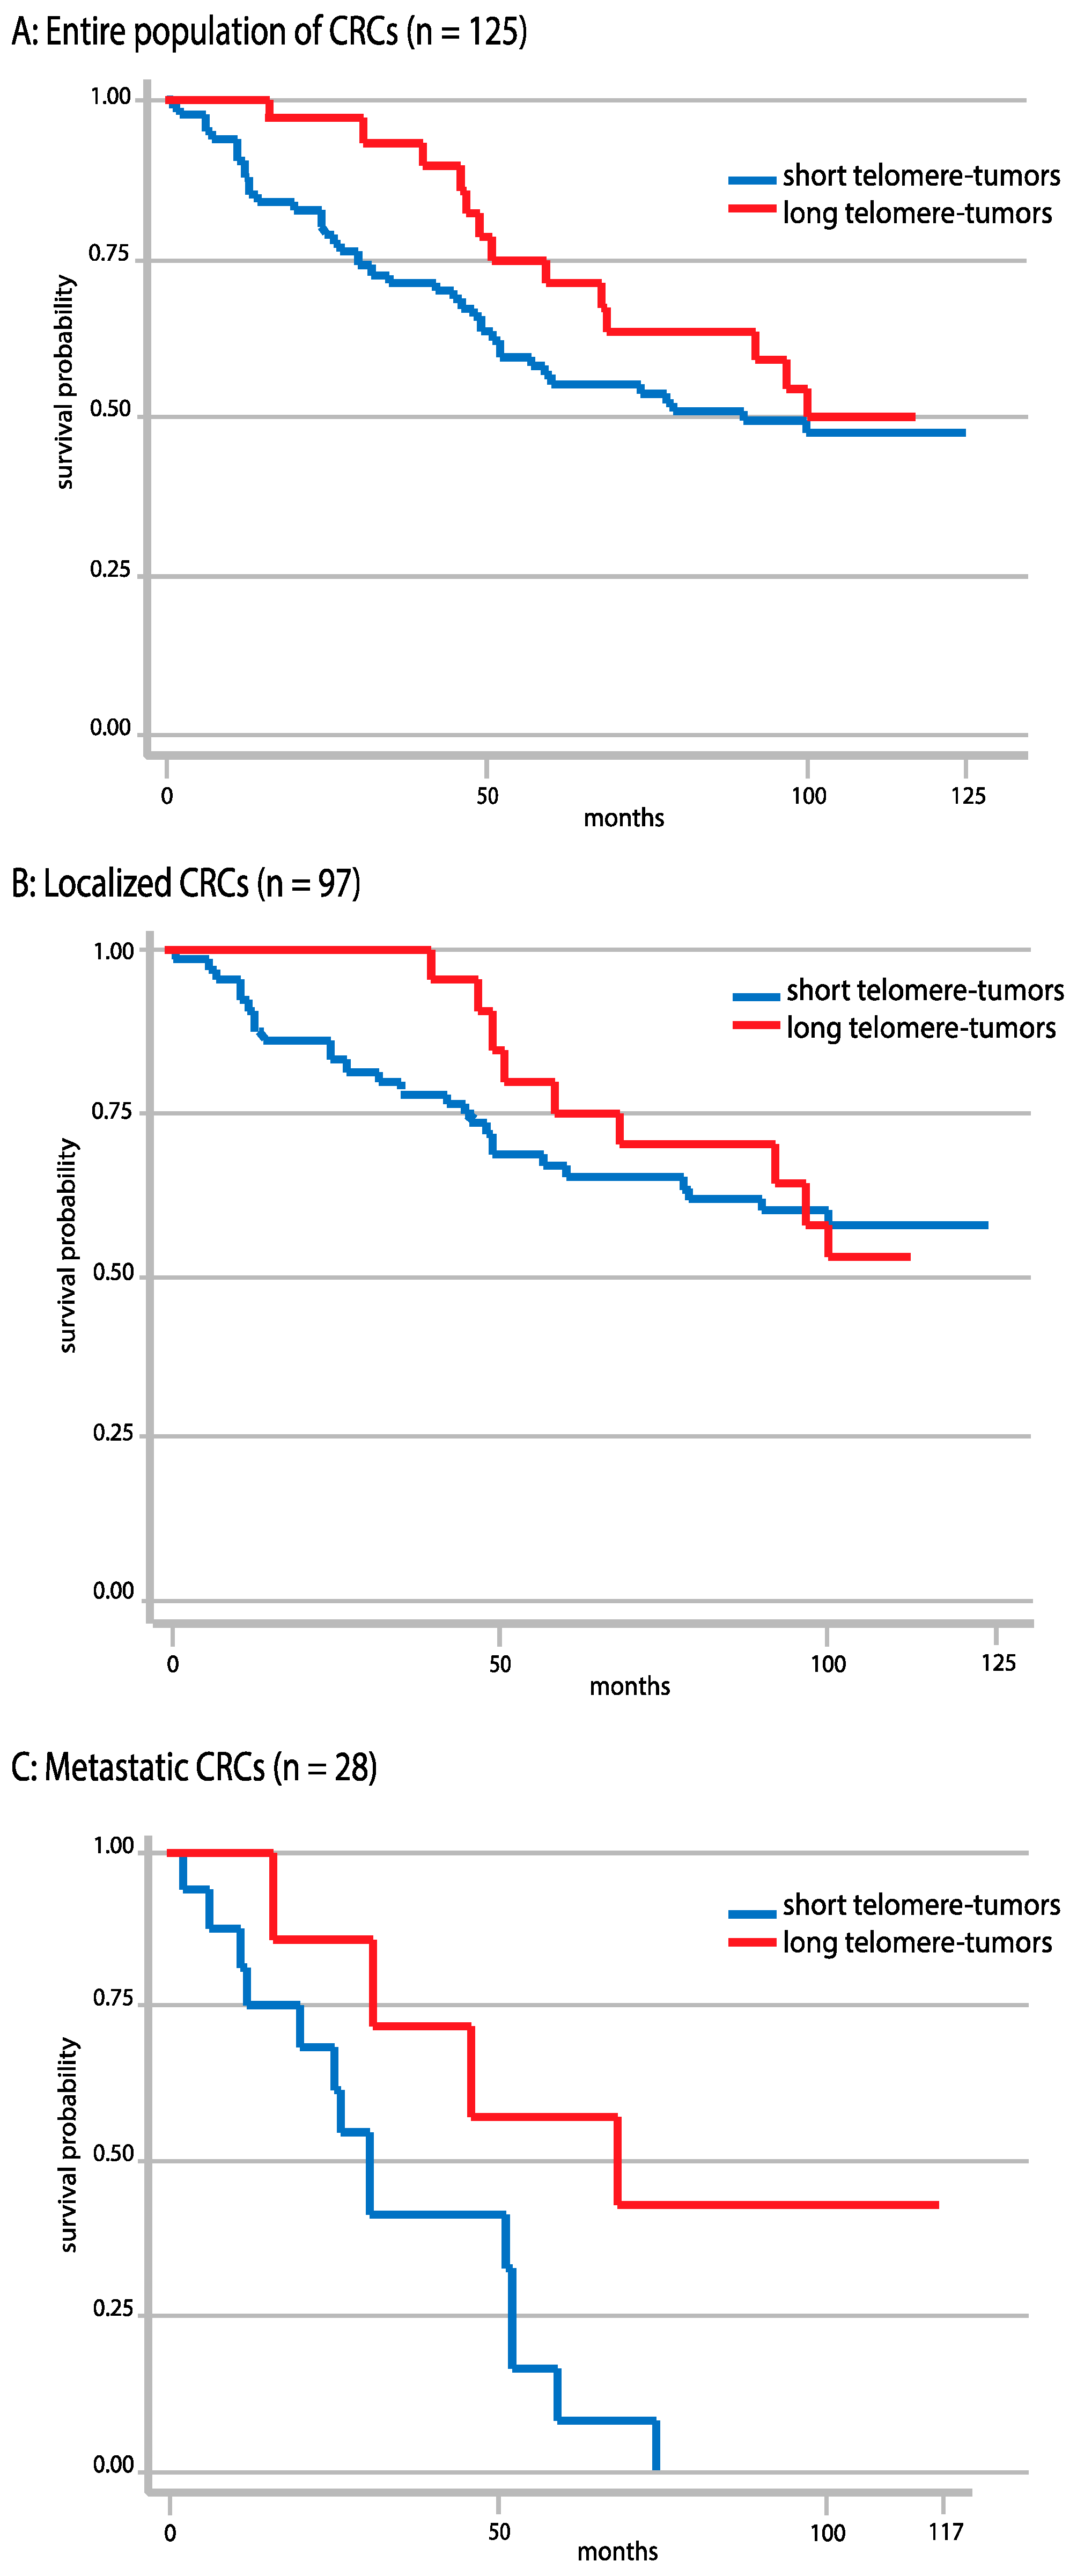
2.7. Correlations between Telomere Length and Overall Survival

Possible correlations between overall survival and telomere length were assessed by comparing the evolution of survival (expressed as the probability of survival) in the two classes of tumors arbitrarily distinguished based on telomere length (Figure 4). The curve of survival in the 91 tumors with eroded telomeres was slightly more incurved than that of the 34 tumors exhibiting good telomere maintenance, meaning that patients with tumors with longer telomeres better survived than those with tumors with eroded telomeres (Figure 4). Thus, after 103 months of recording, ~52% of the patients with maintained length telomere-tumors were still alive, while a similar percentage of survival, ~53%, was achieved after only 60 months in the patients with short telomere-tumors; the percentage of survival attained in this class of patients after 103 months being ~43% only. Overall survival was significantly correlated with telomere length in metastatic tumors (n = 28) in univariate analysis (p = 0.03), but not in multivariate analysis. However, there was no statistically significant difference in overall survival between the maintained length telomere-tumor class and the short telomere-tumor class when the entire population of analyzed CRCs (n = 125) was taken into account (p = 0.36). It was also not the case when the population of localized CRCs (n = 97) was taken into account (p = 0.76).

2.8. Correlations between Telomere Length and Tumor Localization

We also observed that the group of 91 tumors with eroded telomeres contained 40.7% of cancers located in the right and transverse colon, while the group of 34 tumors with telomeres with maintained length, comprised 32.3% of right-colon and transverse colon cancers. In other words, 37/48 (77.1%) right-colon tumors had eroded telomeres, while 49/70 (70.0%) left-colon tumors had eroded telomeres. Therefore, right-colon cancers had more frequently eroded telomeres than telomeres with maintained length. On the other hand, right-colon and transverse cancers had telomeres with a mean value of 7.1 ± 2.1 Kb (n = 47), not significantly different (p = 0.65) from that in left-colon, sigmoid and rectal cancers (7.3 ± 2.3%, n = 78). Therefore, telomeres were not shorter in right-colon and transverse cancers than in CRCs located at other sites. In addition, right-colon and transverse tumors, on the one hand, as well as left-colon, and sigmoid tumors, on the other hand, had both significantly shorter telomeres than in the healthy surrounding tissue (Table 5). Note that rectal cancers were present at a very low rate in the analyzed cohort. In fact, almost all of the operated patients with rectal cancers did not fulfill one of the required criteria for inclusion into the cohort and were therefore excluded from the analysis (see Materials and Methods). Finally, we observed that telomeres were not shorter in MSI tumors (6.9 ± 1.8 Kb, n = 19) than in MSS tumors (7.3 ± 2.3 Kb, n = 105, the p value of the t-test being >0.05).
The relevant molecular characteristics of the 135 CRCs analyzed in the present study, as well as their telomeric parameters, are shown in Table S2.

3. Discussion

Previously, a number of studies have shown that telomere length was smaller in colorectal tumors than in adjacent healthy tissues [17,18,19,25,26,27,28,29,30,31,32,33,34,35]. The present data agree with these studies, establishing that, among the 125 CRCs in which telomere length was measured by TRF analysis, telomeres were significantly much shorter than in the healthy adjacent mucosa, 7.2 Kb in tumors samples versus 9.7 Kb in adjacent mucosa.
Interestingly, we were able to distinguish two classes of CRCs, one (91/125) exhibiting clear telomere erosion (6.5 Kb in the tumors vs. 10.0 Kb in the normal surrounding tissue), a second one (34/125 CRCs) with telomeres of the same length or slightly longer than those in the healthy tissue (9.2 Kb in the tumors vs. 8.8 Kb in healthy adjacent tissue). Previous studies have shown that only a few percent of tumors elongate their telomeres (5% to 14% depending on the studies) and the vast majority shortened or maintained them [18,19,29,33,36,37,38]. The finding that 5/125 of the CRC tumors analyzed here (4% of the cohort) exhibited telomere elongation is therefore not very different from the lower value found in previous studies. Our percentage of tumors with telomeres exhibiting maintained length may be somewhat smaller than from these previous findings because we regrouped in the same class the tumors that maintain telomere length constant and those that elongate their telomeres compared with the healthy adjacent tissue. The class we defined with eroded telomeres accounted for ~73% of the 125 CRCs analyzed, leaving ~27% of the tumors with unchanged or elongated telomeres.
The reasons for the existence of CRCs with either greatly eroded telomeres or, rather, telomeres maintained at a constant length or even slightly elongated are not known. Recent studies have started to provide an explanation to the presence of persistent telomere erosion in some types of cancer such as CRCs. TRF2 overexpression has been observed in many tumors and might be at the origin of very high genome instability in these cells. By examining the length of individual telomeres in cells overexpressing TRF2, Nera et al. [39] were able to identify a subpopulation of termini that had undergone loss of almost the entire telomeric tract, as a consequence of TRF2 overexpression-induced replication stalling. Moreover, 3D analysis of telomere organization combined with TRF2 immunofluorescence showed that some Hodgkin and Reed-Sternberg cells exhibited massive attrition of telomere sequences together with massive increase of TRF2 not associated with telomeres, while others experienced a massive loss of TRF2 signals physically linked to telomeres [40]. These observations underlie a major role for TRF2 expression in telomere organization in tumor cells and, as a consequence, in the regulation of telomere length and genome stability in these cells.
Although TRF2 plays a major role in genome stability in tumor cells, to our knowledge, TRF2 overexpression has not previously been reported to take place in CRCs. The present results provide an alternative explanation to the phenomenon of dramatic telomere erosion taking place in the great majority of CRCs. Indeed, we have observed here that in patients with tumors exhibiting constant length/slightly elongated telomeres, telomere length in the adjacent normal tissue was significantly smaller than that in the adjacent normal tissue of patients with tumors exhibiting eroded telomeres; therefore, the shorter the telomeres in healthy tissue of a patient, the larger an increase in telomere length in the tumor. Several possibilities arise to explain this observation, among which the most likely is that when healthy cells become tumoral, the efficiency of the mechanisms of telomere maintenance that have been activated concomitant with cell transformation is proportional to telomere length. Indeed, in the newly transformed cell, the intensive cell proliferation needed for tumor progression is going to rapidly erode telomeres. If the newly transformed cell has relatively short telomeres, then cell division-associated telomere erosion is rapidly going to become prejudicial to the cell, leading, as a solution to this problem, to an improvement in the efficiency of the telomere maintenance mechanisms (likely via up-regulation of telomerase in this type of cancer). As a result, telomeres are going to maintain telomere length initially present in the non-tumoral cell, even possibly elongating telomeres. If, on the other hand, the newly transformed cell has relatively long telomeres, telomere maintenance mechanisms are not going to be activated right away, efficient cell division still taking place due to the presence of long telomeres. It is only after telomeres have become critically short that telomerase will be activated. This scenario may well lead to a situation in which telomeres are always critically short, becoming re-elongated from time to time by irregular activation of telomerase.
In the present study, we also found that telomeres were not shorter in right-colon cancers than in tumors located in other sites, contrary to what has been reported previously [29,32]. On the other hand, right-colon cancers were found more frequently in the 91 tumors with eroded telomeres than in the group of 34 tumors with constant length/slightly elongated telomeres, although it should be noted that the numbers do not strikingly differ between the two groups, 40.7% vs. 32.3%, respectively. In addition, we observed that telomeres were not shorter in MSI tumors than in MSS tumors, contrary to what has been reported before [32]. We did not detect a significant difference in telomere length depending on tumor stage, contrary to a previous study reporting that telomere length in cancer tissue was significantly correlated with tumor stage, telomeres being longer in advanced tumors [18,19]. We do not have any explanation for this discrepancy, particularly as these two previous studies also used TRF analysis to assess telomere length [18,19].
Very few data are available concerning telomere characteristics and mutational status in CRC. When comparing the 91 tumors with eroded telomeres with the 34 tumors with maintained telomere length, we could not find statistically significant differences between the two groups concerning the mutational status of BRAF, PIK3CA and the MSS/MSI genes. However, interestingly, our study highlighted a statistically significant relationship between telomere length and KRAS mutation status. Indeed, ~39% of the tumors with eroded telomeres harbored a mutation in KRAS, while ~17% of the tumors with maintained telomere length (p < 0.05) harbored a KRAS mutation. Notably, it has been observed that activation of the Ras/Raf/MEK/Erk pathway upregulated telomerase activity by increasing hTERT transcription [41]. EGFR overexpression also led to telomerase activation by hTERT phosphorylation via the PI3K/AKT pathway [42]. KRAS mutation is a negative predictive biomarker for anti-EGFR therapy (cetuximab and panitumumab) in metastatic CRC [43]. In metastatic CRC with non-mutated KRAS status, a relationship between an elevated telomere length and a good response (inhibition of proliferation) to anti-EGFR has recently been observed, without, however, any relationship between KRAS status and telomere length [44]. It is currently totally unknown why CRCs with eroded telomeres more frequently harbor a mutation in KRAS than CRCs with maintained telomere length.
Our survival graphs suggested that patients with maintained length telomere-tumors survived better than patients with short telomere-tumors, although the difference was not statistically significant when the entire population of analyzed CRCs was taken into account. However, in the 28 metastatic tumors present in the study, telomere erosion was significantly associated with diminished survival. Such an observation is compatible with the hypothesis sometimes put forward that more aggressive tumors exhibit telomeres that are constantly critically short because their rapidly undergoing cell divisions require frequent availability of telomerase activity that cannot be always guaranteed by the cellular machinery. Recently, a distinct class of extremely short telomeres, called t-stumps, was discovered in transformed human cells containing active telomerase [45]. The aggressive metastatic CRC tumors found here to be associated with poor survival and which exhibited dramatic telomere erosion might correspond to the acquisition of these t-stumps. Recently, in glioblastomas, as well as in Hodgkin lymphomas, correlations were established between median survival and nuclear telomere architecture and it was proposed that nuclear telomere architecture might become a prognostic biomarker [46,47]. It would be interesting to know whether the association we observed here between survival and telomere erosion in metastatic CRCs could also be signaled by changes in the 3D nuclear organization of the telomeres.
Finally, we found that measurement, in CRCs, of the total amount of telomeric sequences by the Telo/Alu ratio method was not in all situations in agreement with telomere length measured by TRF analysis. However, globally, we found a good relationship between telomere length and total amount of telomeric sequences, as 67 tumors among the group of the 91 with eroded telomeres also exhibited a total amount of telomeric sequences below the threshold that is considered low (Telo/Alu ratio <80%) compared with total amount in adjacent healthy tissue. On the other hand, only 18 of the 34 tumors with constant length/slightly elongated telomeres, as measured by TRF analysis, also had a Telo/Alu ratio >80%. Therefore, although this assay is easier to perform, it is not advisable to use it in routine as a clinical test, at least for this type of cancer. The reasons for the observed discrepancy between the two methods could be due to the numerous genetic instabilities associated with CRC. Indeed, genomic instabilities can lead to the generation of so-called GCRs (Gross Chromosomal Rearrangements), which are prone, among other unwanted events, to the intervention of telomerase in an attempt to repair the broken chromosome [48]. If this were the case in the CRCs analyzed here, then the total amount of telomeric sequences could become increased, due to the inappropriate intervention of telomerase at endogenous genomic sites, without concomitant lengthening of the telomeres, hence the observed discrepancy, in some cases, between the two methods.

4. Materials and Methods

4.1. Patients and Tissue Collection

This study was approved by the ethics committees of the “Centre Hospitalier Régional Universitaire” (CHRU) of Tours (France). Tumor samples came from a cohort of CRCs collected in the pathology department of the University Hospital of Tours. The collection contains frozen and formalin-fixed, paraffin-embedded tumor material, as well as paired normal tissue; written informed consent was obtained from all patients. According to French laws and recommendations, the collection has been declared to the French Ministry of Scientific Research and is registered under N° DC-2008-308. We constituted an exploratory cohort of 135 selected patients who had undergone surgery for a CRC between January 2007 and May 2008 at the Trousseau hospital of Chambray-lès-Tours. Inclusion criteria were as follows. Patients had to be over 18 years old and have been surgically treated for a CRC. Obtaining individual written consent prior to use of each sample, as recommended by the institutional guidelines, was required. Patients were excluded from the analyzed cohort when there was either absence of healthy tissue adjacent to the resected specimen, absence of data on microsatellite instability or on one of the KRAS, BRAF or PIK3CA status, or when a neo-adjuvant treatment had been previously delivered. For each case studied, the percentage of tumor cells was evaluated by a pathologist on a frozen section of the tumor sample. Only samples containing at least 50% of tumor cells were selected for this study. The presence of normal stromal cells in the tumor sample was not taken into account. Finally, rectal cancers were almost all excluded from the study because most of them did not fulfill the required inclusion criterion of having not been administered a neo-adjuvant treatment.
Two samples of colorectal tissues, tumoral and adjacent non-tumoral, were recovered from patients following surgery, immediately snap-frozen individually and stored confidentially at −80 °C by the tumor bank of Tours CHRU. Normal tissue (mucosal and submucosal tissue) was selected by a pathologist on surgical colorectal resections, at least 5 cm distant from the tumor, and immediately frozen for biobanking. Like for the tumor samples, a microscopic examination of a frozen section was realized for each normal tissue sample. Patient characteristics (age, sex, segmental colonic tumor location, KRAS status, BRAF status, PI3K status, MSI status and histological data) were collected from the records for further analysis. In addition, an anatomopathological study of the tumor samples was conducted in order to provide information concerning tumor differentiation state, vascular invasion and degree of peritumoral lymphocytic infiltration. The classification used in the present clinical study was the TNM (Tumor-Node-Metastasis) classification reactualized in 2010 in the 7th edition of the “Cancer staging manual” edited by the American Joint Committee on Cancer [49].

4.2. Genomic DNA Extraction, Mutational Analysis and MLH1 Promoter Methylation

Genomic DNA was extracted from frozen tissue samples using the QIAamp DNA Mini Kit (Qiagen, Courtaboeuf, France) according to the manufacturer’s instructions. DNA was quantified in a spectrophotometer. The presence of mutations in KRAS exon 2, BRAF exon 15 and in the catalytic subunit of PI3K, PIK3CA, were evaluated by pyrosequencing (Pyromark platform®; Qiagen) following amplification by Polymerase Chain Reaction (PCR). MSI status was determined following PCR amplification from tumoral DNA analyses of six microsatellite markers, NR21, NR24, NR27, BAT25, BAT26 and CAT25. The tumor was considered MSI-High when three or more of these markers showed instability, while MSI-Low was defined as taking place when one or two of the six markers showed instability [50]. Sequencing analyses were performed using the Applied Biosystems® 3130 Genetic Analyzer (Thermo Fisher Scientific, Illkirch, France,). In sporadic (non-familial) CRCs, MMR defect results from the silencing of MLH1 transcription by cytosine methylation. Histological sections of tumors were first processed for immunodetection of MLH1. In tumors with a lack of MLH1 protein, MLH1 promoter methylation status was then measured by real-time PCR following sodium bisulfite conversion of tumor DNA, as previously described [51].

4.3. Telomeric DNA Quantification by Dot Blot for Telomere Length Measurement

This so-called Telo/Alu quantification of total telomeric DNA was performed as described previously [52]. Briefly, 10 ng only of genomic DNA were hybridized, following transfer to a nylon membrane, with a 32P-labeled telomeric repeat (TTAGGG)3 probe, followed by hybridization with an Alu-specific (5′-GTGATCCGCCCGCCTCGGCCTCCCAAAGT-3′) 32P-labeled probe. Results were analyzed using a GE Storm phosphorimager (GE Healthcare Life Sciences, Vélizy, France) and the ImageQuant LAS 4000 software (GE Healthcare Life Sciences, Vélizy, France).

4.4. Telomere Length Measurement by Telomere Restriction Fragment (TRF) Southern Blot Analysis

Measurement of telomere length by TRF analysis [20] was performed as described previously [52]. Briefly, 3–5 μg of tumor genomic DNA were digested with RsaI and HinfI and separated in a 0.9% agarose gel prior to transfer and hybridization with a (TTAGGG)3 32P-labeled telomeric probe. Telomere tracts appear as a broad band or “smear”, which represents the average length of most chromosomes. The smear is very heterogeneous because telomere length not only varies between chromosome ends, but also between cells. Results were analyzed using a GE Storm phosphorimager and the ImageGauge software version 4.0 (Fujifilm, Denver, CO, USA).

4.5. Statistical Analysis

Statistical analyses were performed using standard tests, using the Stata 9.2 software (Stata Corp. LLC, College Station, TX, USA). To compare independent quantitative data, we used the Student’s t-test. To compare independent nominal qualitative data, Chi-square distribution was determined. To report overall survival curves, we used the Kaplan–Meier method, and log-rank test was used to compare them. A Cox proportional-hazard model was used to assess overall survival differences between patients with different telomere lengths. Modeling included the examination of associations between overall survival and clinically relevant variables. A p < 0.05 value was used as the significant threshold. All the data collected were anonymized and stocked in an Excel file.

Supplementary Materials

Supplementary materials can be found at www.mdpi.com/1422-0067/18/9/1871/s1.

Acknowledgments

We thank the “Département Génomique PPF ASB (Programme Pluri-Formation Analyse des Systèmes Biologiques)” facility at University François Rabelais of Tours for access to the Storm phosphorimager. This work was supported by grants from the “LIGUE Grand-Ouest contre le Cancer, comités départementaux d’Eure-et-Loir, Ille-et-Vilaine, Indre, Indre-et-Loire, Morbihan, Vendée, Vienne” (grant #LIGUE-GO-Charbonneau) and the “Fondation de France” (grant #2011-00020358) to Michel Charbonneau.

Author Contributions

Michel Charbonneau, Thierry Lecomte and Nathalie Grandin conceived and designed the experiments. Eric Le Balc’h, Marie-Véronique Demattei, Anne Tallet, Serge Guyétant, Jean-Christophe Pagès and Mehdi Ouaissi performed the experiments. Nathalie Grandin, Michel Charbonneau, Thierry Lecomte, Eric Le Balc’h, Anne Tallet, Serge Guyétant, Jean-Christophe Pagès, Mehdi Ouaissi and Marie-Véronique Demattei analyzed the data. Michel Charbonneau, Nathalie Grandin, Thierry Lecomte and Eric Le Balc’h wrote the manuscript.

Conflicts of Interest

The authors declare no conflict of interest.

References

  1. Sideris, M.; Papagrigoriadis, S. Molecular biomarkers and classification models in the evaluation of the prognosis of colorectal cancer. Anticancer Res. 2014, 34, 2061–2068. [Google Scholar] [PubMed]
  2. Fearon, E.; Vogelstein, B. A genetic model for colorectal tumorigenesis. Cell 1990, 61, 759–767. [Google Scholar] [CrossRef]
  3. Pino, M.S.; Chung, D.C. The chromosomal instability pathway in colon cancer. Gastroenterology 2010, 138, 2059–2072. [Google Scholar] [CrossRef] [PubMed]
  4. Gyparaki, M.T.; Basdra, E.K.; Papavassiliou, A.G. DNA methylation biomarkers as diagnostic and prognostic tools in colorectal cancer. J. Mol. Med. 2013, 91, 1249–1256. [Google Scholar] [CrossRef] [PubMed]
  5. Müller, M.F.; Ibrahim, A.E.K.; Arends, M.J. Molecular pathological classification of colorectal cancer. Virchows Arch. 2016, 469, 125–134. [Google Scholar] [CrossRef] [PubMed]
  6. Church, D.; Midgley, R.; Kerr, D. Biomarkers in early-stage colorectal cancer: Ready for prime time? Dig. Dis. 2012, 30, 27–33. [Google Scholar] [CrossRef] [PubMed]
  7. Palm, W.; de Lange, T. How shelterin protects mammalian telomeres. Annu. Rev. Genet. 2008, 42, 301–334. [Google Scholar] [CrossRef] [PubMed]
  8. De Lange, T. How telomeres solve the end-protection problem. Science 2009, 326, 948–952. [Google Scholar] [CrossRef] [PubMed]
  9. Armanios, M.; Blackburn, E.H. The telomere syndromes. Nat. Rev. Genet. 2012, 13, 693–704. [Google Scholar] [CrossRef] [PubMed]
  10. Feuerhahn, S.; Chen, L.; Luke, B.; Porro, A. No DDRama at chromosome ends: TRF2 takes centre stage. Trends Biochem. Sci. 2015, 40, 275–285. [Google Scholar] [CrossRef] [PubMed]
  11. Armstrong, C.A.; Tomita, K. Fundamental mechanisms of telomerase action in yeasts and mammals: Understanding telomeres and telomerase in cancer cells. Open Biol. 2017, 7, 160338. [Google Scholar] [CrossRef] [PubMed]
  12. Ye, J.; Renault, V.M.; Jamet, K.; Gilson, E. Transcriptional outcome of telomere signalling. Nat. Rev. Genet. 2014, 15, 491–503. [Google Scholar] [CrossRef] [PubMed]
  13. Artandi, S.E.; DePinho, R.A. Telomeres and telomerase in cancer. Carcinogenesis 2010, 31, 9–18. [Google Scholar] [CrossRef] [PubMed]
  14. Nandakumar, J.; Cech, T.R. Finding the end: Recruitment of telomerase to telomeres. Nat. Rev. Mol. Cell. Biol. 2013, 14, 69–82. [Google Scholar] [CrossRef] [PubMed]
  15. Durant, S.T. Telomerase-independent paths to immortality in predictable cancer sub-types. J. Cancer 2012, 3, 67–82. [Google Scholar] [CrossRef] [PubMed]
  16. Pickett, H.A.; Reddel, R.R. Molecular mechanisms of activity and derepression of alternative lengthening of telomeres. Nat. Struct. Mol. Biol. 2015, 22, 875–880. [Google Scholar] [CrossRef] [PubMed]
  17. Hastie, N.D.; Dempster, M.; Dunlop, M.G.; Thompson, A.M.; Green, D.K.; Allshire, R.C. Telomere reduction in human colorectal carcinoma and with ageing. Nature 1990, 346, 866–868. [Google Scholar] [CrossRef] [PubMed]
  18. Engelhardt, M.; Drullinsky, P.; Guillem, J.; Moore, M.A. Telomerase and telomere length in the development and progression of premalignant lesions to colorectal cancer. Clin. Cancer Res. 1997, 3, 1931–1941. [Google Scholar] [PubMed]
  19. Gertler, R.; Rosenberg, R.; Stricker, D.; Friederichs, J.; Hoos, A.; Werner, M.; Ulm, K.; Holzmann, B.; Nekarda, H.; Siewert, J.-R. Telomere length and human telomerase reverse transcriptase expression as markers for progression and prognosis of colorectal carcinoma. J. Clin. Oncol. 2004, 22, 1807–1814. [Google Scholar] [CrossRef] [PubMed]
  20. Broccoli, D.; Godley, L.A.; Donehower, L.A.; Varmus, H.E.; de Lange, T. Telomerase activation in mouse mammary tumours: Lack of telomere shortening and evidence for regulation of telomerase with RNA cell proliferation. Mol. Cell. Biol. 1996, 16, 3765–3772. [Google Scholar] [CrossRef] [PubMed]
  21. Aubert, G.; Hills, M.; Lansdorp, P.M. Telomere length measurement—Caveats and a critical assessment of the available technologies and tools. Mut. Res. 2012, 730, 59–67. [Google Scholar] [CrossRef] [PubMed]
  22. Chuang, T.C.Y.; Moshir, S.; Garini, Y.; Chuang, A.Y.; Young, I.T.; Vermolen, B.; van den Doel, R.; Mougey, V.; Perrin, M.; Braun, M.; et al. The three-dimensional organization of telomeres in the nucleus of mammalian cells. BMC Biol. 2004, 2, 12. [Google Scholar] [CrossRef] [PubMed] [Green Version]
  23. Vermolen, B.J.; Garini, Y.; Mai, S.; Mougey, V.; Fest, T.; Chuang, T.C.Y.; Chuang, A.Y.C.; Wark, L.; Young, I.T. Characterizing the three-dimensional organization of telomeres. Cytom. Part A 2005, 67, 144–150. [Google Scholar] [CrossRef] [PubMed]
  24. Gadji, M.; Vallente, R.; Klewes, L.; Righolt, C.; Wark, L.; Kongruttanachok, N.; Knecht, H.; Mai, S. Nuclear remodeling as a mechanism for genomic instability in cancer. Adv. Cancer Res. 2011, 112, 77–126. [Google Scholar] [PubMed]
  25. Katayama, S.; Shiota, G.; Oshimura, M.; Kawasaki, H. Clinical usefulness of telomerase activity and telomere length in the preoperative diagnosis of gastric and colorectal cancer. J. Cancer Res. Clin. Oncol. 1999, 125, 405–410. [Google Scholar] [CrossRef] [PubMed]
  26. Takagi, S.; Kinouchi, Y.; Hiwatashi, N.; Chida, M.; Nagashima, F.; Takahashi, S.; Negoro, K.; Shimosegawa, T.; Toyota, T. Telomere shortening and the clinicopathologic characteristics of human colorectal carcinomas. Cancer 1999, 86, 1431–1436. [Google Scholar] [CrossRef]
  27. Nakamura, K.; Furugori, E.; Esaki, Y.; Arai, T.; Sawabe, M.; Okayasu, I.; Fujiwara, M.; Kammori, M.; Mafune, K.; Kato, M.; et al. Correlation of telomere lengths in normal and cancers tissue in the large bowel. Cancer Lett. 2000, 158, 179–184. [Google Scholar] [CrossRef]
  28. Plentz, R.R.; Wiemann, S.U.; Flemming, P.; Meier, P.N.; Kubicka, S.; Kreipe, H.; Manns, M.P.; Rudolph, K.L. Telomere shortening of epithelial cells characterises the adenoma-carcinoma transition of human colorectal cancer. Gut 2003, 52, 1304–1307. [Google Scholar] [CrossRef] [PubMed]
  29. Garcia-Aranda, C.; de Juan, C.; Diaz-Lopez, A.; Sanchez-Pernaute, A.; Torres, A.; Diaz-Rubio, E.; Balibrea, J.L.; Benito, M.; Iniesta, P. Correlations of telomere length, telomerase activity and telomeric-repeat binding factor 1 expression in colorectal carcinoma. Cancer 2006, 106, 541–551. [Google Scholar] [CrossRef] [PubMed]
  30. O’Sullivan, J.; Risques, R.A.; Mandelson, M.T.; Chen, L.; Brentnall, T.A.; Bronner, M.P.; Macmillan, M.P.; Feng, Z.; Siebert, J.R.; Potter, J.D.; et al. Telomere length in the colon declines with age: A relation to colorectal cancer? Cancer Epidemiol. Biomark. Prev. 2006, 15, 573–577. [Google Scholar] [CrossRef] [PubMed]
  31. Raynaud, C.M.; Jang, S.J.; Nuciforo, P.; Lantuejoul, S.; Brambilla, E.; Mounier, N.; Olaussen, K.A.; André, F.; Morat, L.; Sabatier, L.; et al. Telomere shortening is correlated with the DNA damage response and telomeric protein down-regulation in colorectal preneoplastic lesions. Ann. Oncol. 2008, 19, 1875–1881. [Google Scholar] [CrossRef] [PubMed]
  32. Rampazzo, E.; Bertorelle, R.; Serra, L.; Terrin, L.; Candiotto, C.; Pucciarelli, S.; Del Bianco, P.; Nitti, D.; De Rossi, A. Relationship between telomere shortening, genetic instability, and site of tumour origin in colorectal cancers. Br. J. Cancer 2010, 102, 1300–1305. [Google Scholar] [CrossRef] [PubMed]
  33. Valls, C.; Piñol, C.; Reñé, J.M.; Buenestado, J.; Viñas, J. Telomere length is a prognostic factor for overall survival in colorectal cancer. Colorectal Dis. 2011, 13, 1265–1272. [Google Scholar] [CrossRef] [PubMed]
  34. Roger, L.; Jones, R.E.; Heppel, N.H.; Williams, G.T.; Sampson, J.R.; Baird, D.M. Extensive telomere erosion in the initiation of colorectal adenomas and its association with chromosomal instability. J. Natl. Cancer Inst. 2013, 105, 1202–1211. [Google Scholar] [CrossRef] [PubMed]
  35. Bertorelle, R.; Rampazzo, E.; Pucciarelli, S.; Nitti, D.; De Rossi, A. Telomeres, telomerase and colorectal cancer. World J. Gastroenterol. 2014, 20, 1940–1950. [Google Scholar] [CrossRef] [PubMed]
  36. Takagi, S.; Kinouchi, Y.; Hiwatashi, N.; Nagashima, F.; Chida, M.; Takahashi, S.; Negoro, K.; Shimosegawa, T.; Toyota, T. Relationship between microsatellite instability and telomere shortening in colorectal cancer. Dis. Colon Rectum 2000, 43, S12–S17. [Google Scholar] [CrossRef] [PubMed]
  37. Kim, H.R.; Kim, Y.J.; Kim, H.J.; Kim, S.K.; Lee, J.H. Telomere length changes in colorectal cancers and polyps. J. Korean Med. Sci. 2002, 17, 360–365. [Google Scholar] [CrossRef] [PubMed]
  38. Piñol-Felis, C.; Fernández-Marcelo, T.; Viñas-Salas, J.; Valls-Bautista, C. Telomeres and telomerase in the clinical management of colorectal cancer. Clin. Transl. Oncol. 2017, 19, 399–408. [Google Scholar] [CrossRef] [PubMed]
  39. Nera, B.; Huang, H.; Lai, T.; Xu, L. Elevated levels of TRF2 induce telomeric ultrafine anaphase bridges and rapid telomere deletions. Nat. Commun. 2015, 6, 10132. [Google Scholar] [CrossRef] [PubMed]
  40. Knecht, H.; Johnson, N.A.; Haliotis, T.; Lichtensztejn, D.; Mai, S. Disruption of direct 3D telomere-TRF2 interaction through two molecularly disparate mechanisms is a hallmark of primary Hodgkin and Reed-Sternberg cells. Lab. Investig. 2017, 97, 772–781. [Google Scholar] [CrossRef] [PubMed]
  41. Maida, Y.; Kyo, S.; Kanaya, T.; Wang, Z.; Yatabe, N.; Tanaka, M.; Nakamura, M.; Ohmichi, M.; Gotoh, N.; Murakami, S.; et al. Direct activation of telomerase by EGF through Ets-mediated transactivation of TERT via MAP kinase signaling pathway. Oncogene 2002, 21, 4071–4079. [Google Scholar] [CrossRef] [PubMed]
  42. Heeg, S.; Hirt, N.; Queisser, A.; Schmieg, H.; Thaler, M.; Kunert, H.; Quante, M.; Goessel, G.; von Werder, A.; Harder, J.; et al. EGFR overexpression induces activation of telomerase via PI3K/AKT-mediated phosphorylation and transcriptional regulation through Hif1-α in a cellular model of oral-esophageal carcinogenesis. Cancer Sci. 2011, 102, 351–360. [Google Scholar] [CrossRef] [PubMed]
  43. Lièvre, A.; Bachet, J.B.; Le Corre, D.; Boige, V.; Landi, B.; Emile, J.F.; Côté, J.F.; Tomasic, G.; Penna, C.; Ducreux, M.; et al. KRAS mutation status is predictive of response to cetuximab therapy in colorectal cancer. Cancer Res. 2006, 66, 3992–3995. [Google Scholar] [CrossRef] [PubMed]
  44. Augustine, T.A.; Baig, M.; Sood, A.; Budagov, T.; Atzmon, G.; Mariadason, J.M.; Aparo, S.; Maitra, R.; Goel, S. Telomere length is a novel predictive biomarker of sensitivity to anti-EGFR therapy in metastatic colorectal cancer. Br. J. Cancer 2015, 112, 313–318. [Google Scholar] [CrossRef] [PubMed]
  45. Xu, L.; Blackburn, E.H. Human cancer cells harbor t-stumps, a distinct class of extremely short telomeres. Mol. Cell 2007, 28, 315–327. [Google Scholar] [CrossRef] [PubMed]
  46. Gadji, M.; Fortin, D.; Tsanaclis, A.M.; Garini, Y.; Katzir, N.; Wienburg, Y.; Yan, J.; Klewes, L.; Klonisch, T.; Drouin, R.; et al. Three-dimensional nuclear telomere architecture is associated with differential time to progression and overall survival in glioblastoma patients. Neoplasia 2010, 12, 183–191. [Google Scholar] [CrossRef] [PubMed]
  47. Knecht, H.; Kongruttanachok, N.; Sawan, B.; Brossard, J.; Prévost, S.; Turcotte, E.; Lichtensztejn, Z.; Lichtensztejn, D.; Mai, S. Three-dimensional telomere signatures of Hodgkin- and Reed-Sternberg cells at diagnosis identify Patients with poor response to conventional chemotherapy. Transl. Oncol. 2012, 5, 269–277. [Google Scholar] [CrossRef] [PubMed]
  48. Putnam, C.D.; Srivatsan, A.; Nene, R.; Martinez, S.L.; Clotfelter, S.P.; Bell, S.N.; Somach, S.B.; de Souza, J.E.; Fonseca, A.F.; de Souza, S.J.; et al. A genetic network that suppresses genome rearrangements in Saccharomyces cerevisiae and contains defects in cancers. Nat. Commun. 2016, 7, 11256. [Google Scholar] [CrossRef] [PubMed]
  49. Edge, S.B.; Compton, C.C. The American Joint Committee on Cancer: The 7th edition of the AJCC cancer staging manual and the future of TNM. Ann. Surg. Oncol. 2010, 17, 1471–1474. [Google Scholar] [CrossRef] [PubMed]
  50. Umar, A.; Boland, C.R.; Terdiman, J.P.; Syngal, S.; de la Chapelle, A.; Rüschoff, J.; Fishel, R.; Lindor, N.M.; Burgart, L.J.; Hamelin, R.; et al. Revised Bethesda Guidelines for hereditary nonpolyposis colorectal cancer (Lynch syndrome) and microsatellite instability. J. Natl. Cancer Inst. 2004, 96, 261–268. [Google Scholar] [CrossRef] [PubMed]
  51. Truninger, K.; Menigatti, M.; Luz, J.; Russell, A.; Haider, R.; Gebbers, J.O.; Bannwart, F.; Yurtsever, H.; Neuweiler, J.; Riehle, H.M.; et al. Immunohistochemical analysis reveals high frequency of PMS2 defects in colorectal cancer. Gastroenterology 2005, 128, 1160–1171. [Google Scholar] [CrossRef] [PubMed]
  52. Fogli, A.; Demattei, M.V.; Corset, L.; Vaurs-Barrière, C.; Chautard, E.; Biau, J.; Kémény, J.L.; Godfraind, C.; Pereira, B.; Khalil, T.; et al. Detection of the alternative lengthening of telomeres pathway in malignant gliomas for improved molecular diagnosis. J. Neurooncol. 2017. [Google Scholar] [CrossRef] [PubMed]
Figure 1. (A) Representative Southern blots of measurements of telomere length in DNA extracted from tumors (right lanes of each patient for which patient ID (identification) number is the same as that shown in Tables S1 and S2), together with DNA extracted from adjacent healthy tissue (left lanes) using TRF analysis (3–5 μg per sample) and a 32P-labeled (TTAGGG)3 telomeric probe. The center of the smear of labeled telomeric sequences was used to assess a telomeric mean value in kilobases (Kb) of DNA. Note that the length of the smear is also important because it reflects the degree of scattering of all telomere lengths around the mean value of the whole cell population. Horizontal full lines within the figure indicate the upper and lower limits of these smears. Telomere length in U2OS, an osteosarcoma-derived cell line, was measured under identical conditions. In both (A) and (B) panels “cont.” means “control”; (B) quantification of total telomeric DNA content in patient tumors (and their control adjacent healthy tissue) by dot blot analysis using the so-called Telo/Alu method. The indicated tumor and control DNAs (10 ng per sample) were hybridized to a 32P-labeled (TTAGGG)3 telomeric probe (top panel), then to a 32P-labeled Alu probe (bottom panel) that was used to normalize the telomeric signal to the total amount of genomic DNA. Telo/Alu ratio was also measured for HeLa cells (which are telomerase positive), as well as for U2OS, a prototype of ALT positive cells. ALT cells have much longer telomeres than telomerase positive cells, hence the stronger Telo signal in the former, serving as a positive control. All 125 samples were processed similarly, but only some of them are illustrated here.
Ijms 18 01871 g001
Figure 2. Comparisons between the two methods used in the present study to evaluate telomere length. Top panels illustrate telomere length measurement by TRF analysis (as explained in the legend to Figure 1), while middle panels illustrate, in the same tumors, the quantification of the total amount of telomeric sequences by the Telo/Alu method (as described above in the legend to Figure 1); “patient ID” is as defined in the legend to Figure 1). All four bottom panels show the indicated parameters associated with each tumor DNA and its control (“cont.”).
Ijms 18 01871 g002
Figure 3. Comparisons between telomere length pattern in a tumor (right lane for each patient) and in its surrounding healthy tissue (“cont.” stands for control, left lane for each patient; “patient ID” is as defined in the legend to Figure 1.) concerning two patients exhibiting tumors with elongated telomeres. Arrows indicate the position of the mean value of telomere length for each sample.
Ijms 18 01871 g003
Figure 4. Evolution with time (in months) of overall survival (expressed as the probability of survival) comparing the two classes of CRCs arbitrarily defined based on their telomere length (with the long telomere-tumor cohort in red, and the short telomere-tumor cohort in blue): in the entire population of analyzed CRCs (A); that of localized CRCs (B) and that of metastatic CRCs (C). Note that the term “long telomere-tumors” was used here for simplicity, but that, in fact, it refers to “same size as controls or slightly elongated telomere-tumors”.
Ijms 18 01871 g004
Table 1. Distribution of tumor localization according to tumor stage in the 125 tumors in which telomere length was measured.
StageRight and Transverse ColonLeft and Sigmoid ColonRectumTotal
Stage I2 (1.6%)6 (4.8%)3 (2.4%)11 (8.8%)
Stage II15 (12.0%)28 (22.4%)1 (0.8%)44 (35.2%)
Stage III18 (14.4%)23 (18.4%)1 (0.8%)42 (33.6%)
Stage IV15 (12.0%)13 (10.4%)0 (0%)28 (22.4%)
Total50 (40.0%)70 (56.0%)5 (4.0%)125 (100%)
Table 2. Distribution of mutations in KRAS (Kirsten rat sarcoma viral oncogene homolog), BRAF (V-raf murine sarcoma viral oncogene homolog B) and PIK3CA (phosphatidylinositol 3-kinase catalytic subunit), and occurrence of microsatellite instability (MSI), as a function of tumor stage in the 125 tumors in which telomere length was measured.
Gene MutationsStage IStage IIStage IIIStage IVTotal
KRAS mutated212151342 (33.6%)
BRAF mutated088117 (13.6%)
PIK3CA mutated043613 (10.4%)
MSI a097319 (15.2%)
a: Among the 19 tumors with MSI, one only (of stage IV) exhibited MSI-Low status, the other 18 tumors being MSI-High.
Table 3. Comparison of telomere length in tumor and healthy adjacent tissue in the different CRC (colorectal cancer) stages.
ParametersStage IStage IIStage IIIStage IV
Number of cases11444228
Telomere length in tumor tissue6.8 Kb7.6 Kb7.2 Kb6.8 Kb
Telomere length in adjacent healthy tissue10.0 Kb9.7 Kb10.3 Kb8.6 Kb
Significancep = 0.01p < 0.0001p < 0.0001p < 0.001
Table 4. p Values of Student t-test a comparing telomere lengths (in kilobases) in the 34 tumors-group and the 91 tumors-group and in their respective adjacent healthy tissues.
Tumor and Control Classes91 Control (Average, n = 91) 10.0 ± 2.891 Tumor Group b (Average, n = 91) 6.5 ± 1.734 Control (Average, n = 34) 8.8 ± 2.434 Tumor Group c (Average, n = 34) 9.2 ± 2.2125 Control (Average, n = 125) 9.7 ± 2.7Tumor (Average, n = 125) 7.2 ± 2.2
Control (n = 91) <0.00010.021 0.391
Tumor (n = 91)<0.0001 <0.0001 0.008
Control (n = 34)0.021 0.500.075
Tumor (n = 34) <0.00010.50 3.947
Control (n = 125) <0.0001
Tumor (n = 125) <0.0001
a: p values of Student t-test were performed in Microsoft Excel and were considered as statistically significant when <0.05; b: The 91 tumor group contained the 91 tumors in which telomere length was found, by TRF analysis, to be smaller than in healthy adjacent tissue; c: The 34 tumor group contained the 34 tumors in which telomeres were measured, by TRF analysis, to be either of the same length or larger than in the healthy adjacent tissue.
Table 5. Telomere length according to tumor localization and associated p values of t-test a.
ParametersRight and Transverse ColonLeft and Sigmoid ColonRectum
Number of cases50705
Telomere length in tumor tissue7.0 Kb7.3 Kb7.1 Kb
Telomere length in adjacent healthy tissue9.9 Kb9.5 Kb10.5 Kb
Significancep < 0.0001p < 0.0001p = 0.07 b
a: p values of Student t-test were performed in Microsoft Excel and were considered as statistically significant when <0.05; b: Not statistically significant.

