Article

The Emerging Role of Zfp217 in Adipogenesis

1
Key Laboratory of Swine Genetics and Breeding of Agricultural Ministry, College of Animal Science and Technology, Huazhong Agricultural University, Wuhan 430070, China
2
The Cooperative Innovation Center for Sustainable Pig Production, Wuhan 430070, China
3
Hebei Key Laboratory of Veterinary Preventive Medicine, College of Animal Science and Technology, Hebei Normal University of Science and Technology, Qinhuangdao 066004, China
*
Author to whom correspondence should be addressed.
Int. J. Mol. Sci. 2017, 18(7), 1367; https://doi.org/10.3390/ijms18071367
Submission received: 18 May 2017 / Revised: 12 June 2017 / Accepted: 21 June 2017 / Published: 27 June 2017
(This article belongs to the Section Biochemistry)

Abstract

:
Zinc finger protein 217 (Zfp217), a member of the krüppel-type zinc finger protein family, plays diverse roles in cell differentiation and development of mammals. Despite extensive research on the functions of Zfp217 in cancer, pluripotency and reprogramming, its physiological roles in adipogenesis remain unknown. Our previous RNA sequencing data suggest the involvement of Zfp217 in adipogenesis. In this study, the potential function of Zfp217 in adipogenesis was investigated through bioinformatics analysis and a series of experiments. The expression of Zfp217 was found to be gradually upregulated during the adipogenic differentiation in C3H10T1/2 cells, which was consistent with that of the adipogenic marker gene Pparg2. Furthermore, there was a positive, significant relationship between Zfp217 expression and adipocyte differentiation. It was also observed that Zfp217 could not only trigger proliferative defect in C3H10T1/2 cells, but also interact with Ezh2 and suppress the downstream target genes of Ezh2. Besides, three microRNAs (miR-503-5p, miR-135a-5p and miR-19a-3p) which target Zfp217 were found to suppress the process of adipogenesis. This is the first report showing that Zfp217 has the capacity to regulate adipogenesis.

Graphical Abstract

1. Introduction

Obesity, a major global public health problem, is a complex disease that involves interactions between environmental and genetic factors [1]. The number of obesity patients keeps increasing year by year [statistical data by World Health Organization (WHO) official website], and related research has also experienced an explosive growth since 2011 (Figure S1). Hence, it will be of great importance to further study the adipocytic gene and explore the mechanism of obesity for therapeutic strategies.
Excess body adiposity is largely attributable to adipocyte hypertrophy and hyperplasia [2]. The hyperplasia is the result of excessive stem cells or preadipocytes differentiating into mature adipocytes (a process called adipogenesis). Adipogenesis is a complicated process that usually consists of six stages: mesenchymal precursor, committed preadipocyte, growth-arrested preadipocyte, mitotic clonal expansion, terminal differentiation, and mature adipocyte [2]. The adipogenic event involves a cascade of transcription factors and signaling pathways, with peroxisome proliferator-activated receptor g (Pparg) and CCAAT/enhancer-binding proteins (Cebps) considered as the crucial determinants of adipogenic fate [3].
In the past decades, despite reports about many important signaling pathways and certain essential transcriptional factors involved in adipogenesis, many adipogenic factors still remain to be excavated. Recent studies have revealed that a small but increasing number of zinc finger proteins could act as key transcriptional regulators in adipogenesis [4]. The zinc finger protein family is extremely abundant in higher eukaryotes and can function as sequence-specific DNA-binding factors in a variety of life processes. Previous studies discovered that Shn-2, ZNF395, Zfp423, Zfp467, Zfp36L1, BCL6 and Zfp521 have a pivotal role in adipogenic commitment [4,5,6]. ZNF638, SLUG, Egr2, FBI-1, MCP-1, Hzf, MORC2, A20, Repin1, Zfp407, BCL11B and YY1 are positive regulators of preadipocyte differentiation [4,7,8,9,10,11,12,13,14], while GATA2, GATA3, Egr1, Snail and PLZF are reported as negative regulators of the transition from preadipocyte to adipocyte [4,15]. In addition, the majority of the zinc-finger protein family members of Krüpple-like factors are reported to promote or suppress preadipocyte differentiation [4,16]. In our previous work, differentially expressed genes (DEGs) were identified by RNA sequencing during the in vitro adipocytic differentiation of porcine subcutaneous stromal vascular cells (ASVC) on Days 0, 2 and 4, and Zfp217 was found significantly upregulated at Day 2 during the adipogenesis [17]. It suggested that Zfp217 was probably implicated in regulating cell adipogenic event.
Previous reports have suggested that Zfp217 is the locus-amplification of chromosome 20q13.2 and is involved in multiple malignant tumors [18,19,20,21,22,23]. Besides, Zfp217 has a pivotal role in the regulation of epithelial-to-mesenchymal transition (EMT), reprogramming, immortalization as well [24,25,26]. With the accumulation of research findings, Zfp217 has been indicated as a key biomarker and regulator of carcinogenesis associated with poor prognosis [22,27,28]. Coincidentally, a number of zinc finger protein genes have clearly bilateral function in cancer and adipogenesis, such as ZNF395, Zfp423, Zfp521, SLUG, Egr2, FBI-1, MCP-1, YY1, and so on. [4,6,29,30,31,32,33,34,35,36,37]. However, this remains unknown for cases related to adipogenesis function, or the mechanism of Zfp217. Therefore, to further explore the adipocytic function of Zfp217, we examined expression profiling through high throughput sequencing or arrays in the Gene Expression Omnibus (GEO) datasets database. Additionally, the results from the bioinformatics analysis were tested by a series of experiments. This work shows that Zfp217 plays a positive role in adipogenesis.

2. Results

2.1. The Potential Adipogenesis Role of Zfp217 Based on Gene Expression Omnibus (GEO) Datasets

To investigate the potential roles of Zfp217 in adipogenesis and obesity, we scanned differential expression genes associated with adipogenesis in GEO datasets, and found that the expression of Zfp217 was highly correlated with marker genes during the adipogenesis process of model cells (Figure 1A–C). As shown in Figure 1A, the expression of Zfp217 and Pparg was nearly consistent after adipogenic induction. Generally, obesity triggers multiple metabolic syndromes and is considered the most important predictor of diabetes mellitus. Obesity individuals show higher free fatty acid levels which stimulate insulin resistance, and then develop into diabetes mellitus [38]. Here, the expression of Zfp217 fluctuated with that of Pparg in three kinds of individuals classified as having diabetes mellitus (DM), impaired glucose tolerance (IGT), and normal glucose tolerance (NGT) (Figure 1D), and this implied that the potential effect of Zfp217 on obesity may be connected with Pparg. In addition, it found that Zfp217 and Pparg showed a similar trend in Ezh2 flox/flox preadipocytes when infected with retroviruses expressing Cre or vector alone (Figure 1E). The Wnt signaling genes are also changed with Ezh2 as in previous research (Figure 1E).

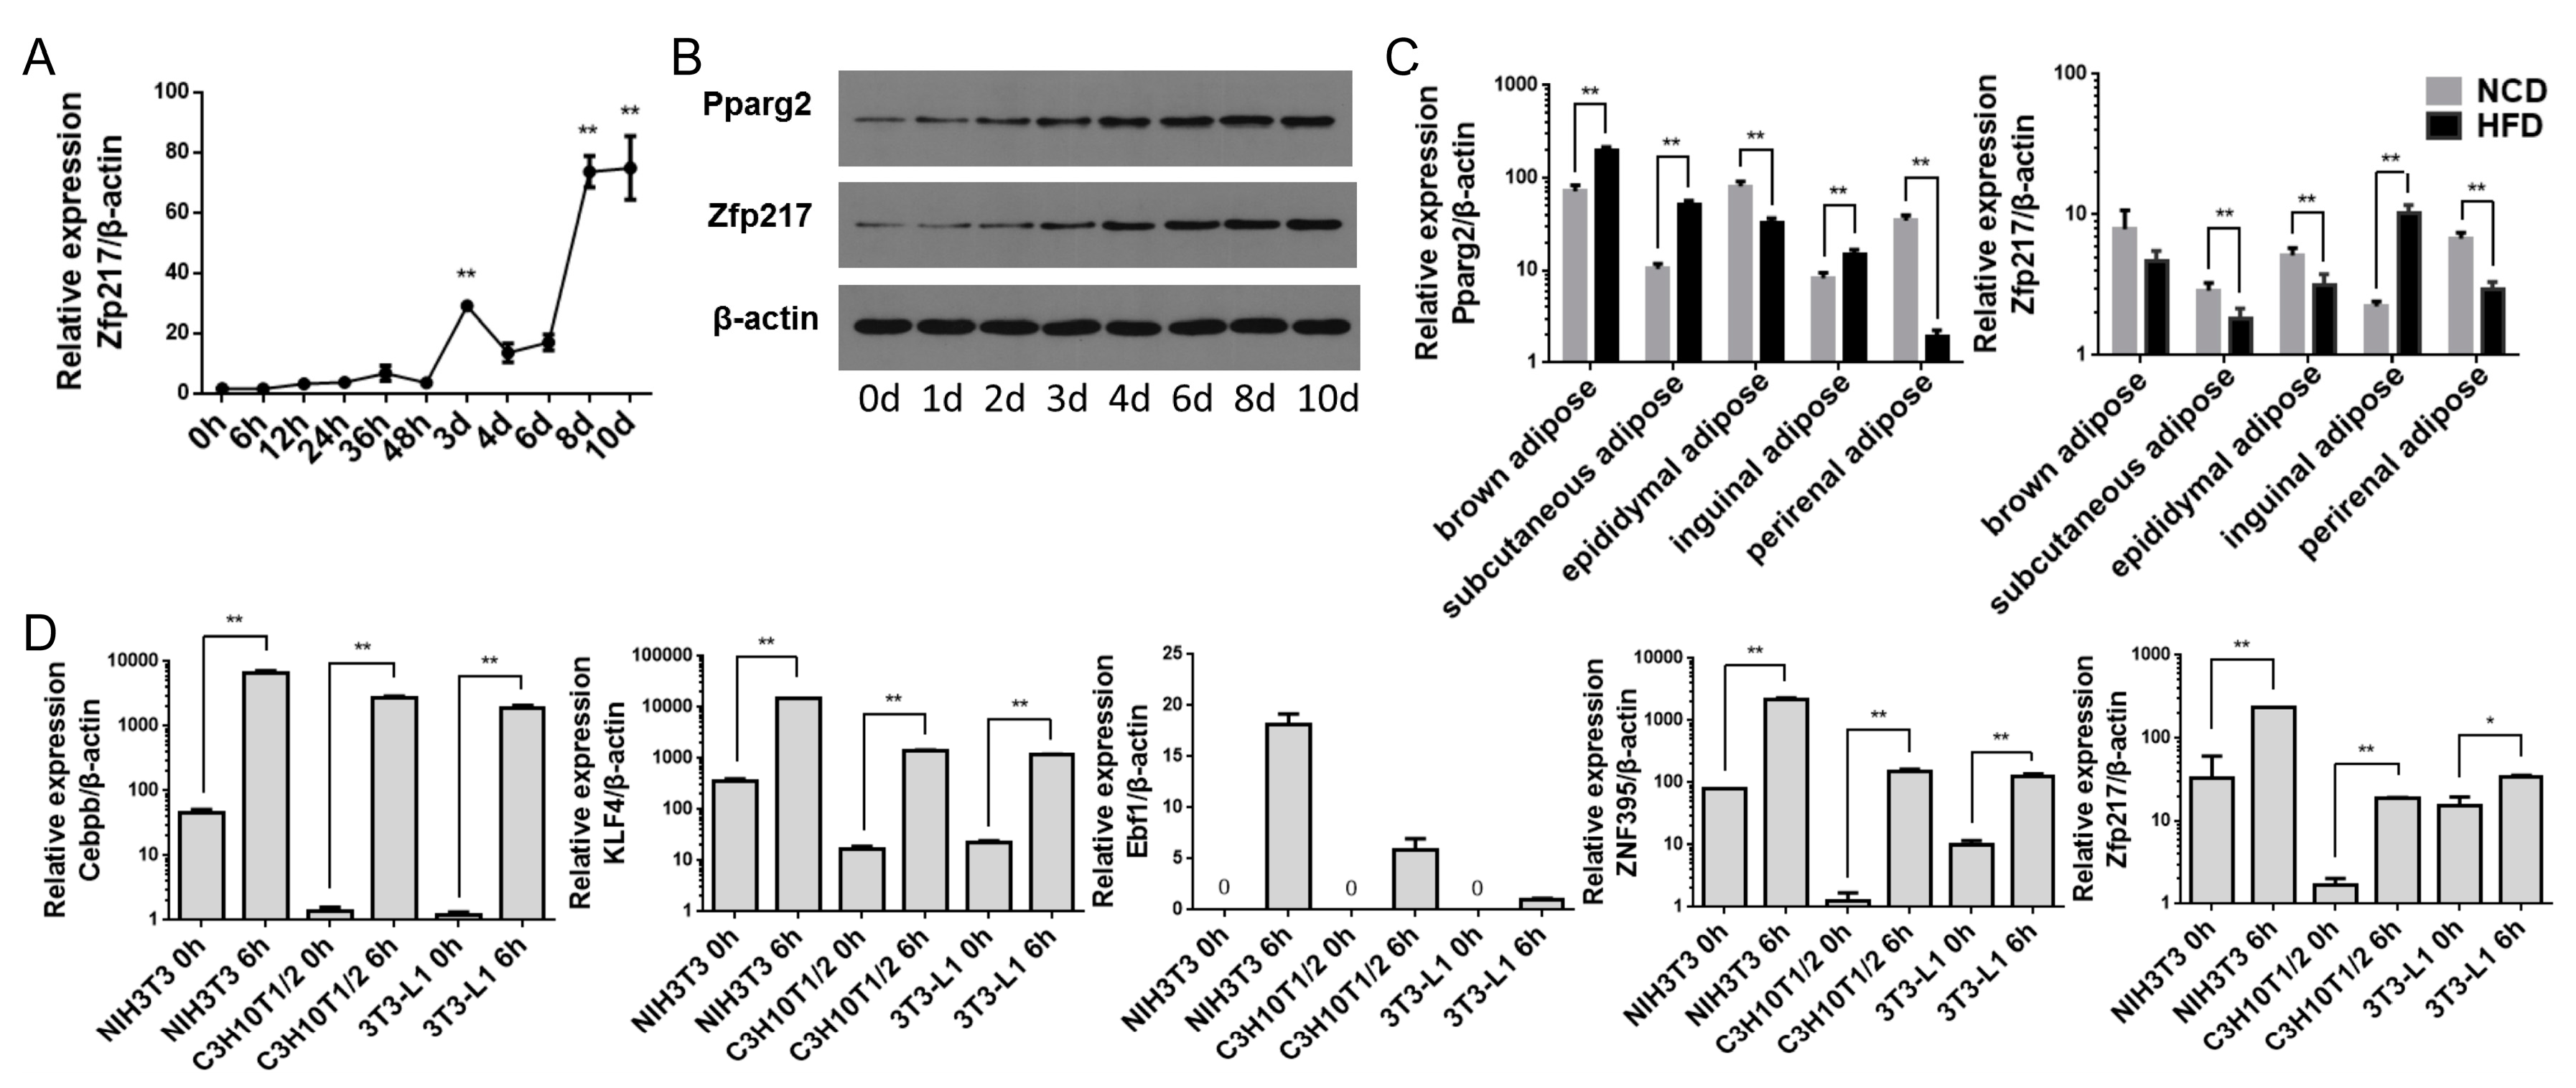
2.2. The Association of Zfp217 Expression with Adipogenesis and Obesity

In order to explore the relationship between Zfp217 expression and adipogenesis, we investigated the expression of Zfp217 in non-differentiated C3H10T1/2 cells and during their differentiation into adipocytes. During adipogenesis, the mRNA level of Zfp217 increased steadily, with an obvious peak at Day 3 (by 17-fold compared to 0 h; p < 0.01), followed by a decrease at Day 4, and then a significant increase during differentiation up to Day 8 and Day 10 (both by 43-fold compared to 0 h and p < 0.01) (Figure 2A). At the protein level, the expression of Zfp217 was highly correlated with the extension of the induction time, and the protein expression pattern was similar to that of the adipogenic marker gene Pparg2 (Figure 2B).
Furthermore, we separated five kinds of adipose tissues from high fat diet (HFD) and normal chow diet (NCD) fed mice based on Zfp217’s potential role in obesity, and tested the mRNA level of Zfp217 and Pparg2. When compared with the NCD group, the mRNA level of Zfp217 and Pparg2 for the HFD group showed a similar trend in the visceral adipose tissues (which included epididymal, inguinal and perirenal adipose) (Figure 2C), but presented a reverse trend in the brown adipose and subcutaneous adipose (Figure 2C).
Meanwhile, in order to investigate the expression of Zfp217 in cell models with different adipogenic ability, and the variation of Zfp217 expression during the early stage of adipogenic induction, we examined the Zfp217 expression levels in NIH3T3, C3H10T1/2 and 3T3-L1 at non-differentiation and 6 h after differentiation. Notably, the mRNA level of Zfp217 was increased in all three cells at 6 h after differentiation (Figure 2D). We also investigated the mRNA level of early pro-adipogenic marker genes. Interestingly, both the expression patterns of Zfp217 in the three cell models and at 6 h post-differentiation are similar to those of early pro-adipogenic marker genes (Cebpb, KLF4, Ebf1 and ZNF395).

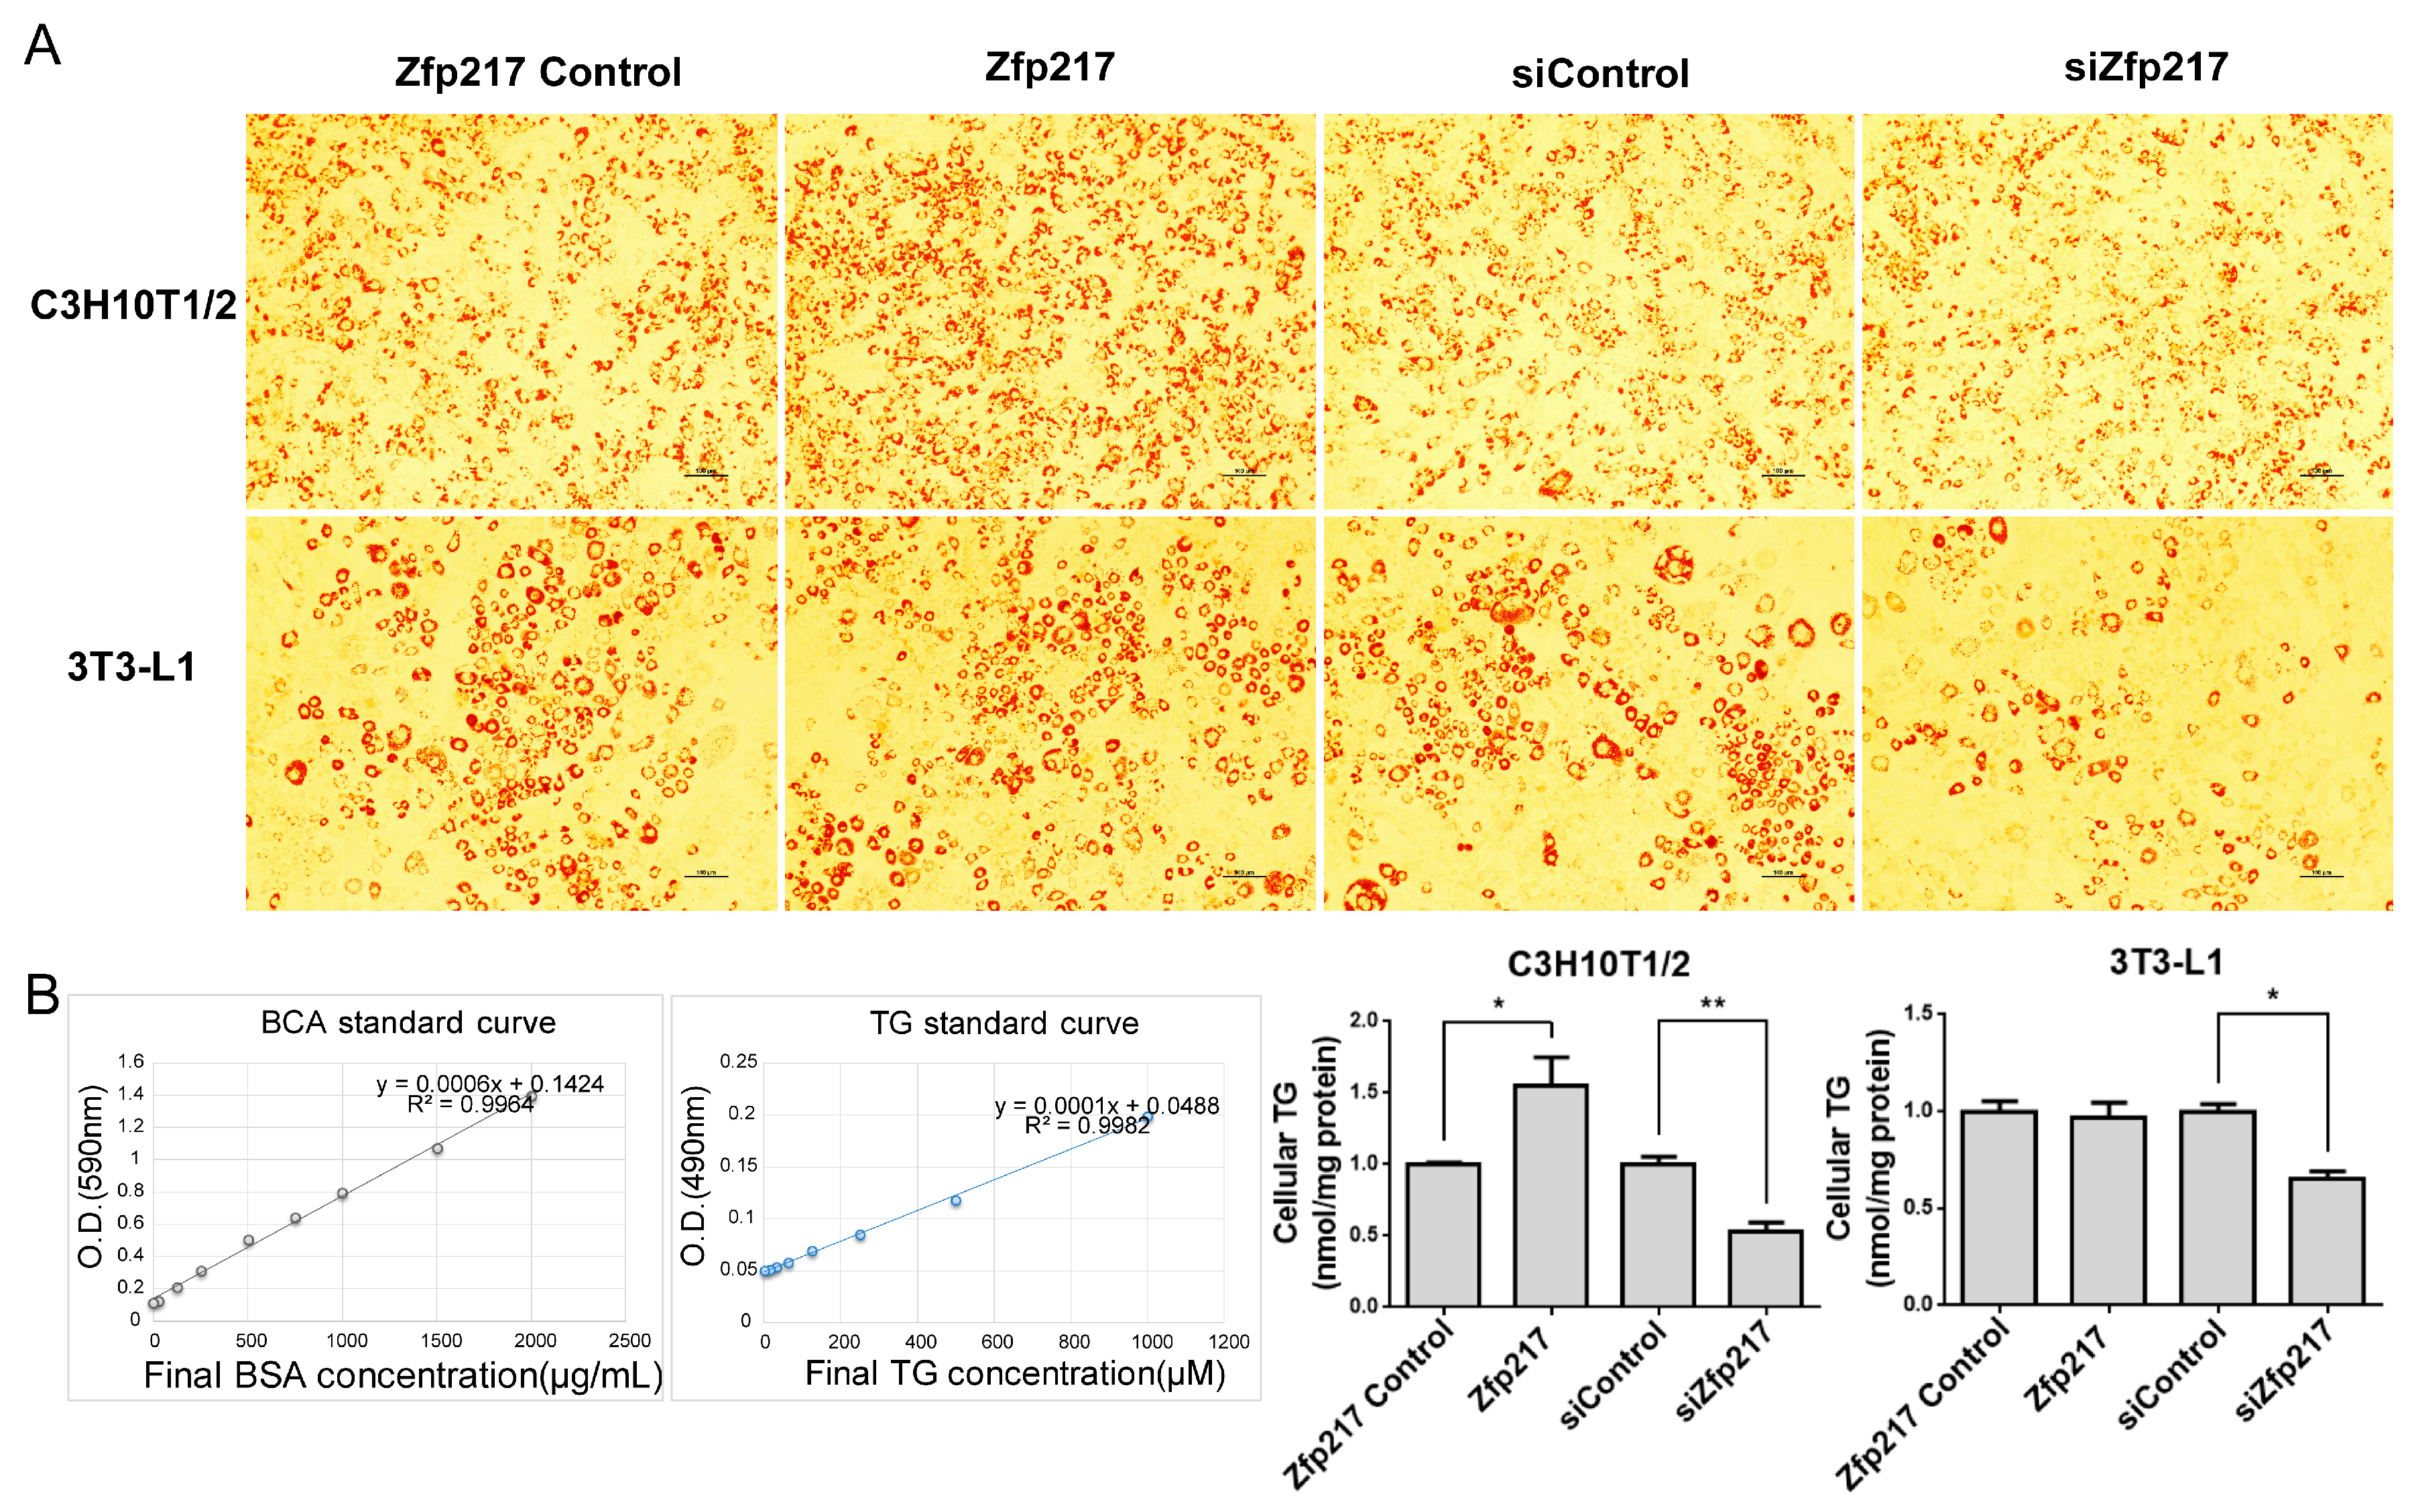
2.3. Zfp217 Regulates Adipogenesis of C3H10T1/2 and 3T3-L1

In order to examine the effects of Zfp217 on adipogenesis, siRNA-mediated loss-of-function and overexpression-mediated gain-of-function approaches were used to study the effect of Zfp217 on the adipogenic differentiation of C3H10T1/2 and 3T3-L1. The mRNA level of Zfp217 was significantly changed at Day 2 after transfection (Figure S2). Adipocyte differentiation was evaluated by Oil Red O staining and a triglyceride assay. As shown in Figure 3A, Zfp217 knockdown resulted in an obvious decrease in the number of lipid droplets formed, both in C3H10T1/2 and 3T3-L1. Consistent with this observation, triglyceride contents were also significantly attenuated due to lack of Zfp217 in C3H10T1/2 and 3T3-L1 (Figure 3B). Meanwhile, we also observed that Zfp217 overexpression led to an induction of white adipocyte phenotype lipid droplet formation, a slight increase of the triglyceride content in 3T3-L1, and a remarkable increase in C3H10T1/2. These results imply that Zfp217 is required for adipogenesis of the two types of adipogenic cell models.

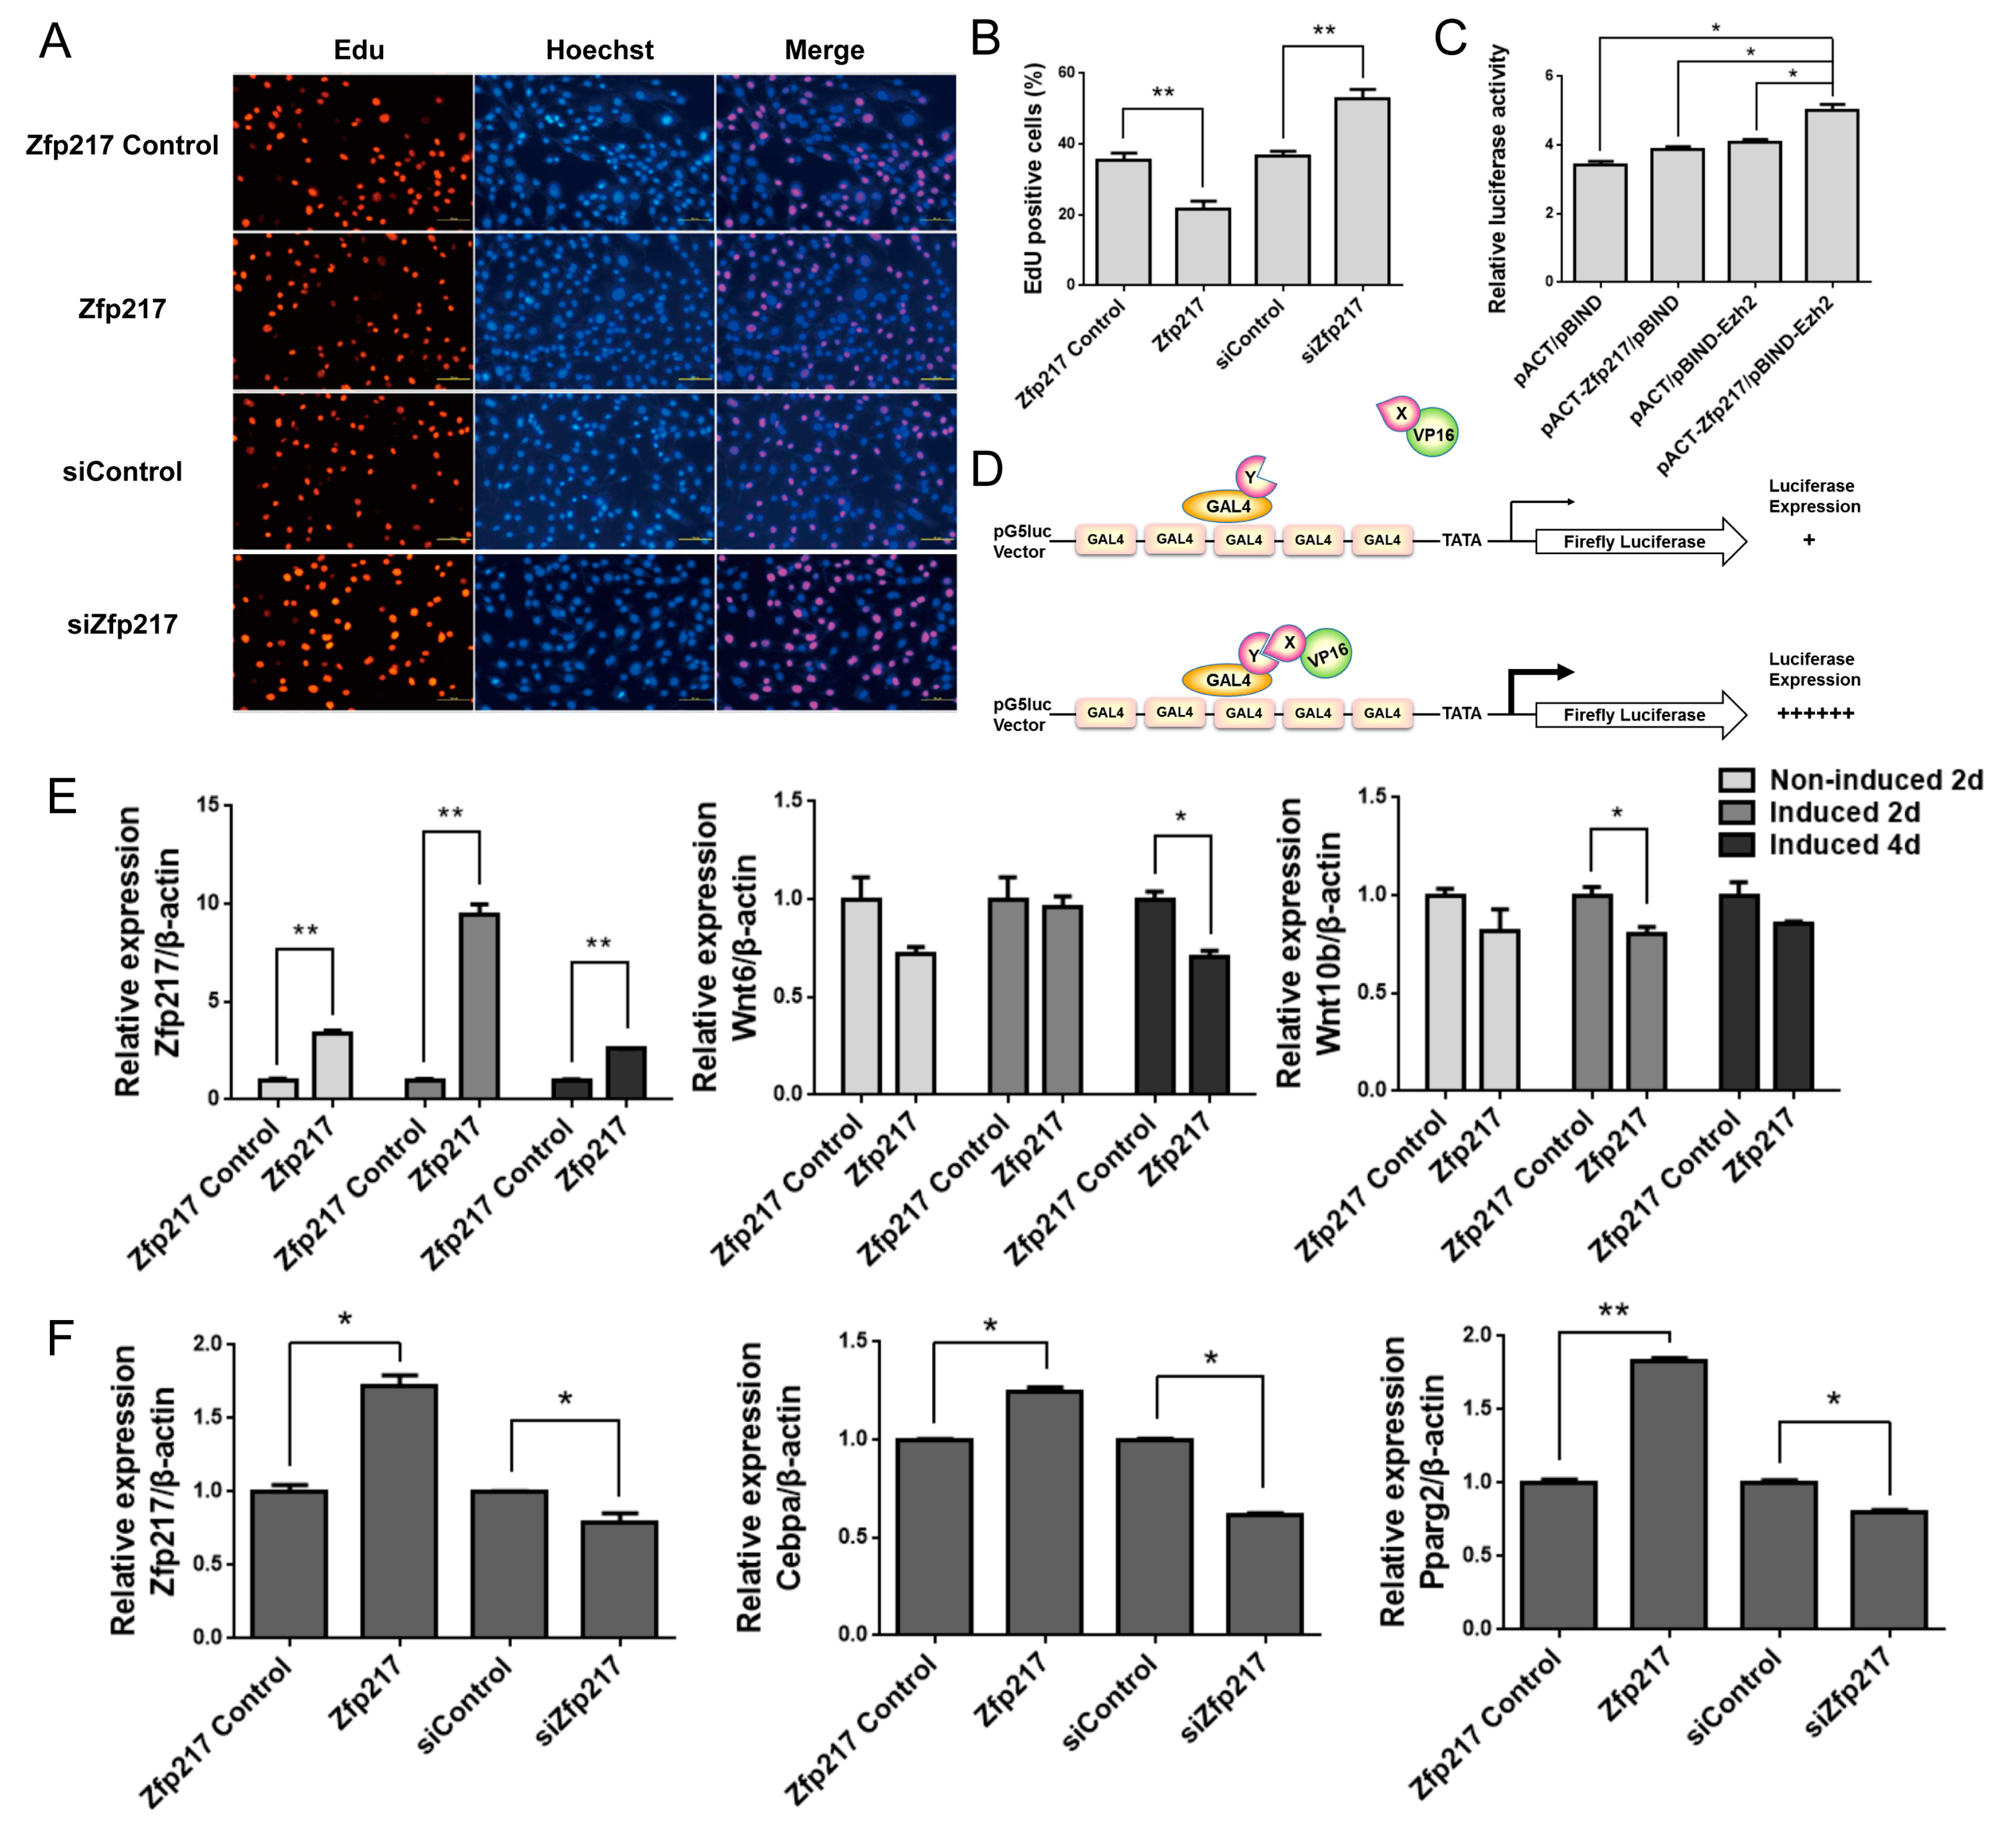
2.4. Zfp217 Positively Regulates Adipogenesis by Suppressing Cell Proliferation and Interacting with Ezh2

Given that Zfp217 regulates adipogenesis with its loss-of-function and gain-of-function in C3H10T1/2, we further investigated the potential mechanism of Zfp217 in C3H10T1/2. 5-Ethynyl-2′-deoxyuridine (EdU) assays were performed on cells transiently transfected separately with Zfp217 siRNA or pcDNA3.1-Zfp217 and its control. Our data indicated that Zfp217 overexpression blocked DNA synthesis in C3H10T1/2, whereas Zfp217 knockdown significantly increased EdU incorporation (p < 0.05) (Figure 4A,B). It was also observed that Zfp217 could increase the amount of C3H10T1/2 cells in G0/G1-phase (Figure S3). That is, Zfp217 arrested C3H10T1/2 cells at the G0/G1 phase, and Zfp217 overexpression blocked DNA synthesis, which may be mediated by changes in the cell cycle.
According to previous reports and our bioinformatics analysis, we speculated that Zfp217 may participate in adipogenesis by combining with Ezh2, which suppresses Wnts. In order to test this hypothesis, the open reading frame (ORF) of full-length mouse Zfp217 was cloned into the pACT expression vectors to generate VP16-Zfp217 chimeric proteins. Meanwhile, the ORF of full-length mouse Ezh2 was cloned into the pBIND expression vectors to generate GAL4-Ezh2 chimeric proteins. Next, the interaction of Zfp217 and Ezh2 was tested. A robust interaction requires that the mammalian two-hybrid assay signal in pACT-Zfp217/pBIND-Ezh2 should be significantly above background signals derived from both vectors individually (Figure 4D). We did find that the group of pACT-Zfp217/pBIND-Ezh2 had a significant interaction signal comparable to control group (Figure 4C). Therefore, we can conclude that Zfp217 also interacts with Ezh2 in the mouse background.
Additionally, in order to confirm whether Zfp217 represses Wnt signaling genes to facilitate adipogenesis, we checked the expression changes of Wnts (Wnt6 and Wnt10b) and two major adipogenic marker genes (Cebpa and Pparg2) after treatment with Zfp217. It was observed that Zfp217 overexpression could notably suppress the mRNA level of Wnt6 at Day 4 post-adipogenic induction, and that of Wnt10b at Day 2 (Figure 4E), but the mRNA level of the two Wnt signaling genes was slightly decreased in the other time points. Furthermore, at Day 4 of post-adipogenic induction, the mRNA levels of Cebpa and Pparg2 were significantly changed, with variation in Zfp217 expression (Figure 4F). Hence, it can be concluded that Zfp217 could positively regulate adipogenesis by suppressing cell proliferation and interacting with Ezh2, which represses Wnt signaling genes.

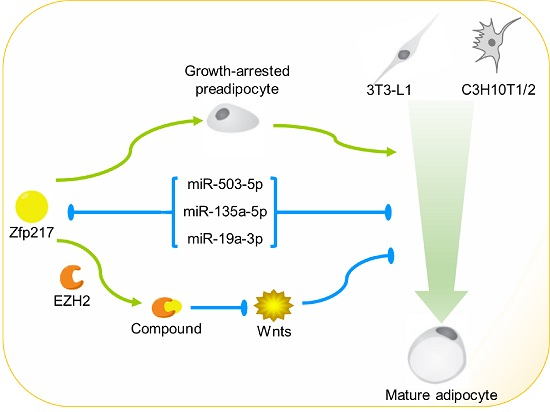
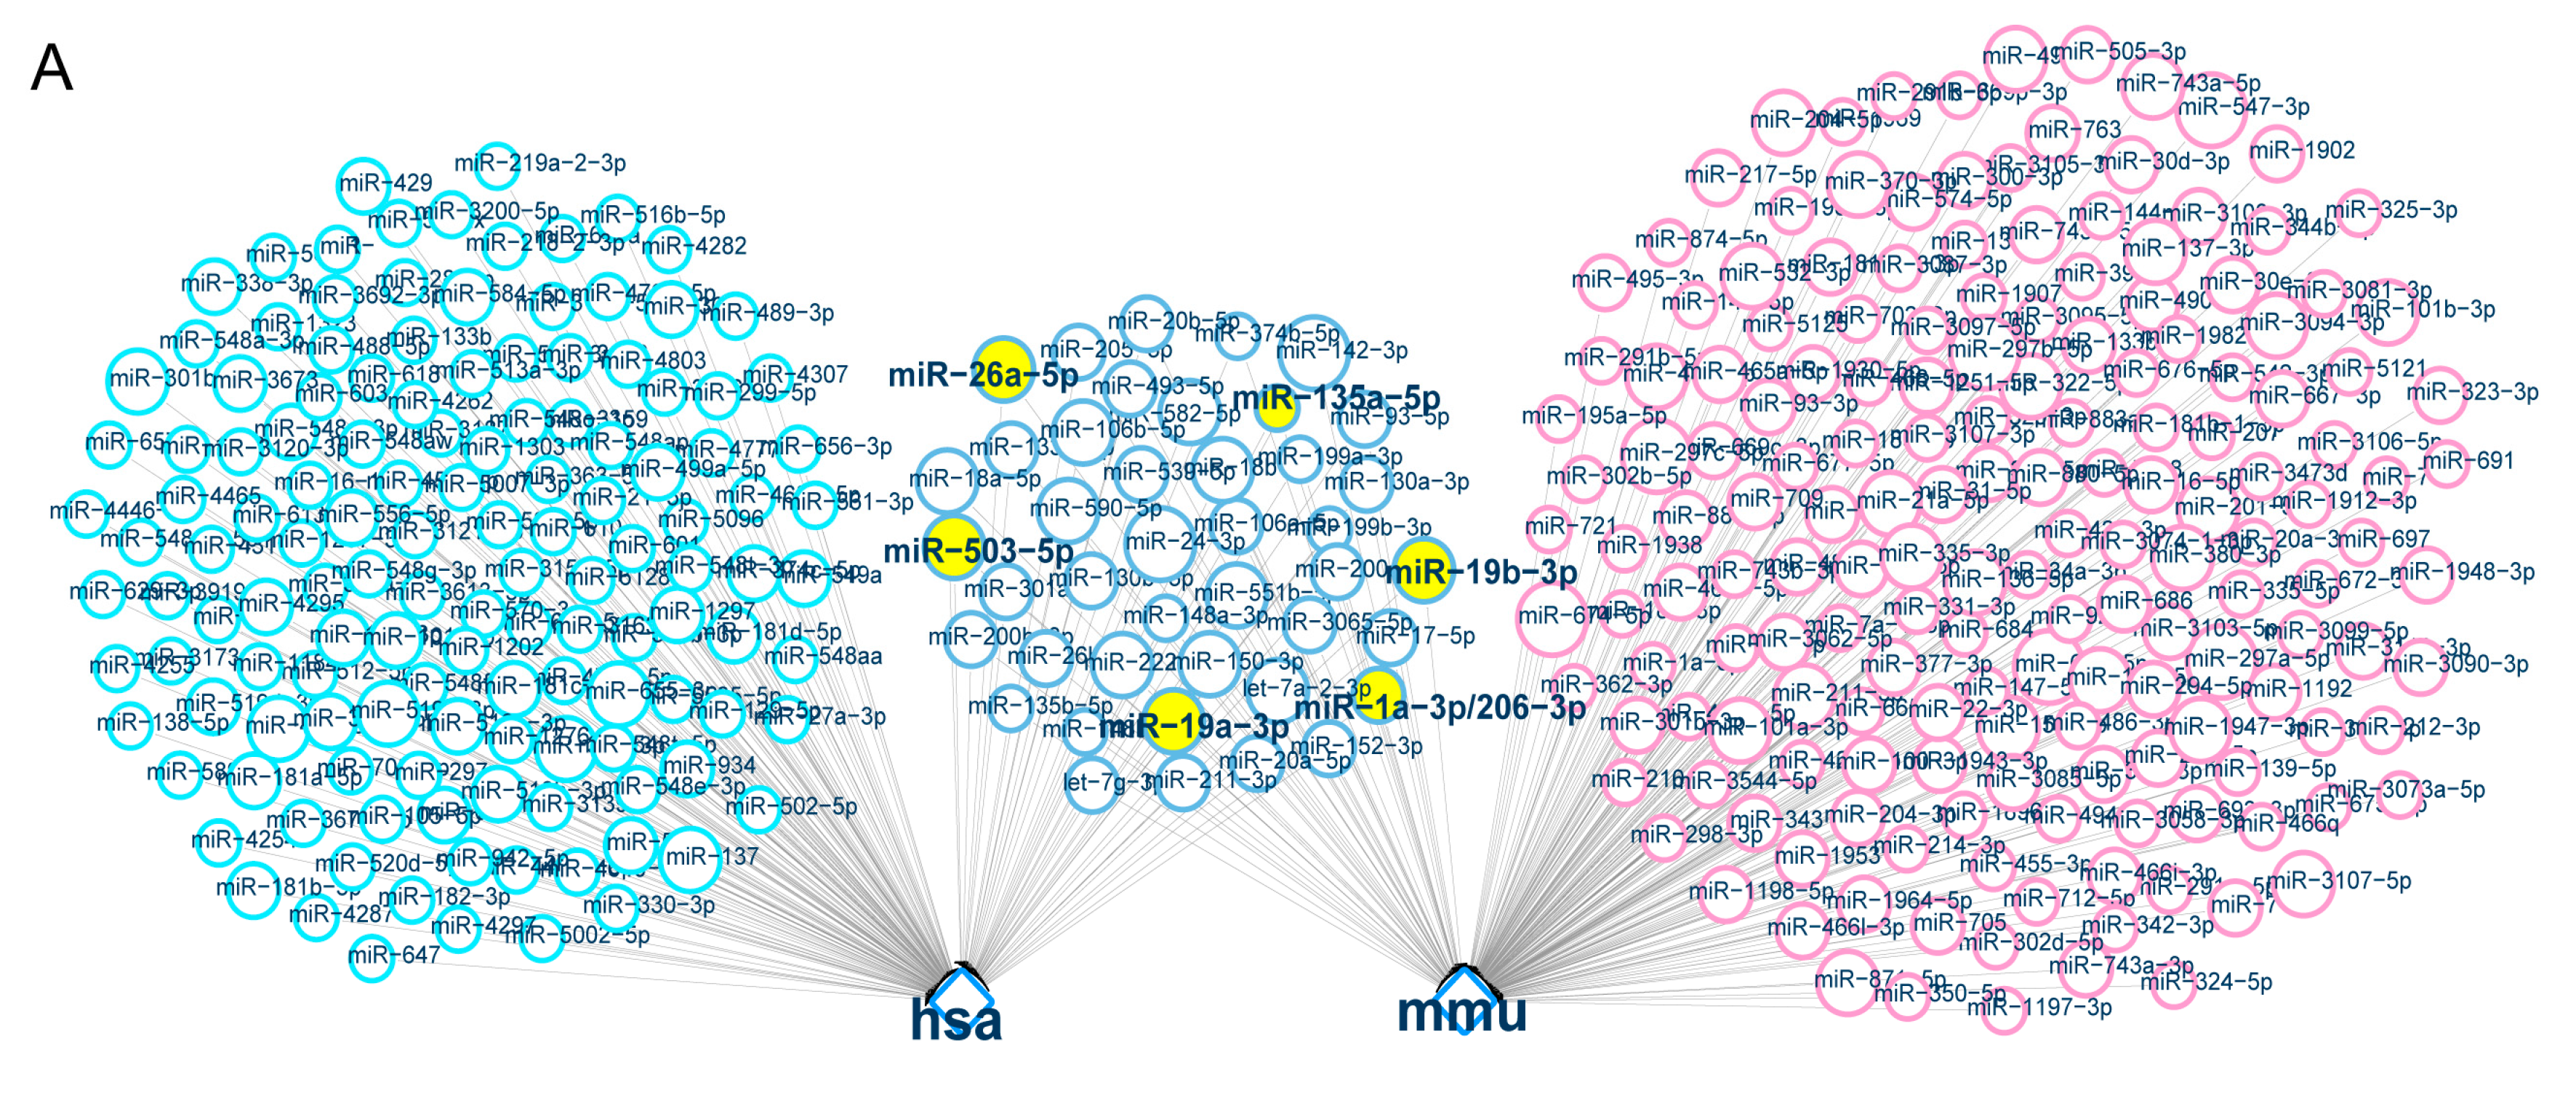
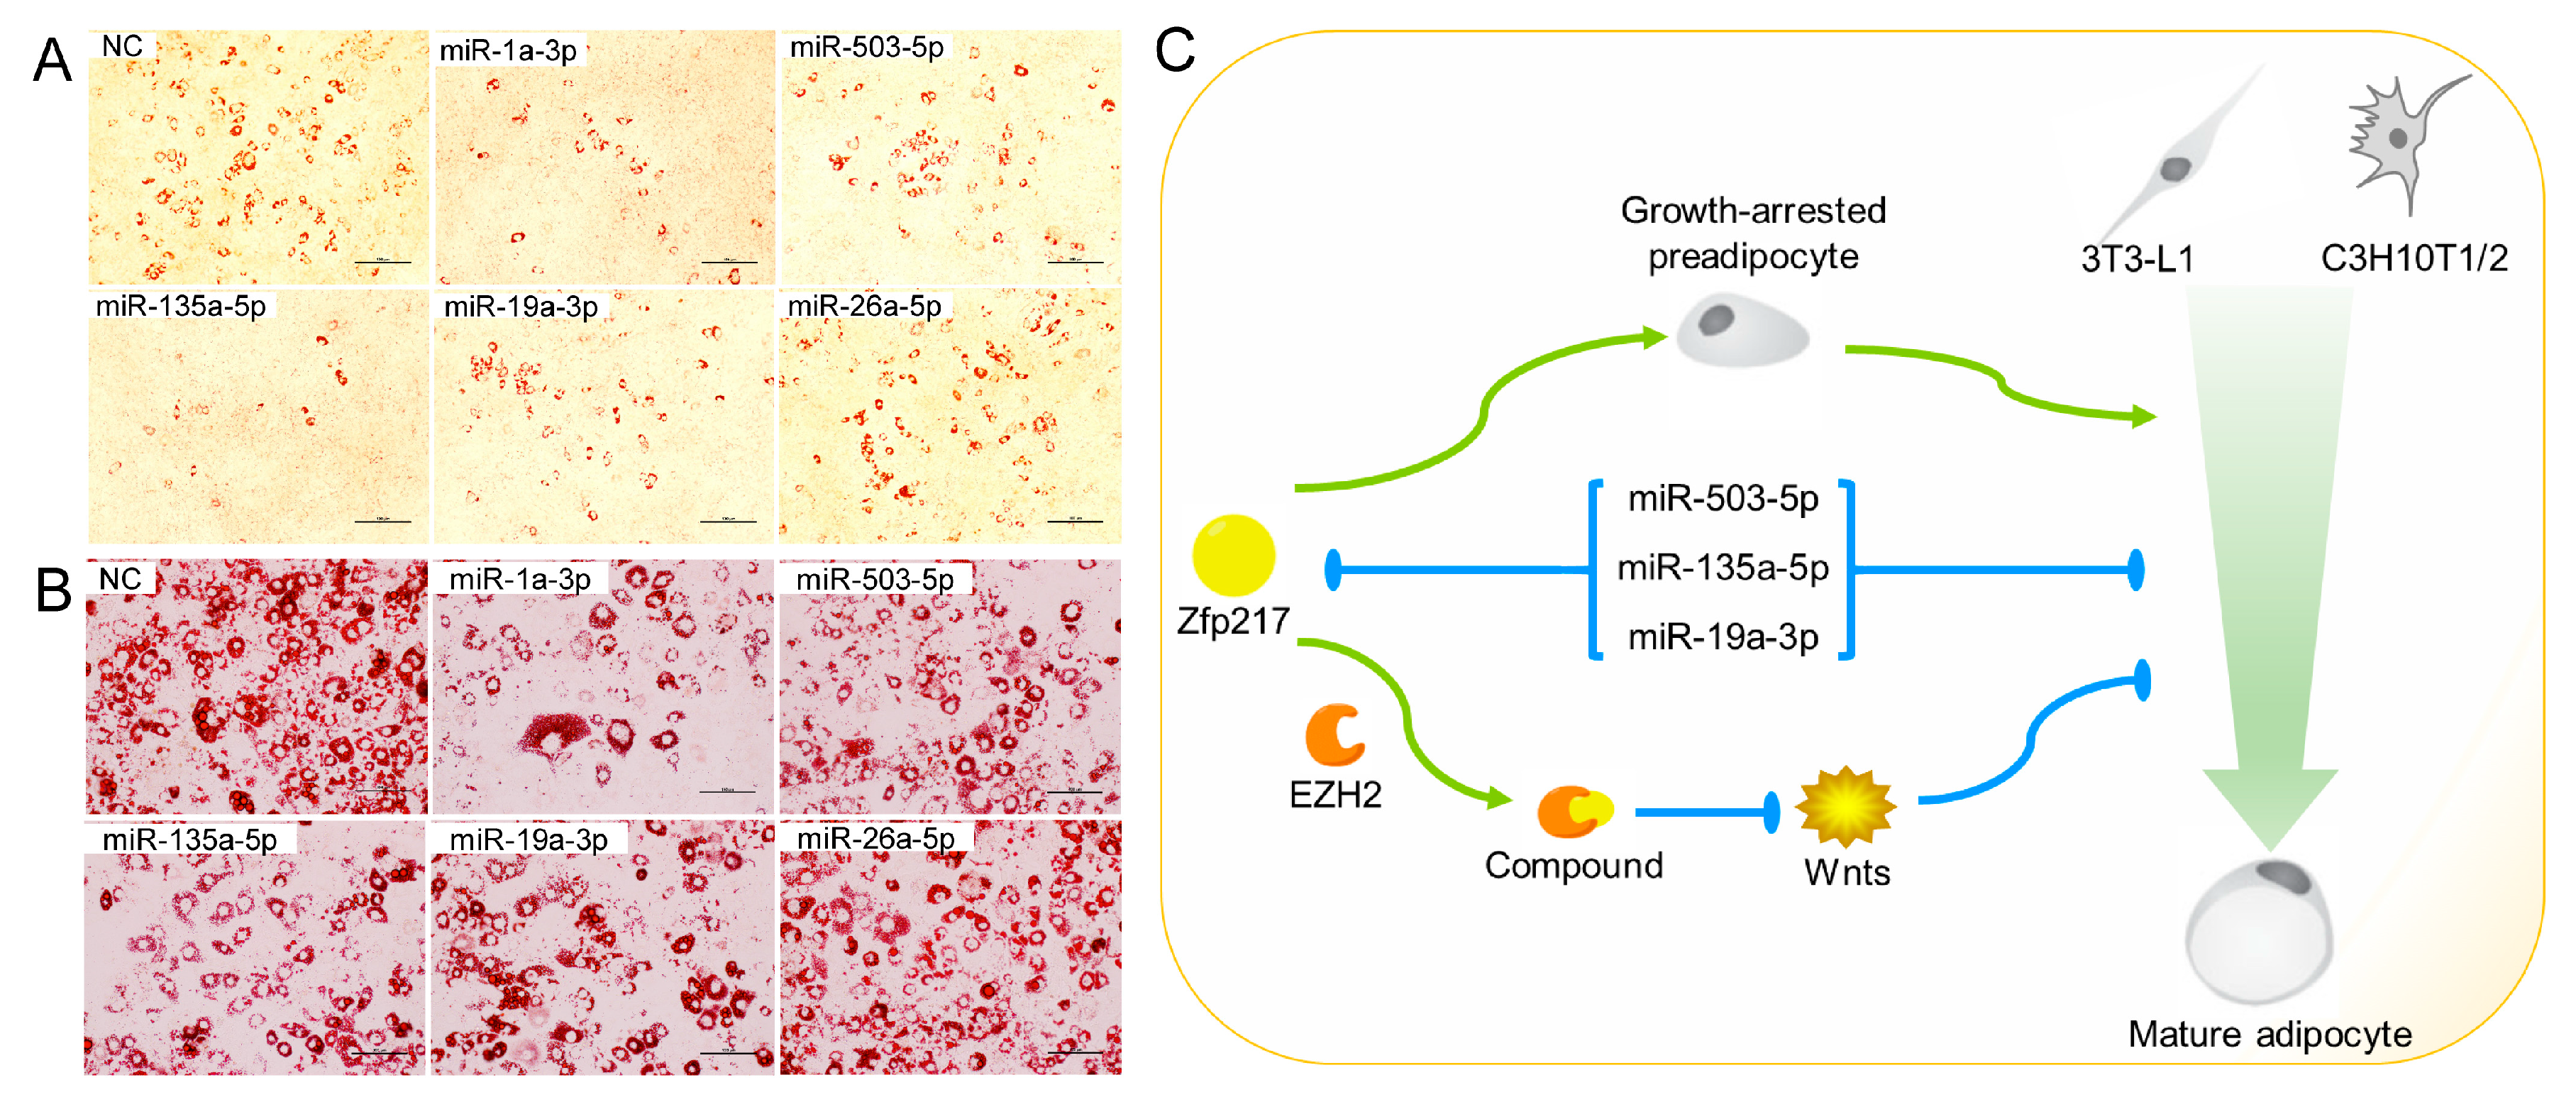
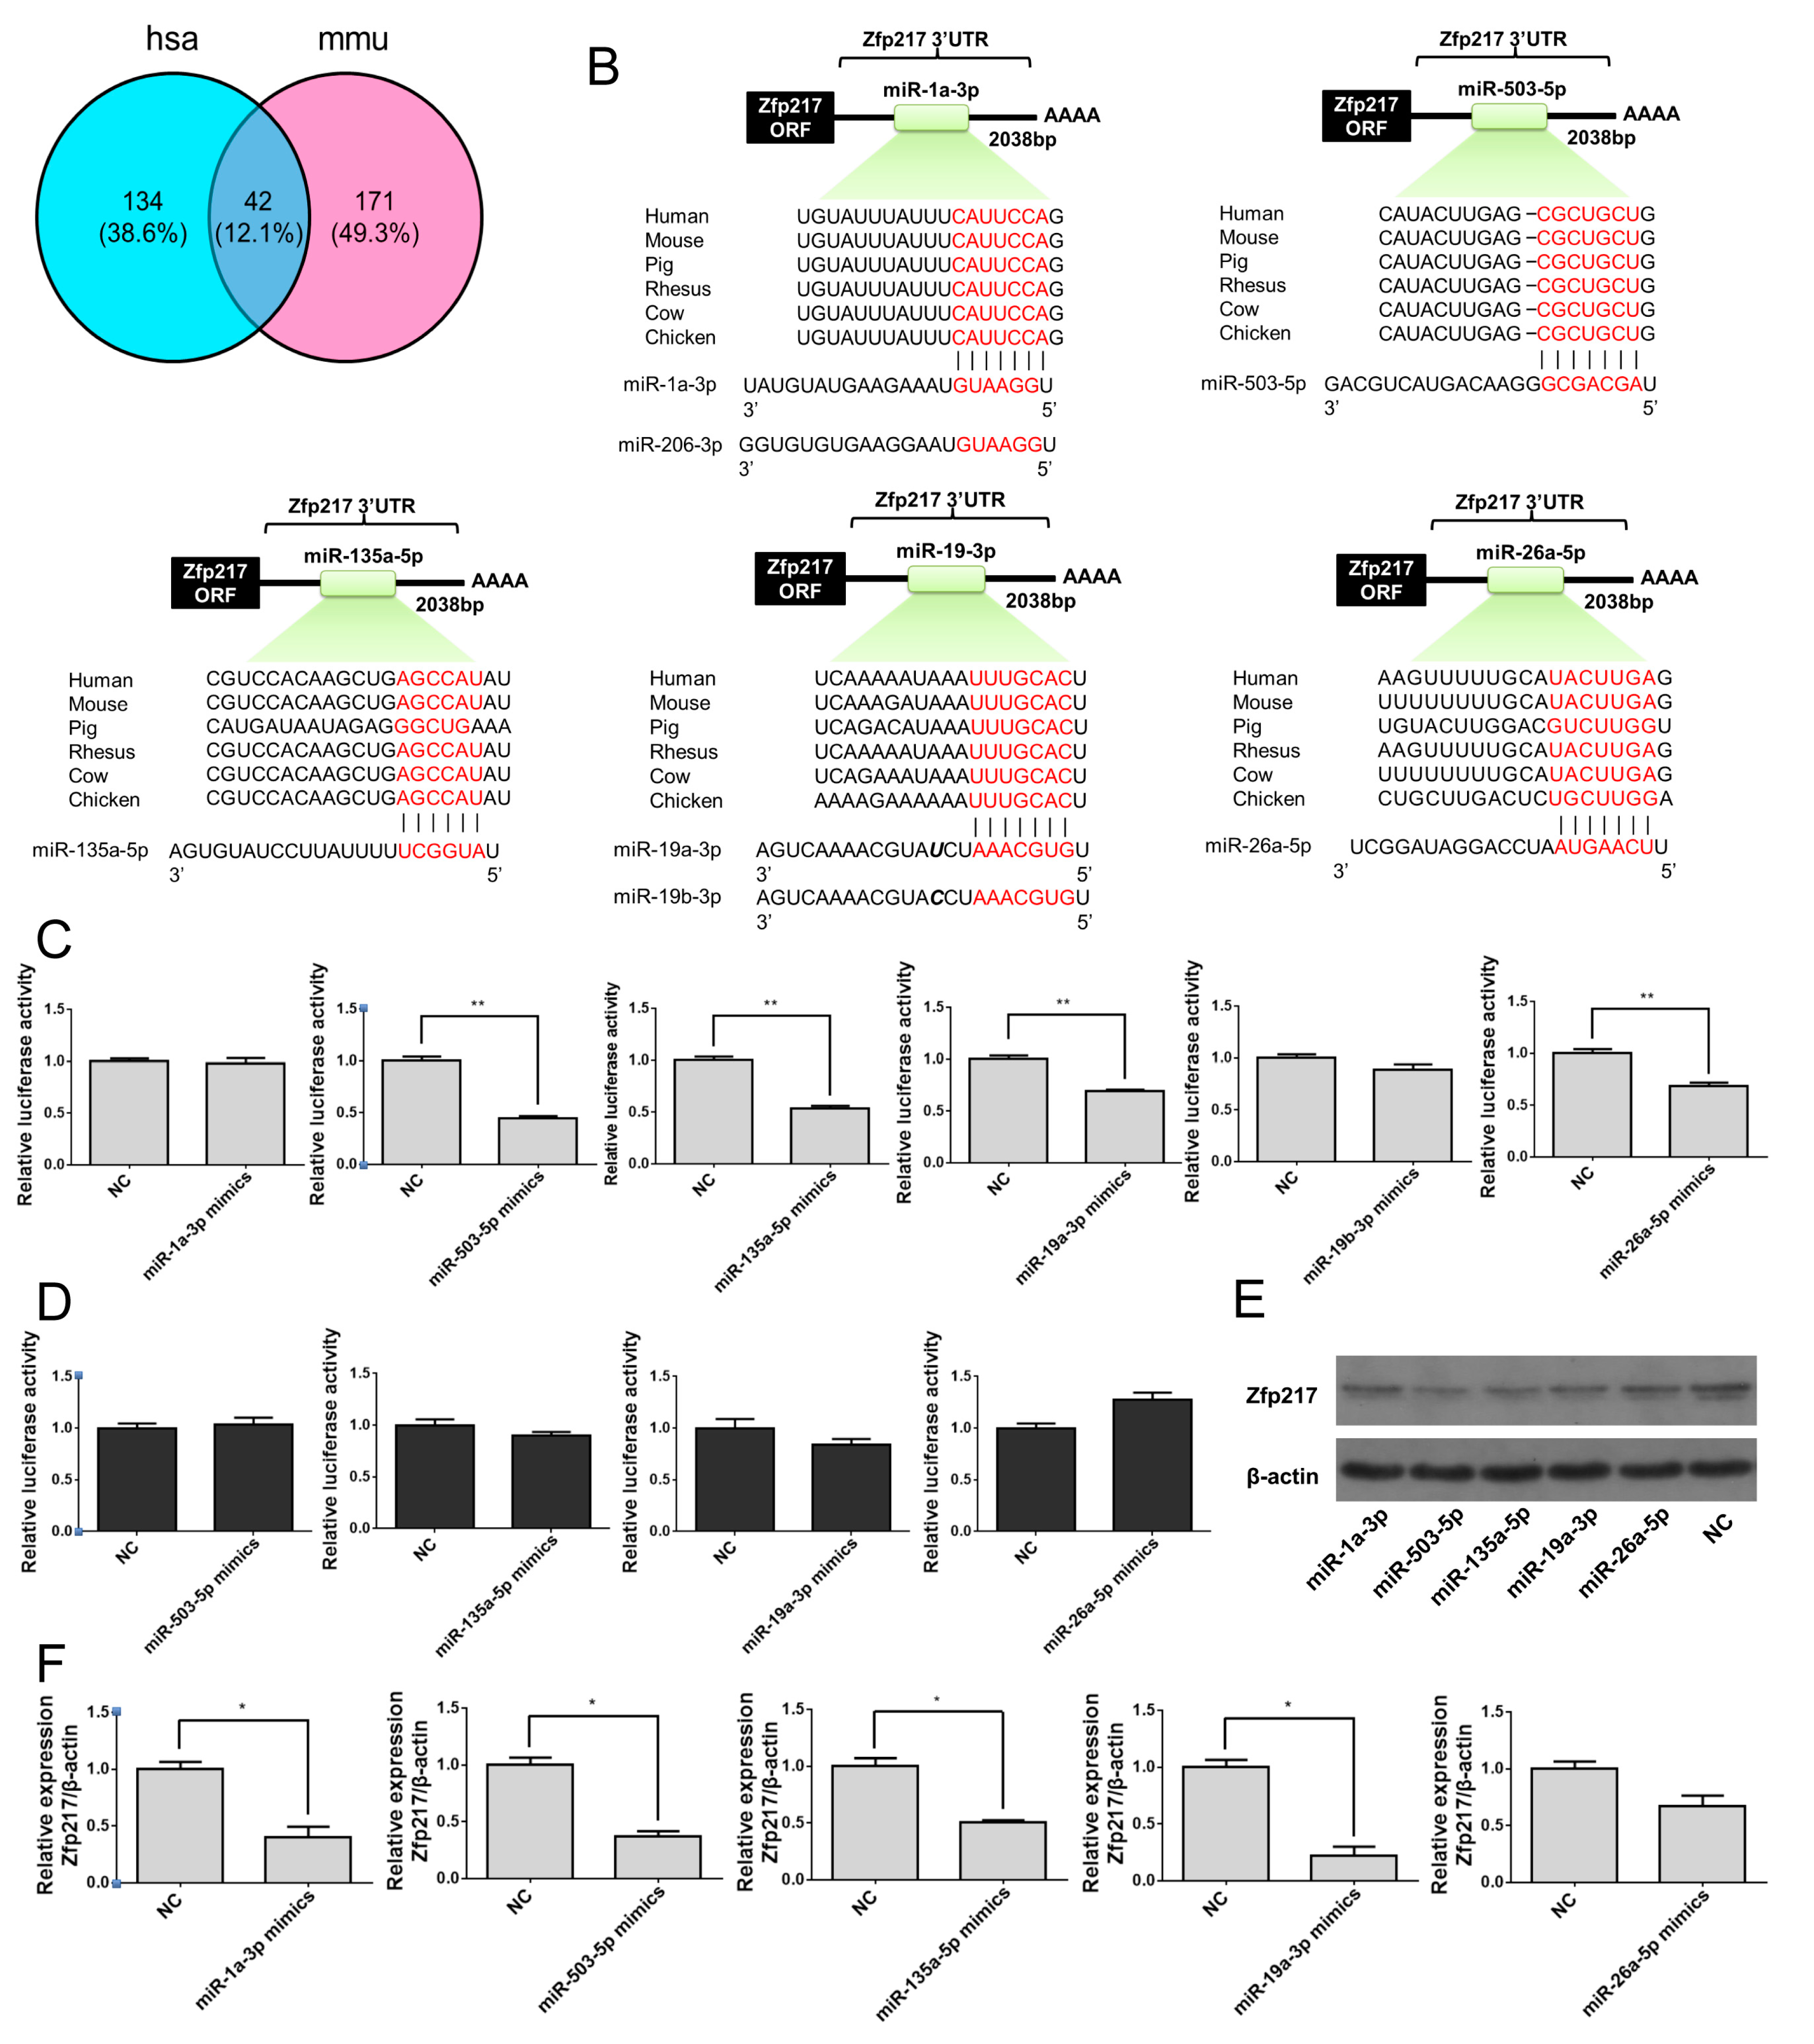
2.5. Direct Targeting of Zfp217 by miR-503-5p, miR-135a-5p and miR-19a-3p Impairs Adipocyte Differentiation

Next, we predicted the miRNAs which targeting Zfp217, and conducted conservation analysis for the binding site of “seed region” by bioinformatics [39]. Then, we found that 176 miRNAs targeted Zfp217 3′ untranslated region (UTR) by binding the “seed region” in human, and 213 in mouse (Figure 5A). Forty-two miRNAs which were common between the two species, were further screened by Gene Ontology (GO) enrichment analysis to obtain adipogenic-miRNAs. Finally, we obtained five miRNAs (miR-1a-3p, miR-503-5p, miR-135a-5p, miR-19a/b-3p and miR-26a-5p). The binding sites of these mature miRNAs are highly conserved in poultry and mammals, including chicken, pig, human, rhesus monkey, mouse, and cow (Figure 5B).
To prove whether Zfp217 was the direct target gene of those predicted miRNAs, 3′ UTR sequences containing the predicted “seed region” target site of miRNA and its mut-sequences were cloned into the pmirGLO vector. Using a dual-luciferase reporter system, the result showed significantly reduced luciferase activity in those co-transfected with the miRNAs (miR-503-5p, miR-135a-5p, miR-19a-3p and miR-26a-5p) mimics and pmirGLO-Zfp217-3′ UTR-wt (p < 0.01), but the group consisting of miR-1a-3p and miR-19b-3p did not display obvious changes (Figure 5C). Subsequently, we co-transfected with the pmirGLO-Zfp217-3′ UTR-mut and miRNAs mimics which showed changed activity. Unlike wild-type luciferase reporter, all four changed miRNAs expression could not inhibit the activity of the mut-reporter (Figure 5D). These results clearly indicate that the four miRNAs (miR-503-5p, miR-135a-5p, miR-19a-3p and miR-26a-5p) directly recognized and bound the 3′ UTRs of Zfp217.
To verify whether those miRNAs affected the Zfp217 expression level, we transiently transfected C3H10T1/2 cells with miRNAs mimics and investigated Zfp217 mRNA level at 24 h after transfection and protein level at 48 h after transfection. The results of reverse transcriptase-quantitative polymerase chain reaction (qRT-PCR) showed that over-expression of miRNAs (miR-1a-3p, miR-503-5p, miR-135a-5p and miR-19a-3p) dramatically suppressed the mRNA levels of Zfp217 (p < 0.01) (Figure 5F), which was similar to western blot results (Figure 5E). Although miR-1a-3p could restrain Zfp217 expression level, it could not bind the 3′ UTRs of Zfp217 by “seed region”. On the contrary, miR-26a-5p could bind the 3′ UTRs of Zfp217, but it did not affect the Zfp217 expression level.
We also transiently transfected 3T3-L1 cells and C3H10T1/2 cells with the predicted miRNA mimics or negative control before adipogenic-induction to elucidate whether those miRNAs indeed regulate adipocyte differentiation. Compared with control group, miRNA (miR-1a-3p, miR-503-5p, miR-135a-5p and miR-19a-3p) mimic transfection yielded decreased lipid droplets accumulation in both two cells by Oil Red O staining (Figure 6A,B).
Together, the results showed that Zfp217 is directly targeted by miR-503-5p, miR-135a-5p and miR-19a-3p which impair adipocyte differentiation. This is a further evidence of Zfp217 has the effect on adipogenesis.

3. Discussion

Despite its participation in a variety of important life processes due to its special structure, the role of the zinc finger protein family in adipogenesis is poorly understood. In our previous study, we found that a differentially expressed zinc finger protein gene Zfp217 was significantly upregulated at Day 2 during adipogenesis [17]. However, most of the previous studies are mainly focused on histone modification, pluripotency and oncogenesis [25,26,27,40,41], and its role in adipogenesis has not been reported. In this study, to test whether Zfp217 plays a role in adipogenesis, we retrieved GEO datasets and performed a bioinformatics analysis of the downloaded datasets. We found that the expression of Zfp217 is not only correlated with adipogenic marker genes, but also fluctuated with that of Pparg in three diabetes mellitus-related clinical statuses. Although the expression of Pparg is not obvious regularity in three clinical-status as the complex factors in vivo, the role of Pparg on obesity and diabetes mellitus is well known [42,43]. Therefore, we suspect that Zfp217 may have a potential effect on obesity and its role may be under the control of Pparg. Furthermore, bioinformatics analysis and literature review suggest that Zfp217 may affect adipogenesis by combining with Ezh2. Hence, a series of experiments were performed to test this hypothesis.
Previous studies have reported that Pparg acts as a transcriptional activator and has a central role in adipocyte differentiation, adipocyte metabolism and obesity [44]. Pparg is essential for both white and brown adipocytes differentiation under different conditions [42,45]. Ucp1 is a marker gene of brown adipocyte [46]. The ectopic expression of Ucp1 can increase the population of brown adipocytes [47], and Ucp1 can be also present in white adipose tissue [48]. Interestingly, in two types of white adipocytes (human SBGS pre-adipocyte and 3T3-L1 cells), Zfp217 and Pparg are classified together. In brown preadipocytes, Zfp217 and Ucp1 classified more closely. This may imply that the relationship between Zfp217 and Ucp1 is closer than Zfp217 and Pparg in brown preadipocytes. It suggests that Zfp217 may have different regulatory mechanisms in different type of adipocytes. The specific mechanism of Zfp217 in brown preadipocytes needs more detailed experiments to be verified. In this study, multiple mouse adipose tissues and cell lines were first used to analyze the expression patterns of Zfp217 in the adipogenic process or the obesity model. With the extension of adipogenic induction time, Zfp217 expression showed a steady increase, which was very similar to that of key adipogenic marker gene Pparg2. However, for the five kinds of different adipose tissues from HFD/NCD mice, the expression levels of Zfp217 and Pparg2 in brown adipose tissues were not consistent as those in visceral adipose tissues or white adipocytes, and this may have been due to many influencing factors in vivo, or other unknown regulatory mechanisms. Visceral adipocytes are crucial contributors to the burden of obesity and are more harmful to human health [49]. The mRNA level of Zfp217 and Pparg2 only had a similar pattern in cell adipogenesis and visceral fat, it may suggest that the role of Zfp217 on white adipogenesis and obesity is closely related to Pparg. What’s more, Pparg has two transcription factor binding sites at the 5′ UTR of Zfp217 sequence predicted using JASPAR datasets (Table S4), it implies that Zfp217 may be the downstream gene of Pparg. The expression of Pparg2 was not always increased in HFD group, suggesting that there was a protective mechanism against diet-induced weight gain. The protective mechanism may be induced by inflammation factors, DNA methylation or neuromodulation (as epididymal and perirenal tissues are richly endowed with nodose ganglions) [50,51,52]. Zfp217 structure and properties were in accordance with early key pro-adipogenic genes. For the three cell models with different adipogenic ability before or after induction, the expression pattern of Zfp217 was similar to that of early key pro-adipogenic genes. Meanwhile, the protein structure of KLF4 and ZNF395 also had zinc finger protein motifs. Furthermore, all four early key pro-adipogenic genes could be linked to cancer [29,53,54,55]. Therefore, the results of expression pattern analysis further supported the results of bioinformatics analysis.
In addition, “gain-of-function” and “loss-of-function” experiments further confirmed that Zfp217 promoted adipogenesis in both C3H10T1/2 cells and 3T3-L1 cells. Consistent with this finding, Zfp217 significantly positively regulated pro-adipogenic core transcription factors Cebpa and Pparg2. It seems that the increase of the Zfp217 expression obviously decreased EdU incorporation, and vice versa. Since the cell cycle distribution is changed by Zfp217 overexpression, this phenomenon is a result of the inhibition of mitotic clonal expansion. Namely, Zfp217 could arrest C3H10T1/2 cells at G0/G1 phase and blocked DNA synthesis, and it turns out that Zfp217 overexpression decreased EdU incorporation. This suggests that Zfp217 regulates adipogenesis, probably by suppressing cell proliferation. In order to understand the potential molecular mechanism of Zfp217 in adipogenesis, we surveyed the reports concerning Zfp217 or adipogenesis in the past decades, and found that Zfp217 was bound to Ezh2 and participated in histone modification in MCF7, which is a breast cancer cell line [40]. Besides, Ezh2 represses Wnt signaling genes to facilitate adipogenesis as well [56]. Concordant with our previous speculation, Zfp217 was found to interact with Ezh2 according to a mammalian two-hybrid assay. Furthermore, Zfp217 overexpression was found to restrain the mRNA level of Wnt6 and Wnt10b, the downstream target genes of Ezh2 during the adipogenic differentiation process [56], both of which act as a negative molecular switch in governing adipogenesis [57]. Combining GEO analysis, we speculate that Zfp217 could cooperate with Ezh2 in facilitating adipogenesis.
We also found that three miRNAs (miR-503-5p, miR-135a-5p and miR-19a-3p) directly suppressed the expression levels of Zfp217 by bonding its 3′ UTRs. Consistent with our findings, previous studies have also found that those miRNAs are related to adipogenesis. miR-503-5p inhibits adipogenesis by targeting bmpr1a in C3H10T1/2 cells [58], miR-135a-5p suppresses adipogenes by activating the canonical Wnt/β-catenin signaling in 3T3-L1 cells [59], and miR-19a-3p acts as a serum miRNAs biomarker for pancreatic cancer-associated new-onset diabetes mellitus [60] and it is also involved in C3H10T1/2 chondrogenic differentiation [61]. Based on our results and related reports, these three miRNAs impair adipocyte differentiation, and Zfp217 is directly targeted by them; this in turn confirmed that Zfp217 has an effect on adipogenesis.
Although our research remains to be advanced and improved upon, and although the role of Zfp217 on brown adipogenesis is still indistinct, we have verified that Zfp217 has a positive effect on white adipogenesis, through bioinformatics, literature mining and a series experiments. To the best of our knowledge, this is the first report showing that Zfp217 promotes white adipogenesis in both C3H10T1/2 cells and 3T3-L1 cells, and that Zfp217 may cooperate with Ezh2 in facilitating its adipogenesis or triggering proliferative defects in C3H10T1/2 cells. Also three miRNAs which impair adipocyte differentiation are proposed to directly target Zfp217 in the mouse background (Figure 6C).

4. Materials and Methods

4.1. Analysis of Gene Expression Omnibus Series (GSE) Data

All relevant GSE data were retrieved from GEO datasets (Table S1). The probe ID was converted into an Entrez Gene ID according to the Gene Expression Omnibus Platform (GPL) file. Adipogenesis-unrelated GSE samples were excluded. Differentially expressed genes were identified using the R package limma, with an Adj.P.Val < 0.05, and |log2 Fold Change| > 1 selected as the threshold for screening DEGs. The ggplot2 package was used for the visualization of the results.

4.2. Animals

Healthy male Kun Ming (KM) mice were housed in specific pathogen-free facilities on a 12/12 h light/dark cycle. Animals (four weeks of age) were randomized into chow diet (n = 6, researcher diets D12450B 10 Kcal %) and high-fat diet (n = 6, researcher diets D12492 60 Kcal %) groups. Animals were fed for ten weeks. Age-matched male littermates were used for all experiments. Five kinds of adipose tissues used in this study were carefully dissected from five depots [interscapular, epididymal, inguinal, perirenal white adipose tissue (WAT), and interscapular brown adipose tissue (BAT)], and immediately frozen in liquid nitrogen and stored at −80 °C for gene expression analysis. All experiments were performed in accordance with relevant guidelines and regulations. All experimental protocols were approved by the Ethics Committee of Huazhong Agricultural University with the permit number No. 30700571 for this study.

4.3. Cell Culture and Adipocyte Differentiation

3T3-L1 cells and C3H10T1/2 cells were purchased from the Type Culture Collection of the Chinese Academy of Sciences (Shanghai, China), and cultured in Dulbecco’s modified Eagle’s medium (DMEM, Gibco) with 10% fetal bovine serum (FBS, Gibco, Gaithersburg, MD, USA). The cells were induced to differentiation by addition of MDII cocktail (0.5 mM 3-isobutyl-1-methylxanthine, 1 μM dexamethasone, 5 μg/mL insulin and 100 μM indomethacin) in 10% FBS medium at 2 d after reaching confluence. Two days after induction, the cells were refed with 10% FBS medium with 5 μg/mL insulin for two days, then maintained in 10% FBS medium until cells were fully differentiated. NIH3T3 cells and BHK-21 cells were also cultivated in 10% FBS medium.

4.4. Oil Red O Staining

The fully differentiated cells were rinsed twice with PBS, and then fixed with 4% formalin for 30 min at room temperature. Then the cells were rinsed with PBS and stained with filtered Oil Red O (Sigma, Saint Louis, MO, USA) for 30 min, followed by washing twice in water. Stained cells were visualized by light microscopy (Nikon, Tokyo, Japan).

4.5. Triglyceride Assay

The fully differentiated cells were rinsed twice with PBS, collected in saline solution, and then sonicated for homogenization. The concentrations of triglyceride (TG) in the lysates of cells were measured with the commercial kits (Applygen, Beijing, China). The content of triglycerides was normalized to the content of protein (μmol/mg protein) using the bicinchoninic acid (BCA) assay kit (Thermo Scientific, Waltham, MA, USA).

4.6. Quantitative Real-Time RT-PCR (qRT-PCR) Analysis

Total RNA was obtained by using TRIzol (Invitrogen, Carlsbad, CA, USA). The cDNA was synthesized using RevertAid™ First Strand cDNA Synthesis Kit (Thermo Scientific) according to the manufacturer’s protocol. The qRT-PCR was performed in triplicate using IQ SYBR green Supermix (Bio-Rad, Hercules, CA, USA) on CFX384 (Bio-Rad). Relative quantification was calculated by the 2−ΔΔCt method and normalized by β-actin. Primers are listed in Table S2.

4.7. Western Blotting

Proteins were detected using antibodies against Zfp217 (sc-67223, Santa Cruz, Dallas, TX, USA), Pparg2 (sc-22020, Santa Cruz), and β-actin (sc-47778, Santa Cruz). Total cell lysate was extracted using RIPA lysis buffer on ice. Equal amounts of proteins were separated by SDS-PAGE electrophoresis. The protein bands were transferred to a polyvinylidene difluoride (PVDF) membrane (Millipore, Boston, MA, USA). The PVDF membrane was blocked with 5% skimmed milk and incubated with primary antibodies. The results were visualized using horseradish peroxidase-conjugated secondary antibodies (Santa Cruz) and enhanced chemiluminescence.

4.8. EdU Cell Proliferation Assay

The cell proliferation assay was carried out using EdU according to the manufacturer’s manual (RiboBio, Guangzhou, China). Briefly, cells (1 × 10⁴ cells/cm2) were cultured in 96-well plates and added final-concentration 50 μM EdU of each well for 4 h at 37 °C. Then, the cells were fixed using 4% paraformaldehyde for 30 min at room temperature and permeabilized with 0.5% Triton X-100 for 10 min. Next, the cells were washed with PBS and incubated with EdU staining solution for 30 min. Finally, the cells were re-stained with Hoechst 33,342 (200 μL per well) for 30 min. The cells were imaged under a fluorescent microscope (Nikon).

4.9. Mammalian Two-Hybrid Assay

Protein–protein interactions were assayed using the CheckMate™ Mammalian Two-Hybrid System (Promega, Madison, WI, USA). Briefly, BHK-21 cells were plated at a density of 1 × 10⁵ cells/cm2 in 48-well plates, cultured for 24 h and then co-transfected with the mixture of pACT- and pBIND-derived constructs or control vector, and a pG5luc reporter vector. The cells were passively lysed at 48 h post transfection. Firefly and renilla luciferase activities were measured using the Dual-Luciferase® Reporter Assay System (Promega) and an EnSpire Multimode Plate Reader with two automated injectors (PerkinElmer, Norwalk, CT, USA).

4.10. The Prediction and Screening of miRNAs

The miRNAs which targeting Zfp217 were predicted by miRNAWalk2.0 at the specific cut-off criteria (SUM ≥ 6, Targetscan = True) [39]. It extracted data from the overlap-miRNAs both in human and mouse. Conservative-overlap miRNAs were screened out from the overlap-miRNAs using targetscan. Base on the targeting principle of miRNAs, the GO annotation analysis of the conservative-overlap miRNAs was performed using their reverse prediction program targetgenes and performed by DAVID v6.8 [62].

4.11. Dual-Luciferase Reporter Assay

The 3′ UTR fragments of Zfp217 were amplified from the mouse genome. The corresponding mutant fragments were amplified by overlap extension PCR. The primers and mutant sites were as shown in Table S3 and Figure S4. The PCR fragments were cloned into pmirGLO vectors (Promega). All vectors were confirmed by sequencing. BHK-21 cells were plated at a density of 1 × 10⁵ cells/cm2 in 48-well plates and then co-transfected with of the 3′ UTR-pmirGLO vectors (wt or mut) and the miRNAs mimics (The sequences were listed in Table S2) or negative control (GenePharma, Shanghai, China) using Lipofectamine 2000 (Invitrogen). The dual-luciferase activity was measured utilizing the Dual-Glo Luciferase Assay System (Promega). Firefly luciferase activity was normalized to the corresponding Renilla luciferase activity. Experiments were performed in quadruplicate wells of a 48-well plate and repeated at least three times.

4.12. Statistical Analysis

Data values were presented as mean ± SEM. Statistical analyses were performed using two-tailed Student’s t-tests. p < 0.05 was considered as statistically significant.

5. Conclusions

In this study, we reported a new adipogenic activator Zfp217 and proposed a new mechanism of adipogenesis. The data presented in this study not only provide an insight into the adipogenesis regulatory networks, but also suggest that Zfp217 may be an important therapeutic target in obesity.

Supplementary Materials

Supplementary materials can be found at www.mdpi.com/1422-0067/18/7/1367/s1.

Acknowledgments

This work was supported by the financial support of National Natural Science Foundation of China (NSFC) (Nos. 31472075); National Key Technology Support Program (2011BAD28B01) and the Cooperative Innovation Center for Sustainable Pig Production.

Author Contributions

Conceived and designed the experiments: Si-Wen Jiang and Hong Xiang; Performed the experiments and analyzed the data: Hong Xiang, Zhu-Xia Zhong, Yong-Dong Peng; Drafted, wrote, and revised the manuscript: Hong Xiang; Generated figures: Hong Xiang, Zhu-Xia Zhong. All authors discussed the results and commented on the manuscript.

Conflicts of Interest

The authors declare no conflict of interest.

Abbreviations

Zfp217Zinc Finger Protein 217
PpargPeroxisome Proliferator-Activated Receptor g
CebpsCCAAT/Enhancer-Binding Proteins
DEGsDifferentially Expressed Genes
ASVCAdipocytic Differentiation of Porcine Subcutaneous Stromal Vascular Cells
GEOGene Expression Omnibus
GSEGene Expression Omnibus Series
GPLGene Expression Omnibus Platform
DMDiabetes Mellitus
IGTImpaired Glucose Tolerance
NGTNormal Glucose Tolerance
HFDHigh Fat Diet Fed Mice
NCDNormal Chow Diet Fed Mice
ORFOpen Reading Frame
EdU5-Ethynyl-2’-Deoxyuridine
TGTriglycerides
BCABicinchoninic Acid
wtWild Type
mutMutant Type
hsaHomo sapiens (human)
mmuMus musculus (Mouse)
WATWhite Adipose Tissue
BATBrown Adipose Tissue
PVDFPolyvinylidene Difluoride
EMTEpithelial-to-Mesenchymal Transition
SBGSSimpson-Golabi-Behmel Syndrome
GOGene Ontology
KMKun Ming

References

  1. Malik, V.S.; Willett, W.C.; Hu, F.B. Global obesity: Trends, risk factors and policy implications. Nat. Rev. Endocrinol. 2013, 9, 13–27. [Google Scholar] [CrossRef] [PubMed]
  2. Lefterova, M.I.; Lazar, M.A. New developments in adipogenesis. Trends Endocrinol. Metab. 2009, 20, 107–114. [Google Scholar] [CrossRef] [PubMed]
  3. Lefterova, M.I.; Zhang, Y.; Steger, D.J.; Schupp, M.; Schug, J.; Cristancho, A.; Feng, D.; Zhuo, D.; Stoeckert, C.J.; Liu, X.S.; et al. PPARγ and C/EBP factors orchestrate adipocyte biology via adjacent binding on a genome-wide scale. Genes Dev. 2008, 22, 2941–2952. [Google Scholar] [CrossRef] [PubMed]
  4. Wei, S.; Zhang, L.; Zhou, X.; Du, M.; Jiang, Z.; Hausman, G.J.; Bergen, W.G.; Zan, L.; Dodson, M.V. Emerging roles of zinc finger proteins in regulating adipogenesis. Cell. Mol. Life Sci. 2013, 70, 4569–4584. [Google Scholar] [CrossRef] [PubMed]
  5. Tseng, K.-Y.; Chen, Y.-H.; Lin, S. Zinc finger protein ZFP36L1 promotes osteoblastic differentiation but represses adipogenic differentiation of mouse multipotent cells. Oncotarget 2017, 8, 20588–20601. [Google Scholar] [CrossRef] [PubMed]
  6. Hu, X.M.; Zhou, Y.F.; Yang, Y.; Peng, J.; Song, T.X.; Xu, T.; Wei, H.K.; Jiang, S.W.; Peng, J. Identification of zinc finger protein Bcl6 as a novel regulator of early adipose commitment. Open Biol. 2016, 6, 1–14. [Google Scholar] [CrossRef] [PubMed]
  7. Laudes, M.; Christodoulides, C.; Sewter, C.; Rochford, J.J.; Considine, R.V.; Sethi, J.K.; Vidal-Puig, A.; O’Rahilly, S. Role of the POZ zinc finger transcription factor FBI-1 in human and murine adipogenesis. J. Biol. Chem. 2004, 279, 11711–11718. [Google Scholar] [CrossRef] [PubMed]
  8. Younce, C.W.; Azfer, A.; Kolattukudy, P.E. MCP-1 (monocyte chemotactic protein-1)-induced protein, a recently identified zinc finger protein, induces adipogenesis in 3T3-L1 pre-adipocytes without peroxisome proliferator-activated receptor γ. J. Biol. Chem. 2009, 284, 27620–27628. [Google Scholar] [CrossRef] [PubMed]
  9. Kawagishi, H.; Wakoh, T.; Uno, H.; Maruyama, M.; Moriya, A.; Morikawa, S.; Okano, H.; Sherr, C.J.; Takagi, M.; Sugimoto, M. Hzf regulates adipogenesis through translational control of C/EBP α. EMBO J. 2008, 27, 1481–1490. [Google Scholar] [PubMed]
  10. Sanchez-Solana, B.; Li, D.Q.; Kumar, R. Cytosolic functions of MORC2 in lipogenesis and adipogenesis. Biochim. Biophys. Acta 2014, 1843, 316–326. [Google Scholar] [CrossRef] [PubMed]
  11. Dorronsoro, A.; Lang, V.; Jakobsson, E.; Ferrin, I.; Salcedo, J.M.; Fernandez-Rueda, J.; Fechter, K.; Rodriguez, M.S.; Trigueros, C. Identification of the NF-κB inhibitor A20 as a key regulator for human adipogenesis. Cell Death Dis. 2013, 4, e972. [Google Scholar] [CrossRef] [PubMed]
  12. Charrier, A.; Wang, L.; Stephenson, E.J.; Ghanta, S.V.; Ko, C.W.; Croniger, C.M.; Bridges, D.; Buchner, D.A. Zinc finger protein 407 overexpression upregulates PPAR target gene expression and improves glucose homeostasis in mice. Am. J. Physiol. Endocrinol. Metab. 2016, 311, E869–E880. [Google Scholar] [CrossRef] [PubMed]
  13. Inoue, J.; Ihara, Y.; Tsukamoto, D.; Yasumoto, K.; Hashidume, T.; Kamimura, K.; Nakai, Y.; Hirano, S.; Shimizu, M.; Kominami, R.; et al. Identification of BCL11B as a regulator of adipogenesis. Sci. Rep. 2016, 6, 32750. [Google Scholar] [CrossRef] [PubMed]
  14. Heiker, J.T.; Kloting, N. Replication initiator 1 in adipose tissue function and human obesity. In Obesity; Litwack, G., Ed.; Elsevier Academic Press Inc.: San Diego, CA, USA, 2013; Volume 91, pp. 97–105. [Google Scholar]
  15. Lee, Y.H.; Kim, S.H.; Lee, Y.J.; Kang, E.S.; Lee, B.W.; Cha, B.S.; Kim, J.W.; Song, D.H.; Lee, H.C. Transcription factor snail is a novel regulator of adipocyte differentiation via inhibiting the expression of peroxisome proliferator-activated receptor γ. Cell. Mol. Life Sci. 2013, 70, 3959–3971. [Google Scholar] [CrossRef] [PubMed]
  16. Wu, Z.; Wang, S. Role of kruppel-like transcription factors in adipogenesis. Dev. Biol. 2013, 373, 235–243. [Google Scholar] [CrossRef] [PubMed]
  17. Jiang, S.Z.; Wei, H.K.; Song, T.X.; Yang, Y.; Peng, J.; Jiang, S.W. Transcriptome comparison between porcine subcutaneous and intramuscular stromal vascular cells during adipogenic differentiation. PLoS ONE 2013, 8, 1–15. [Google Scholar] [CrossRef] [PubMed]
  18. Collins, C.; Rommens, J.M.; Kowbel, D.; Godfrey, T.; Tanner, M.; Hwang, S.I.; Polikoff, D.; Nonet, G.; Cochran, J.; Myambo, K.; et al. Positional cloning of ZNF217 and NABC1: Genes amplified at 20q13.2 and overexpressed in breast carcinoma. Proc. Natl. Acad. Sci. USA 1998, 95, 8703–8708. [Google Scholar] [CrossRef] [PubMed]
  19. Jiang, X.K.; Zhang, C.W.; Qi, S.Y.; Guo, S.Q.; Chen, Y.; Du, E.; Zhang, H.T.; Wang, X.M.; Liu, R.L.; Qiao, B.M.; et al. Elevated expression of ZNF217 promotes prostate cancer growth by restraining ferroportin-conducted iron egress. Oncotarget 2016, 7, 84893–84906. [Google Scholar] [CrossRef] [PubMed]
  20. Zhang, Z.-C.; Zheng, L.-Q.; Pan, L.-J.; Guo, J.-X.; Yang, G.-S. Znf217 is overexpressed and enhances cell migration and invasion in colorectal carcinoma. Asian Pac. J. Cancer Prev. 2015, 16, 2459–2463. [Google Scholar] [CrossRef] [PubMed]
  21. Nguyen, N.T.; Vendrell, J.A.; Poulard, C.; Győrffy, B.; Goddard-Léon, S.; Bièche, I.; Corbo, L.; le Romancer, M.; Bachelot, T.; Treilleux, I.; et al. A functional interplay between ZNF217 and estrogen receptor α exists in luminal breast cancers. Mol. Oncol. 2014, 8, 1441–1457. [Google Scholar] [CrossRef] [PubMed]
  22. Rahman, M.T.; Nakayama, K.; Rahman, M.; Nakayama, N.; Ishikawa, M.; Katagiri, A.; Iida, K.; Nakayama, S.; Otsuki, Y.; Shih, I.-M.; et al. Prognostic and therapeutic impact of the chromosome 20q13.2 ZNF217 locus amplification in ovarian clear cell carcinoma. Cancer 2012, 118, 2846–2857. [Google Scholar] [CrossRef] [PubMed]
  23. Rooney, P.H.; Boonsong, A.; McFadyen, M.C.E.; McLeod, H.L.; Cassidy, J.; Curran, S.; Murray, G.I. The candidate oncogene ZNF217 is frequently amplified in colon cancer. J. Pathol. 2004, 204, 282–288. [Google Scholar] [CrossRef] [PubMed]
  24. Nonet, G.H.; Stampfer, M.R.; Chin, K.; Gray, J.W.; Collins, C.C.; Yaswen, P. The ZNF217 gene amplified in breast cancers promotes immortalization of human mammary epithelial cells. Cancer Res. 2001, 61, 1250–1254. [Google Scholar] [PubMed]
  25. Vendrell, J.A.; Thollet, A.; Nguyen, N.T.; Ghayad, S.E.; Vinot, S.; Biéche, I.; Grisard, E.; Josserand, V.; Coll, J.-L.; Roux, P.; et al. Znf217 is a marker of poor prognosis in breast cancer that drives epithelial-mesenchymal transition and invasion. Cancer Res. 2012, 72, 3593–3606. [Google Scholar] [CrossRef] [PubMed]
  26. Aguilo, F.; Zhang, F.; Sancho, A.; Fidalgo, M.; di Cecilia, S.; Vashisht, A.; Lee, D.F.; Chen, C.H.; Rengasamy, M.; Andino, B.; et al. Coordination of m6A mRNA methylation and gene transcription by ZFP217 regulates pluripotency and reprogramming. Cell Stem Cell 2015, 17, 689–704. [Google Scholar] [CrossRef] [PubMed]
  27. Littlepage, L.E.; Adler, A.S.; Kouros-Mehr, H.; Huang, G.; Chou, J.; Krig, S.R.; Griffith, O.L.; Korkola, J.E.; Qu, K.; Lawson, D.A.; et al. The transcription factor ZNF217 is a prognostic biomarker and therapeutic target during breast cancer progression. Cancer Discov. 2012, 2, 638–651. [Google Scholar] [CrossRef] [PubMed]
  28. Cohen, P.A.; Donini, C.F.; Nguyen, N.T.; Lincet, H.; Vendrell, J.A. The dark side of ZNF217, a key regulator of tumorigenesis with powerful biomarker value. Oncotarget 2015, 6, 41566–41581. [Google Scholar] [PubMed]
  29. Pang, F.; Zha, R.P.; Zhao, Y.J.; Wang, Q.F.; Chen, D.; Zhang, Z.F.; Chen, T.Y.; Yao, M.; Gu, J.R.; He, X.H. miR-525–3p enhances the migration and invasion of liver cancer cells by downregulating ZNF395. PLoS ONE 2014, 9, e90867. [Google Scholar] [CrossRef] [PubMed]
  30. Harder, L.; Puller, A.-C.; Horstmann, M.A. ZNF423: Transcriptional modulation in development and cancer. Mol. Cell. Oncol. 2014, 1, e969655. [Google Scholar] [CrossRef] [PubMed]
  31. Cardenas, M.G.; Oswald, E.; Yu, W.; Xue, F.; MacKerell, A.D., Jr.; Melnick, A.M. The expanding role of the BCL6 oncoprotein as a cancer therapeutic target. Clin. Cancer Res. 2017, 23, 885–893. [Google Scholar] [CrossRef] [PubMed]
  32. Spina, R.; Filocamo, G.; Iaccino, E.; Scicchitano, S.; Lupia, M.; Chiarella, E.; Mega, T.; Bernaudo, F.; Pelaggi, D.; Mesuraca, M.; et al. Critical role of zinc finger protein 521 in the control of growth, clonogenicity and tumorigenic potential of medulloblastoma cells. Oncotarget 2013, 4, 1280–1292. [Google Scholar] [CrossRef] [PubMed]
  33. Pulkka, O.P.; Nilsson, B.; Sarlomo-Rikala, M.; Reichardt, P.; Eriksson, M.; Hall, K.S.; Wardelmann, E.; Vehtari, A.; Joensuu, H.; Sihto, H. Slug transcription factor: A pro-survival and prognostic factor in gastrointestinal stromal tumour. Br. J. Cancer 2017, 116, 1195–1202. [Google Scholar] [CrossRef] [PubMed]
  34. Jin, H.; Won, M.; Shin, E.; Kim, H.M.; Lee, K.; Bae, J. EGR2 is a gonadotropin-induced survival factor that controls the expression of IER3 in ovarian granulosa cells. Biochem. Biophys. Res. Commun. 2017, 482, 877–882. [Google Scholar] [CrossRef] [PubMed]
  35. Mak, V.C.Y.; Wong, O.G.W.; Siu, M.K.Y.; Wong, E.S.Y.; Ng, W.-Y.; Wong, R.W.C.; Chan, K.-K.; Ngan, H.Y.S.; Cheung, A.N.Y. FBI-1 is overexpressed in gestational trophoblastic disease and promotes tumor growth and cell aggressiveness of choriocarcinoma via PI3K/Akt signaling. Am. J. Pathol. 2015, 185, 2038–2048. [Google Scholar] [CrossRef] [PubMed]
  36. Jin, D.; Yang, J.P.; Hu, J.H.; Wang, L.N.; Zuo, J.L. MCP-1 stimulates spinal microglia via PI3K/Akt pathway in bone cancer pain. Brain Res. 2015, 1599, 158–167. [Google Scholar] [CrossRef] [PubMed]
  37. Shi, J.M.; Hao, A.X.; Zhang, Q.; Sui, G.C. The role of YY1 in oncogenesis and its potential as a drug target in cancer therapies. Curr. Cancer Drug Targets 2015, 15, 145–157. [Google Scholar] [CrossRef] [PubMed]
  38. Motamed, N.; Rabiee, B.; Keyvani, H.; Hemasi, G.R.; Khonsari, M.; Saeedian, F.S.; Maadi, M.; Zamani, F. The best obesity indices to discriminate type 2 diabetes mellitus. Metab. Syndr. Relat. Disord. 2016, 14, 249–253. [Google Scholar] [CrossRef] [PubMed]
  39. Dweep, H.; Gretz, N. MirWalk2.0: A comprehensive atlas of microRNA-target interactions. Nat. Methods 2015, 12, 697. [Google Scholar] [CrossRef] [PubMed]
  40. Banck, M.S.; Li, S.; Nishio, H.; Wang, C.; Beutler, A.S.; Walsh, M.J. The ZNF217 oncogene is a candidate organizer of repressive histone modifiers. Epigenetics 2009, 4, 100–106. [Google Scholar] [CrossRef] [PubMed]
  41. Quinlan, K.G.; Verger, A.; Yaswen, P.; Crossley, M. Amplification of zinc finger gene 217 (ZNF217) and cancer: When good fingers go bad. Biochim. Biophys. Acta 2007, 1775, 333–340. [Google Scholar] [CrossRef] [PubMed]
  42. Ahmadian, M.; Suh, J.M.; Hah, N.; Liddle, C.; Atkins, A.R.; Downes, M.; Evans, R.M. PPARγ signaling and metabolism: The good, the bad and the future. Nat. Med. 2013, 19, 557–566. [Google Scholar] [CrossRef] [PubMed]
  43. Lyssenko, V.; Almgren, P.; Anevski, D.; Orho-Melander, M.; Sjögren, M.; Saloranta, C.; Tuomi, T.; Groop, L.; Botnia Study, G. Genetic prediction of future type 2 diabetes. PLoS Med. 2005, 2, 1299–1308. [Google Scholar] [CrossRef] [PubMed]
  44. Lehrke, M.; Lazar, M.A. The many faces of PPARγ. Cell 2005, 123, 993–999. [Google Scholar] [CrossRef] [PubMed]
  45. Ohno, H.; Shinoda, K.; Spiegelman, B.M.; Kajimura, S. PPARγ agonists induce a white-to-brown fat conversion through stabilization of PRDM16 protein. Cell Metab. 2012, 15, 395–404. [Google Scholar] [CrossRef] [PubMed]
  46. Lo, K.A.; Sun, L. Turning wat into bat: A review on regulators controlling the browning of white adipocytes. Biosci. Rep. 2013, 33, 711–719. [Google Scholar] [CrossRef] [PubMed]
  47. Rossmeisl, M.; Barbatelli, G.; Flachs, P.; Brauner, P.; Zingaretti, M.C.; Marelli, M.; Janovska, P.; Horakova, M.; Syrovy, I.; Cinti, S.; et al. Expression of the uncoupling protein 1 from the aP2 gene promoter stimulates mitochondrial biogenesis in unilocular adipocytes in vivo. Eur. J. Biochem. 2002, 269, 19–28. [Google Scholar] [CrossRef] [PubMed]
  48. Barbatelli, G.; Murano, I.; Madsen, L.; Hao, Q.; Jimenez, M.; Kristiansen, K.; Giacobino, J.P.; de Matteis, R.; Cinti, S. The emergence of cold-induced brown adipocytes in mouse white fat depots is determined predominantly by white to brown adipocyte transdifferentiation. Am. J. Physiol. Endocrinol. Metab. 2010, 298, E1244–E1253. [Google Scholar] [CrossRef] [PubMed]
  49. Giordano, A.; Frontini, A.; Cinti, S. Convertible visceral fat as a therapeutic target to curb obesity. Nat. Rev. Drug Discov. 2016, 15, 405–424. [Google Scholar] [CrossRef] [PubMed]
  50. Nov, O.; Shapiro, H.; Ovadia, H.; Tarnovscki, T.; Dvir, I.; Shemesh, E.; Kovsan, J.; Shelef, I.; Carmi, Y.; Voronov, E.; et al. Interleukin-1β regulates fat-liver crosstalk in obesity by auto-paracrine modulation of adipose tissue inflammation and expandability. PLoS ONE 2013, 8. [Google Scholar] [CrossRef] [PubMed]
  51. Fujiki, K.; Kano, F.; Shiota, K.; Murata, M. Expression of the peroxisome proliferator activated receptor γ gene is repressed by DNA methylation in visceral adipose tissue of mouse models of diabetes. BMC Biol. 2009, 7, 14. [Google Scholar] [CrossRef] [PubMed]
  52. Liu, C.; Bookout, A.L.; Lee, S.; Sun, K.; Jia, L.; Lee, C.; Udit, S.; Deng, Y.; Scherer, P.E.; Mangelsdorf, D.J.; et al. PPARγ in vagal neurons regulates high-fat diet induced thermogenesis. Cell Metab. 2014, 19, 722–730. [Google Scholar] [CrossRef] [PubMed]
  53. Konopka, B.; Szafron, L.M.; Kwiatkowska, E.; Podgorska, A.; Zolocinska, A.; Pienkowska-Grela, B.; Dansonka-Mieszkowska, A.; Balcerak, A.; Lukasik, M.; Stachurska, A.; et al. The significance of c.690G>T polymorphism (rs34529039) and expression of the CEBPA gene in ovarian cancer outcome. Oncotarget 2016, 7, 67412–67424. [Google Scholar] [CrossRef] [PubMed]
  54. Chen, H.-F.; Wu, K.-J. Endothelial transdifferentiation of tumor cells triggered by the twist1-jagged1-KLF4 axis: Relationship between cancer stemness and angiogenesis. Stem Cells Int. 2016, 2016, 1–10. [Google Scholar] [CrossRef] [PubMed]
  55. Kim, H.-J.; Min, J.-Y.; Min, K.-B. Replication of early B-cell factor 1 (EBF1) gene-by-psychosocial stress interaction effects on central adiposity in a Korean population. J. Prev. Med. Public Health 2016, 49, 253–259. [Google Scholar] [CrossRef] [PubMed]
  56. Wang, L.; Jin, Q.; Lee, J.E.; Su, I.H.; Ge, K. Histone H3K27 methyltransferase Ezh2 represses Wnt genes to facilitate adipogenesis. Proc. Natl. Acad. Sci. USA 2010, 107, 7317–7322. [Google Scholar] [CrossRef] [PubMed]
  57. Cawthorn, W.P.; Bree, A.J.; Yao, Y.; Du, B.; Hemati, N.; Martinez-Santibanez, G.; MacDougald, O.A. Wnt6, Wnt10a and Wnt10b inhibit adipogenesis and stimulate osteoblastogenesis through a β-catenin-dependent mechanism. Bone 2012, 50, 477–489. [Google Scholar] [CrossRef] [PubMed]
  58. Man, X.F.; Tan, S.W.; Tang, H.N.; Guo, Y.; Tang, C.Y.; Tang, J.; Zhou, C.L.; Zhou, H.D. miR-503 inhibits adipogenesis by targeting bone morphogenetic protein receptor 1a. Am. J. Transl. Res. 2016, 8, 2727–2737. [Google Scholar] [PubMed]
  59. Chen, C.; Peng, Y.D.; Peng, Y.L.; Peng, J.; Jiang, S.W. miR-135a-5p inhibits 3T3-L1 adipogenesis through activation of canonical Wnt/β-catenin signaling. J. Mol. Endocrinol. 2014, 52, 311–320. [Google Scholar] [CrossRef] [PubMed]
  60. Dai, X.; Pang, W.J.; Zhou, Y.F.; Yao, W.Y.; Xia, L.; Wang, C.; Chen, X.; Zen, K.; Zhang, C.Y.; Yuan, Y.Z. Altered profile of serum microRNAs in pancreatic cancer-associated new-onset diabetes mellitus. J. Diabetes 2016, 8, 422–433. [Google Scholar] [CrossRef] [PubMed]
  61. Gong, M.; Ma, Y.L.; Letu, G.; Wang, H.; Huang, T.H.; Ni, H.W.; Wu, M.J.; Zhou, Z.Q.; Li, M.; Zou, X.N. Expression pattern and regulation of miR-19a and CCND1 in C3H10T1/2 chondrogenic differentiation. Int. J. Clin. Exp. Med. 2016, 9, 13958–13964. [Google Scholar]
  62. Dennis, G., Jr.; Sherman, B.T.; Hosack, D.A.; Yang, J.; Gao, W.; Lane, H.C.; Lempicki, R.A. DAVID: Database for annotation, visualization, and integrated discovery. Genome Biol. 2003, 4, R60. [Google Scholar] [CrossRef]
Figure 1. Zfp217 is implicated in adipogenesis based on Gene Expression Omnibus (GEO) datasets. (A) The heatmap of expression profiling of Zfp217 and marker genes in GSE76131. The resulting transcriptomic data-set includes six induction differentiation time points (0, 6, 48, 96, 192 and 384 h) in human simpson-golabi-behmel syndrome (SBGS) pre-adipocyte cells; (B,C) The heatmap of expression profiling of Zfp217 and marker genes in GSE87113. Expression profiling by RNA-seq during adipogenesis (0, 1, 2, 4 h, 2 and 7 days) in 3T3-L1 (B) and brown preadipocytes (C) in culture as indicated in the x axis, eBAT: embryo_BAT; aBAT: adult_BAT; (D) The line chart of expression profiling of Zfp217 and Pparg in diabetes mellitus (DM, the red group as indicated in the x axis), impaired glucose tolerance (IGT, the yellow group as indicated in the x axis) and normal glucose tolerance (NGT, the blue group as indicated in the x axis) adipose tissue samples. Data were obtained from GSE27951; and (E) The line chart of expression profiling of Zfp217 and marker genes in GSE20054. Expression profiling by Ezh2-flox/flox preadipocytes infected with retroviruses expressing Cre or vector alone.
Ijms 18 01367 g001
Figure 2. Relative expression of Zfp217 in adipogenesis and different adipose tissues. (A) The expression profiles of Zfp217 during C3H10T1/2 adipogenesis (0, 6, 12, 24, 36, 48 h, 3, 4, 6, 8 and 10 days) (n = 3); (B) The protein level of Zfp217 and Pparg2 during C3H10T1/2 adipogenesis (0, 1, 2, 3, 4, 6, 8 and 10 days); (C) Relative expression of Pparg2 and Zfp217 using five kinds of adipose tissues of HFD/NCD. The five adipose tissues as indicated in the x axis (n = 5); and (D) The mRNA level of Zfp217 and pro-adipogenic marker genes (as indicated in the y axis) in NIH3T3, C3H10T1/2 and 3T3-L1 at non-differentiated and differentiated 6 h (n = 3). Data was standardized with β-actin and represented as means ± SEM. * p < 0.05, ** p < 0.01 versus control.
Ijms 18 01367 g002
Figure 3. The effects of Zfp217 “gain-of-function” and “loss-of-function” on lipid droplet formation and triglyceride content in C3H10T1/2 and 3T3-L1. (A) Oil red O staining of Zfp217 “gain-of-function” and “loss-of-function” after 8 days of differentiation. Scale bar indicates 100 μm; and (B) Triglyceride GPO-POD assay kit (GPO: glycerol phosphate dehydrogenase; POD: peroxidase) and Bicinchoninic Acid (BCA) protein assay kit were used for analysis of the content of triglyceride. Total triglyceride was standardized with total protein and represented as means ± SEM (n = 4). * p < 0.05, ** p < 0.01 versus control.
Ijms 18 01367 g003
Figure 4. Zfp217 suppresses cell proliferation and interacts with Ezh2, which represses Wnt signaling genes, to facilitate adipogenesis. (A) DNA synthesis of C3H10T1/2 cells was measured by 5-ethynyl-2′-deoxyuridine (EdU) incorporation assay after the indicated transfection. The EdU staining (red dots) represents the population of newborn cells. Hoechst 33342 staining (blue dots) was used to label cell nuclei. Scale bar indicates 100 μm; (B) EdU incorporation quantitative analysis. Five microscopic fields were randomly selected. EdU positive cells (%) were quantified by Image J, which was calculated by the formula: EdU positive cell (100%) = red dots/(red dots + blue dots) × 100%. All data were obtained from three reproducible experiments; (C) In the mammalian two-hybrid system, the Zfp217-Ezh2 interaction is confirmed by significantly higher luciferase activity in cells transfected with pACT-Zfp217 and pBIND-Ezh2, compared to cells transfected with one expression vector and one empty vector or two empty vectors. Results were displayed as firefly luciferase activity normalized to renilla luciferase activity and represented as means ± SEM (n = 4); (D) Schematic representation of the Mammalian Two-Hybrid System. The pG5luc Vector contains five GAL4 binding sites upstream of a minimal TATA box, which in turn is upstream of the firefly luciferase gene. The interaction between the two test proteins, expressed as GAL4-X and VP16-Y fusion constructs. An interaction between proteins X and Y brings the VP16 and GAL4 domains into close proximity, and results in an increase in luciferase expression over the negative controls; (E) The mRNA levels of Wnt6 and Wnt10b at non-induction, two days and four days post-adipogenic induction after treatment with pcDNA3.1-Zfp217 or empty pcDNA3.1 vector (n = 3); and (F) The mRNA levels of Cebpa and Pparg2 at four days post-adipogenic induction after treatment with pcDNA3.1-Zfp217 or empty pcDNA3.1 vector/Zfp217 siRNA or siRNA control (n = 3). Reverse transcriptase-quantitative polymerase chain reaction (qRT-PCR) data were standardized with β-actin and represented as means ± SEM. * p < 0.05, ** p < 0.01 versus control.
Ijms 18 01367 g004
Figure 5. The miRNAs of targeting Zfp217. (A) The prediction of miRNAs which targeting Zfp217. The brilliant blue ring represents the predicted miRNAs in human (Homo sapiens, hsa). The pink ring represents the predicted miRNAs in mouse (Mus musculus, mmu). The gray blue ring represents the predicted miRNAs in both human and mouse. Venn diagram was output to statistical result; (B) Conservation of the miRNA binding site in the Zfp217-3′ unstranslated (UTR) region. The miRNA seed match region is highlighted in red; (C,D) Two pmirGLO vector constructs, containing either the Zfp217-3′ UTR-wt or the Zfp217-3′ UTR-mut with corresponding miRNA seed region, were transfected into BHK-21 cells either alone or in combination with negative control or each miRNA mimics. Renilla luciferase activity was used to normalize firefly luciferase activity. Data represents means ± SEM (n = 4); and (E,F) The expression levels of Zfp217 was measured by Western blot and qRT-PCR for different treated groups as indicated. The qRT-PCR data represents means ± SEM (n = 3). * p < 0.05, ** p < 0.01 versus control.
Ijms 18 01367 g005aIjms 18 01367 g005b
Figure 6. C3H10T1/2 (A) and 3T3-L1 (B) cells were stained with Oil Red O for different treated groups as indicated. One out of three independent but comparable experiments is shown. Scale bar indicates 100 μm; and (C) Schematic diagrams illustrating the mechanism of inducing adipogenesis by Zfp217. Zfp217 positively regulates adipogenesis by suppressing cell proliferation and interacting with Ezh2 which represses Wnt signaling genes. Zfp217 is directly targeted by miR-503-5p, miR-135a-5p and miR-19a-3p which impair adipocyte differentiation.
Ijms 18 01367 g006

