Article

Gibberellic Acid Signaling Is Required to Induce Flowering of Chrysanthemums Grown under Both Short and Long Days

College of Horticulture, Nanjing Agricultural University, Key Laboratory of Landscape Agriculture, Ministry of Agriculture, Nanjing 210095, China
*
Authors to whom correspondence should be addressed.
Int. J. Mol. Sci. 2017, 18(6), 1259; https://doi.org/10.3390/ijms18061259
Submission received: 5 May 2017 / Revised: 1 June 2017 / Accepted: 6 June 2017 / Published: 12 June 2017
(This article belongs to the Section Molecular Plant Sciences)

Abstract

:
Flower bud formation and flowering in chrysanthemums occur under short day conditions (SD), but the molecular basis for the switch to reproductive growth is less well understood than in model plants. Here, a spontaneous mutant able to flower under long days is described. In an attempt to reveal the pathway(s) involved in the formation of flower buds under contrasting daylengths, transcriptome sequencing was carried out in plants grown both under SD and long day conditions (LD). A number of differentially transcribed genes involved in the various known flowering pathways were identified. Both circadian clock genes and Chrysanthemum FLOWERING LOCUS T Like3 (CmFTL3) were up-regulated under SD, thereby inducing floral bud formation and flowering. The gibberellin (GA) signaling pathway-related genes Gibberellin 20-oxidase (GA20ox) and Gibberellin receptor (GID1) were up-regulated in the mutant under LD, while the catabolic genes Gibberellin 2-oxidase (GA2ox) and GA-INSENSITIVE (GAI) were down-regulated, thereby inducing the transcription of SUPPRESSOR OF OVEREXPRESSION OF CONSTANS 1 (SOC1) and LEAFY (LFY). The GA content of the leaf was higher in the mutant than in the wild type (WT) under LD and SD, and the mutant has more branching than WT plants under LD or SD. When treated with GA, the mutant flowered earlier under both SD and LD relative to WT, but there was no detectable phenotype difference between the two lines. The indication was that the photoperiod pathway majorly regulates flower bud formation and flowering time in chrysanthemums under SD. The GA signaling pathway only plays a subsidiary role for flowering. However, the GA signaling pathway predominated for flowering under LD.

Graphical Abstract

1. Introduction

Flowering is a key event in both seed and ornamental crops [1]. The switch to reproductive growth occurs in response to a variety of endogenous and environmental cues, and in the model plant Arabidopsis thaliana at least, six major pathways (photoperiod, vernalization, autonomous, gibberellin (GA), ambient temperature and aging) are known to regulate the floral transition process [2,3]. In nature (except at the Equator), the photoperiod varies throughout the year, and plants sense its length through certain photoreceptor molecules [4,5]. The genes of circadian rhythms (including GIGANTEA, GI; TIMING OF CAB transcription 1/PSEUDO-RESPONSE REGULATOR 1, TOC1/PRR1; CIRCADIAN CLOCK ASSOCIATED 1, CCA1 and LATE ELONGATED HYPOCOTYL, LHY) regulate CONSTANS (CO) and thus mediate flowering [6,7]. FT is transcribed in the leaf vasculature under long day conditions (LD); when its transcript reaches the shoot apical meristem, both APETALA1 (AP1) and LFY are induced, which in turn triggers flowering [8,9].
Gibberellins (GAs) are biosynthesized from ent-kaurenoic acid via ent-kaurene; ent-copalyl diphosphate synthase (CPS) plays an important role in GA formation [10]. GA makes an important contribution to the switch to reproductive growth [11]. The activity of GA20ox determines the endogenous concentration of GA in the stem apical meristem, while GA2ox catalyzes GA inactivation [12,13]. GA regulates SOC1 and LFY gene activity; overexpression of SOC1 rescued GA-deficient mutant ga1-3 to induce flowering [14]. GA promoted FT expression independent of CO genes under LD [15]. GA suppresses the production of the DELLA protein (including GAI; REPRESSOR OF GA1-3, RGA1-3; RGA-LIKE1-3, RGL1-3), which is antagonistic to GA signaling [16,17]. In addition, members of other transcription factor families, namely MYB, MADS, AP2/ERF, bHLH, WRKY and TCP, are also involved in floral induction and flowering [18,19,20,21,22]. For example, FLOWERING LOCUS C (FLC) transcription is regulated by the MADS box transcription factor SHORT VEGETATIVE PHASE (SVP), the product of which binds to the promoters of FT and SOC1 [3,23].
Chrysanthemum (Chrysanthemum morifolium), a highly prized ornamental species, is a short day plant [24], which typically flowers in the fall. Its genome harbors three FT orthologs, termed FTL1 through 3. FTL3 appears to encode a major component of the photoperiod pathway, which promotes flowering under SD [25]. Transcription of the FTLs is repressed under LD. Recently, a spontaneous mutant of the chrysanthemum variety ‘Jinba’ was discovered that was able to flower under LD. Here, the effect of GA on the flowering behavior of the mutant was examined, and a transcriptomic analysis was carried out to identify the genes, which are differentially transcribed between the mutant and the wild type.

2. Results

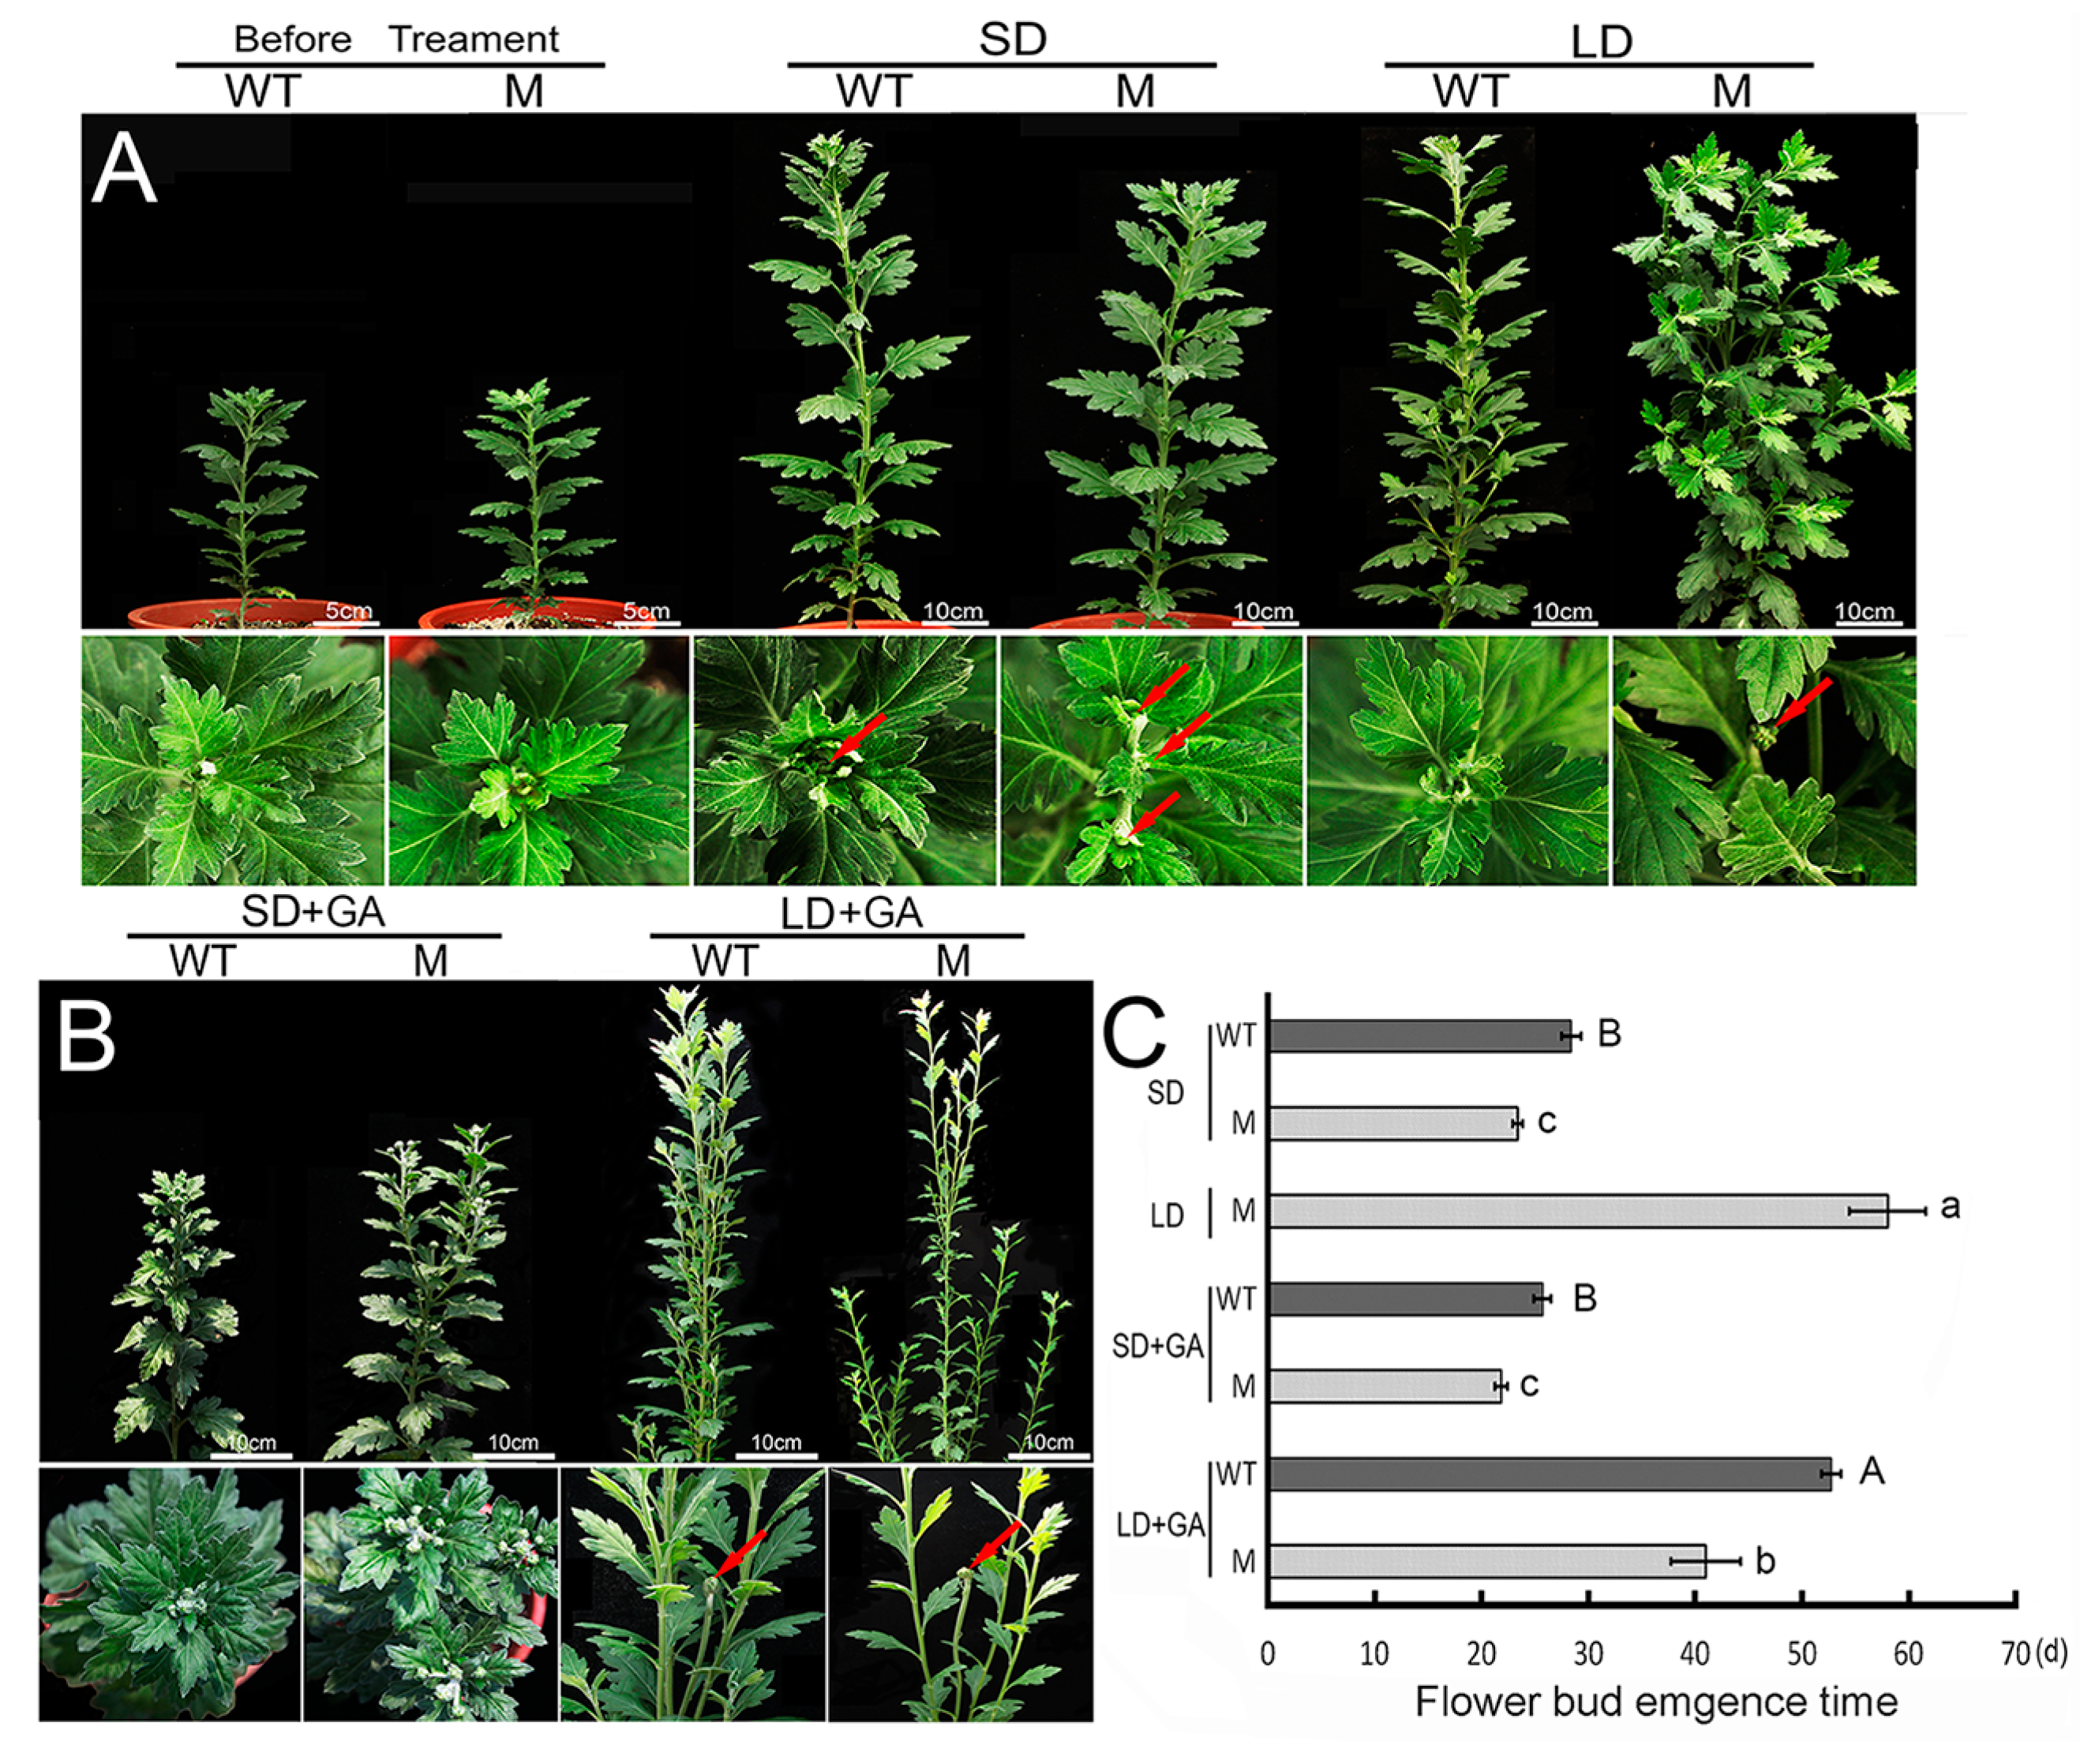
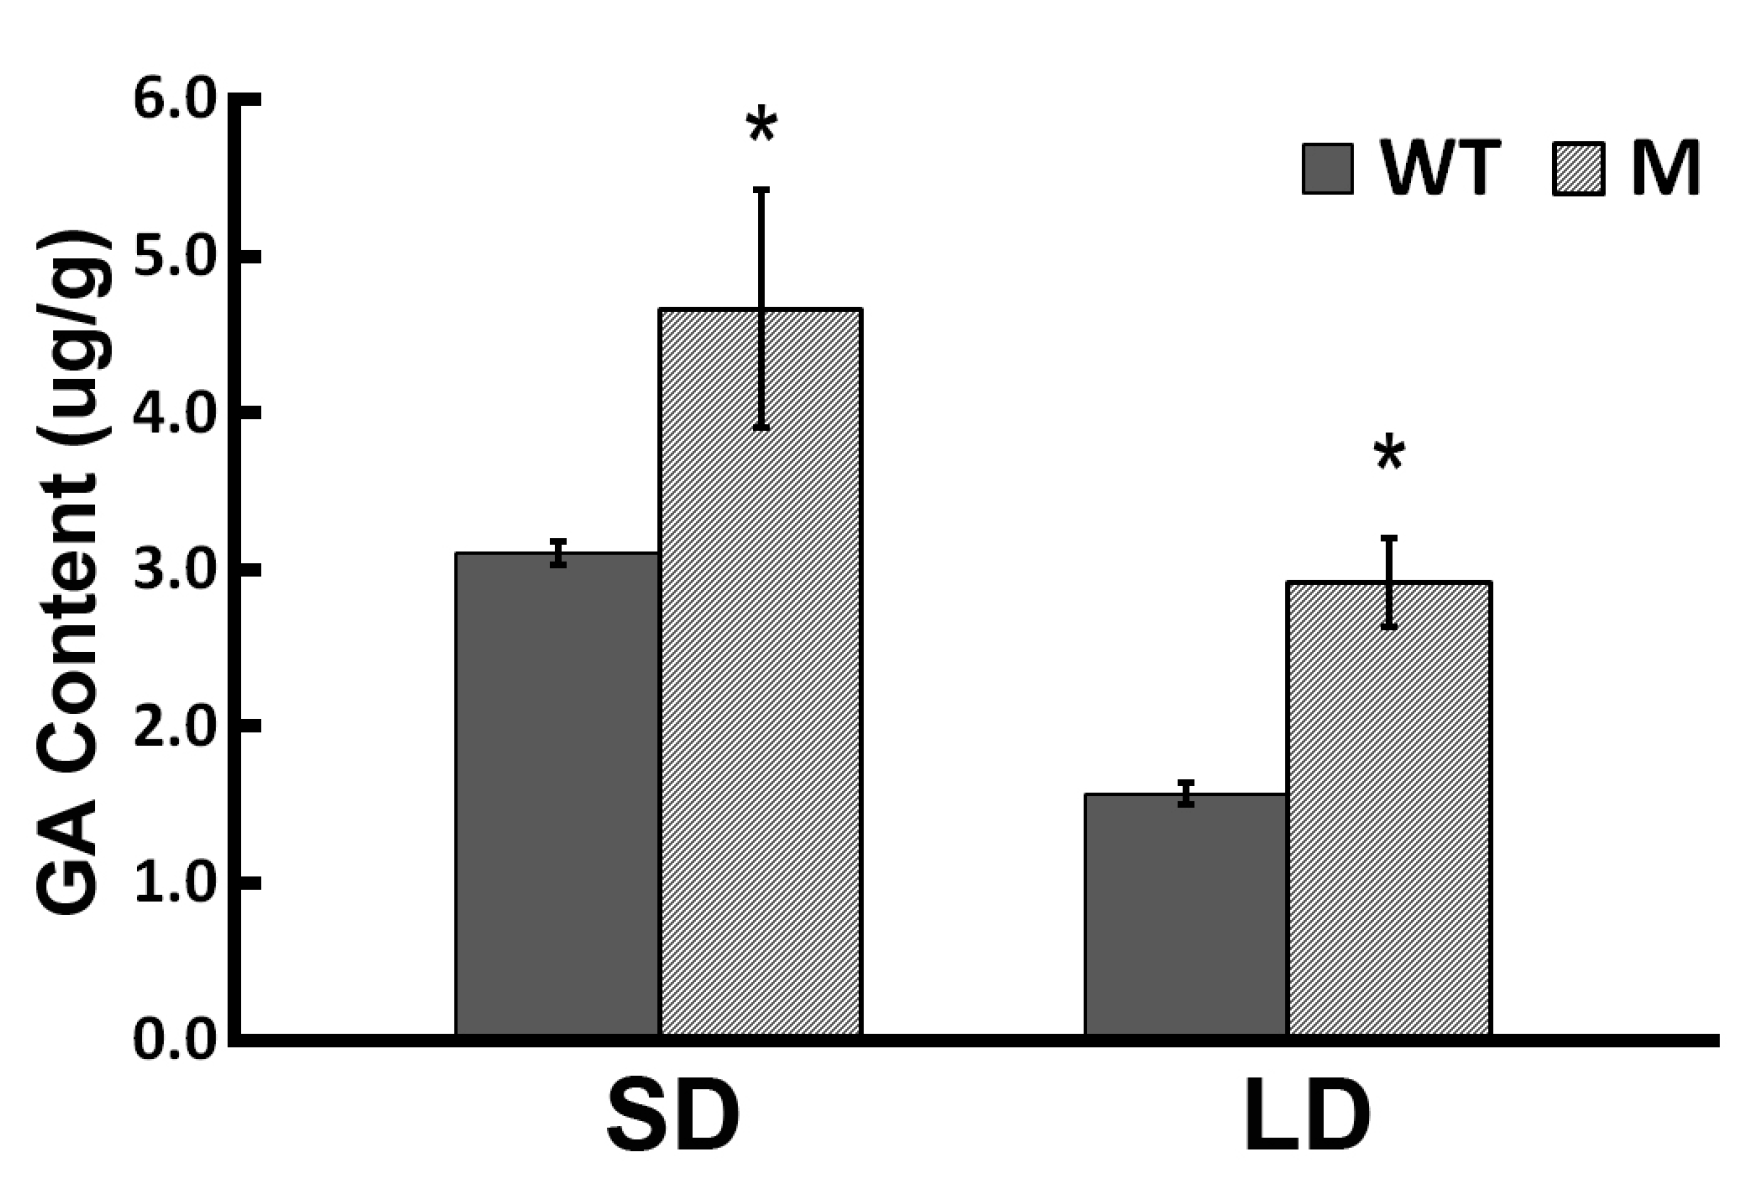
2.1. Flowering Behavior of the ‘Jinba’ WT and Mutant in Response to GA Treatment

The timing of flower bud emergence of both the WT and mutant (M) forms of ‘Jinba’ was investigated by growing them under both SD and LD (Figure 1A). Under SD, the first flower buds emerged in 29 and 24 days, respectively (Figure 1C). Under LD, reaching this stage took about 58 days, while WT plants never flowered (data not shown). The endogenous concentration of GA was determined in both young leaves of WT and Mutant (M) plants grown under either LD or SD (respectively, WT-SD, M-SD, WT-LD and M-LD) and those of WT and M plants still in the vegetative stage, sampled prior to the imposition of a controlled photoperiod (Figure 2). Under LD, the GA concentration was substantially higher in M than in WT plants, but there was no significant difference between M and WT in plants grown under SD (Figure 2). When GA was sprayed on the leaf surface of the plants (Figure 1B), the time taken to reach flower bud emergence was reduced to 26 days for WT and to 22 days for M in plants grown under SD, while under LD it was 53 and 41 days, respectively (Figure 1C).

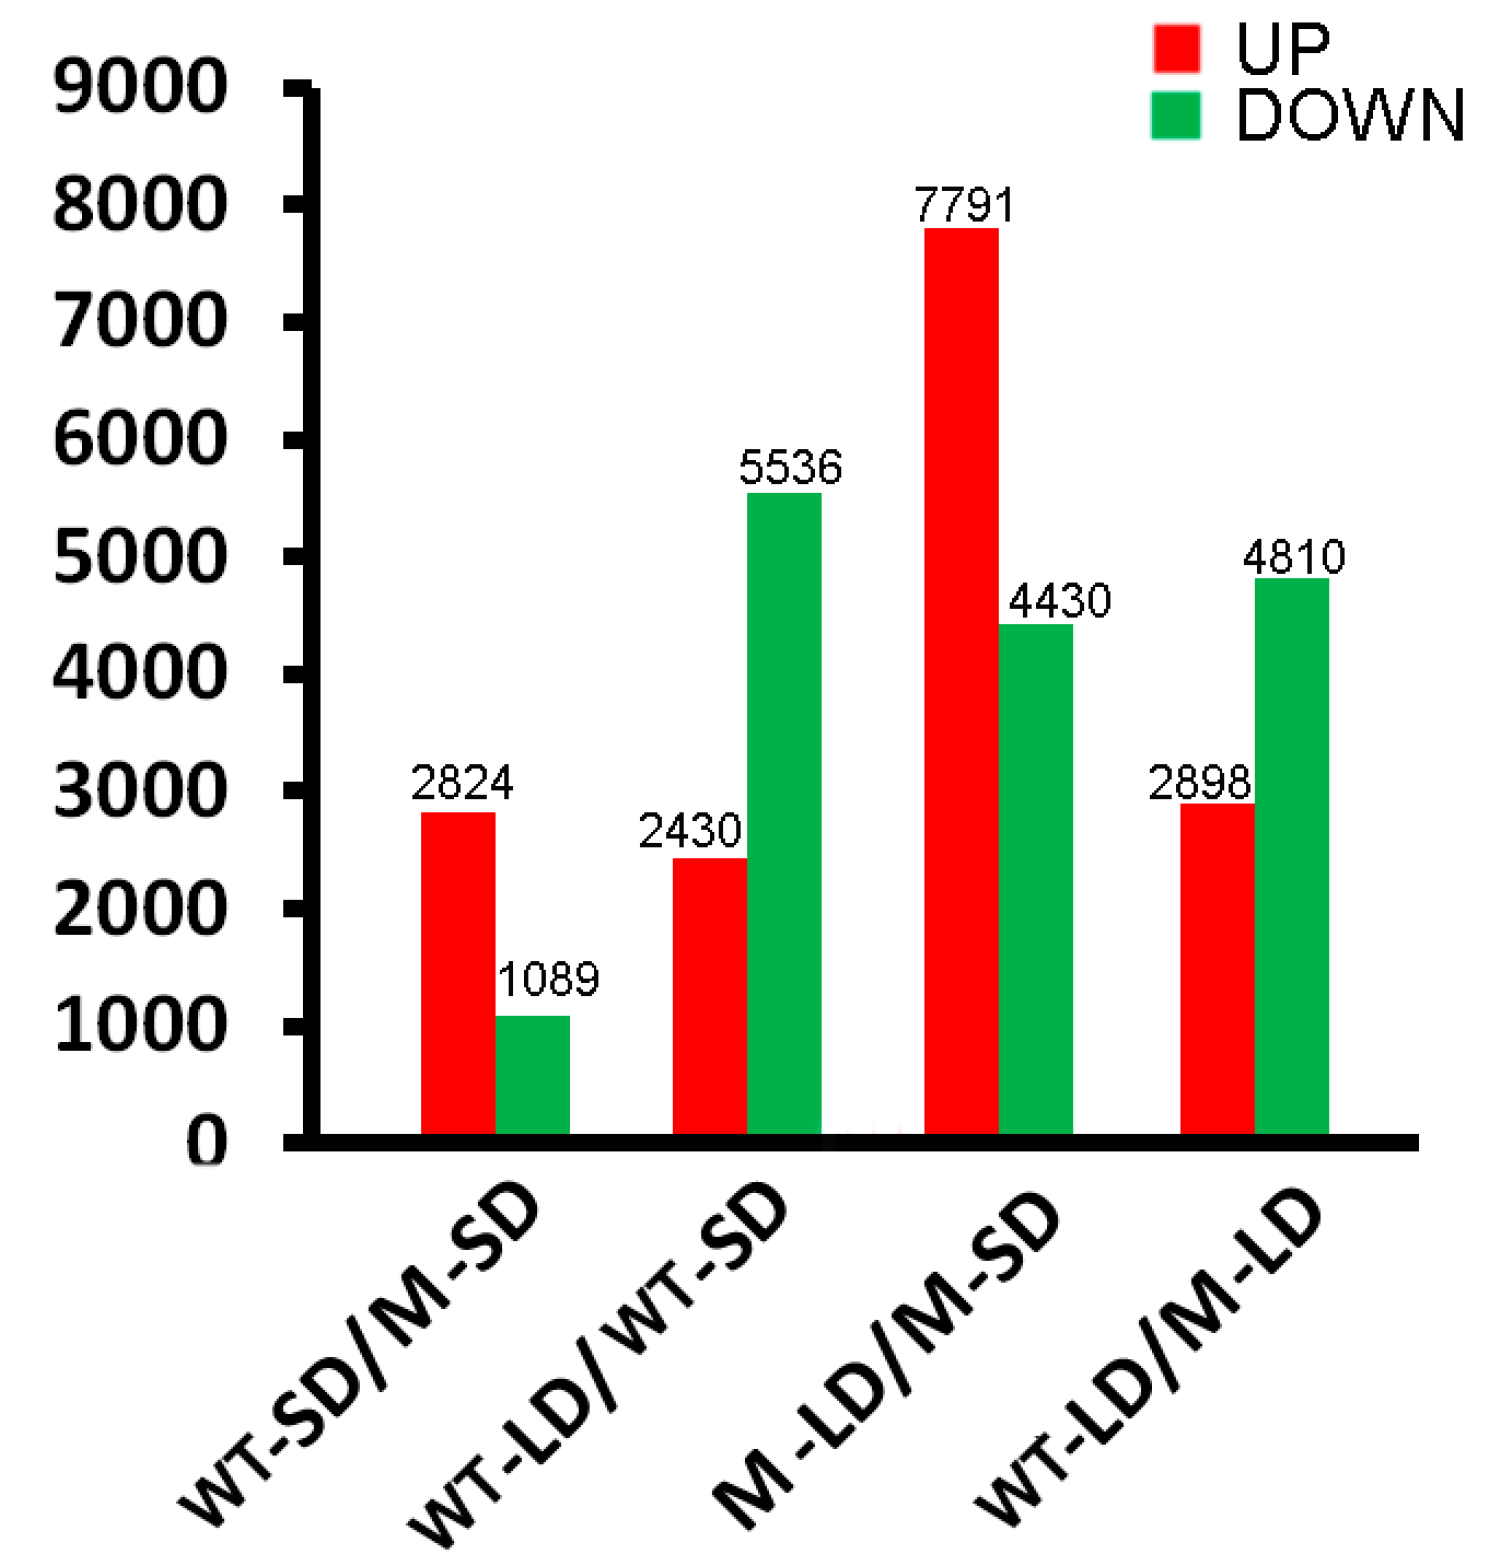
2.2. Transcriptome Sequencing and Bioinformatic Analysis

The transcriptome of both WT and M plants grown under either LD or SD was sampled when the M plants were at flower bud differentiation stage, but the WT plants remained either vegetative (LD) or were flowering (SD). Four cDNA libraries were assembled (M-LD, WT-LD, M-SD and WT-SD) and sequenced using the RNA-Seq platform. A total of 20,897,890,920 nt was acquired (Table 1), from which 107,596 unigenes were identified. The unigenes together represented 110,025,243 nt of sequence, and were of mean length 1023 nt; the N50 was 1600 nt. About 60% of the unigenes have been previously annotated: 61,666 in the NR database, 45,863 in NT, 42,262 in Swiss-Prot, 39,147 in KEGG, 23,818 in COG and 46,064 in GO. The total number of coding sequences identified was 65,257 including 60,752 mapped to the protein database and 4505 coding sequences are predicted. An analysis of those represented in the NR database showed that 62% were associated with other sequences at an E-value less than 1 × 10⁻³⁰, while 73% of them shared between 80–100% identities (Figure S1A,B). The most commonly occurring species harboring these matching sequences was grapevine (26.0%), followed by tomato (16.6%) (Figure S1C). A COG analysis divided the unigenes into 25 categories (Figure S2A); the largest group was “general functions” (group R, 17.7% of the genes), followed by “replication, recombination and repair” (group L, 9.4%) and “transcription” (group K, 9.2%). A GO analysis identified the unigenes as being involved in 22 biological processes, 17 cellular components and 16 molecular functions (Figure S2B).

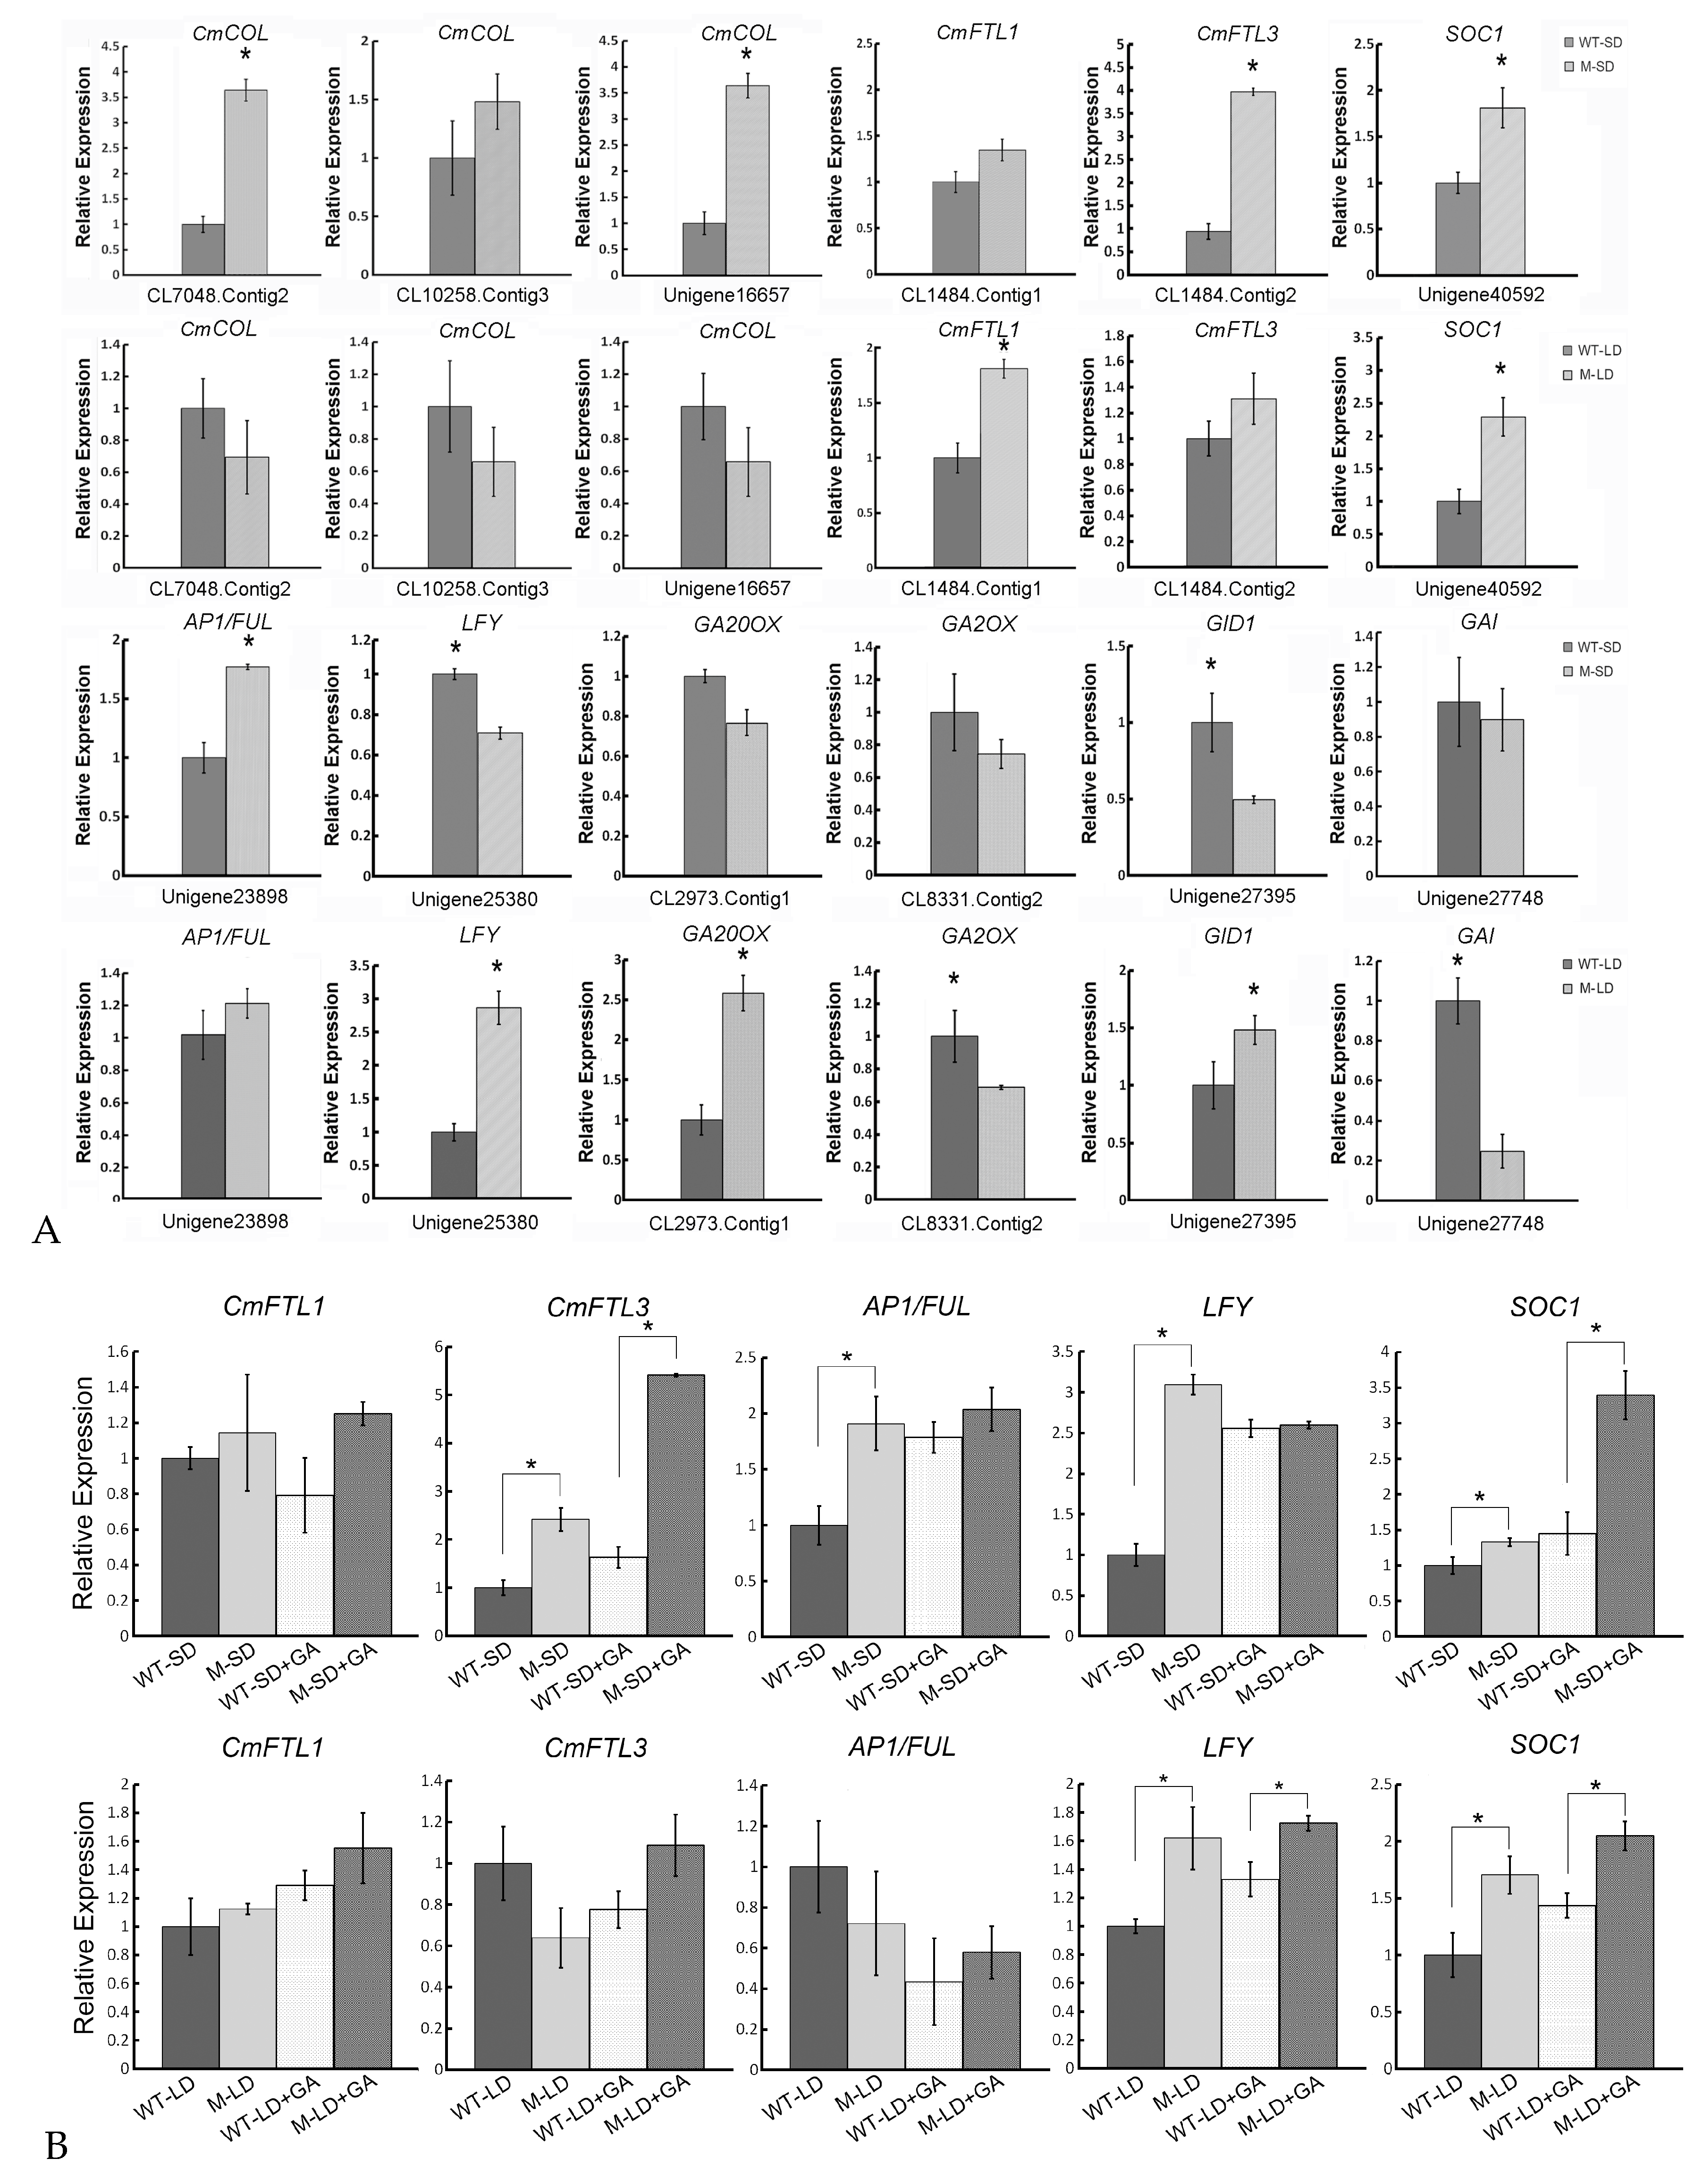
2.3. The Transcription Behavior of Genes Involved in the Determination of Flowering Time

A representation of the genes which were differentially transcribed in the contrasts WT-LD/WT-SD, M-LD/M-SD, WT-SD/M-SD and WT-LD/M-LD is given in Figure S3. Differential transcription was defined as the ratio of transcript abundance being either >2 (up-regulation) or <0.5 (down-regulation), along with a p value of <0.001. In all, in the contrast WT-SD/M-SD, 2824 transcripts proved to be more abundant and 1089 less abundant in WT, while in WT-LD/M-LD, the equivalent numbers of transcripts were 2898 and 4810, respectively. In the contrast WT-LD/WT-SD, 2430 genes were up-regulated and 5536 down-regulated, while in M-LD/M-SD, the equivalent numbers of genes were 7791 and 4430, respectively (Figure 3, Figures S3 and S4).
A particular focus was placed on genes involved in the photoperiod, GA signaling, aging, ambient temperature and autonomous pathway (Table 2 and Table S1). The M-LD/WT-LD was of interest since plants in the latter category reached flowering, while those in the former category did not. The photoperiod pathway genes (TOC1, PRR5, LHY, COL and CmFTL3) were not up-regulated in M, but three genes belonging to the GA pathway (GA20ox, GA2ox and GID1) were. In addition, CmFTL1 transcript abundance was lower in both WT and M plants grown under SD than in the same genotypes grown under LD. Both SOC1 and FLO/LFY-like transcripts were noticeably more abundant in M-LD than in WT-LD, suggesting their involvement in the capacity of M plants to flower under LD. In M-SD/WT-SD, TOC1, LHY, PRR5, COL, SOC1 and CmFTL3 were all more strongly transcribed in M than in WT. The GA pathway gene CPS strongly increased in M-SD/WT-SD, while the other genes involving GA20ox, GA2ox and GID1 showed no significant differences in M-SD/WT-SD. In addition, the gene SQUAMOSA PROMOTER BINDING PROTEIN-LIKE5 (SPL5) was similarly up-regulated in both plant types under LD. Transcription of the inhibition flowering gene SVP was strongly suppressed in both WT and M plants under SD. The transcript abundance of FLC and FRI was higher in M plants grown under SD than in those grown under LD.

2.4. Differentially Transcribed Transcription Factors

The differential transcription of members of the transcription factor families MYB, MADS, AP2/ERF, bHLH, WRKY and TCP (Table S2) was considered to be significant, as their products are known to make an important contribution to plant development. To be designated as differentially transcribed, the threshold ratio of transcript abundance was required to be >2 (up-regulation) or <0.5 (down-regulation), and the p value < 0.001. In WT-SD/WT-LD, 24 MYB, 10 MADS-box, 1 AP2/ERF, 13 bHLH, 12 WRKY and 1 TCP transcription factors were differentially transcribed, while in the same contrast in M (M-SD/M-LD), there were 39 MYB, 7 MADS-box, 1 AP2/ERF, 13 bHLH, 29 WRKY and 6 TCP transcription factors. The comparison M-SD/WT-SD revealed the up-regulation of 5 MYB, 5 MADS-box, 4 bHLH and 1 TCP transcription factor, while in M-LD/WT-LD, 9 MYB, 4 MADS-box, 3 bHLH and 19 WRKY transcription factors were up-regulated.

2.5. qRT-PCR-Based Validation of RNA-Seq Acquired Transcript Abundance

Validation of the differential transcription of the photoperiod and GA pathway genes derived from the RNA-Seq analysis was obtained using qRT-PCR (Figure 4). The analysis showed that CmCOL (CL7048.Contig2, Unigene16657), CmFTL3 (CL1484.Contig2), SOC1 (Unigene40592), AP1/FUL (Unigene23898) and LFY (Unigene25380) were all more strongly transcribed in M-SD than in WT-SD. However, the GA pathway genes involving GA20ox (CL2973.Contig1), GA2ox (CL8831.Contig2) and GAI (Unigene27748) showed no significant difference; only GID1 (Unigene27395) appeared to be differentially transcribed in M-SD. Under LD conditions, the abundance of CmFTL1 (CL1484.Contig1), GA20ox (CL2973.Contig1), GID1 (Unigene27395), SOC1 (Unigene40592) and LFY (Unigene25380) transcript was markedly greater in M-LD than in WT-LD. The expression of catabolic gene GA2ox (CL8831.Contig2) and GAI (Unigene27748) showed down-regulation in mutant plants under long days, while there was no evidence for the differential transcription of CmCOL (CL7048.Contig2, CL10258.Contig3, Unigene16657) and CmFTL3 (CL1484.Contig2).
Following GA treatment, compared with the WT, SOC1 and LFY were both more strongly induced in mutant plants either in short days or in long days, while CmFTL3 showed significant induction in short days (Figure 4B). The gene AP1/FUL showed significant up-regulation in short days, but no significant difference in long days.

3. Discussion

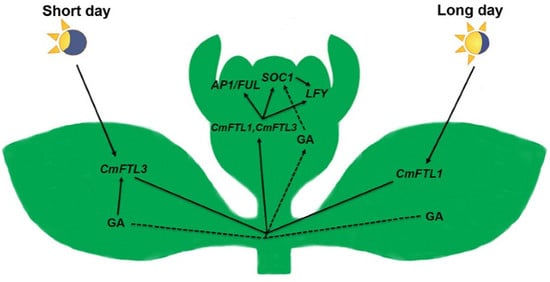
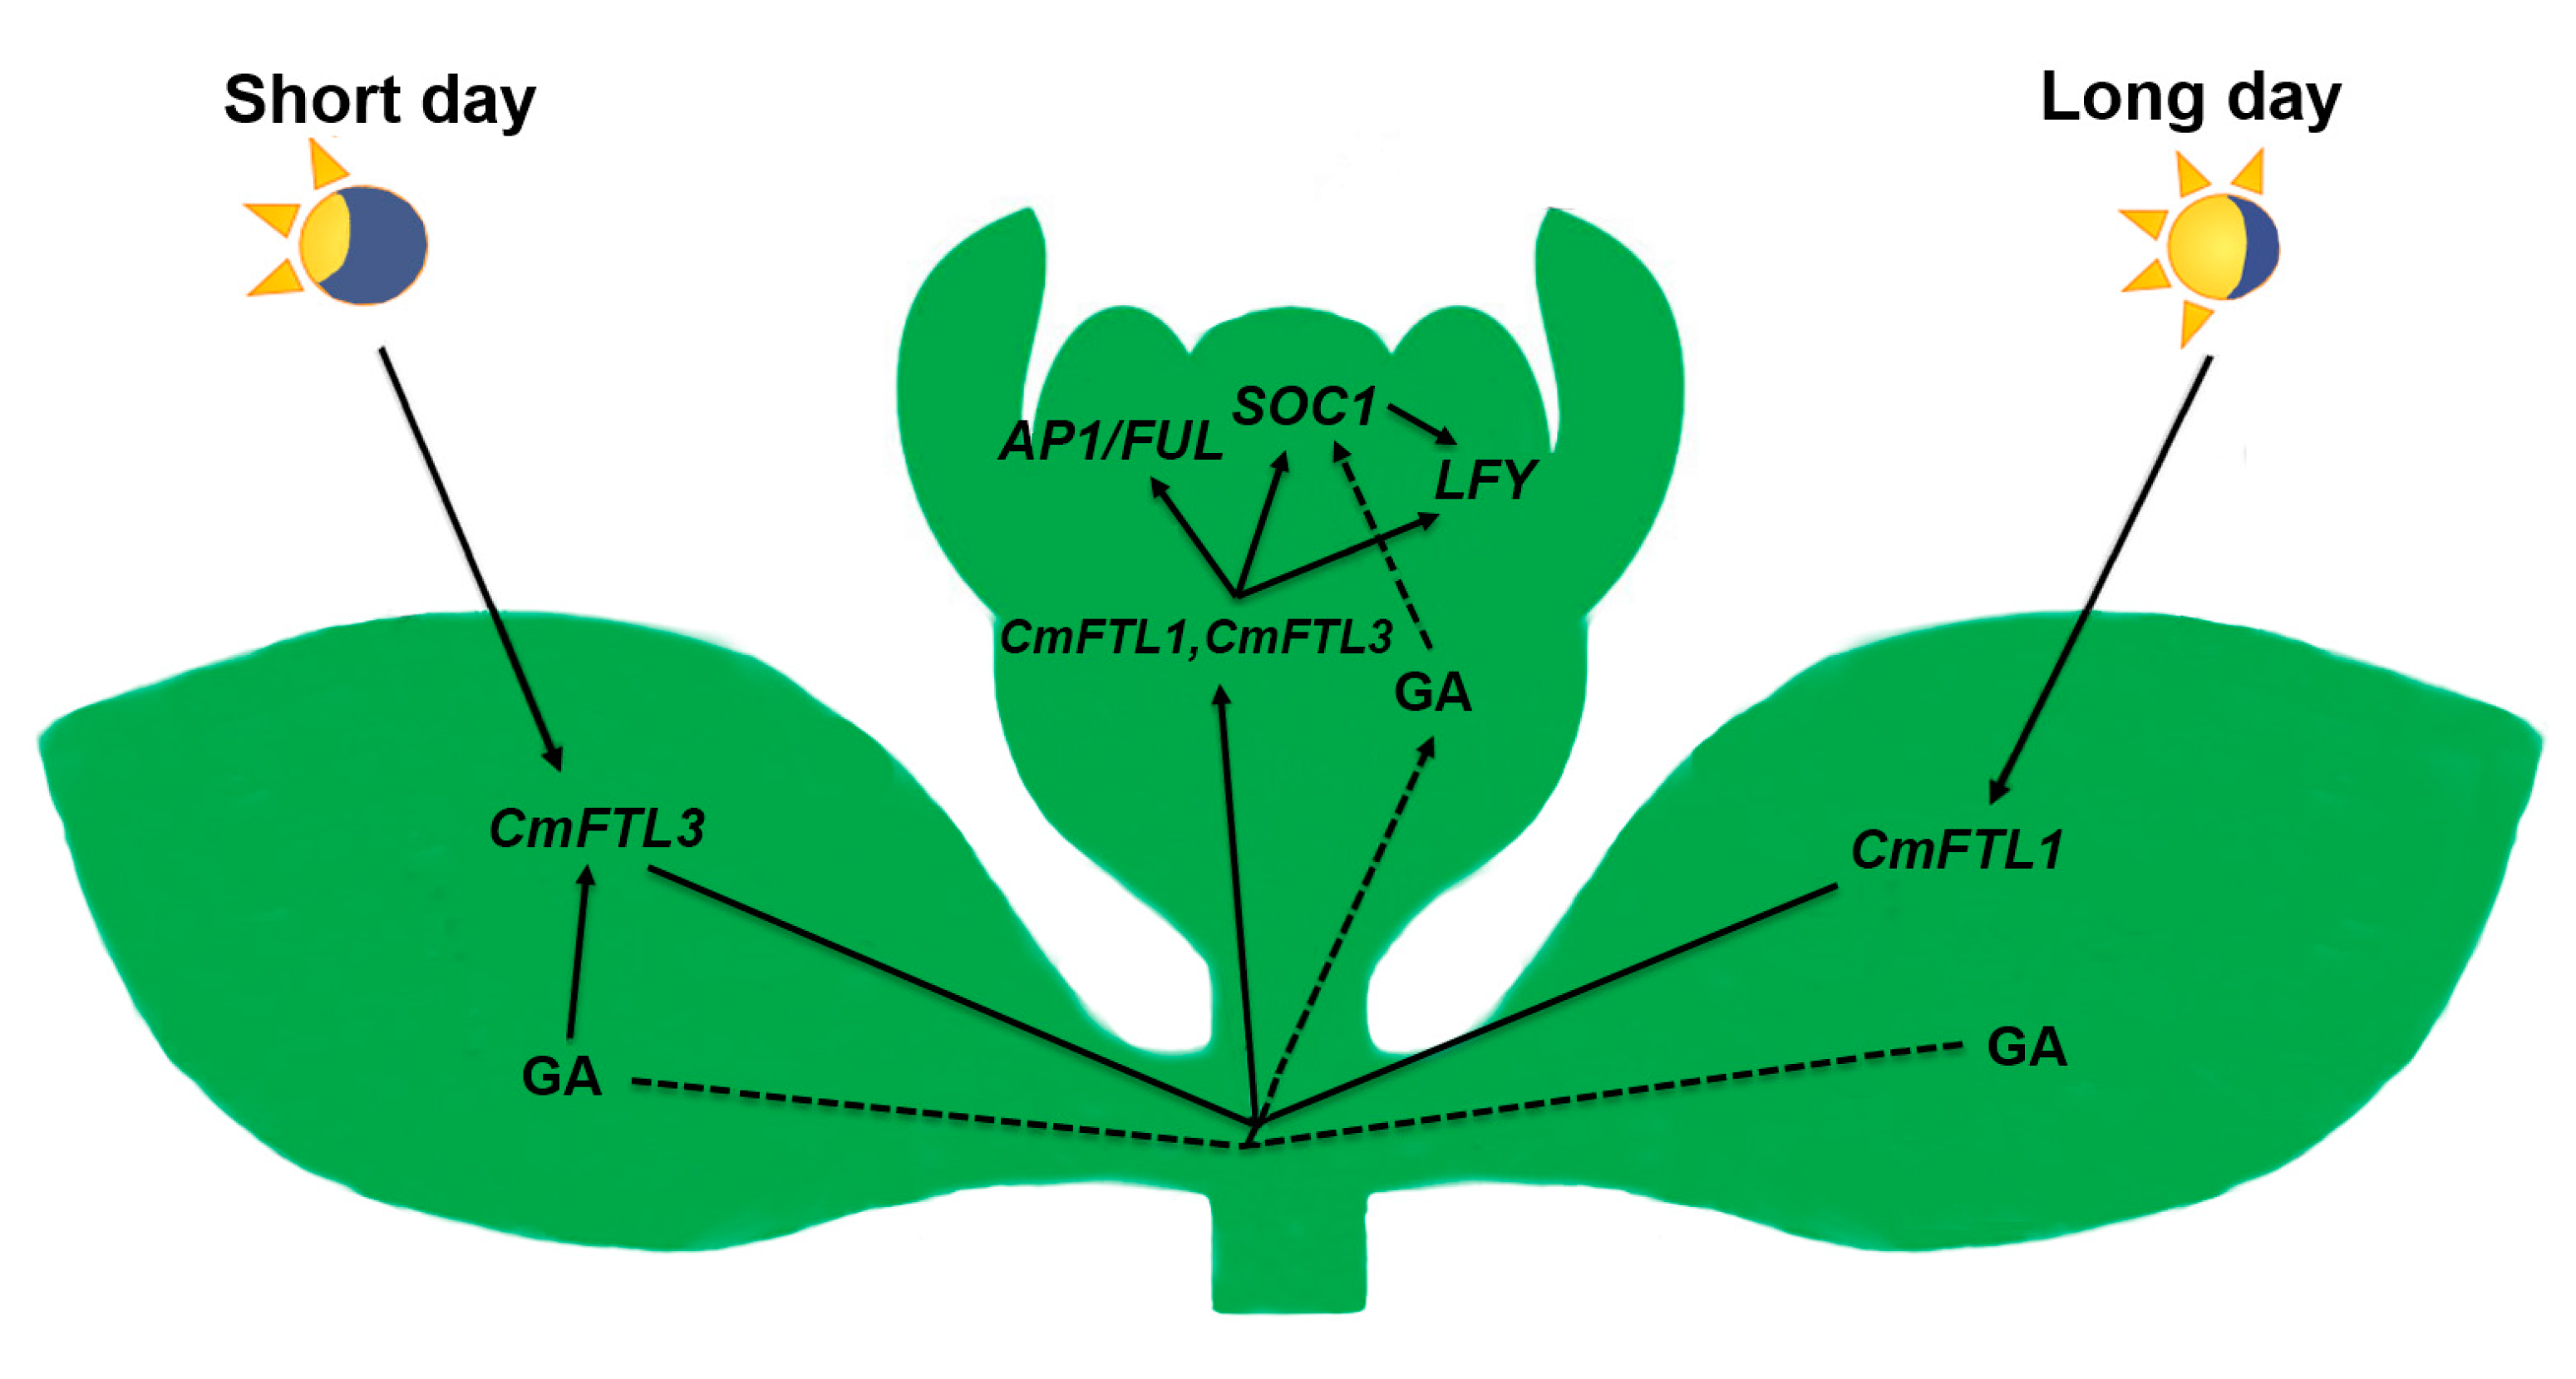
3.1. The Photoperiod and GA Pathways Act in Concert to Regulate Flowering Time under SD

Photoperiod is one of the most important environmental cues determining flowering time. The key circadian clock protein genes are TOC1, CCA1/LHY and the PRRs [2,7]; the present data have revealed that the range of circadian clock genes (CmTOC1, PRR5, and LHY) and CmCOL were all strongly up-regulated in M-SD/M-LD and WT-SD/WT-LD. For the chrysanthemum FTL orthologs, when CmFTL3 is over-expressed, the plant flowers early even under non-inductive conditions [25]. While both CmFTL3 and SOC1 transcription was enhanced by SD in WT relative to WT-LD, in M only CmFTL3 behaved in this way. The inference is that the repressor of flowering of the up-regulated FRI and FLC-like genes might affect the transcription of SOC1 in M-SD (Table 2). In addition, CmFTL3 transcription was significantly higher in M-SD than in WT-SD, resulting in the mutant reaching flowering earlier than the WT, consistent with the suggestion of Oda [25]. CmFTL1 was only weakly transcribed in both WT and M plants under SD, while the abundance of AP1/FUL was enhanced by SD in WT and even more so in M, and FLO/LFY-like was up-regulated by LD in both genotypes. Overall, the photoperiod pathway appeared to have a major regulatory influence over the switch to reproductive growth in the short day conditions.
The GA signaling pathway was also a significant determinant of flowering time in both WT and M. The endogenous level of GA responded positively to SD in both WT and M, although it was markedly higher in the latter genotype (Figure 2). Compared with LD, the GA synthesis gene GA20ox was up-regulated in both WT and M under SD; the product of this gene is known to both support GA synthesis in the leaf and enhance the plant’s response to GA signaling [26]. Besides promoting vegetative growth, GA activates FTL to promote early flowering in A. thaliana. In the cpd ga20ox double mutant of A. thaliana, the content of GA is greatly reduced, and flowering is delayed [12,27]. It has also been established from the behavior of A. thaliana plants grown under SD that GA induces SOC1 transcription to promote flowering [14,28]. In chrysanthemums, the loss of BBX24 (a zinc finger transcription factor) not only accelerates flowering, but also induces the photoperiod and GA synthesis pathways, which activates CmFLT3 but not CmFTL1 transcripts [29]. Meanwhile, the transcription of the catabolic genes GA2ox and GAI is inhibited in WT and M plants under SD. The implication is that the GA signaling pathway might affect flowering under SD via its effect on CmFTL3 and/or SOC1. These models derive from Arabidopsis and they are not fully demonstrated in chrysanthemums.

3.2. GA Activates SOC1 to Promote Flowering under LD

The chrysanthemum is considered a short day plant; it generally blooms in the fall, since floral induction only begins once the daylength begins to shorten. The mutant, however, is able to flower under LD, implying a change to a gene product that is a component of the daylength-induced floral induction mechanism. The transcriptomic data showed that both GA20ox (GA synthesis) and GID1 (GA sensing) were more strongly transcribed in M than in WT under LD, while the GA catabolism genes GA2ox and GAI were relatively less strongly transcribed (Table 2, Figure 4A). At the same time, SOC1 and LFY were up-regulated in M, but the genes involved in the sensing photoperiod were not differentially transcribed. Endogenous GA levels were higher in M than in WT (Figure 2), while the exogenous supply of GA induced flowering in both M and WT under LD, with M plants reaching flowering before the WT plants did (Figure 1B,C). The implication is that the GA pathway regulates floral induction under LD, operating via SOC1 and LFY. A previous report showed that the transcript level of CmFTL3 was up-regulated specifically by GA [29], which might be due to the different genetic background of cultivars.

3.3. Transcription Factors Involved in Floral Induction in Chrysanthemum

Plants have evolved a large number of transcription factors in order to regulate growth, development and differentiation [30]. Here, five major transcription factor families were targeted in the transcriptomic analysis, namely MYB, MADS, AP2/ERF, bHLH, WRKY and TCP (Table S2). Four MYB2-like genes have been described (all homologous to AtMYB44) that negatively regulate flowering in chrysanthemum [31]. Here, the comparison between the WT and M transcriptomes identified a MYB2 transcript that was more strongly transcribed under LD in WT than in M, whereas under SD its abundance was comparable in the two genotypes. The suggestion is therefore that this transcription factor is involved in delaying flowering time under LD. Among the MADS transcription factors, both an AP1/FUL homolog (Unigene23898) and CDM41 (Unigene7813) were significantly up-regulated in the WT by SD, and thus may be involved in floral induction under SD. In M plants, the same AP1/FUL homolog, along with the AP1 homolog Unigene55133, was more strongly transcribed under SD than under LD. AP1/FUL is a key regulator of floral development in plants [32], while CDM41 belongs to the FUL clade of MADS genes [33]. The AP2/ERF factors are known to participate in floral development in many plant species, as well as in the stress response [34,35]. An AP2/ERF homolog (Unigene23878) was found in both WT and M to be more abundantly transcribed under SD than under LD, so it may well be part of the floral induction mechanism under SD. Two AP2/ERF homologs (Unigene47162, Unigene46823) were also more strongly transcribed in M than in WT under LD, so the possibility is that the activity of AP2/ERFs underlies the ability of M plants to flower under LD. No representatives of the bHLH, WRKY or TCP families were differentially transcribed in any of the contrasts analyzed.

4. Materials and Methods

4.1. Plant Materials and Growth Conditions

The M forms of ‘Jinba’ were found during cut flower production, which showed earlier flowing than the WT plants under SD, and an abnormally emerged flower bud in LD. Both are maintained by the Nanjing Agricultural University Chrysanthemum Germplasm Resource Preserving Centre (Nanjing, China). Uniform chrysanthemum cuttings were raised in a greenhouse under natural light at ~25 °C, and a relative humidity of 70–75%. After 20 days (when the plants had reached a height of ~20 cm and were still vegetative), the fifth fully expanded leaf of each plant was sampled. Two contrasting photoperiod regimes were then applied: LD (~16 h light/8 h dark) and SD (~8 h light/16 h dark). The fifth fully expanded leaves were sampled randomly from six lines of M-SD/LD and M-SD/LD at the same time stage when the M plants had visible flower buds. The flower bud differentiation, stem apices of M and WT plants were observed by using paraffin sections. Immediately after harvest, the tissue was snap-frozen in liquid nitrogen and stored at −80 °C until required. Three biological replicates for the experiment were performed.

4.2. RNA Extraction and cDNA Library Construction

Total RNA was isolated from 0.3 g of tissue samples using the RNAiso Plus reagent (TaKaRa, Dalian, China), following the manufacturer’s protocol. The resulting crude RNAs were treated with RNase-free DNase I (TaKaRa) and their concentrations measured using an HND-1000 NanoDrop device (http://www.nanodrop.com/). The OD260/280 of the RNAs lay between 1.8 and 2.2 and the OD260/230 was >1.8. According to the method of Singh et al. [36], a 3 μg pool of RNA was formed by combining 1 μg from each biological replicate used for the construction of libraries. The four RNA-Seq libraries were constructed as described by Ren et al. [37].

4.3. Transcriptome Sequencing and Bioinformatic Analysis

Transcriptome sequencing was carried out using a Hiseq 2000 device (Illumina, San Diego, CA, USA) at the Beijing Genomics Institute (www.genomics.cn). Image data output from a sequencing machine was transformed by base calling into sequence data, which is called raw reads and stored in fastq format. Raw reads contain “dirty” reads (adapters, unknown or low quality bases). The clean reads were edited by removing adaptor sequences (match length ≥ 10 bp); unknown bases are more than 5% and low quality reads (the percentage of low quality bases (the value of sQ ≤ 20) is over 50% in a read; we define the low quality base whose sequencing quality is no more than 10). Then transcriptome de novo assembly was carried out with a short-reads assembling program—Trinity (release-20130225, http://trinityrnaseq.sourceforge.net/). The produced sequences of trinity are called unigenes. The unigenes using BLAST software (v2.2.26 + x64-linux, http://blast.ncbi.nlm.nih.gov/Blast.cgi) were assigned functions based on homologs present in the NR (www.ncbi.nlm.nih.gov/refseq), NT (www.ncbi.nlm.nih.gov/nuccore), Swiss-Prot (www.uniprot.org), KEGG (www.genome.jp/kegg/kegg1.html), COG (www.ncbi.nlm.nih.gov/COG/) and GO (geneontology.org/page/go-database) databases. For the prediction of coding regions, the number of CDS that mapped to the protein database and the number of CDS were predicted. In addition, transcript abundance was estimated using the RPKM reads (clean reads per kilo base per million) method on the base of eliminating the influence of different gene length and sequencing discrepancy using RPKM (internal software of BGI) and SOAP (Release 2.21, http://soap.genomics.org.cn/soapaligner.html). The RPKM values can be directly used for comparing the difference of gene expression among samples. Differential transcription was defined as the ratio of transcript abundance being either >2.0 (up-regulation) or <0.5 (down-regulation), along with a p value of <0.001 [38]. The datasets of transcriptome (Chrysanthemum. ‘Jinba’ sequencing project) are available in the NCBI repository, (http://trace.ncbi.nlm.nih.gov/Traces/sra_sub/sub.cgi?) Accession No. for library SRP070731.

4.4. qRT-PCR

Total RNA was extracted from the leaves and the shoot apex using the RNAiso Plus reagent (TaKaRa), and the first cDNA strand synthesized from 1 μg total RNA using PrimeScript® Reverse Transcriptase (TaKaRa) primed with oligo (dT), following the manufacturer’s protocol. Each 20 μL qRT-PCR contained 10 μL SYBR® Premix Ex TaqTMⅡ, 5 μL cDNA and 1 μL of forward primer and 1 uL of reverse primer, 3 μL H2O. The primers were designed using primer 5.0 software (sequences are given in Table S3). Each reaction was initially denatured (95°C/2 min), then subjected to 40 cycles of 95 °C/15 s, 55 °C/15 s, 68 °C/20 s and performed in triplicate. The chrysanthemum EF1α gene (Genbank accession number KF305681) was used as the reference [39]. Relative transcript abundances were calculated using the 2−∆∆Ct method [40]. Three biological replicates were performed.

4.5. Determination of Endogenous GA Content

Three replicates of 1 g leaf samples (third or fourth fully expanded leaf) were obtained under both LD and SD conditions. At the time of sampling, WT-LD was at the vegetative stage, while WT-SD, M-SD and M-LD were at the flower bud differentiation stage. The leaf material was powdered by grinding it in the presence of liquid nitrogen. The samples were extracted by suspension in 5 mL 80% (v/v) cold methanol and centrifuged (10,000 rpm/20 min, 4 °C); 0.2 g PVP was then added and the suspension left for >1 h at 4 °C. After re-centrifuging (10,000 rpm/20 min, 4 °C), the supernatant was passed through a tandem C18 SPE cartridge (Waters, Milford, MA, USA) and dried under nitrogen gas for about 12 h. Subsequently, the lysate was re-suspended in 1 mL methanol and the solution filtered through a 0.45 μm organic ultrafine filter (Millipore, Shanghai, China). All the above operations were performed under minimal light. The 0.2 uL samples were utilized to run the Ultra Performance Liquid Chromatography (UPLC) (Waters).

4.6. GA Treatment

Exogenous GA was applied to the plants by spraying a 1:1000 aqueous dilution of 100 mM GA3 (Sigma-Aldrich, St. Louis, MO, USA) dissolved in absolute ethanol. Spraying was carried out every three days until flower bud emergence was detected.

5. Conclusions

The transcriptomic analysis and the other data of the spontaneous mutant of chrysanthemum showed that higher GA contents can affect the expression of SOC1 under LD conditions for regulating flowering; under SD conditions, the photoperiod pathway majorly acted to determine flowering time through CmFTL3, and the GA signaling pathway played a subsidiary role for flowering (Figure 5).

Supplementary Materials

Supplementary materials can be found at www.mdpi.com/1422-0067/18/6/1259/s1.

Acknowledgments

This work was supported by funding from the National Science Fund for Distinguished Young Scholars (31425022), National Natural Science Foundation of China (31572159), “Programs of Innovation and Entrepreneurship Talents” of Jiangsu Province, the Fundamental Research Funds for the Central Universities (KYTZ201401), the Project Funded by the Priority Academic Program Development of Jiangsu Higher Education.

Author Contributions

Bin Dong contributed to bioinformatics analysis and writing of the manuscript. Jiafu Jiang and Fadi Chen conceived of the study and its design. Jiafu Jiang and Sumei Chen contributed to revisions of the manuscript. Ye Deng and Haibin Wang participated in experiment materials preparation. Githeng’u K. Stephen and Ri Gao helped with the RNA extraction and real-time PCR, all authors read and approved the final manuscript.

Conflicts of Interest

The authors declare no conflict of interest.

References

  1. Muller, C.J.A.E. Flowering time control and applications in plant breeding. Trends Plant Sci. 2009, 14, 563–573. [Google Scholar]
  2. Fornara, F.; de Montaigu, A.; Coupland, G. SnapShot: Control of flowering in Arabidopsis. Cell 2010, 141, 550–550.e2. [Google Scholar] [CrossRef] [PubMed]
  3. Amasino, R. Seasonal and developmental timing of flowering. Plant J 2010, 61, 1001–1013. [Google Scholar] [CrossRef] [PubMed]
  4. Andres, F.; Coupland, G. The genetic basis of flowering responses to seasonal cues. Nat. Rev. Genet. 2012, 13, 627–639. [Google Scholar] [CrossRef] [PubMed]
  5. Song, Y.H.; Shim, J.S.; Kinmonth-Schultz, H.A.; Imaizumi, T. Photoperiodic flowering: Time measurement mechanisms in leaves. Annu. Rev. Plant Biol. 2015, 66, 441–464. [Google Scholar] [CrossRef] [PubMed]
  6. Miwa, K.; Serikawa, M.; Suzuki, S.; Kondo, T.; Oyama, T. Conserved expression profiles of circadian clock-related genes in two Lemna species showing long-day and short-day photoperiodic flowering responses. Plant Cell Physiol. 2006, 47, 601–612. [Google Scholar] [CrossRef] [PubMed]
  7. Shim, J.S.; Imaizumi, T. Circadian clock and photoperiodic response in Arabidopsis: From seasonal flowering to redox homeostasis. Biochemistry 2015, 54, 157–170. [Google Scholar] [CrossRef] [PubMed]
  8. Srikanth, A.; Schmid, M. Regulation of flowering time: All roads lead to Rome. Cell Mol. Life Sci. 2011, 68, 2013–2037. [Google Scholar] [CrossRef] [PubMed]
  9. Song, Y.H.; Ito, S.; Imaizumi, T. Flowering time regulation: Photoperiod- and temperature-sensing in leaves. Trends Plant Sci. 2013, 18, 575–583. [Google Scholar] [CrossRef] [PubMed]
  10. Olszewski, N.; Sun, T.; Gubler, F. Gibberellin signaling biosynthesis, catabolism, and response pathways. Plant Cell 2002, 14 (Suppl. S1), S61–S80. [Google Scholar]
  11. Hisamatsua, T.; Koshioka, M.; Kubotaa, S.; Fujimeb, Y.; King, R.W.; Mander, L.N. The role of gibberellin biosynthesis in the control of growth and flowering in Matthiola incana. Physiol. Plant 2000, 109, 97–105. [Google Scholar] [CrossRef]
  12. Mutasa-Gottgens, E.; Hedden, P. Gibberellin as a factor in floral regulatory networks. J. Exp. Bot. 2009, 60, 1979–1989. [Google Scholar] [CrossRef] [PubMed]
  13. Davière, J.-M.; Achard, P. Gibberellin signaling in plants. Development 2013, 140, 1147–1151. [Google Scholar]
  14. Moon, J.; Suh, S.S.; Lee, H.; Choi, K.R.; Hong, C.B.; Paek, N.C.; Kim, S.G.; Lee, I. The SOC1 MADS-box gene integrates vernalization and gibberellin signals for flowering in Arabidopsis. Plant J. 2003, 35, 613–623. [Google Scholar] [CrossRef] [PubMed]
  15. Hisamatsu, T.; King, R.W. The nature of floral signals in Arabidopsis. II. Roles for FLOWERING LOCUS T (FT) and gibberellin. J. Exp. Bot. 2008, 59, 3821–3829. [Google Scholar] [CrossRef] [PubMed]
  16. Itoh, H.; Matsuoka, M.; Steber, C.M. A role for the ubiquitin–26S-proteasome pathway in gibberellin signaling. Trends Plant Sci. 2003, 8, 492–497. [Google Scholar] [CrossRef] [PubMed]
  17. Fleet, C.M.; Sun, T.-p. A DELLAcate balance: The role of gibberellin in plant morphogenesis. Curr. Opin. Plant Biol. 2005, 8, 77–85. [Google Scholar] [CrossRef] [PubMed]
  18. Du, H.; Wang, Y.-B.; Xie, Y.; Liang, Z.; Jiang, S.-J.; Zhang, S.-S.; Huang, Y.-B.; Tang, Y.-X. Genome-Wide identification and evolutionary and expression analyses of MYB-related genes in land plants. DNA Res. 2013, 20, 437–448. [Google Scholar] [CrossRef] [PubMed]
  19. Ito, S.; Song, Y.H.; Josephson-Day, A.R.; Miller, R.J.; Breton, G.; Olmstead, R.G.; Imaizumi, T. FLOWERING BHLH transcriptional activators control expression of the photoperiodic flowering regulator CONSTANS in Arabidopsis. Proc. Natl. Acad. Sci. USA 2012, 109, 3582–3587. [Google Scholar] [CrossRef] [PubMed]
  20. Smaczniak, C.; Immink, R.G.; Muiño, J.M.; Blanvillain, R.; Busscher, M.; Busscher-Lange, J.; Dinh, Q.P.; Liu, S.; Westphal, A.H.; Boeren, S. Characterization of MADS-domain transcription factor complexes in Arabidopsis flower development. Proc. Natl. Acad. Sci. USA 2012, 109, 1560–1565. [Google Scholar] [CrossRef] [PubMed]
  21. Yu, Y.; Liu, Z.; Wang, L.; Kim, S.G.; Seo, P.J.; Qiao, M.; Wang, N.; Li, S.; Cao, X.; Park, C.M. WRKY71 accelerates flowering via the direct activation of FLOWERING LOCUS T and LEAFY in Arabidopsis thaliana. Plant J. 2016, 85, 96–106. [Google Scholar] [CrossRef] [PubMed]
  22. Navarro, C.; Cruz-Oró, E.; Prat, S. Conserved function of FLOWERING LOCUS T (FT) homologues as signals for storage organ differentiation. Curr. Opin. Plant Biol. 2015, 23, 45–53. [Google Scholar] [CrossRef] [PubMed]
  23. Lee, J.H.; Yoo, S.J.; Park, S.H.; Hwang, I.; Lee, J.S.; Ahn, J.H. Role of SVP in the control of flowering time by ambient temperature in Arabidopsis. Genes Dev. 2007, 21, 397–402. [Google Scholar] [CrossRef] [PubMed]
  24. Moura, F.B.; Vieira, M.R.d.S.; Evangelista, W.S.; Silva, L.F.; Oliveira, R.H.; Rocha, A.T.; Costa, F.B. Cultivars, conduction, photoperiodic and quality chrysanthemum in Brazil. J. Hortic. For. 2014, 6, 53–57. [Google Scholar] [CrossRef]
  25. Oda, A.; Narumi, T.; Li, T.; Kando, T.; Higuchi, Y.; Sumitomo, K.; Fukai, S.; Hisamatsu, T. CsFTL3, a chrysanthemum FLOWERING LOCUS T-like gene, is a key regulator of photoperiodic flowering in chrysanthemums. J. Exp. Bot. 2012, 63, 1461–1477. [Google Scholar] [CrossRef] [PubMed]
  26. Achard, P.; Genschik, P. Releasing the brakes of plant growth: How GAs shutdown DELLA proteins. J. Exp. Bot. 2009, 60, 1085–1092. [Google Scholar] [CrossRef] [PubMed]
  27. Croker, S.J.; García-Lepe, R.; Lewis, M.J.; Hedden, P. Modification of gibberellin production and plant development in Arabidopsis by sense and antisense expression of gibberellin 20-oxidase genes. Plant J. 1999, 17, 547–556. [Google Scholar]
  28. Mouradov, A.; Cremer, F.; Coupland, G. Control of flowering time interacting pathways as a basis for diversity. Plant Cell 2002, 14 (Suppl. S1), S111–S130. [Google Scholar] [PubMed]
  29. Yang, Y.; Ma, C.; Xu, Y.; Wei, Q.; Imtiaz, M.; Lan, H.; Gao, S.; Cheng, L.; Wang, M.; Fei, Z.; et al. A zinc finger protein regulates flowering time and abiotic stress tolerance in chrysanthemum by modulating gibberellin biosynthesis. Plant Cell 2014, 26, 2038–2054. [Google Scholar] [CrossRef] [PubMed]
  30. Udvardi, M.K.; Kakar, K.; Wandrey, M.; Montanari, O.; Murray, J.; Andriankaja, A.; Zhang, J.-Y.; Benedito, V.; Hofer, J.M.; Chueng, F. Legume transcription factors: Global regulators of plant development and response to the environment. Plant Physiol. 2007, 144, 538–549. [Google Scholar] [CrossRef] [PubMed]
  31. Shan, H.; Chen, S.; Jiang, J.; Chen, F.; Chen, Y.; Gu, C.; Li, P.; Song, A.; Zhu, X.; Gao, H. Heterologous expression of the chrysanthemum R2R3-MYB transcription factor CmMYB2 enhances drought and salinity tolerance, increases hypersensitivity to ABA and delays flowering in Arabidopsis thaliana. Mol. Biotechnol. 2012, 51, 160–173. [Google Scholar] [CrossRef] [PubMed]
  32. Litt, A.; Irish, V.F. Duplication and diversification in the APETALA1/FRUITFULL floral homeotic gene lineage: Implications for the evolution of floral development. Genetics 2003, 165, 821–833. [Google Scholar] [PubMed]
  33. Shchennikova, A.V.; Shulga, O.A.; Immink, R.; Skryabin, K.G.; Angenent, G.C. Identification and characterization of four chrysanthemum MADS-box genes, belonging to the APETALA1/FRUITFULL and SEPALLATA3 subfamilies. Plant Physiol. 2004, 134, 1632–1641. [Google Scholar] [CrossRef] [PubMed]
  34. Nakano, T.; Suzuki, K.; Fujimura, T.; Shinshi, H. Genome-Wide analysis of the ERF gene family in Arabidopsis and rice. Plant Physiol. 2006, 140, 411–432. [Google Scholar] [CrossRef] [PubMed]
  35. Mizoi, J.; Shinozaki, K.; Yamaguchi-Shinozaki, K. AP2/ERF family transcription factors in plant abiotic stress responses. Biochim. Biophys. Acta 2012, 1819, 86–96. [Google Scholar] [CrossRef] [PubMed]
  36. Singh, V.K.; Garg, R.; Jain, M. A global view of transcriptome dynamics during flower development in chickpea by deep sequencing. Plant Biotechnol. J. 2013, 11, 691–701. [Google Scholar] [CrossRef] [PubMed]
  37. Ren, L.; Sun, J.; Chen, S.; Gao, J.; Dong, B.; Liu, Y.; Xia, X.; Wang, Y.; Liao, Y.; Teng, N. A transcriptomic analysis of Chrysanthemum nankingense provides insights into the basis of low temperature tolerance. BMC Genom. 2014, 15, 1. [Google Scholar] [CrossRef] [PubMed]
  38. Audic, S.; Claverie, J.M. The significance of digital gene expression profiles. Genome Res. 1997, 7, 986–995. [Google Scholar] [CrossRef] [PubMed]
  39. Wang, H.; Chen, S.; Jiang, J.; Zhang, F.; Chen, F. Reference gene selection for cross-species and cross-ploidy level comparisons in Chrysanthemum spp. Sci. Rep. 2015, 5, 8094. [Google Scholar] [CrossRef] [PubMed]
  40. Livak, K.J.; Schmittgen, T.D. Analysis of relative gene expression data using real-time quantitative PCR and the 2−∆∆Ct method. Methods 2001, 25, 402–408. [Google Scholar] [CrossRef] [PubMed]
Figure 1. The switch to reproductive growth in WT and M chrysanthemum plant. (A) Flower bud emergence (arrowed) in plants grown under LD or SD; (B) Flower bud emergence (arrowed) induced by spraying plants with GA under LD or SD; (C) The effect of GA application on the timing of flower bud emergence. Significant differences were determined by Duncan’s multiple range test (p < 0.05); error bar indicates SD. Different uppercase (A,B) or lowercase (a–c) letters indicate significant differences in the time required for WT and M plants, respectively.
Ijms 18 01259 g001
Figure 2. GA content in the leaves of WT and M plants grown under LD or SD. Significant differences were determined by Duncan’s multiple range test (p < 0.05, n = 3). * means significantly difference.
Ijms 18 01259 g002
Figure 3. Numbers of differentially transcribed genes in WT and M plants grown under LD or SD. WT-SD represents wild type plants under short day conditions, WT-LD represents wild type plants under long day conditions, M-SD represents mutant plants under short day conditions, and M-LD represents mutant plants under long day conditions.
Ijms 18 01259 g003
Figure 4. Transcription of key flowering-related genes using qRT-PCR. (A) Relative transcript abundance in WT and M plants grown under LD or SD; (B) Relative transcript abundance in WT and M plants sprayed with GA and grown under LD or SD. * indicates significantly different expression level between two samples. Student’s t test (n = 3).
Ijms 18 01259 g004
Figure 5. A model of the floral induction regulatory networks operating in chrysanthemum ‘Jinba’ plants grown under LD or SD.
Ijms 18 01259 g005
Table 1. Summary statistics of the RNA-Seq data.
SamplesTotal Raw ReadsTotal Clean ReadsTotal Clean Nucleotides (nt)Q20 PercentageQ30 PercentageN PercentageGC Percentage
WT-SD117,328,048114,265,7445,141,958,48097.30%91.39%0.0043.19%
WT-LD117,809,964114,693,3445,161,200,48097.19%91.16%0.0043.59%
M-SD121,981,564118,657,3165,339,579,22097.16%91.08%0.0043.18%
M-LD120,340,980116,781,1725,255,152,74097.19%91.18%0.0043.53%
Total Reads and Total Nucleotides are actually clean reads and clean nucleotides; Total Nucleotides should be more than contract provision; Q20/Q30percentage is the proportion of nucleotides with a quality value larger than 20/30; N percentage is the proportion of unknown nucleotides in clean reads; GC percentage is the proportion of guanidine and cytosine nucleotides among total nucleotides. WT-LD, the ‘Jinba’ wild type-LD. WT-SD, the ‘Jinba’ wild type-SD. M-LD, the ‘Jinba’ mutant-LD. M-SD, the ‘Jinba’ mutant-SD.
Table 2. Differentially transcribed flowering time-related genes detected in ‘Jinba’ WT and M plants grown under LD or SD.
GeneAnnotationWT-SD RPKMWT-LD RPKMM-SD RPKMM-LD RPKMFold Change
M-SD/WT-SDp ValueWT-SD/WT-LDp ValueM-SD/M-LDp ValueM-LD/WT-LDp Value
Photoperiod pathway
CL80.Contig1lCmTOC12.641.303.511.501.334.0 × 10−22.041.0 × 10−42.362.0 × 10−71.155.2 × 10−1
CL6838.Contig1PRR536.3233.3052.3626.071.441.8 × 10−451.093.0 × 10−32.014.0 × 10−1330.783.0 × 10−14
CL64.Contig1LHY3.252.354.201.651.292.0 × 10−21.381.0 × 10−22.542.0 × 10−120.702.0 × 10−2
CL64.Contig2LHY4.573.296.342.301.394.0 × 10−41.393.0 × 10−32.767.0 × 10−200.707.0 × 10−2
Unigene30909LHY3.741.975.062.431.353.0 × 10−31.907.0 × 10−72.098.0 × 10−111.231.5 × 10−1
CL7048.Contig2CONSTANS-like10.179.3214.996.421.472.3 × 10−91.091.4 × 10−12.332.0 × 10−360.692.0 × 10−7
CL10258.Contig3CONSTANS-like41.4423.7254.6013.611.386.8 × 10−191.681.0 × 10−293.742.0 × 10−1700.629.0 × 10−16
Unigene16657CONSTANS-like93.5977.41100.2143.791.075.0 × 10−41.214.0 × 10−192.291.0 × 10−2600.573.5 × 10−107
GA biosynthesis and signaling
CL10783.Contig2Ent-copalyl diphosphate synthase (CPS)0.090.792.060.2822.892.0 × 10−60.111.5 × 10−27.369.5 × 10−50.351.3 × 10−1
CL2973.Contig1Gibberellin 20-oxidase (GA20ox)38.627.7430.2218.620.786.0 × 10−144.996.0 × 10−2611.622.0 × 10−342.411.0 × 10−54
CL8331.Contig2Gibberellin 2-oxidase (GA2ox)0.143.940.200.921.385.6 × 10−10.042.0 × 10−400.218.0 × 10−60.237.0 × 10−19
Unigene27395Gibberellin receptor (GID1)3.363.192.368.180.701.2 × 10−21.057.1 × 10−10.295.0 × 10−282.561.0 × 10−18
Unigene27748GAI14.4345.7412.2223.590.851.0 × 10−30.322.0 × 10−2140.522.0 × 10−470.526.0 × 10−89
Flowering integrators
CL1484.Contig1CmFTL10.3912.170.4112.120.938.9 × 10−10.036.0 × 10−720.033.0 × 10−721.09.7 × 10−1
CL1484.Contig2CmFTL316.881.6831.812.081.886.0 × 10−513.945.0 × 10−14815.3201.231.69 × 10−1
Unigene40592SOC18.683.6017.6516.822.032.0 × 10−212.419.0 × 10−151.054.5 × 10−14.675.0 × 10−57
Unigene25380FLO/LFY-like0.751.280.578.500.763.3 × 10−10.582.0 × 10−20.071.0 × 10−716.662.0 × 10−50
Unigene23898AP1/FUL like47.871.5476.842.031.611.0 × 10−5631.12037.8901.321.3 × 10−1
Aging, ambient temperature and autonomous pathway
Unigene29044SPL51.309.510.407.110.332.0 × 10−30.142.0 × 10−330.061.7 × 10−330.758.0 × 10−3
CL14613.Contig14FLC-like1.011.592.961.602.931.0 × 10−70.636.0 × 10−21.858.0 × 10−41.009.9 × 10−1
CL8773.Contig1FRIGIDA1.030.891.700.631.924.0 × 10−50.864.0 × 10−12.701.3 × 10−80.611.0 × 10−2
Unigene20776SVP42.08308.7723.50167.500.562.0 × 10−450.1400.1400.540
Significant differences were determined with p < 0.001, up-regulation expression ratio >2.0 and down-regulation expression ratio <0.5. RKPM: reads per kilobase per million mapped reads. WT-SD, the ‘Jinba’ wild type under short day. WT-LD, the ‘Jinba’ wild type under long day. M-SD, the ‘Jinba’ mutant under short day. M-LD, the ‘Jinba’ mutant under long day.

