
Distinct Antigen Delivery Systems Induce Dendritic Cells’ Divergent Transcriptional Response: New Insights from a Comparative and Reproducible Computational Analysis

 ,
, 

 and
and
Abstract
:
1. Introduction
2. Results
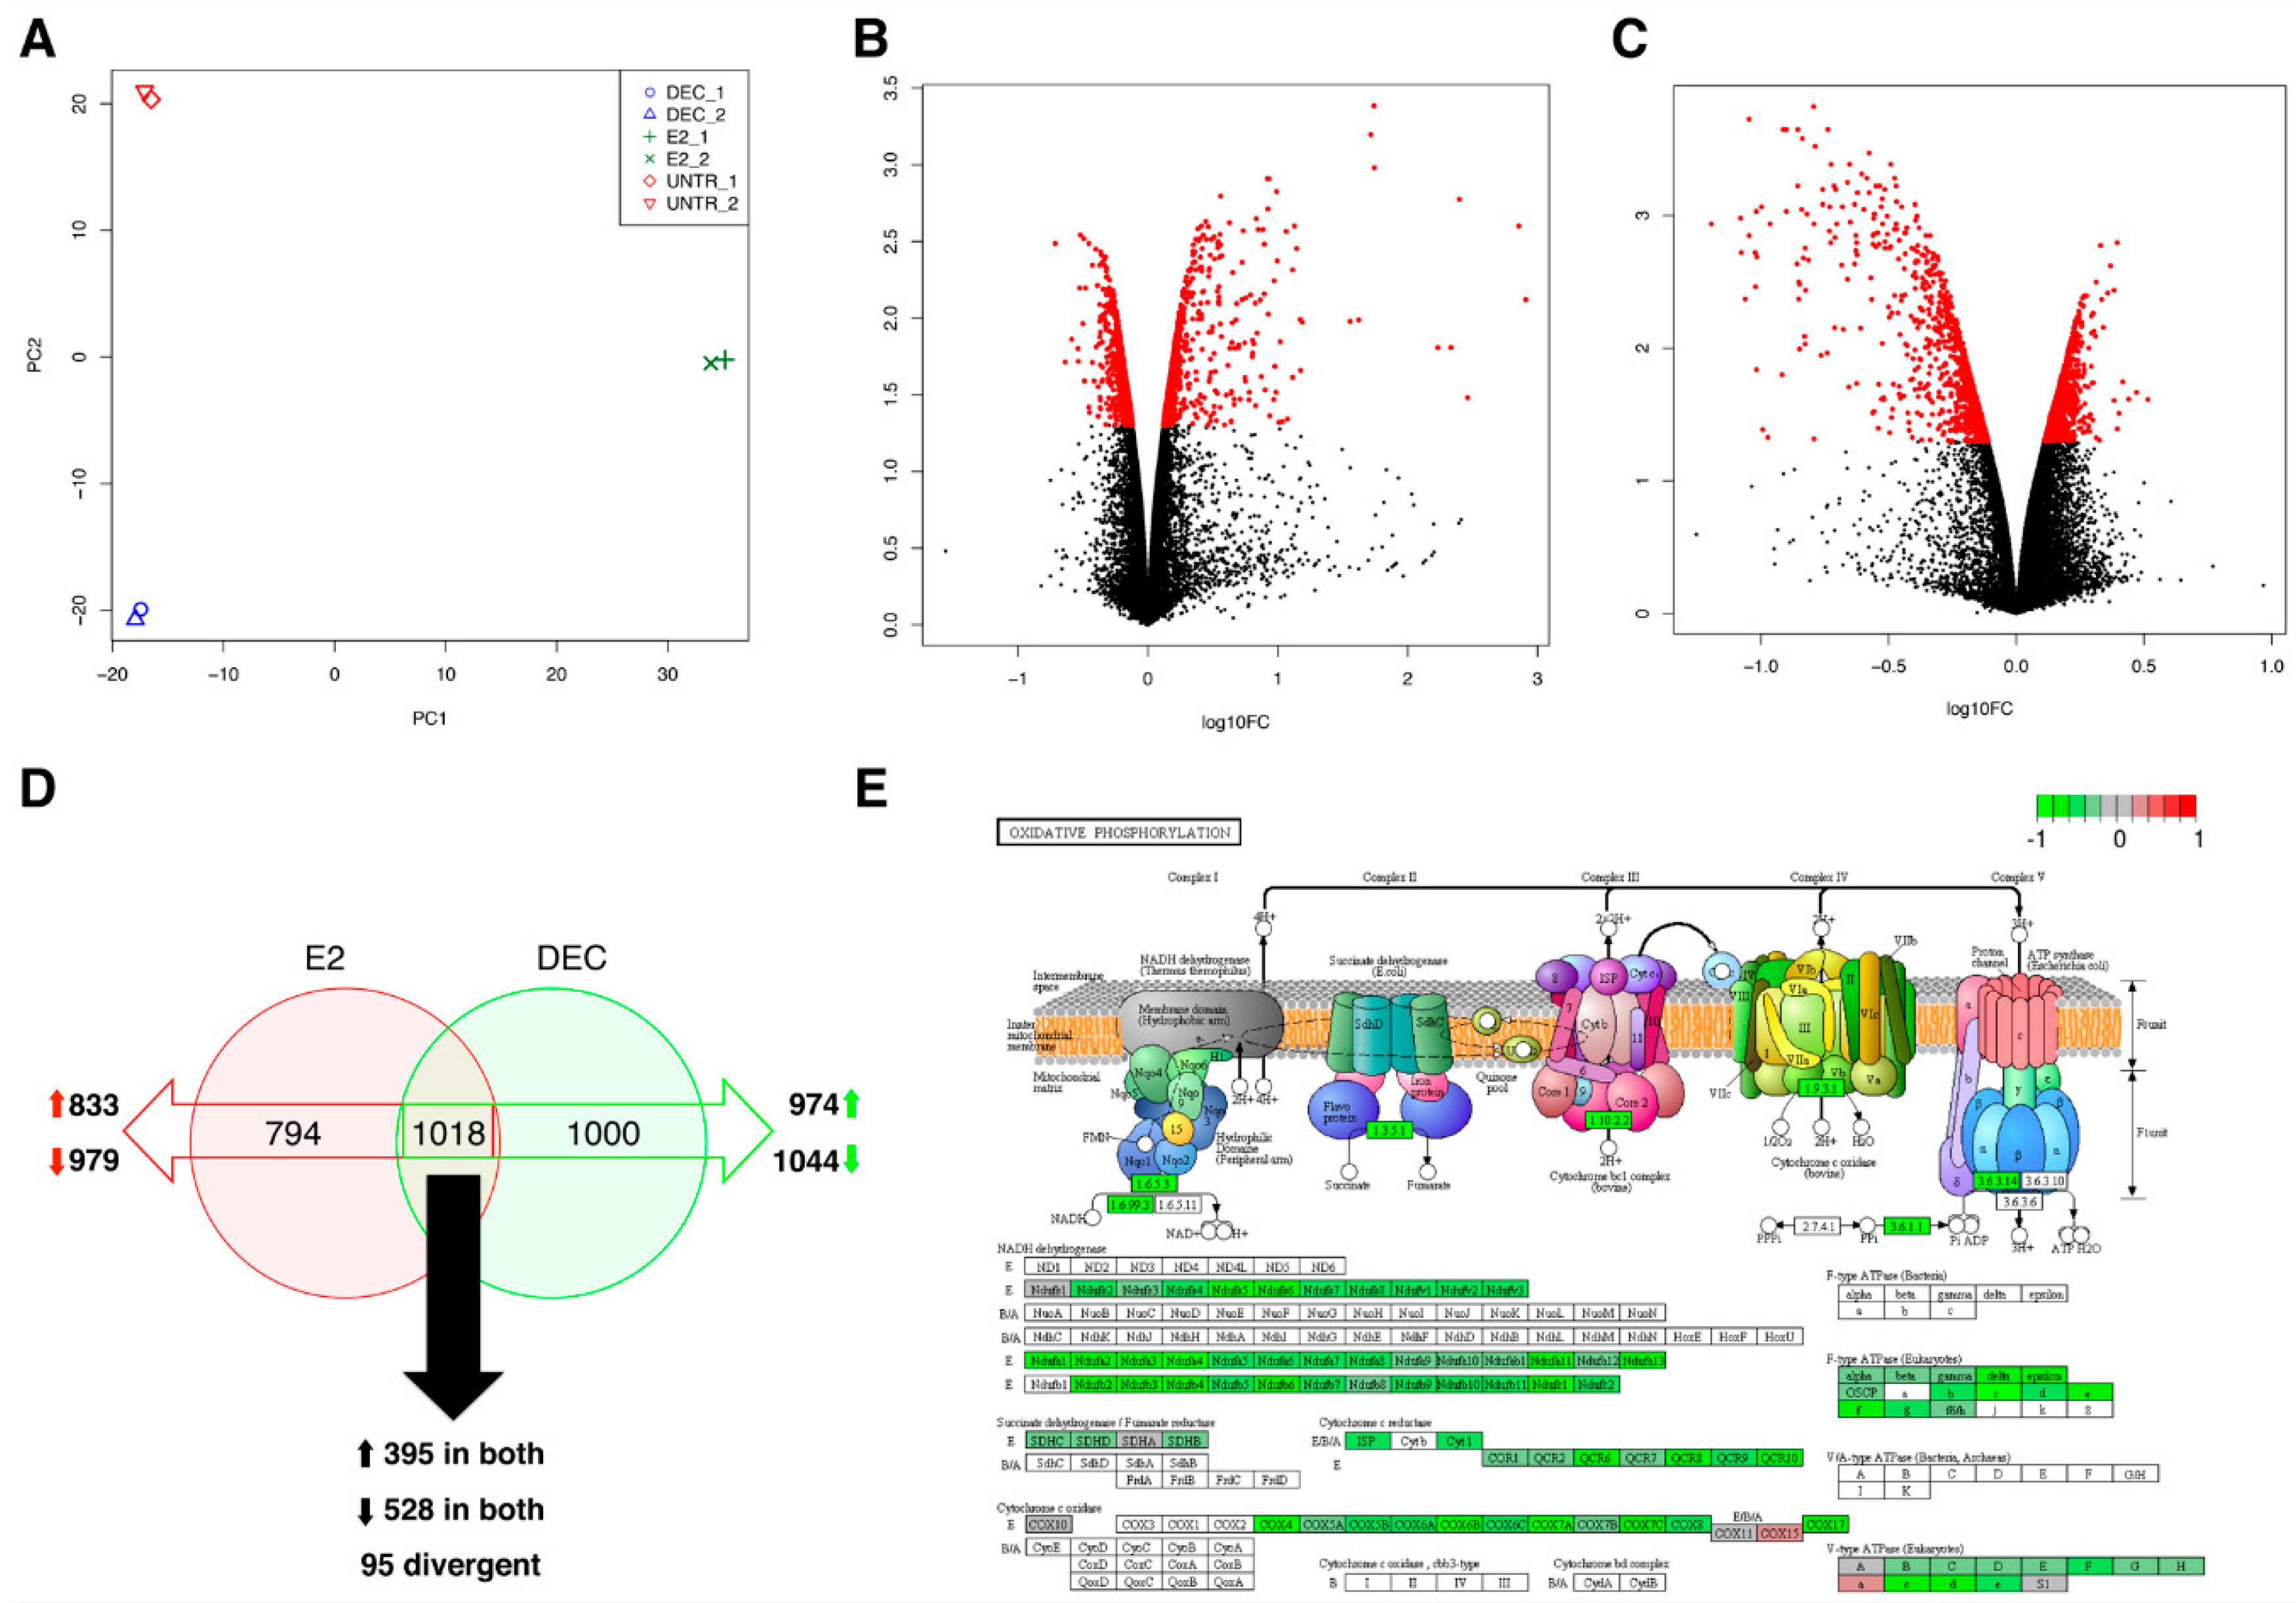
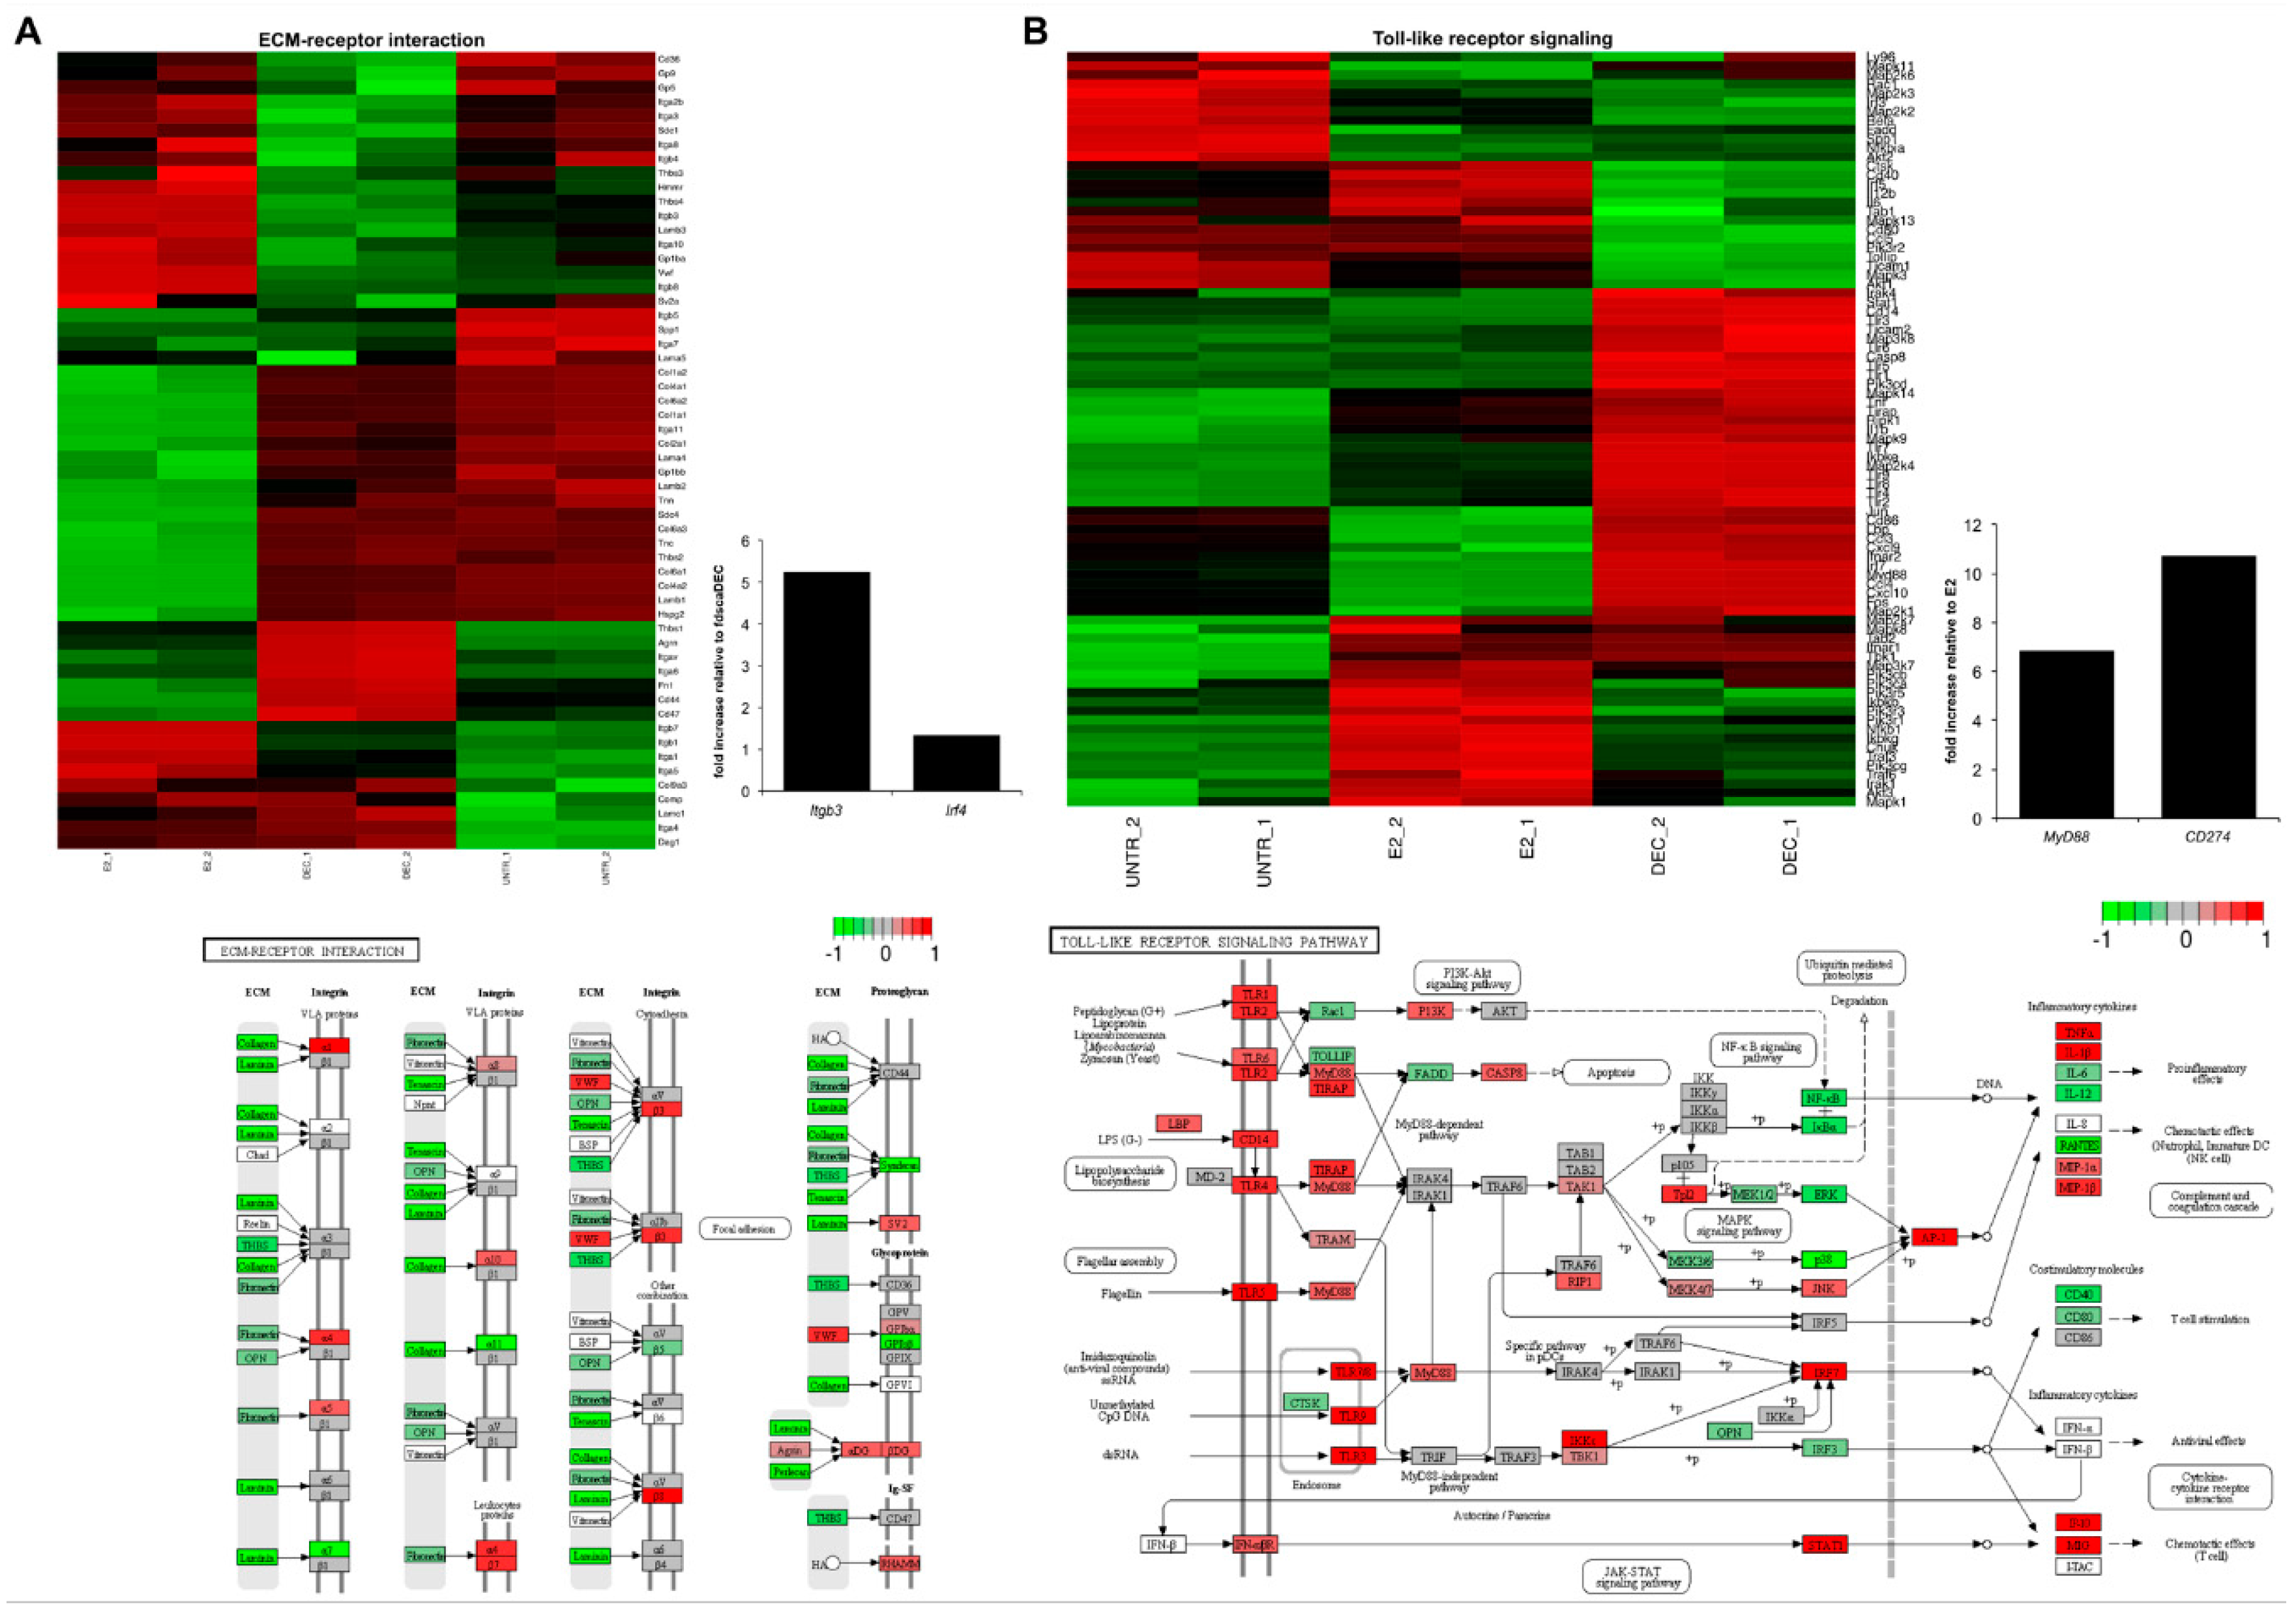
2.1. Perturbation of Gene Transcription and Metabolic Pathways upon Exposure of Dendritic Cells to Both Antigen Delivery Systems
2.2. RNA-Seq Identifies Antigen Delivery System-Specific Gene Expression Signatures
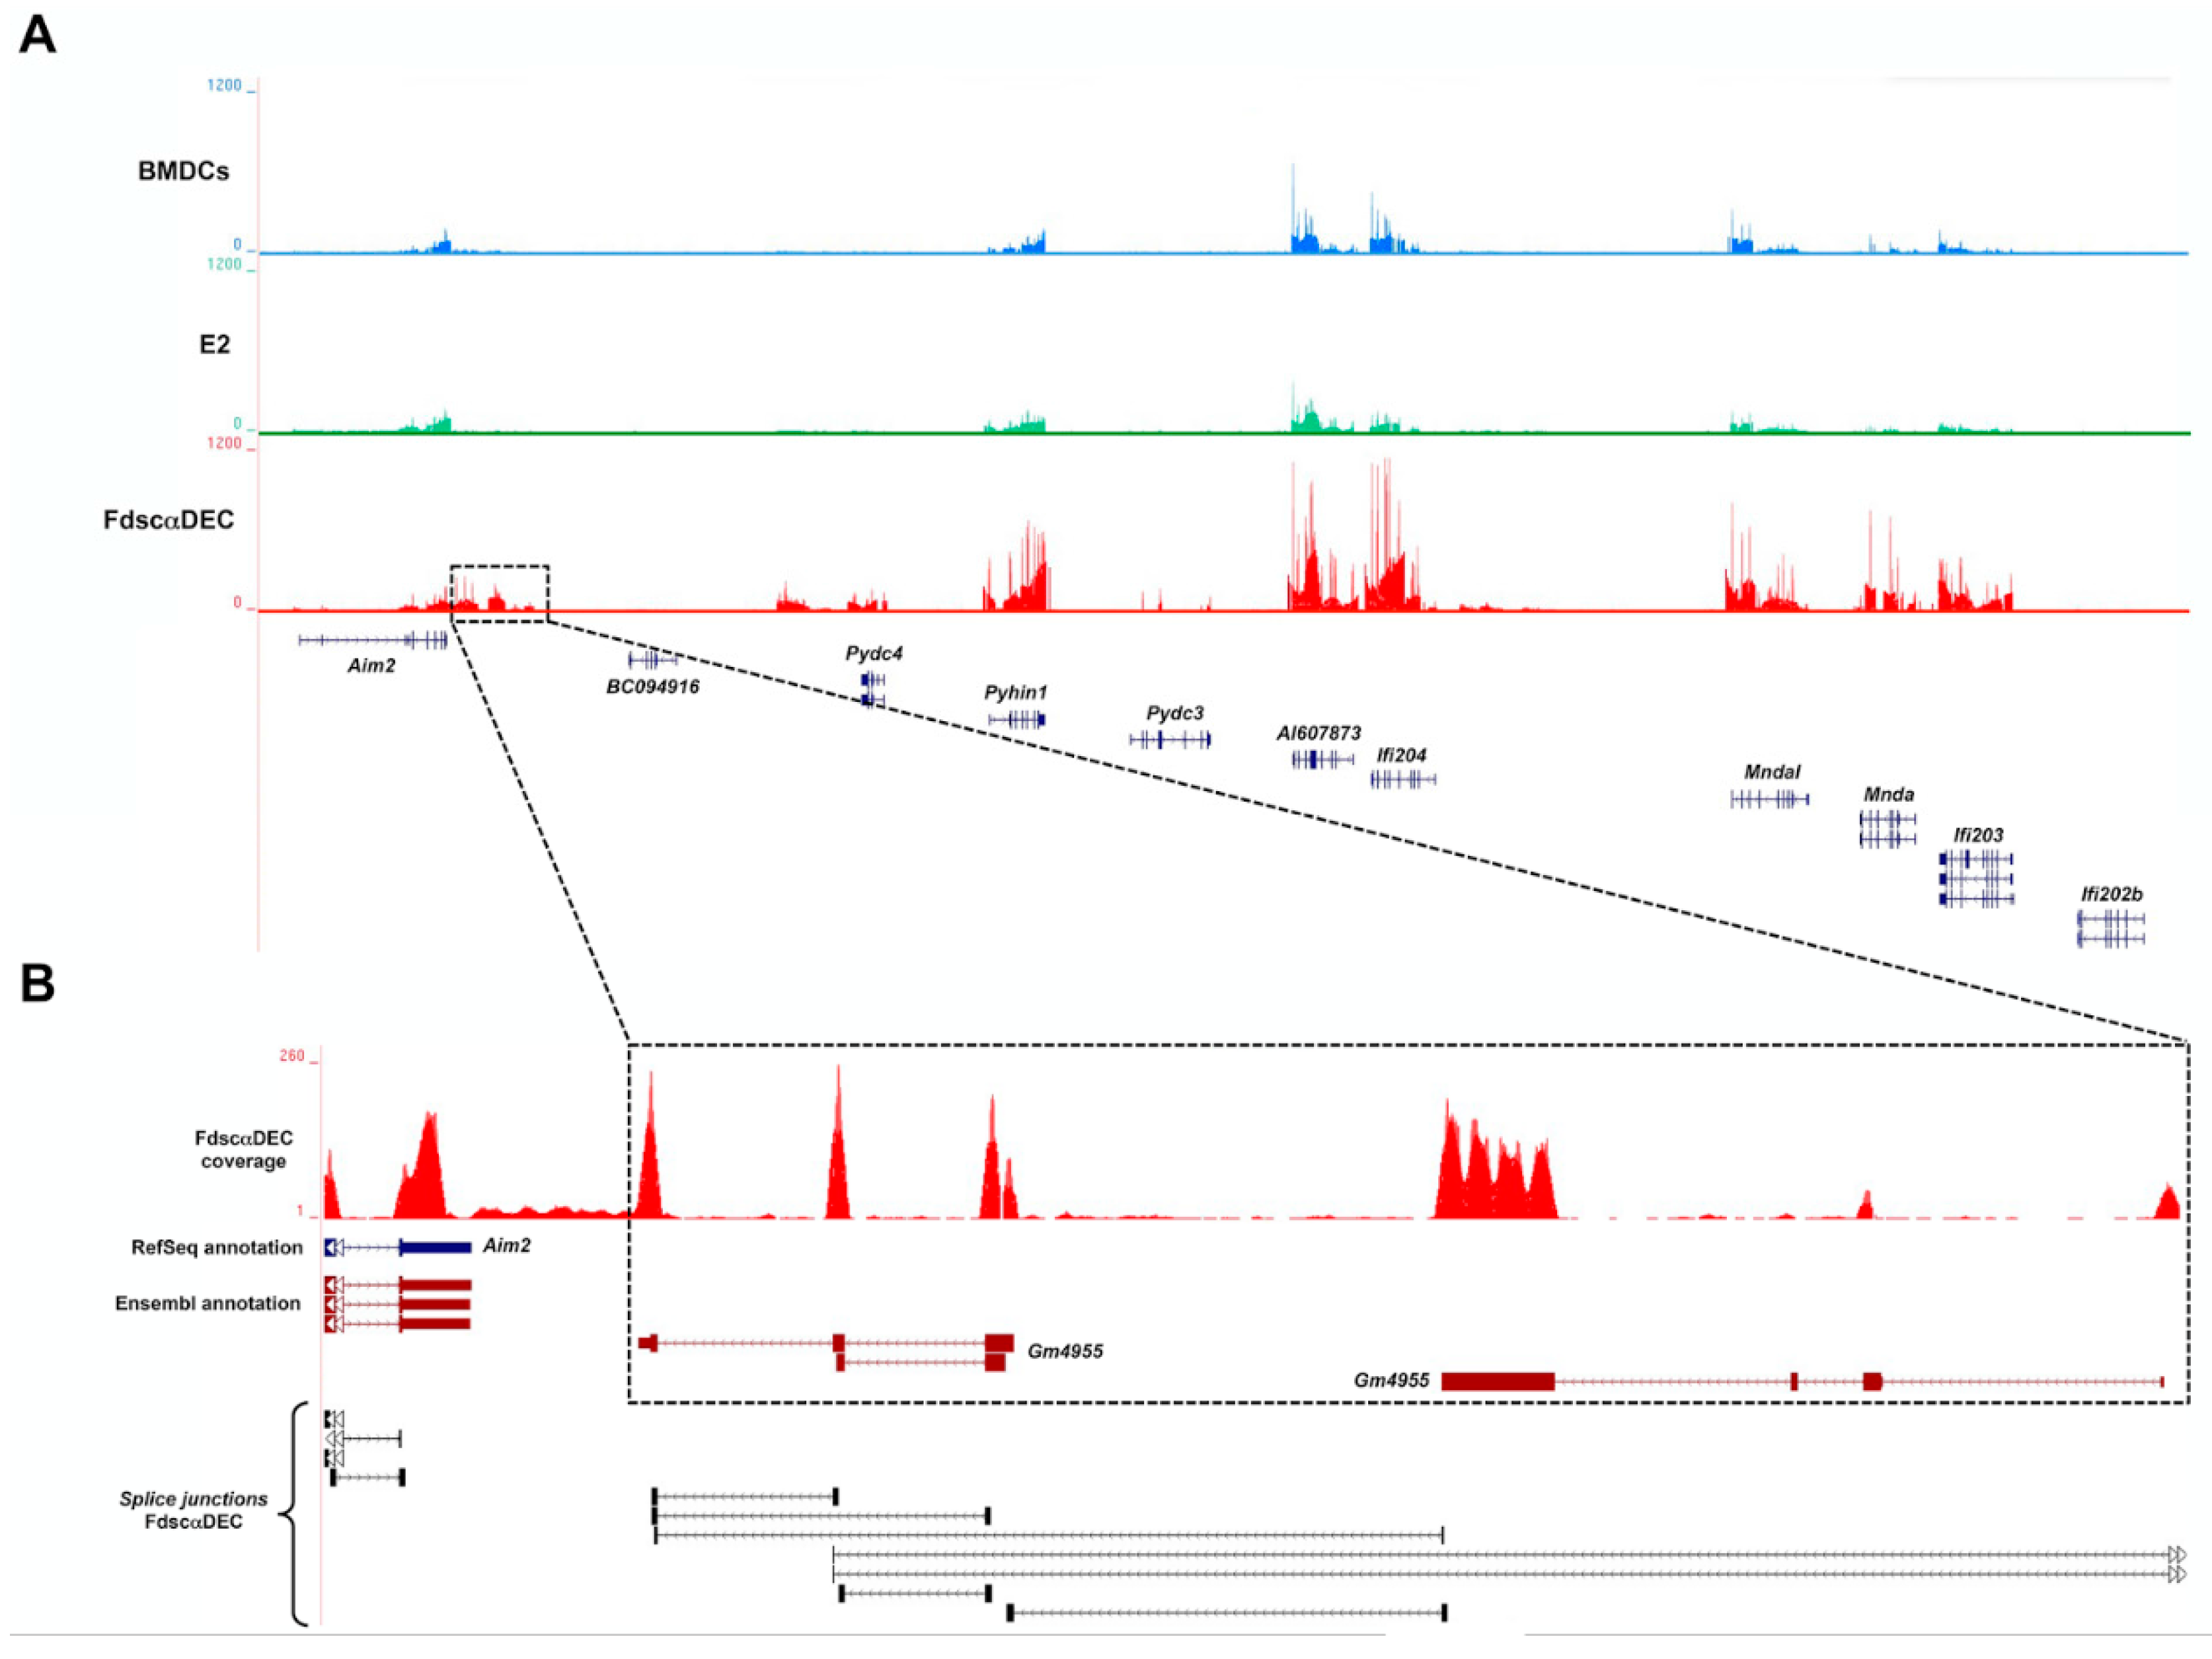
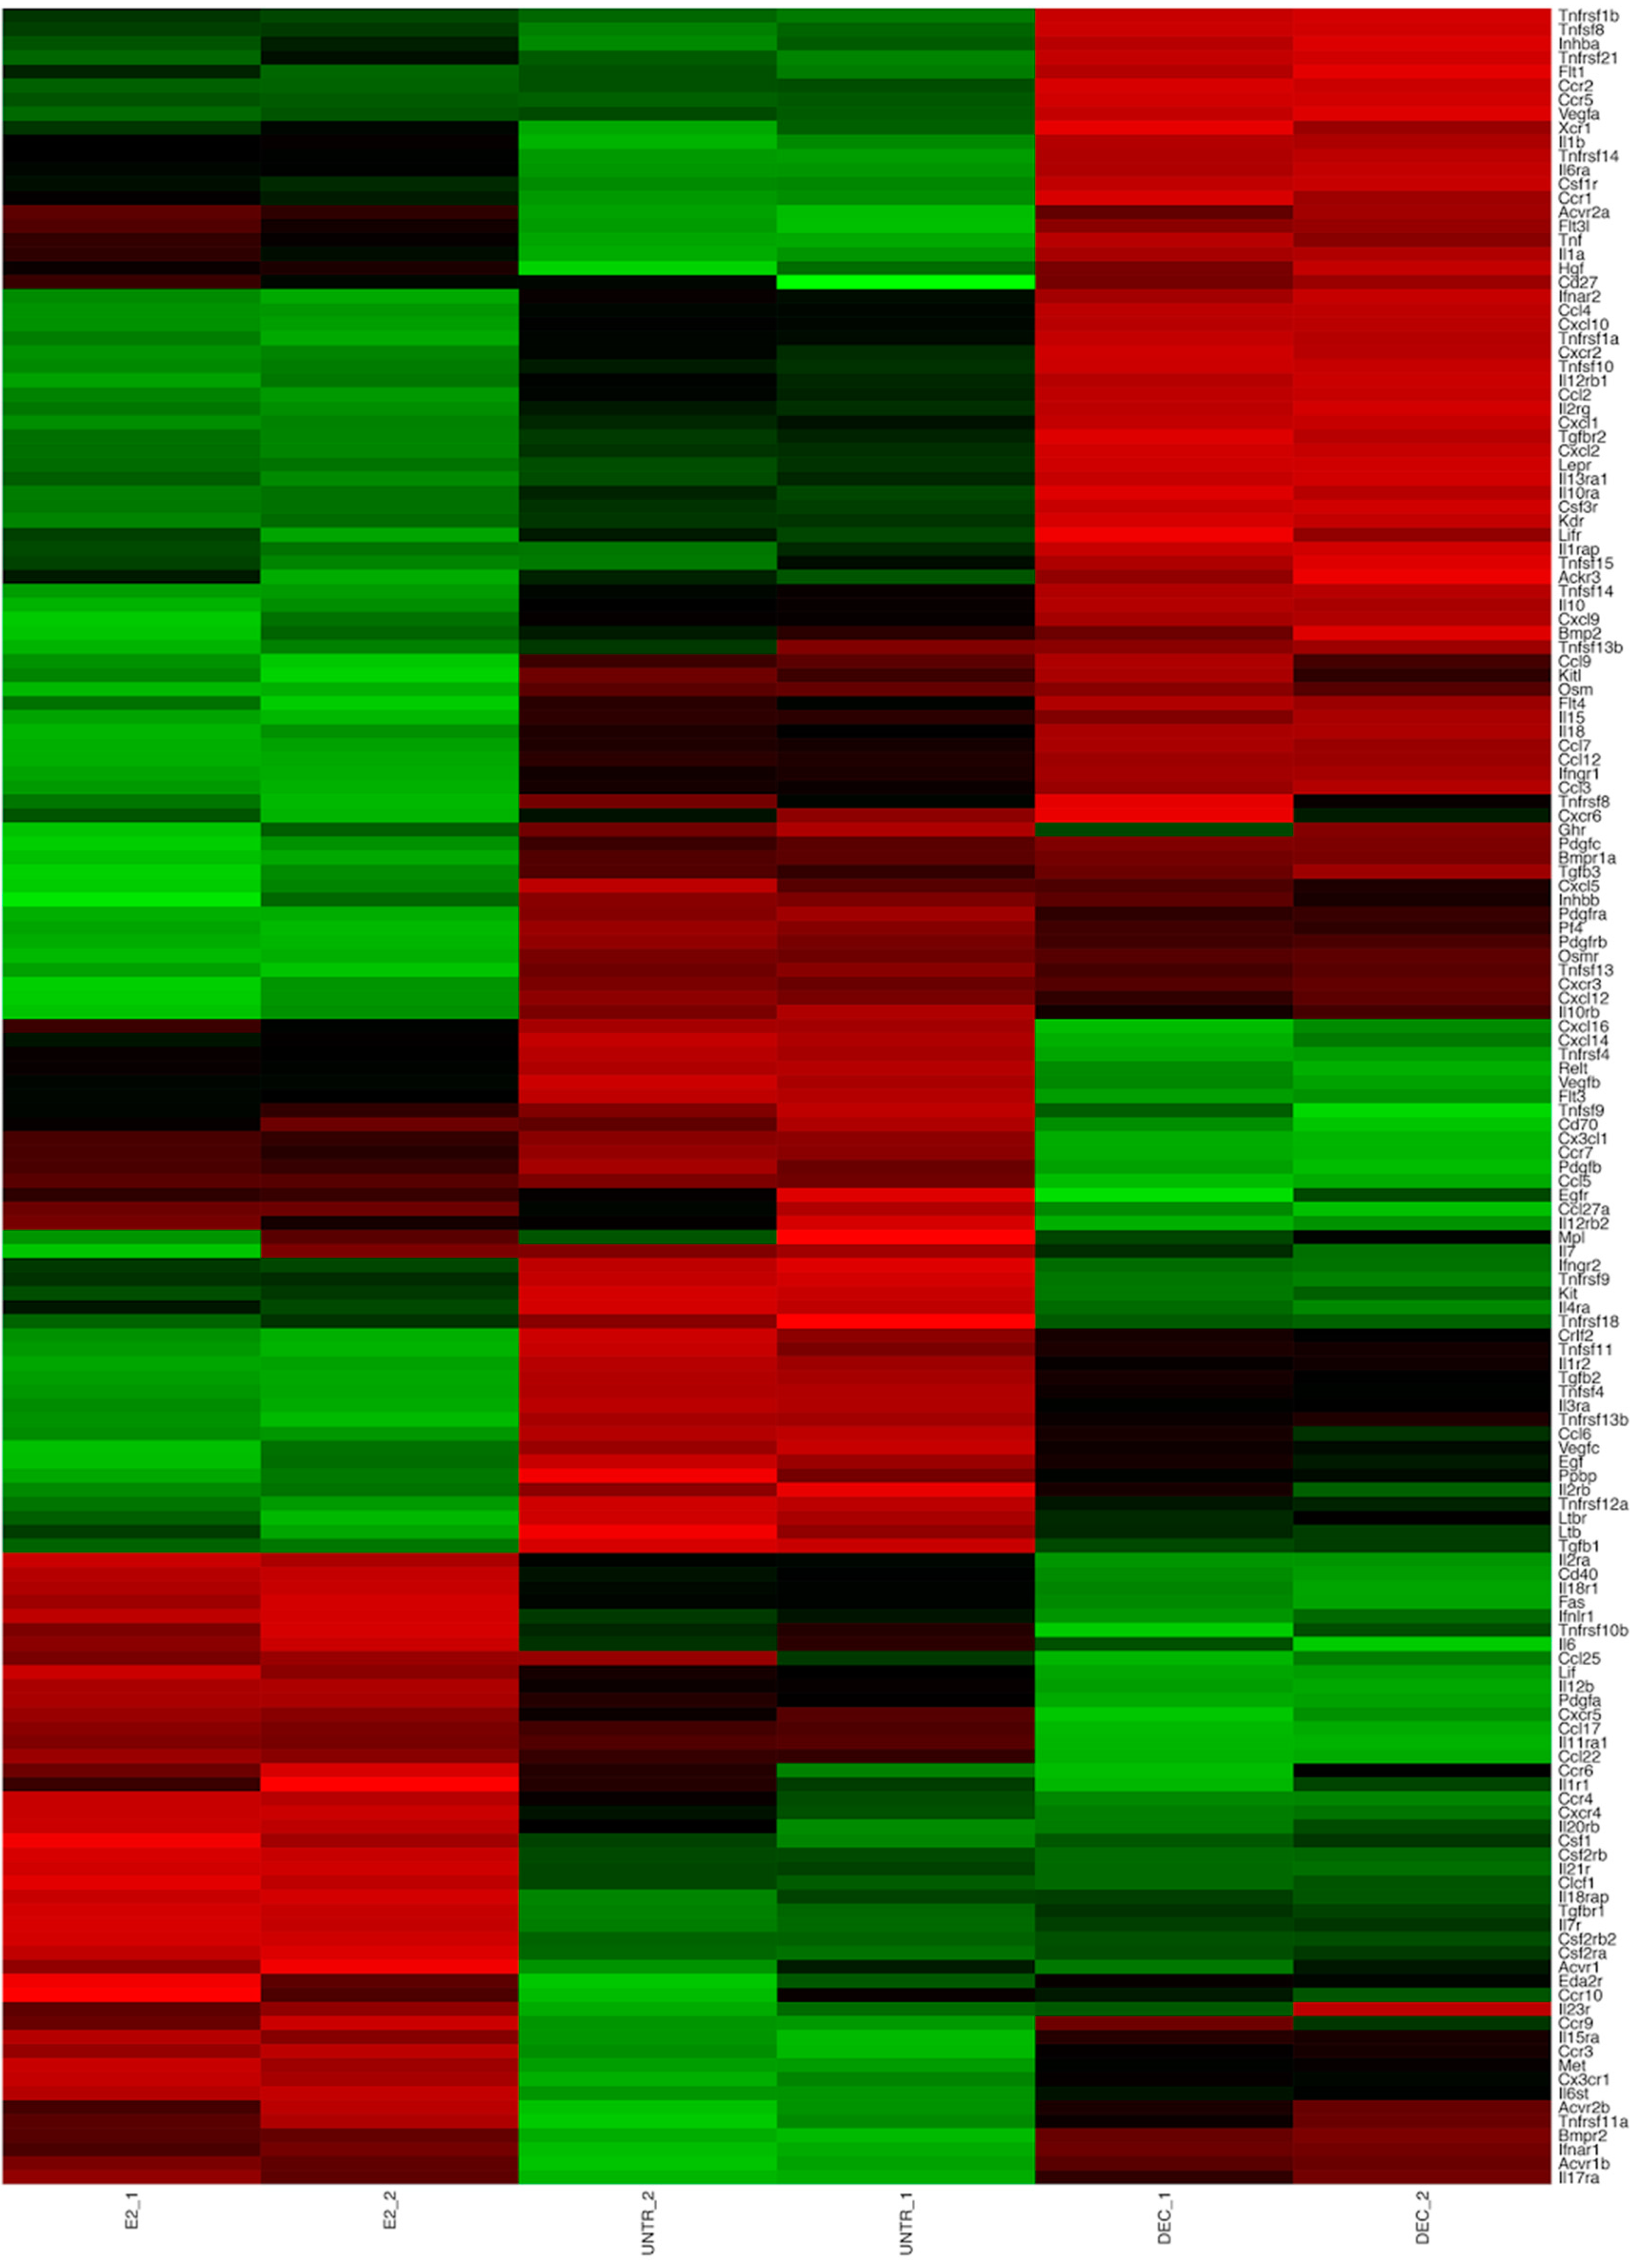
2.3. fd-scαDEC-205 Induces the Transcription of a Coordinated Network of Immune-Related Genes
3. Discussion
4. Material and Methods
4.1. Antigen Delivery Systems Purification and Cell Culture
4.2. RNA, Library and Sequencing
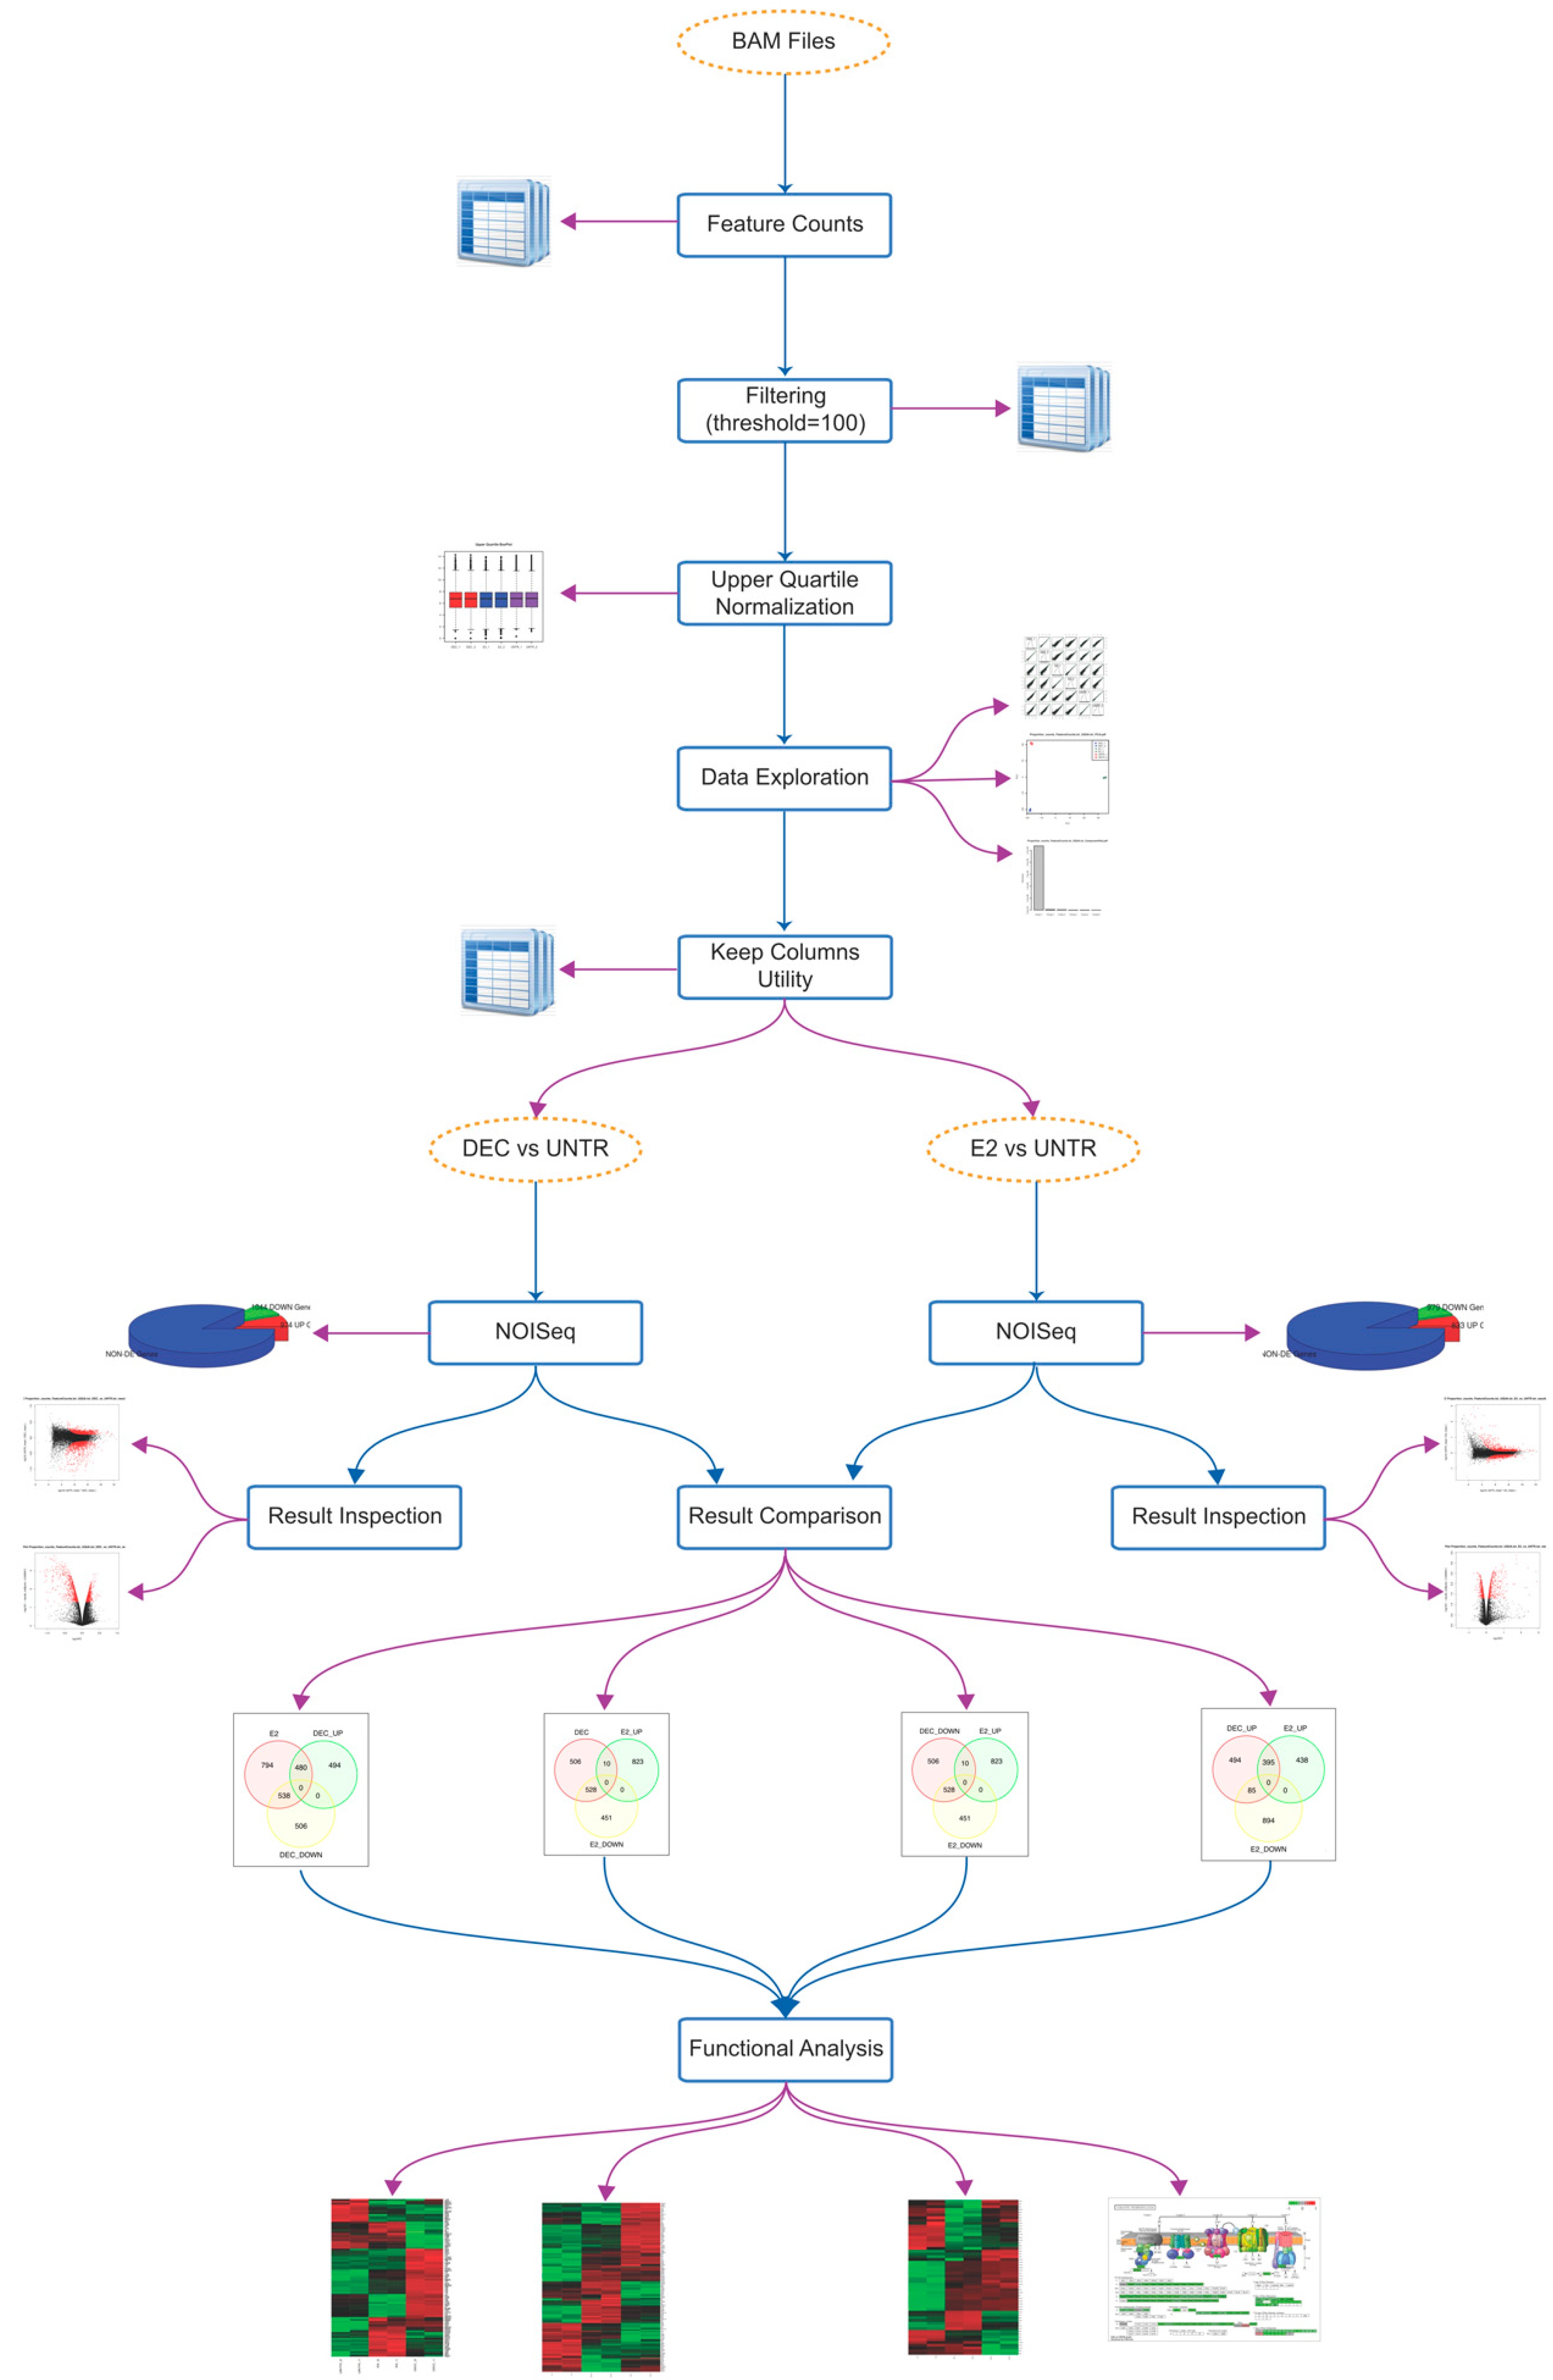
4.3. Data Analysis
4.4. Data Validation
Supplementary Materials
Acknowledgments
Author Contributions
Conflicts of Interest
References
- De Gregorio, E.; Rappuoli, R. From empiricism to rational design: A personal perspective of the evolution of vaccine development. Nat. Rev. Immunol. 2014, 14, 505–514. [Google Scholar] [CrossRef] [PubMed]
- Maertzdorf, J.; Kaufmann, S.; Weiner, J., 3rd. Molecular signatures for vaccine development. Vaccine 2015, 29, 5256–5261. [Google Scholar] [CrossRef] [PubMed]
- Lewis, D.J.M.; Lythgoe, M. Application of “Systems Vaccinology” to Evaluate Inflammation and Reactogenicity of Adjuvanted Preventative Vaccines. J. Immunol. Res 2015, 2015, 909406. [Google Scholar] [CrossRef] [PubMed]
- Caivano, A.; Doria-Rose, N.A.; Buelow, B.; Sartorius, R.; Trovato, M.; D’Apice, L.; Domingo, G.J.; Sutton, W.F.; Haigwood, N.L.; de Berardinis, P. HIV-1 Gag p17 presented as virus-like particles on the E2 scaffold from Geobacillus stearothermophilus induces sustained humoral and cellular immune responses in the absence of IFNγ production by CD4+ T cells. Virology 2010, 407, 296–305. [Google Scholar] [CrossRef] [PubMed]
- Jaworski, J.P.; Krebs, S.J.; Trovato, M.; Kovarik, D.N.; Brower, Z.; Sutton, W.F.; Waagmeester, G.; Sartorius, R.; D’Apice, L.; Caivano, A.; et al. Co-immunization with multimeric scaffolds and DNA rapidly induces potent autologous HIV-1 neutralizing antibodies and CD8+ T cells. PLoS ONE 2012, 7, e31464. [Google Scholar] [CrossRef] [PubMed]
- Sartorius, R.; Pisu, P.; D’Apice, L.; Pizzella, L.; Romano, C.; Cortese, G.; Giorgini, A.; Santoni, A.; Velotti, F.; de Berardinis, P. The use of filamentous bacteriophage fd to deliver MAGE-A10 or MAGE-A3 HLA-A2-restricted peptides and to induce strong antitumor CTL responses. J. Immunol. 2008, 180, 3719–3728. [Google Scholar] [CrossRef] [PubMed]
- Sartorius, R.; Bettua, C.; D’Apice, L.; Caivano, A.; Trovato, M.; Russo, D.; Zanoni, I.; Granucci, F.; Mascolo, D.; Barba, P.; et al. Vaccination with filamentous bacteriophages targeting DEC-205 induces DC maturation and potent anti-tumor T-cell responses in the absence of adjuvants. Eur. J. Immunol. 2011, 41, 2573–2584. [Google Scholar] [CrossRef] [PubMed]
- Domingo, G.J.; Orru’, S.; Perham, R.N. Multiple display of peptides and proteins on a macromolecular scaffold derived from a multienzyme complex. J. Mol. Biol. 2001, 305, 259–267. [Google Scholar] [CrossRef] [PubMed]
- Krebs, S.J.; McBurney, S.P.; Kovarik, D.N.; Waddell, C.D.; Jaworski, J.P.; Sutton, W.F.; Gomes, M.M.; Trovato, M.; Waagmeester, G.; Barnett, S.J.; et al. Multimeric Scaffolds Displaying the HIV-1 Envelope MPER Induce MPER-Specific Antibodies and Cross-Neutralizing Antibodies when Co-Immunized with gp160 DNA. PLoS ONE 2014, 16, e0120027. [Google Scholar] [CrossRef] [PubMed]
- Trovato, M.; Maurano, F.; D’Apice, L.; Costa, V.; Sartorius, R.; Cuccaro, F.; McBurney, S.P.; Krebs, S.J.; Prisco, A.; Ciccodicola, A.; et al. E2 multimeric scaffold for vaccine formulation: Immune response by intranasal delivery and transcriptome profile of E2-pulsed dendritic cells. BMC Microbiol. 2016, 16, 152. [Google Scholar] [CrossRef] [PubMed]
- Malik, P.; Terry, T.D.; Gowda, L.R.; Langara, A.; Petukhov, S.A.; Symmons, M.F.; Welsh, L.C.; Marvin, D.A.; Perham, R.N. Role of capsid structure and membrane protein processing in determining the size and copy number of peptides displayed on the major coat protein of filamentous bacteriophage. J. Mol. Biol. 1996, 260, 9–21. [Google Scholar] [CrossRef] [PubMed]
- De Berardinis, P.; D’Apice, L.; Prisco, A.; Ombra, M.N.; Barba, P.; Del Pozzo, G.; Petukhov, S.; Malik, P.; Perham, R.N.; Guardiola, J. Recognition of HIV-derived B and T cell epitopes displayed on filamentous phages. Vaccine 1999, 17, 1434–1444. [Google Scholar] [CrossRef]
- De Berardinis, P.; Sartorius, R.; Fanutti, C.; Perham, R.N.; Del Pozzo, G.; Guardiola, J. Phage display of peptide epitopes from HIV-1 elicits strong cytolytic responses. Nat. Biotechnol. 2000, 18, 873–876. [Google Scholar] [CrossRef] [PubMed]
- Sartorius, R.; D’Apice, L.; Trovato, M.; Cuccaro, F.; Costa, V.; de Leo, M.G.; Marzullo, V.M.; Biondo, C.; D’Auria, S.; de Matteis, M.A.; et al. Antigen delivery by filamentous bacteriophage fd displaying an anti-DEC-205 single-chain variable fragment confers adjuvanticity by triggering a TLR9-mediated immune response. EMBO Mol. Med. 2015, 17, 973–988. [Google Scholar] [CrossRef] [PubMed]
- Peng, R.D. Reproducible research in computational science. Science 2011, 334, 1226–1227. [Google Scholar] [CrossRef] [PubMed]
- Nekrutenko, A.; Taylor, J. Next-generation sequencing data interpretation: Enhancing reproducibility and accessibility. Nat. Rev. Genet. 2012, 13, 667–672. [Google Scholar] [CrossRef] [PubMed]
- Stodden, V.; Guo, P.; Ma, Z. Toward Reproducible Computational Research: An Empirical Analysis of Data and Code Policy Adoption by Journals. PLoS ONE 2013, 8, e67111. [Google Scholar] [CrossRef] [PubMed]
- Russo, F.; Righelli, D.; Angelini, C. Advancements in RNASeqGUI towards a Reproducible Analysis of RNA-Seq Experiments. BioMed Res. Int. 2016, 2016, 7972351. [Google Scholar] [CrossRef] [PubMed]
- Witten, D.M.; Tibshirani, R. Scientific research in the age of omics: The good, the bad, and the sloppy. J. Am. Med. Inf. Assoc. 2013, 20, 125–127. [Google Scholar] [CrossRef] [PubMed]
- Iqbal, S.A.; Wallach, J.D.; Khoury, M.J.; Schully, S.D.; Ioannidis, J.P. Reproducible Research Practices and Transparency across the Biomedical Literature. PLoS Biol. 2016, 4, e1002333. [Google Scholar] [CrossRef] [PubMed]
- American Society for Cell Biology. How Can Scientists Enhance Rigor in Conducting Basic Research and Reporting Research Results? A White Paper from the American Society for Cell Biology. Available online: www.ascb.org/wp-content/uploads/2015/11/How-can-scientist-enhance-rigor.pdf (accessed on 15 July 2015).
- Russo, F.; Angelini, C. RNASeqGUI: A GUI for analysing RNA-Seq data. Bioinformatics 2014, 30, 2514–2516. [Google Scholar] [CrossRef] [PubMed]
- Kelly, B.; O’Neill, L.A. Metabolic reprogramming in macrophages and dendritic cells in innate immunity. Cell Res. 2015, 25, 771–784. [Google Scholar] [CrossRef] [PubMed]
- Tarazona, S.; Furio-Tari, P.; Turra, D.; Pietro, A.D.; Nueda, M.J.; Ferrer, A.; Conesa, A. Data quality aware analysis of differential expression in RNA-seq with NOISeq R/Bioc package. Nucleic Acids Res. 2015, 43, e140. [Google Scholar] [CrossRef] [PubMed]
- D’Apice, L.; Costa, V.; Sartorius, R.; Trovato, M.; Aprile, M.; De Berardinis, P. Stimulation of Innate and Adaptive Immunity by Using Filamentous Bacteriophage fd Targeted to DEC-205. J. Immunol. Res. 2015, 2015, 585078. [Google Scholar] [CrossRef] [PubMed]
- Foti, M.; Granucci, F.; Aggujaro, D.; Liboi, E.; Luini, W.; Minardi, S.; Mantovani, A.; Sozzani, S.; Ricciardi-Castagnoli, P. Upon dendritic cell (DC) activation chemokines and chemokine receptor expression are rapidly regulated for recruitment and maintenance of DC at the inflammatory site. Int. Immunol. 1999, 1, 979–986. [Google Scholar] [CrossRef]
- Imai, T.; Nagira, M.; Takagi, S.; Kakizaki, M.; Nishimura, M.; Wang, J.; Gray, P.W.; Matsushima, K.; Yoshie, O. Selective recruitment of CCR4-bearing Th2 cells toward antigen-presenting cells by the CC chemokines thymus and activation-regulated chemokine and macrophage-derived chemokine. Int. Immunol. 1999, 11, 81–88. [Google Scholar] [CrossRef] [PubMed]
- Halim, T.Y.; Hwang, Y.Y.; Scalnon, S.T.; Zaghouani, H.; Garbi, N.; Fallon, P.G.; McKenzie, A.N. Group 2 innate lymphoid cells license dendritic cells to potentiate memory TH2 cell responses. Nat. Immunol. 2016, 17, 757–764. [Google Scholar] [CrossRef] [PubMed]
- Karpus, W.J.; Kennedy, K.J. MIP-1α and MCP-1 differentially regulate acute and relapsing autoimmune encephalomyelitis as well as Th1/Th2 lymphocyte differentiation. J. Leukoc. Biol. 1997, 62, 681–687. [Google Scholar] [PubMed]
- De Preter, K.; Barriot, R.; Speleman, F.; Vandesompele, J.; Moreau, Y. Positional gene enrichment analysis of gene sets for high-resolution identification of overrepresented chromosomal regions. Nucleic Acids Res. 2008, 36, e43. [Google Scholar] [CrossRef] [PubMed]
- Jenner, R.; Young, R. Insights into host responses against pathogens from transcriptional profiling. Nat. Rev. Microbiol. 2005, 3, 281–294. [Google Scholar] [CrossRef] [PubMed]
- Knudsen, N.P.H.; Olsen, A.; Buonsanti, C.; Follmann, F.; Zhang, Y.; Coler, R.N.; Fox, C.B.; Meinke, A.; D’Oro, U.; Casini, D.; et al. Different human vaccine adjuvants promote distinct antigen-independent immunological signatures tailored to different pathogens. Sci. Rep. 2016, 6, 19570. [Google Scholar] [CrossRef] [PubMed]
- Mammadov, R.; Cinar, G.; Gunduz, N.; Goktas, M.; Kayhan, H.; Tohumeken, S.; Topal, A.E.; Orujalipoor, I.; Delibasi, T.; Dana, A.; et al. Virus-like nanostructures for tuning immune response. Sci. Rep. 2015, 5, 16728. [Google Scholar] [CrossRef] [PubMed]
- Pearce, E.J.; Everts, B. Dendritic cell metabolism. Nat. Rev. Immunol. 2015, 15, 18–29. [Google Scholar] [CrossRef] [PubMed]
- Pantel, A.; Teixeira, A.; Haddad, E.; Wood, E.G.; Steinman, R.M.; Longhi, M.P. Direct type I IFN but not MDA5/TLR3 activation of dendritic cells is required for maturation and metabolic shift to glycolysis after poly IC stimulation. PLoS Biol. 2014, 12, e1001759. [Google Scholar] [CrossRef] [PubMed]
- Russo, F.; Righelli, D.; Angelini, C. Advantages and limits in the adoption of Reproducible Research, and R tools for the analysis of omic data. Int. Meet. Comput. Intell. Methods Bioinf. Biostat. 2016. [Google Scholar] [CrossRef]
- Aida, Y.; Pabst, M.J. Removal of endotoxin from protein solutions by phase separation using triton X-114. J. Immunol. Methods 1990, 132, 191–195. [Google Scholar] [CrossRef]
- Kim, D.; Pertea, G.; Trapnell, C.; Pimentel, H.; Kelley, R.; Salzberg, S.L. TopHat2: Accurate alignment of transcriptomes in the presence of insertions, deletions and gene fusions. Genome Biol. 2013, 14, 36. [Google Scholar] [CrossRef] [PubMed]
- Livak, K.J.; Schmittgen, T.D. Analysis of relative gene expression data using real-time quantitative PCR and the 2−ΔΔCt Method. Methods 2001, 25, 402–408. [Google Scholar] [CrossRef] [PubMed]


| De-Regulated Status | Differentially Expressed Genes | ||
|---|---|---|---|
| E2 | fd-scαDEC-205 | Both | |
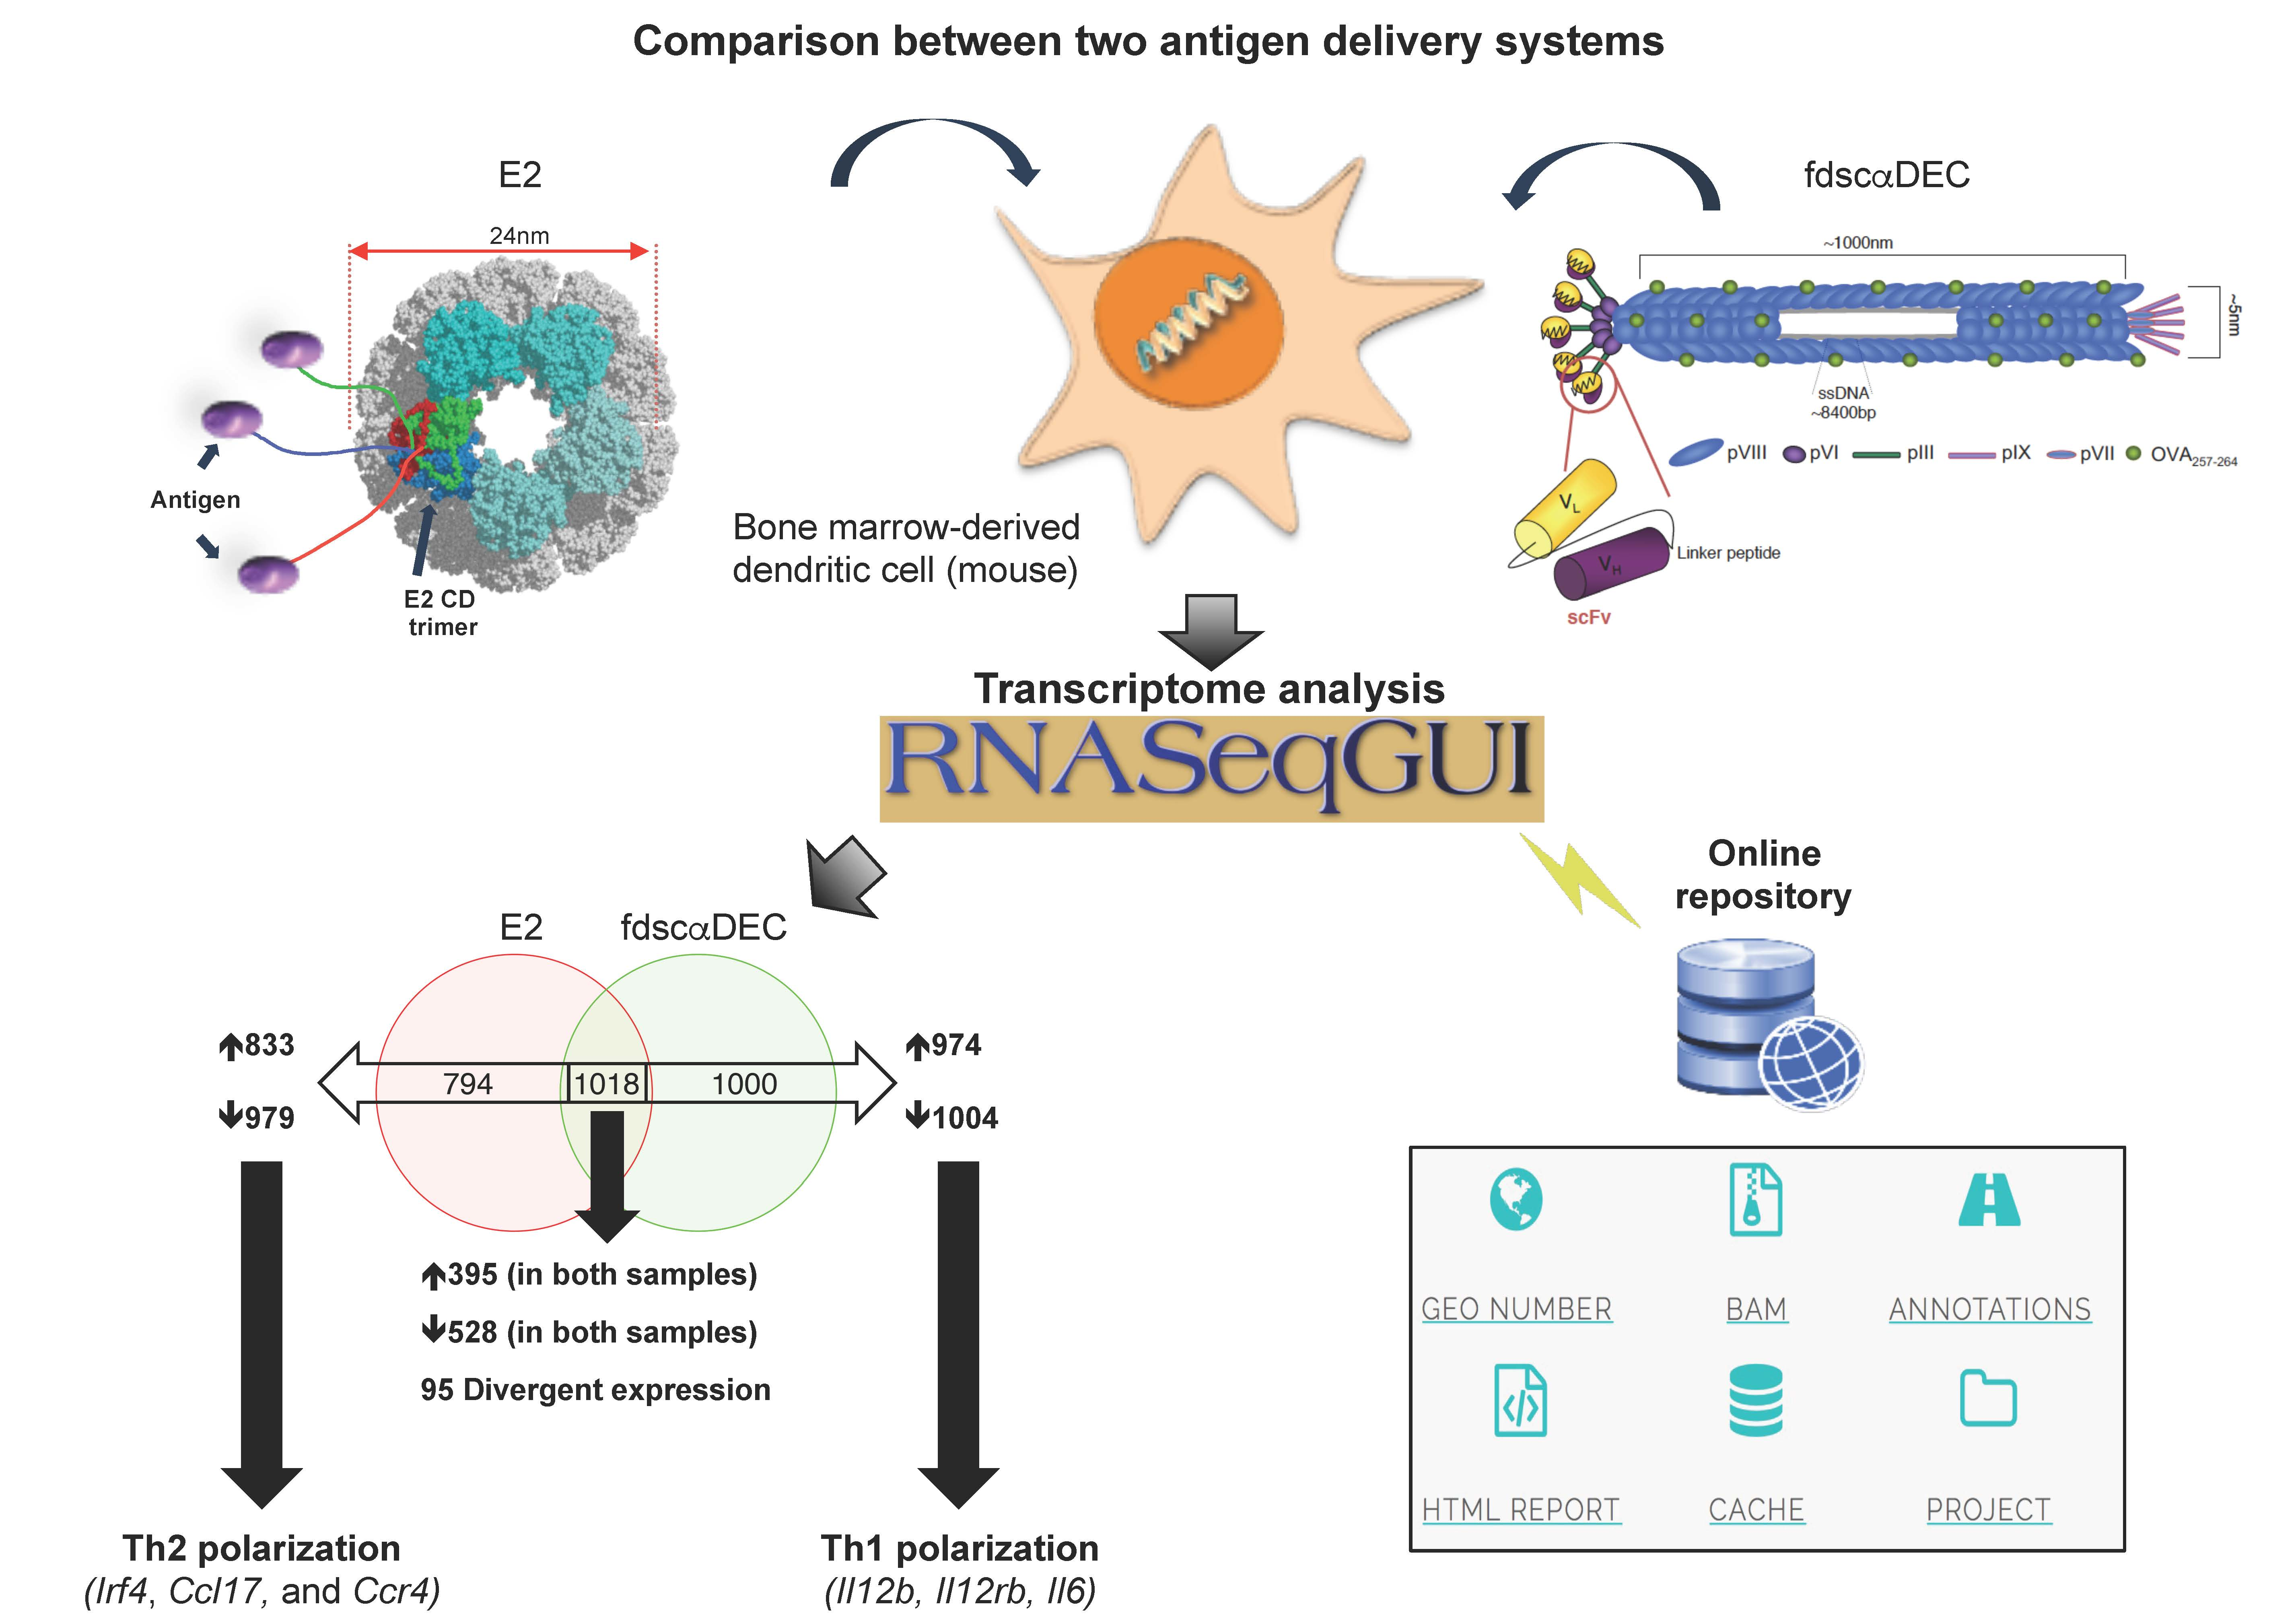
| up | Extracellular Matrix-receptor interaction: online Supplementary files Focal adhesion: online Supplementary files Homeostatic chemokines/receptors: Ccl25, Ccl27, Cxcr5, Ccr9, Ccr10 Polarization toward DC2: Irf4, Ccl17, Ccr4 Regulation of actin cytoskeleton: online Supplementary files Regulation of cell communication: online Supplementary files Regulation of signal transduction: online Supplementary files | Chemokine receptors: Ccr1, Ccr2 and Ccr5 Chemotactic chemokines: Cxcl1, Cxcl2, Cxcl3, Cxcl10 DC co-stimulation: Cd274 HIN-200 gene family: see Figure 5 Inflammatory molecules and chemokines: Cxcl10, Ccl2, Ccl3, Ccl4, Ccl5, Cxcl12, Il1a, Il1b, Il18, Ifnar1, Ifnar2 Interferon-induced genes: Ifit1, Ifit2 NOD-like receptor (Nucleotide-binding Oligomerization Domain-like receptors): online Supplementary files Polarization toward DC1: Il12b, Il12rb, Il6, Il6st, Ccl3/Mip1a OAS gene family (Oligoadenylate Synthetase): Oas1a, Oas1b, Oas1c, Oas1g, Oas2, Oas3, Oasl1 RIG-I-like receptor (Retinoic acid-Inducible Gene I-like receptor): online Supplementary files Toll-like receptor: online Supplementary files | Chromosome organization: online Supplementary files Mediator complex: Med12, Med13, Med13l, Med14 Notch signaling: Notch1, Notch2 Regulation of transcription: online Supplementary files |
| down | Chemokine receptors: Ccr1, Ccr2 and Ccr5 DC co-stimulation: Cd274 Inflammatory chemokines: Cxcl10, Ccl2, Ccl3, Ccl4, Ccl5 | Immature DC marker: Ccr6 | Chemokines for basal migration: Ccl6, Cxcl14, Cxcl16 Immune cells’ survival: Il7, Pdgfra Oxidative phosphorylation: online Supplementary files Ribosome: online Supplementary files |
© 2017 by the authors. Licensee MDPI, Basel, Switzerland. This article is an open access article distributed under the terms and conditions of the Creative Commons Attribution (CC BY) license ( http://creativecommons.org/licenses/by/4.0/).
Share and Cite
Costa, V.; Righelli, D.; Russo, F.; De Berardinis, P.; Angelini, C.; D’Apice, L. Distinct Antigen Delivery Systems Induce Dendritic Cells’ Divergent Transcriptional Response: New Insights from a Comparative and Reproducible Computational Analysis. Int. J. Mol. Sci. 2017, 18, 494. https://doi.org/10.3390/ijms18030494
Costa V, Righelli D, Russo F, De Berardinis P, Angelini C, D’Apice L. Distinct Antigen Delivery Systems Induce Dendritic Cells’ Divergent Transcriptional Response: New Insights from a Comparative and Reproducible Computational Analysis. International Journal of Molecular Sciences. 2017; 18(3):494. https://doi.org/10.3390/ijms18030494
Chicago/Turabian StyleCosta, Valerio, Dario Righelli, Francesco Russo, Piergiuseppe De Berardinis, Claudia Angelini, and Luciana D’Apice. 2017. "Distinct Antigen Delivery Systems Induce Dendritic Cells’ Divergent Transcriptional Response: New Insights from a Comparative and Reproducible Computational Analysis" International Journal of Molecular Sciences 18, no. 3: 494. https://doi.org/10.3390/ijms18030494
APA StyleCosta, V., Righelli, D., Russo, F., De Berardinis, P., Angelini, C., & D’Apice, L. (2017). Distinct Antigen Delivery Systems Induce Dendritic Cells’ Divergent Transcriptional Response: New Insights from a Comparative and Reproducible Computational Analysis. International Journal of Molecular Sciences, 18(3), 494. https://doi.org/10.3390/ijms18030494