
Does the Prostate Health Index Depend on Tumor Volume?—A Study on 196 Patients after Radical Prostatectomy

 ,
, 
Abstract
:1. Introduction
2. Results
2.1. Clinicopathological Characteristics of the Study Cohort
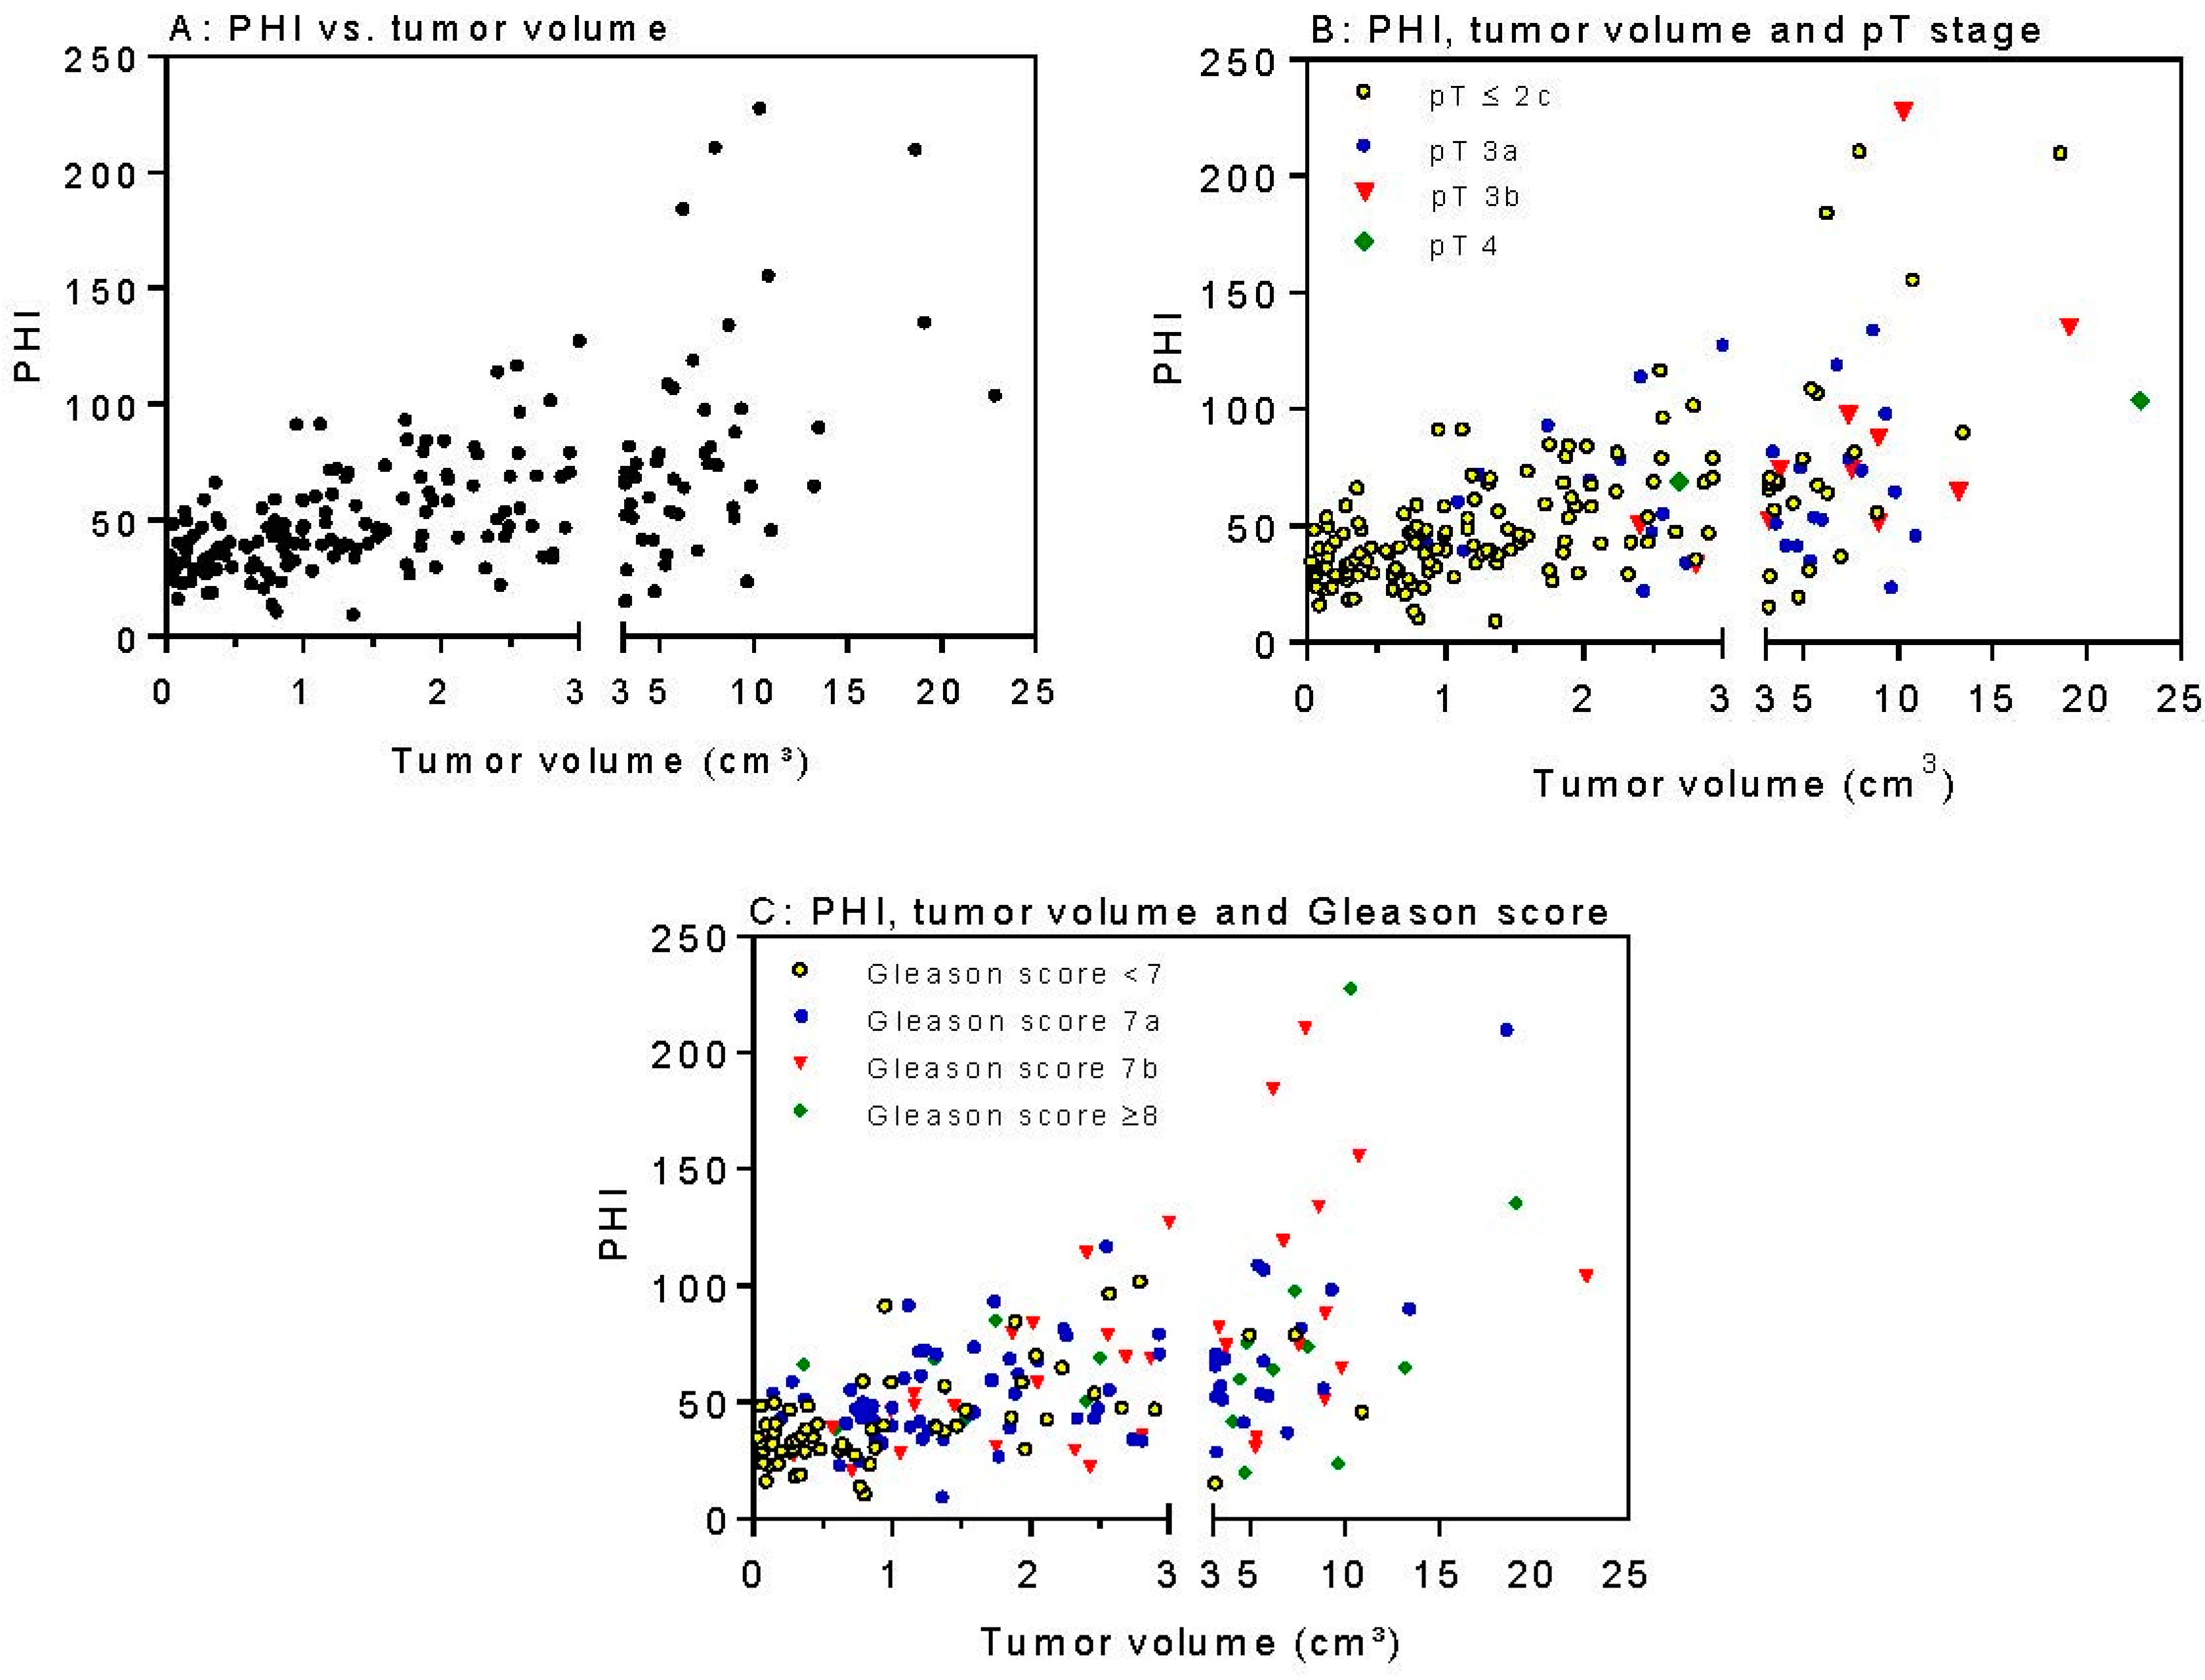
2.2. PSA Parameters in Relation to Clinicopatholological Factors and Tumor Volume
2.3. PHI and Tumor Volume as Independent Predictors of Biochemical Relapse
3. Discussion
4. Materials and Methods
4.1. Study Population
4.2. Pathology Assessment
4.3. Serological Diagnosis and Volumetric Analysis
4.4. Statistical Analysis
Supplementary Materials
Acknowledgments
Author Contributions
Conflicts of Interest
References
- The American Cancer Society. Cancer Facts & Figures 2015. Available online: Http://www.Cancer.Org/research/cancerfactsstatistics (accessed on 15 May 2015).
- European Association of Urology. Guidelines on Prostate-Cancer 2015. Available online: Http://uroweb.Org/guideline/prostate-cancer/ (accessed on 4 June 2015).
- Epstein, J.I.; Amin, M.; Boccon-Gibod, L.; Egevad, L.; Humphrey, P.A.; Mikuz, G.; Newling, D.; Nilsson, S.; Sakr, W.; Srigley, J.R.; et al. Prognostic factors and reporting of prostate carcinoma in radical prostatectomy and pelvic lymphadenectomy specimens. Scand. J. Urol. Nephrol. Suppl. 2005, 216, 34–63. [Google Scholar] [CrossRef] [PubMed]
- McNeal, J.E.; Villers, A.A.; Redwine, E.A.; Freiha, F.S.; Stamey, T.A. Capsular penetration in prostate cancer. Significance for natural history and treatment. Am. J. Surg. Pathol. 1990, 14, 240–247. [Google Scholar] [CrossRef] [PubMed]
- McNeal, J.E.; Villers, A.A.; Redwine, E.A.; Freiha, F.S.; Stamey, T.A. Histologic differentiation, cancer volume, and pelvic lymph node metastasis in adenocarcinoma of the prostate. Cancer 1990, 66, 1225–1233. [Google Scholar] [PubMed]
- Stamey, T.A.; Freiha, F.S.; McNeal, J.E.; Redwine, E.A.; Whittemore, A.S.; Schmid, H.P. Localized prostate cancer. Relationship of tumor volume to clinical significance for treatment of prostate cancer. Cancer 1993, 71, 933–938. [Google Scholar] [CrossRef]
- Kattan, M.W.; Eastham, J.A.; Wheeler, T.M.; Maru, N.; Scardino, P.T.; Erbersdobler, A.; Graefen, M.; Huland, H.; Koh, H.; Shariat, S.; et al. Counseling men with prostate cancer: A nomogram for predicting the presence of small, moderately differentiated, confined tumors. J. Urol. 2003, 170, 1792–1797. [Google Scholar] [CrossRef] [PubMed]
- De la Calle, C.; Patil, D.; Wei, J.T.; Scherr, D.S.; Sokoll, L.; Chan, D.W.; Siddiqui, J.; Mosquera, J.M.; Rubin, M.A.; Sanda, M.G. Multicenter evaluation of the prostate health index to detect aggressive prostate cancer in biopsy naive men. J. Urol. 2015, 194, 65–72. [Google Scholar] [CrossRef] [PubMed]
- Filella, X.; Gimenez, N. Evaluation of [−2]proPSA and prostate health index (PHI) for the detection of prostate cancer: A systematic review and meta-analysis. Clin. Chem. Lab. Med. 2013, 51, 729–739. [Google Scholar] [CrossRef] [PubMed]
- Ferro, M.; Lucarelli, G.; Bruzzese, D.; Perdona, S.; Mazzarella, C.; Perruolo, G.; Marino, A.; Cosimato, V.; Giorgio, E.; Tagliamonte, V.; et al. Improving the prediction of pathologic outcomes in patients undergoing radical prostatectomy: The value of prostate cancer antigen 3 (PCa3), prostate health index (PHI) and sarcosine. Anticancer Res. 2015, 35, 1017–1023. [Google Scholar] [PubMed]
- Guazzoni, G.; Lazzeri, M.; Nava, L.; Lughezzani, G.; Larcher, A.; Scattoni, V.; Gadda, G.M.; Bini, V.; Cestari, A.; Buffi, N.M.; et al. Preoperative prostate-specific antigen isoform p2PSA and its derivatives, %p2PSA and prostate health index, predict pathologic outcomes in patients undergoing radical prostatectomy for prostate cancer. Eur. Urol. 2012, 61, 455–466. [Google Scholar] [CrossRef] [PubMed]
- Chiu, P.K.; Lai, F.M.; Teoh, J.Y.; Lee, W.M.; Yee, C.H.; Chan, E.S.; Hou, S.M.; Ng, C.F. Prostate health index and %p2PSA predict aggressive prostate cancer pathology in Chinese patients undergoing radical prostatectomy. Ann. Surg. Oncol. 2016, 23, 2707–2714. [Google Scholar] [CrossRef] [PubMed]
- Lazzeri, M.; Haese, A.; de la Taille, A.; Palou Redorta, J.; McNicholas, T.; Lughezzani, G.; Scattoni, V.; Bini, V.; Freschi, M.; Sussman, A.; et al. Serum isoform [−2]proPSA derivatives significantly improve prediction of prostate cancer at initial biopsy in a total PSA range of 2–10 ng/mL: A multicentric European study. Eur. Urol. 2013, 63, 986–994. [Google Scholar] [CrossRef] [PubMed]
- Cantiello, F.; Russo, G.I.; Ferro, M.; Cicione, A.; Cimino, S.; Favilla, V.; Perdona, S.; Bottero, D.; Terracciano, D.; de Cobelli, O.; et al. Prognostic accuracy of prostate health index and urinary prostate cancer antigen 3 in predicting pathologic features after radical prostatectomy. Urol. Oncol. 2015, 33, 163.e115–163.e123. [Google Scholar] [CrossRef] [PubMed]
- Hirama, H.; Sugimoto, M.; Ito, K.; Shiraishi, T.; Kakehi, Y. The impact of baseline [−2]proPSA-related indices on the prediction of pathological reclassification at 1 year during active surveillance for low-risk prostate cancer: The Japanese multicenter study cohort. J. Cancer Res. Clin. Oncol. 2014, 140, 257–263. [Google Scholar] [CrossRef] [PubMed]
- Klotz, L.; Zhang, L.; Lam, A.; Nam, R.; Mamedov, A.; Loblaw, A. Clinical results of long-term follow-up of a large, active surveillance cohort with localized prostate cancer. J. Clin. Oncol. 2010, 28, 126–131. [Google Scholar] [CrossRef] [PubMed]
- Nichol, M.B.; Wu, J.; An, J.J.; Huang, J.; Denham, D.; Frencher, S.; Jacobsen, S.J. Budget impact analysis of a new prostate cancer risk index for prostate cancer detection. Prostate Cancer Prostatic Dis. 2011, 14, 253–261. [Google Scholar] [CrossRef] [PubMed]
- Nichol, M.B.; Wu, J.; Huang, J.; Denham, D.; Frencher, S.K.; Jacobsen, S.J. Cost-effectiveness of prostate health index for prostate cancer detection. BJU Int. 2012, 110, 353–362. [Google Scholar] [CrossRef] [PubMed]
- Wang, W.; Wang, M.; Wang, L.; Adams, T.S.; Tian, Y.; Xu, J. Diagnostic ability of %p2PSA and prostate health index for aggressive prostate cancer: A meta-analysis. Sci. Rep. 2014, 4, 5012. [Google Scholar] [CrossRef] [PubMed]
- Stamey, T.A.; Yemoto, C.M.; McNeal, J.E.; Sigal, B.M.; Johnstone, I.M. Prostate cancer is highly predictable: A prognostic equation based on all morphological variables in radical prostatectomy specimens. J. Urol. 2000, 163, 1155–1160. [Google Scholar] [CrossRef]
- Tallon, L.; Luangphakdy, D.; Ruffion, A.; Colombel, M.; Devonec, M.; Champetier, D.; Paparel, P.; Decaussin-Petrucci, M.; Perrin, P.; Vlaeminck-Guillem, V. Comparative evaluation of urinary PCa3 and tmprss2: ERG scores and serum PHI in predicting prostate cancer aggressiveness. Int. J. Mol. Sci. 2014, 15, 13299–13316. [Google Scholar] [CrossRef] [PubMed]
- Fossati, N.; Buffi, N.M.; Haese, A.; Stephan, C.; Larcher, A.; McNicholas, T.; de la Taille, A.; Freschi, M.; Lughezzani, G.; Abrate, A.; et al. Preoperative prostate-specific antigen isoform p2PSA and its derivatives, %p2PSA and prostate health index, predict pathologic outcomes in patients undergoing radical prostatectomy for prostate cancer: Results from a multicentric European prospective study. Eur. Urol. 2015, 68, 132–138. [Google Scholar] [CrossRef] [PubMed]
- Kryvenko, O.N.; Epstein, J.I. Definition of insignificant tumor volume of Gleason score 3 + 3 = 6 (grade group 1) prostate cancer at radical prostatectomy: Is it time to increase the threshold? J. Urol. 2016, 196, 1664–1669. [Google Scholar] [CrossRef] [PubMed]
- Stephan, C.; Vincendeau, S.; Houlgatte, A.; Cammann, H.; Jung, K.; Semjonow, A. Multicenter evaluation of [-2]proprostate-specific antigen and the prostate health index for detecting prostate cancer. Clin. Chem. 2013, 59, 306–314. [Google Scholar] [CrossRef] [PubMed]


| Variable | Median (Range) | Mean ± S.D. |
|---|---|---|
| Age (years) | 71 (49–85) | 70 ± 7 |
| Prostate volume (cm3) | 36.7 (9.2–264) | 42.9 ± 27.1 |
| Tumor volume (cm3) | 1.57 (0.03–22.8) | 2.76 ± 3.47 |
| Percentage of tumor volume | 4.3 (0.02–80.4) | 7.8 ± 10.6 |
| Number (Percent) | ||
| Pathological tumor stage | ||
| ≤2c | 154 (78.6) | |
| 3a | 29 (14.8) | |
| 3b | 11 (5.6) | |
| 4 | 2 (1.0) | |
| Gleason Score | ||
| <7 | 65 (33.2) | |
| 7a (3 + 4) | 77 (39.2) | |
| 7b (4 + 3) | 36 (18.4) | |
| ≥8 | 18 (9.2) | |
| Resection margin status | ||
| R0 | 143 (73.0) | |
| R1 | 50 (25.5) | |
| Rx | 3 (1.5) |
| Variable | All Patients | Gleason Score <7 ≥7 | p-Value | pT Stage ≤2c ≥3 | p-Value | ||
|---|---|---|---|---|---|---|---|
| (n = 196) | (n = 65) | (n = 131) | (n = 154) | (n = 42) | |||
| Prostate volume (cm3) | 36.7 (9.2–264) | 36.8 (17.6–167) | 36.1 (9.2–264) | 0.568 | 35.3 (14.7–167) | 39.8 (9.2–264) | 0.295 |
| Tumor volume (cm3) | 1.58 (0.03–22.8) | 0.66 (0.03–10.9) | 2.26 (0.04–22.8) | <0.0001 | 1.21 (0.03–18.6) | 4.36 (0.87–22.8) | <0.0001 |
| Percentage of tumor (%) | 4.3 (0.02–80.4) | 1.4 (0.02–40.3) | 6.6 (0.1–80.4) | <0.0001 | 3.1 (0.02–50.0) | 10.0 (3.1–80.4) | <0.0001 |
| tPSA (ng/mL) | 5.0 (0.7–61.6) | 4.2 (0.7–17.7) | 5.4 (0.7–61.6) | <0.001 | 4.6 (0.7–61.6) | 5.6 (1.8–32.6) | 0.005 |
| %fPSA (%) | 12.3 (4.0–76.6) | 14.4 (4.9–36.9) | 11.3 (4.0–76.6) | <0.001 | 12.7 (4.0–76.6) | 11.5 (4.9–28.2) | 0.154 |
| [−2]proPSA (pg/mL) | 12.3 (2.3–117) | 10.0 (2.3–46.7) | 14.2 (3.2–117) | <0.0001 | 11.7 (2.3–117) | 17.4 (3.7–58.2) | 0.0005 |
| Prostate Health Index (PHI) | 47.6 (9.3–228) | 37.5 (10.5–102) | 55.3 (9.3–228) | <0.0001 | 43.4 (9.3–211) | 67.1 (22.3–228) | <0.0001 |
| Variable | Tumor Volume | p-Value | |
|---|---|---|---|
| ≤0.5 cm3 (n = 39) | >0.5 cm3 (n = 157) | ||
| tPSA (ng/mL) | 2.8 (0.7–10.8) | 5.4 (0.7–61.6) | <0.0001 |
| %fPSA | 15.8 (6.0–35.0) | 11.7 (4.0–76.6) | 0.0006 |
| [−2]proPSA (pg/mL) | 9.4 (2.3–32.0) | 13.6 (3.2–117) | <0.0001 |
| PHI | 32.9 (16.1–66.4) | 53.7 (9.3–228) | <0.0001 |
| Parameter | Tumor Volume (cm3) | Tumor (%) | Gleason Score (≤6, 7a, 7b, ≥8) | pT Stage (≤2c, 3a, 3b, 4) |
|---|---|---|---|---|
| tPSA | 0.363 (<0.0001) | 0.287 (<0.0001) | 0.153 (0.032) | 0.237 (0.0008) |
| %fPSA | −0.101 (0.158) | −0.145 (0.043) | −0.157 (0.028) | −0.071 (0.324) |
| [−2]proPSA | 0.659 (<0.0001) | 0.389 (<0.0001) | 0.246 (0.0005) | 0.344 (<0.0001) |
| PHI | 0.588 (<0.0001) | 0.478 (<0.0001) | 0.309 (<0.0001) | 0.317 (<0.0001) |
| Gleason Score | 0.385 (<0.0001) | 0.373 (<0.0001) | - | 0.397 (<0.0001) |
| pT Stage | 0.522 (<0.0001) | 0.486 (<0.0001) | 0.397 (<0.0001) | - |
| Parameter | Gleason Score ≥ 7 vs. <7 | pT Stage ≥3a vs. ≤2c | Tumor Volume >0.5 vs. ≤0.5 cm3 |
|---|---|---|---|
| tPSA | 0.64 (0.56–0.73) | 0.64 (0.55–0.73) | 0.74 (0.65–0.83) |
| %fPSA | 0.64 (0.56–0.72) | 0.57 (0.48–0.67) | 0.68 (0.58–0.77) |
| [−2]proPSA | 0.66 (0.59–0.74) | 0.68 (0.58–0.77) | 0.72 (0.64–0.81) |
| PHI | 0.72 (0.65–0.80) | 0.70 (0.62–80.0) | 0.79 (0.72–0.86) |
| Variable a | Univariable Analysis | Multivariable Analysis b | ||
|---|---|---|---|---|
| Hazard Ratio (95% CI c) | p-Value | Hazard Ratio (95% CI) | p-Value | |
| Age (continuous) | 1.05 (0.98–1.12) | 0.159 | not included | |
| pT stage | 4.27 (1.91–9.56) | 0.0004 | 3.92 (1.60–9.56) | 0.003 |
| Gleason Score | 1.97 (1.22–3.18) | 0.006 | 1.91 (1.01–3.57) | 0.042 |
| Margin resection status | 3.34 (1.52–7.35) | 0.003 | 1.65 (0.67–4.01) | 0.273 |
| Tumor volume | 1.12 (1.01–1.24) | 0.047 | 0.83 (0.68–0.99) | 0.048 |
| PHI | 1.02 (1.01–1.03) | <0.0001 | 1.02 (1.01–1.03) | 0.0009 |
© 2017 by the authors. Licensee MDPI, Basel, Switzerland. This article is an open access article distributed under the terms and conditions of the Creative Commons Attribution (CC BY) license ( http://creativecommons.org/licenses/by/4.0/).
Share and Cite
Friedersdorff, F.; Groß, B.; Maxeiner, A.; Jung, K.; Miller, K.; Stephan, C.; Busch, J.; Kilic, E. Does the Prostate Health Index Depend on Tumor Volume?—A Study on 196 Patients after Radical Prostatectomy. Int. J. Mol. Sci. 2017, 18, 488. https://doi.org/10.3390/ijms18030488
Friedersdorff F, Groß B, Maxeiner A, Jung K, Miller K, Stephan C, Busch J, Kilic E. Does the Prostate Health Index Depend on Tumor Volume?—A Study on 196 Patients after Radical Prostatectomy. International Journal of Molecular Sciences. 2017; 18(3):488. https://doi.org/10.3390/ijms18030488
Chicago/Turabian StyleFriedersdorff, Frank, Britt Groß, Andreas Maxeiner, Klaus Jung, Kurt Miller, Carsten Stephan, Jonas Busch, and Ergin Kilic. 2017. "Does the Prostate Health Index Depend on Tumor Volume?—A Study on 196 Patients after Radical Prostatectomy" International Journal of Molecular Sciences 18, no. 3: 488. https://doi.org/10.3390/ijms18030488
APA StyleFriedersdorff, F., Groß, B., Maxeiner, A., Jung, K., Miller, K., Stephan, C., Busch, J., & Kilic, E. (2017). Does the Prostate Health Index Depend on Tumor Volume?—A Study on 196 Patients after Radical Prostatectomy. International Journal of Molecular Sciences, 18(3), 488. https://doi.org/10.3390/ijms18030488