Article

Structure and Functional Analysis of Promoters from Two Liver Isoforms of CPT I in Grass Carp Ctenopharyngodon idella

1
Key Laboratory of Freshwater Animal Breeding, Ministry of Agriculture, Fishery College, Huazhong Agricultural University, Wuhan 430070, China
2
Collaborative Innovation Center for Efficient and Health Production of Fisheries, Hunan University of Arts and Science, Changde 415000, China
*
Author to whom correspondence should be addressed.
Int. J. Mol. Sci. 2017, 18(11), 2405; https://doi.org/10.3390/ijms18112405
Submission received: 7 October 2017 / Revised: 1 November 2017 / Accepted: 10 November 2017 / Published: 13 November 2017
(This article belongs to the Section Biochemistry)

Abstract

:
Carnitine palmitoyltransferase I (CPT I) is a key enzyme involved in the regulation of lipid metabolism and fatty acid β-oxidation. To understand the transcriptional mechanism of CPT Iα1b and CPT Iα2a genes, we cloned the 2695-bp and 2631-bp regions of CPT Iα1b and CPT Iα2a promoters of grass carp (Ctenopharyngodon idella), respectively, and explored the structure and functional characteristics of these promoters. CPT Iα1b had two transcription start sites (TSSs), while CPT Iα2a had only one TSS. DNase I foot printing showed that the CPT Iα1b promoter was AT-rich and TATA-less, and mediated basal transcription through an initiator (INR)-independent mechanism. Bioinformatics analysis indicated that specificity protein 1 (Sp1) and nuclear factor Y (NF-Y) played potential important roles in driving basal expression of CPT Iα2a gene. In HepG2 and HEK293 cells, progressive deletion analysis indicated that several regions contained cis-elements controlling the transcription of the CPT Iα1b and CPT Iα2a genes. Moreover, some transcription factors, such as thyroid hormone receptor (TR), hepatocyte nuclear factor 4 (HNF4) and peroxisome proliferator-activated receptor (PPAR) family, were all identified on the CPT Iα1b and CPT Iα2a promoters. The TRα binding sites were only identified on CPT Iα1b promoter, while TRβ binding sites were only identified on CPT Iα2a promoter, suggesting that the transcription of CPT Iα1b and CPT Iα2a was regulated by a different mechanism. Site-mutation and electrophoretic mobility-shift assay (EMSA) revealed that fenofibrate-induced PPARα activation did not bind with predicted PPARα binding sites of CPT I promoters. Additionally, PPARα was not the only member of PPAR family regulating CPT I expression, and PPARγ also regulated the CPT I expression. All of these results provided new insights into the mechanisms for transcriptional regulation of CPT I genes in fish.

Graphical Abstract

1. Introduction

Lipids are the major sources of metabolic energy in fish [1]. Body lipid composition results from the balance among deposition of dietary lipids, de novo synthesis of fatty acids and oxidation of fatty acids. While the relations between food intake and lipid deposition as well as nutritional control of fatty acid synthesis are well documented [1], fatty acid catabolism has received little attention. The β-oxidation of fatty acids plays a critical role in the production of energy, and most oxidation occurs in the mitochondria [2]. Carnitine palmitoyltransferase I (EC.2.3.1.21; CPT I), located in outer membranes of mitochondria, controls the flux through β-oxidation and is the main regulatory enzyme of fatty acid oxidation [3,4]. The studies about the structure and transcriptional regulation of CPT I gene are useful for the understanding of the β-oxidation in fish. In mammals, three CPT I isoforms encoded by distinct genes have been discovered: a liver isoform (CPT Iα) [5], a muscle isoform (CPT Iβ) [6], and a brain isoform (CPT Ic) [7]. In fish, however, due to fish-specific genomic duplication event, various CPT I isoforms have been cloned. For example, three α-copies and one β-copy of CPT I was obtained in yellow catfish Pelteobagrus fulvidraco [8] and seven complete CPT I cDNA sequences (CPT Iα1a-1a, CPT Iα1a-1b, CPT Iα1a-1c, CPT Iα1a-2, CPT I α2a, CPT Iα2b1a, CPT Iβ) and a partial cDNA sequence (CPT Iα2b1b) were cloned in goby Synechogobius hasta [9]. In grass carp, the complete cDNA sequences of three CPT Iα genes (CPT Iα1a, CPT Iα1b and CPT Iα2a) and one CPT Iβ gene isoforms have successfully been cloned [10,11]. Although these isoforms of CPT I gene can express CPT I protein which catalyzes the same reaction, they have different properties [8]. For example, McGarry and Brown [12] pointed out that mammalian CPT Iβ had a much lower IC50 and higher Km for carnitine than CPT Iα (from [8]). Lineage- and species-specific genome duplication events can lead to increased diversity in protein regulation and function. At present, while the characteristics of CPT I gene and structure prediction as well as its enzyme kinetics are well documented in fish [8,9,11,13,14], mechanisms involving the transcriptional regulations of CPT I gene received no attention.
Considering the importance of CPT I in regulating fatty acid oxidation, it is very important and meaningful to explore the regulatory mechanism of CPT I mRNA expression. At present, most studies on the mRNA expression and/or activity of CPT I isoforms in fish involve the response to either dietary or hormonal treatments [15,16,17,18,19]. However, expression of eukaryotic genes is controlled at the level of transcription initiation. Promoters, which contain cis-acting sequences bound by a wide variety of regulatory factors, control the expression of individual genes. Therefore, it is very important to analyze the structure and function of CPT I promoter, which helps to understand the regulatory mechanism of CPT I itself. At present, the promoter of the CPT Iα gene has been obtained only in mammals [20,21], but not in fish. The present study hypothesizes that significant differences exist in structure and function of CPT I promoters between fish and mammals.
Lipid metabolism is closely controlled by diverse regulatory systems involving many transcription factors. Peroxisome proliferator-activated receptors (PPARs), which belong to ligand-dependent transcription factors, regulate the expression of various genes involved in lipid metabolism [22,23]. Among the PPAR family member, PPARα plays crucial roles in the catabolism of fatty acids by increasing the expression of key lipolytic enzymes (also CPT I) [24,25]. Studies demonstrated that the PPARα mRNA expression was positively correlated to CPT I mRNA expression [14,26]. Further investigation indicated that PPARα stimulated through a peroxisome proliferator-responsive element (PPRE) in the first and second intron of the human and rat CPT Iα genes, respectively [27,28]. PPARγ, involved in the regulation of lipogenesis and lipid storage, preferentially control the transcription of genes in triglyceride synthesis [29]. In an earlier study, Chen et al. [30] found that mRNA expression of PPARγ was positively correlated with CPT I expression, suggesting a potential regulation of PPARγ on CPT I expression. At present, although several evidences suggested that CPT Iα was a target gene for PPAR [27,28,29], a lack of knowledge regarding the DNA sequence responsible for this predicted regulatory mechanism has left this a controversial issue. Thus, considering the importance of PPARs in lipid metabolism, it is very important to explore the regulation of CPT I expression by PPARs.
Grass carp (Ctenopharyngodon idella) was an important herbivorous freshwater fish widely farmed all over the world because of its good taste and high market price. Its aquaculture yield amounted to 6 million metric tons in China in 2016. In some countries of European and Northern America, grass carp were used to control aquatic plants because of their aggressive feeding on vegetation [31]. At present, grass carp is considered a good model for the study of lipid metabolism because it stores excess fat in liver and adipose tissues under intensive aquaculture. Recently, the draft genome of the grass carp has been released, which is considered a convenient tool for identifying genomic structure of genes involved in lipid metabolism [32]. In the present study, we characterized CPT Iα1b and CPT Iα2a promoters in grass carp. Their transcriptional regulation by peroxisome proliferators was also explored. These studies will provide new insights into the transcriptional regulatory mechanism of CPT I genes in fish.

2. Results

Studies indicated that, compared with other isoforms, mRNA levels of CPT Iα1b and CPT 1α2a were predominant in the liver [10,11]. Therefore, CPT Iα1b and CPT 1α2a were considered as liver isoforms. To investigate their transcriptional regulatory mechanism, for the first time, we cloned the sequences of promoters of the two liver isoforms (CPT Iα1b and CPT Iα2a), and explored their functional characteristics in fish.

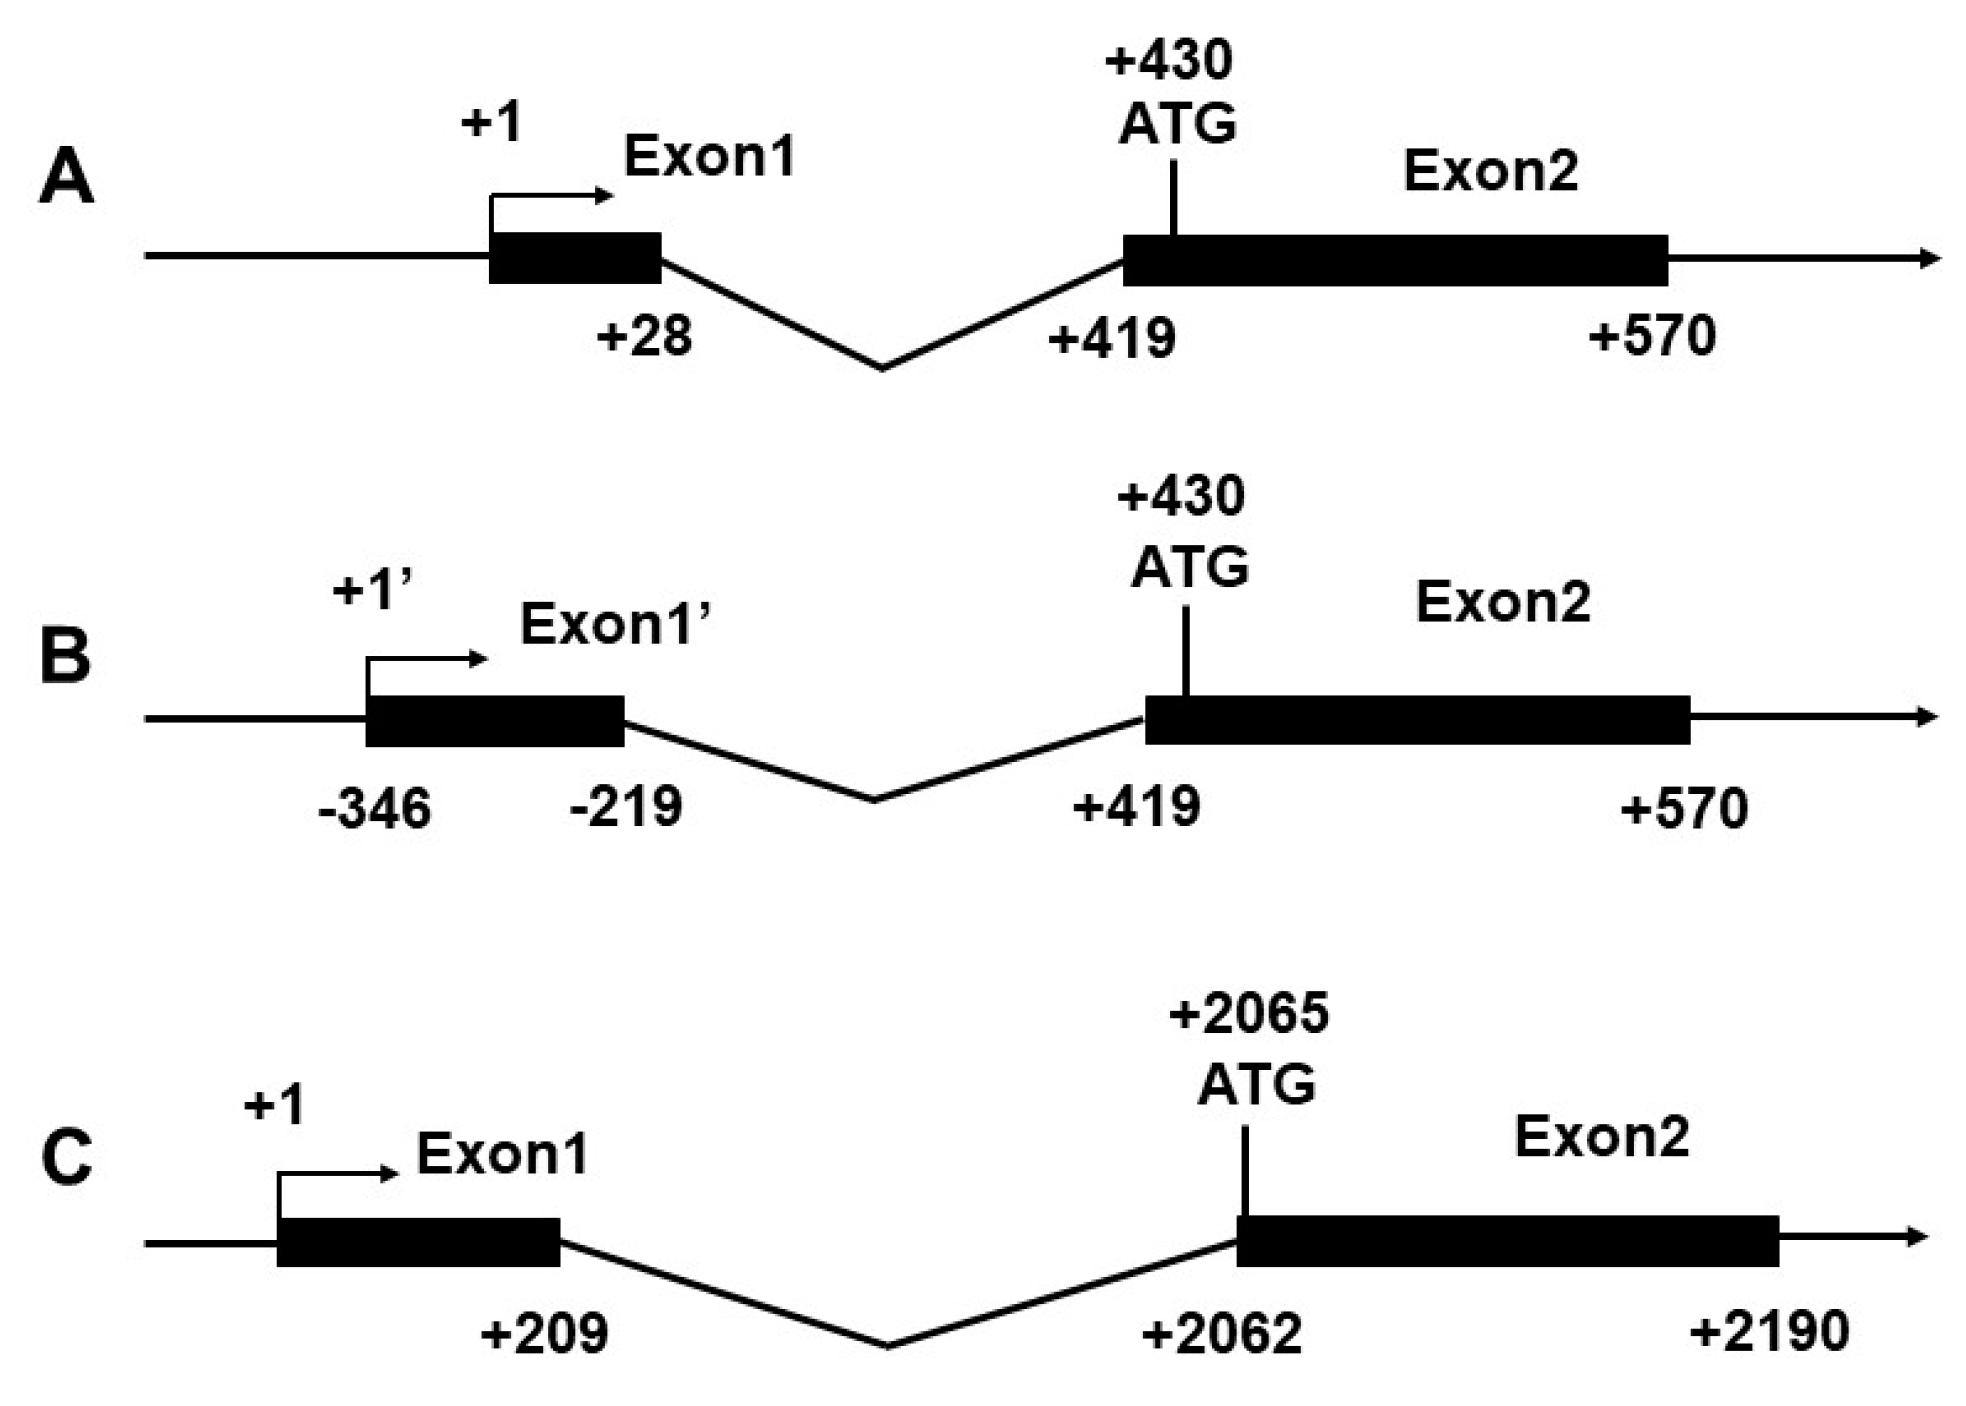
2.1. Identification of Transcription Start Site (TSS)

In the present study, the 2695 bp of CPT Iα1b promoter and 2631 bp of CPT Iα2a promoter were cloned and submitted to an online transcription factor database (MatInspector) for sequence analysis. RNA ligase-mediated rapid amplification of 5′ cDNA ends (RLM-5′RACE) was performed to identify the TSS of CPT Iα1b and CPT Iα2a promoters. This amplification generated two different TSSs of CPT Iα1b which approximately corresponded to the alternative 5′ splice variants of CPT Iα1b mRNA, and one TSS of CPT Iα2a without alternative 5′ variant. The first nucleotide of the CPT Iα1b gene, mapped to the most upstream position from the grass carp liver cDNA library, was arbitrarily designated as +1′ and the alternative 5′ splicing site was designated as +1 (Figure 1A,B). The first nucleotide of the CPT Iα2a gene was designated as +1 (Figure 1C).

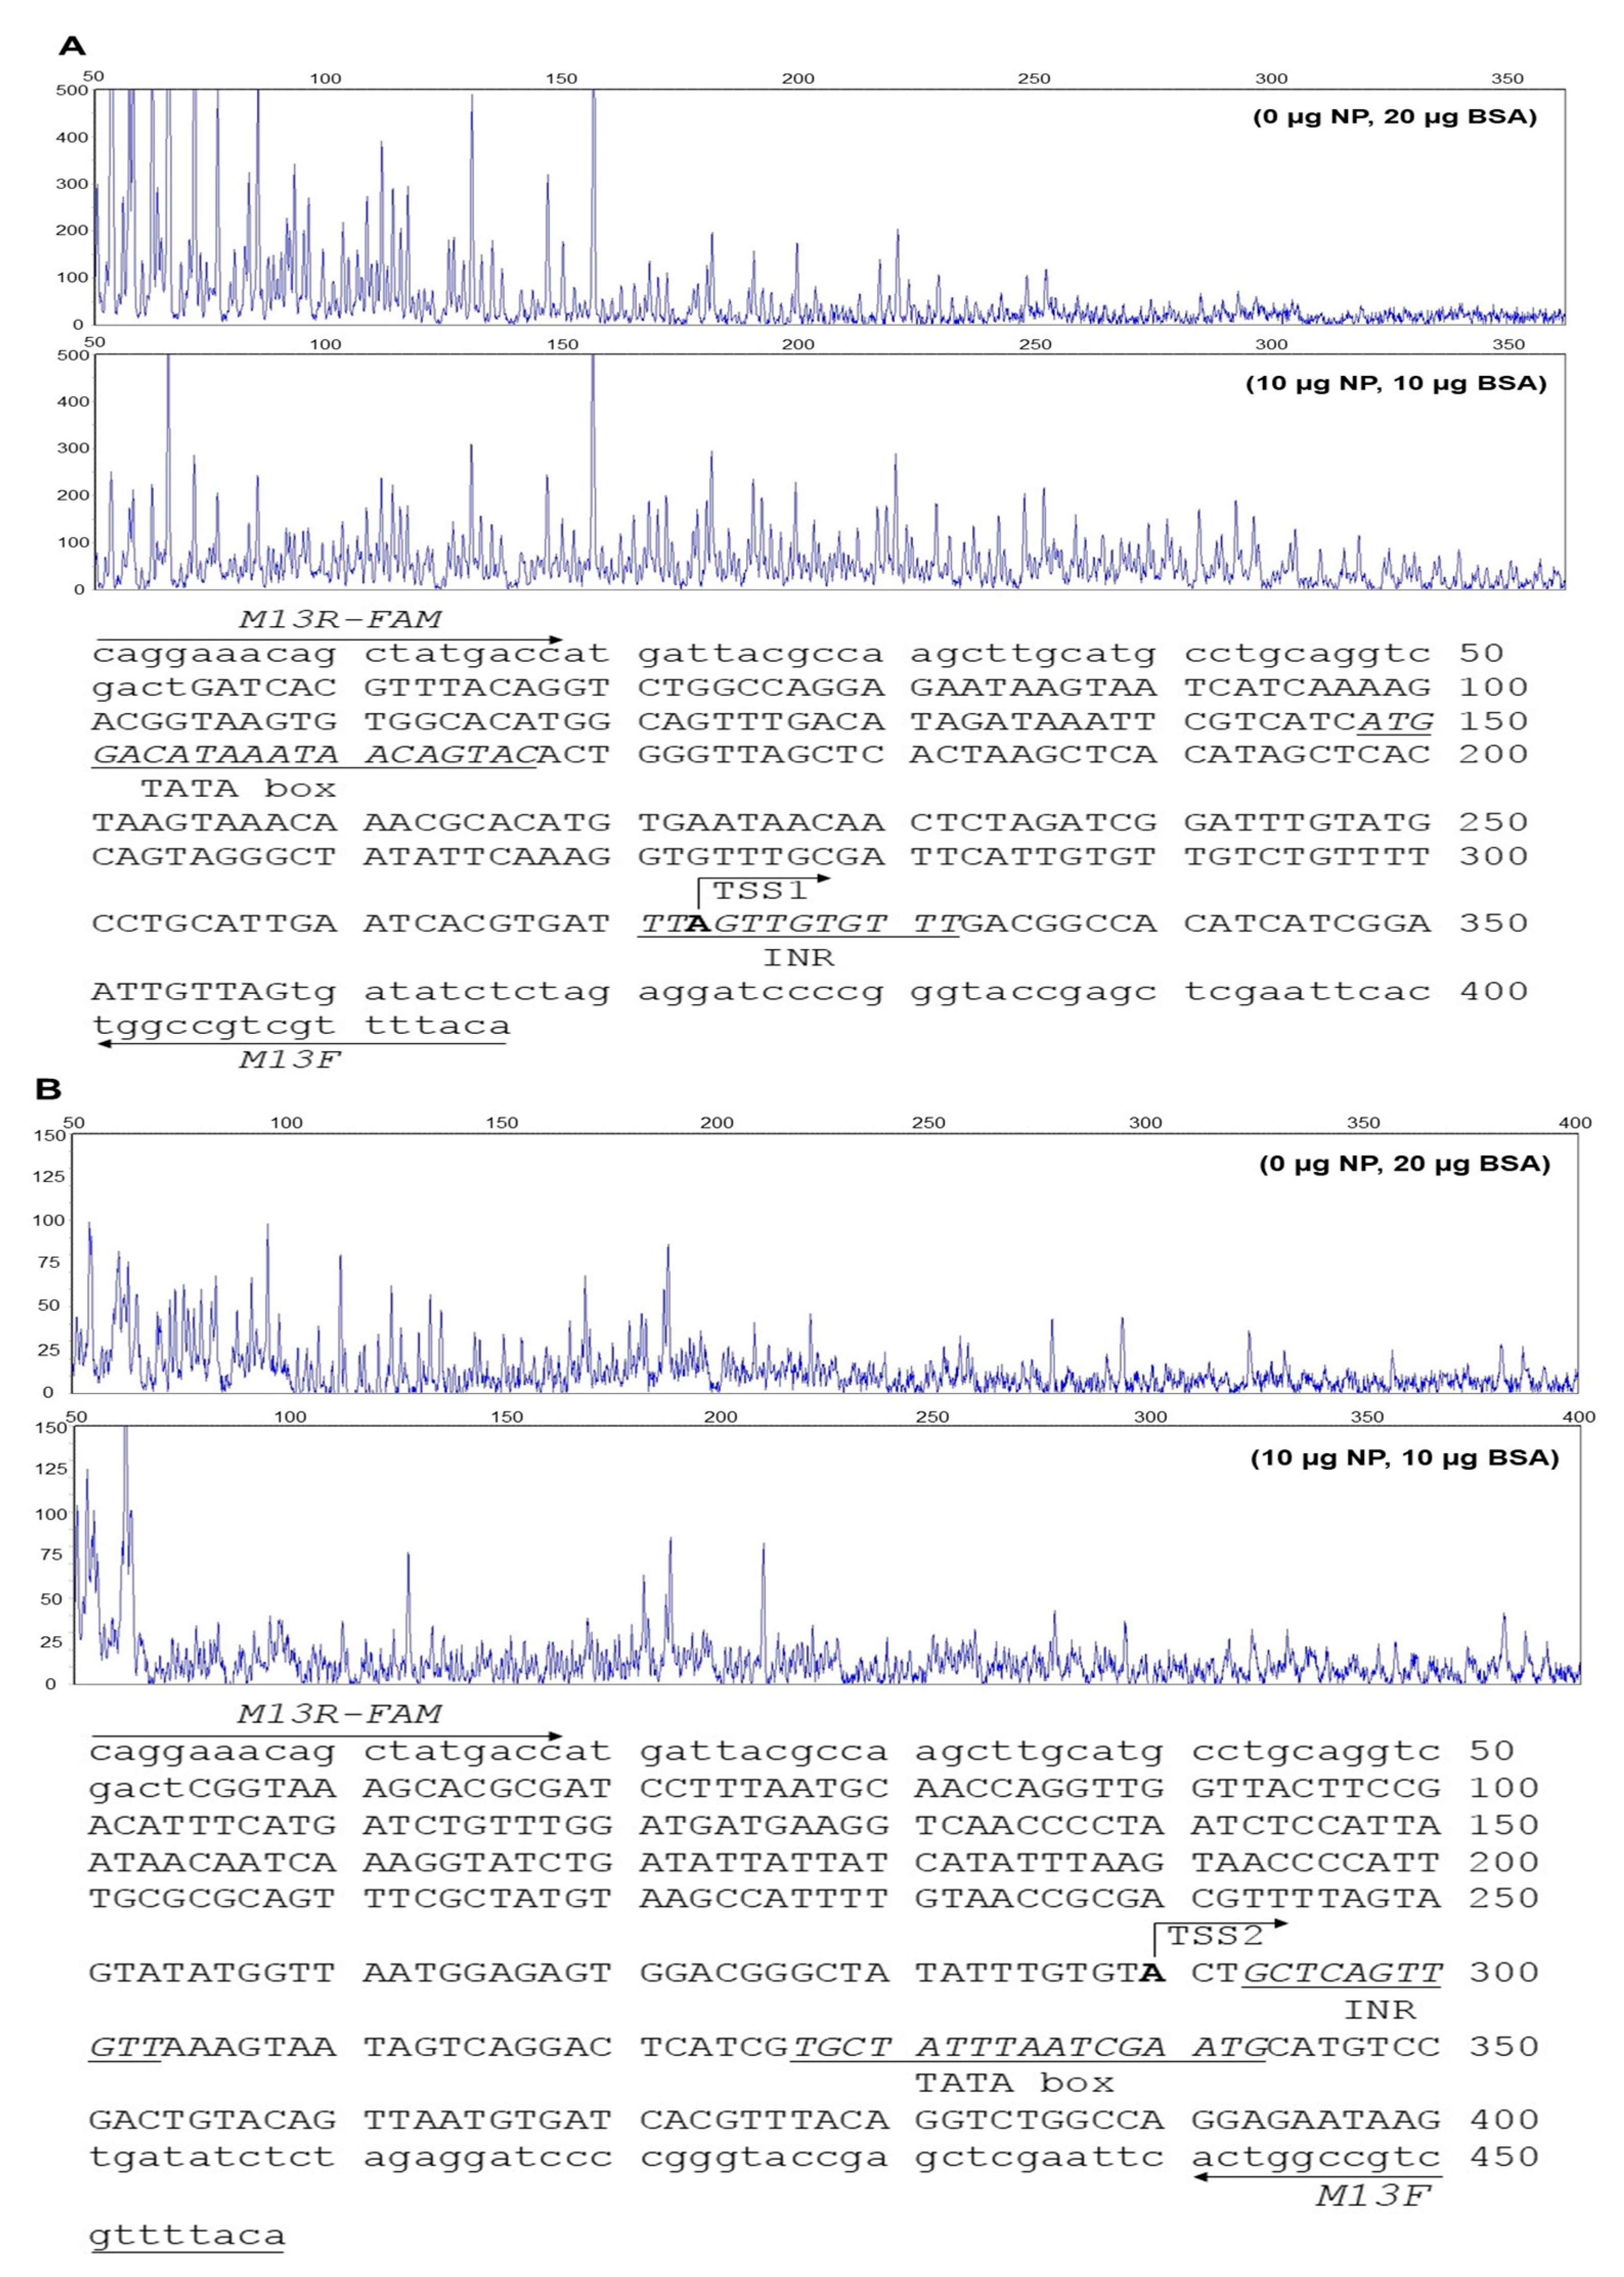
2.2. DNase I Foot Printing Assay of Core Promoter of CPT Iα1b

Figure 2A showed the core region of CPT Iα1b promoter from −268 bp to +37 bp containing transcription start site (TSS1). Predicted TATA-box was located between 148 bp and 167 bp of the FAM-labeled fragment, and the electropherograms around this region presented similar peak patterns between control group (0 µg nuclear proteins, 20 µg bovine serum albumin, BSA) and DNase I digested group (10 µg nuclear proteins, 10 µg BSA). In contrast, the region between 290 bp and 360 bp presented different peak patterns between control group and DNase I digested group, where the initiator (INR) was located. Figure 2B showed the core region of CPT Iα1b promoter from −581 bp to −236 bp containing alternative transcription start site (TSS2). Predicted TATA-box on this fragment was located between 327 bp and 343 bp of the FAM-labeled fragment, and the electropherograms on this region were similar between control group (0 µg nuclear proteins, 20 µg BSA) and DNase I digested group (10 µg nuclear proteins, 10 µg BSA). In contrast, the different peak patterns were discovered at the region between 285 bp and 310 bp, where the INR was located. Taken together, these indicated that the INR on the promoter was sufficient for the transcription initiation of CPT Iα1b gene.

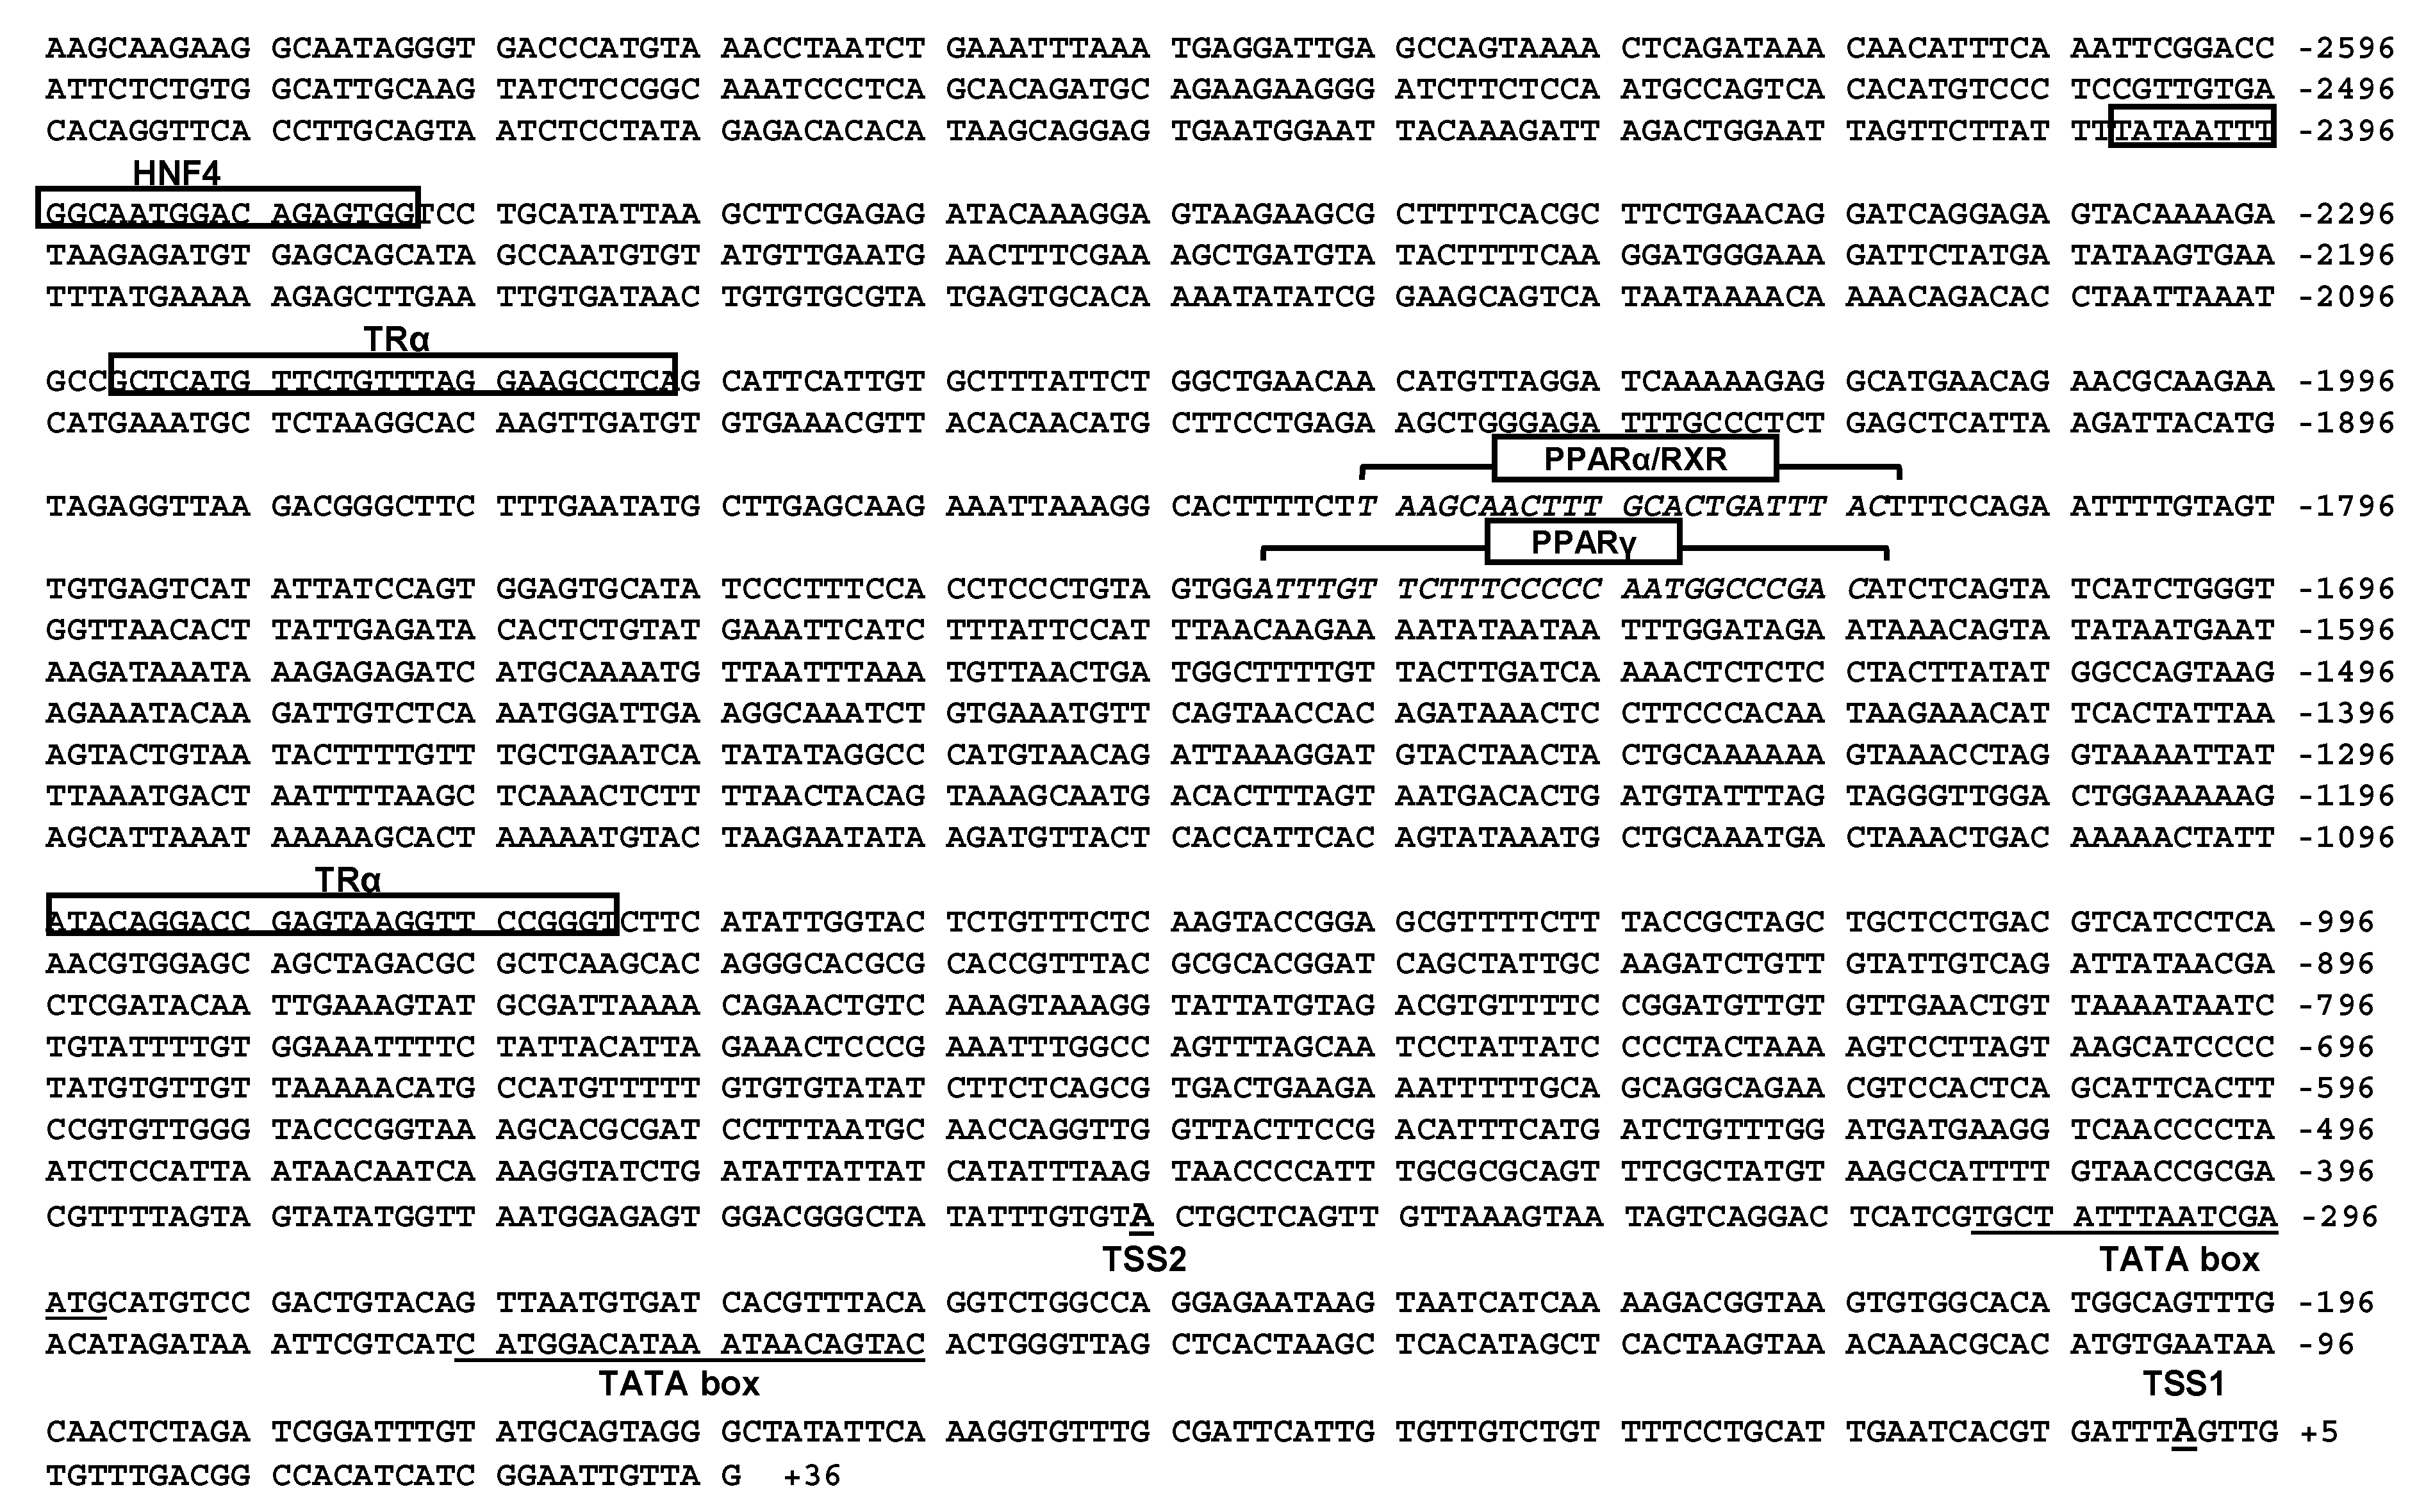
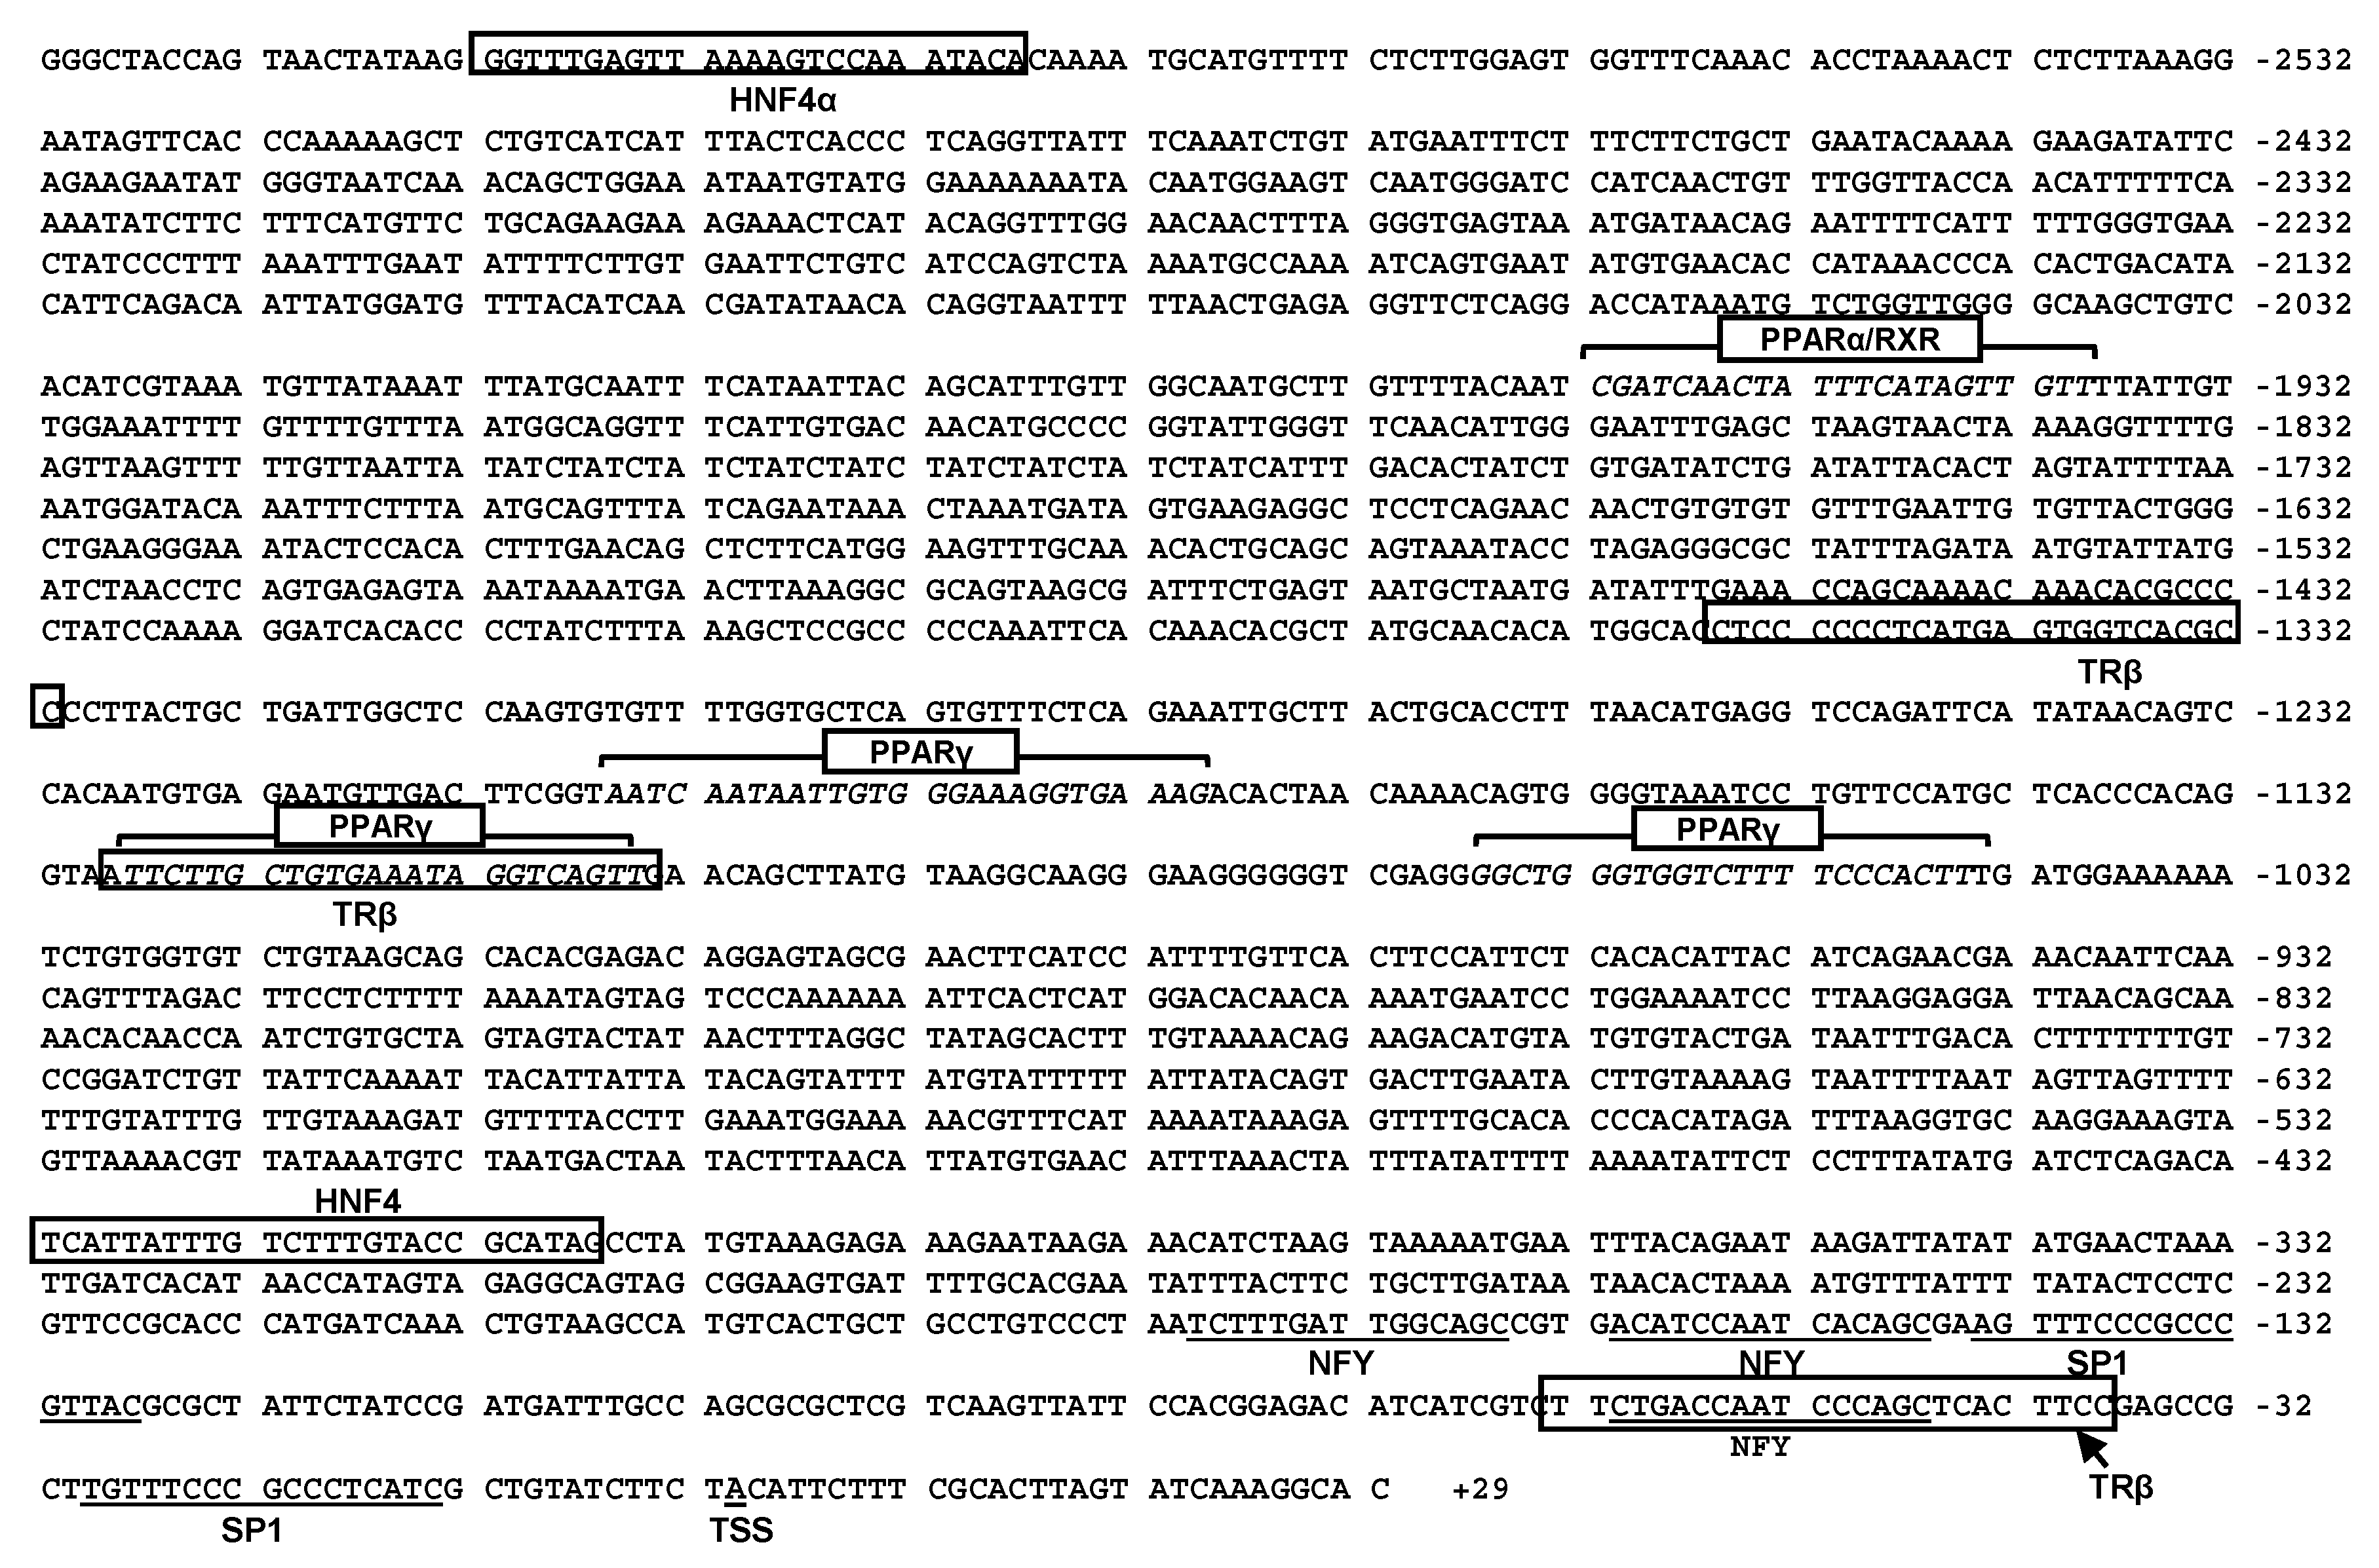
2.3. Sequence Analysis of the CPT Iα1b and CPT Iα2a Promoters

Several putative core promoter elements close to the TSS on the CPT Iα1b promoter, including two TATA-box (TBP) located from −160 bp to −176 bp and from −293 bp to −309 bp, and two initiator (INR) located at −2 bp to +10 bp (TSS1) and −333 bp to −343 bp (TSS2), were identified (Figure 3). Meanwhile, on the core region of CPT Iα2a promoter, three CCAAT-box (NF-Y) were identified, located at −46 bp to −60 bp, −146 bp to −160 bp and −165 bp to −179 bp, respectively. Besides, two GGGCGG-box (Sp1), located at −13 bp to −29 bp and −127 bp to −143 bp, were also identified on the core promoter of CPT Iα2a (Figure 4). Some relevant TFBSs of CPT Iα1b and CPT Iα2a were presented in Figure 3 and Figure 4. There were two thyroid hormone receptor α (TRα) binding sites on the CPT Iα1b promoter at the position −1070 bp to −1094 bp and −2067 bp to −2091 bp, and three thyroid hormone receptor β (TRβ) binding sites on the CPT Iα2a promoter, at the position −39 bp to −63 bp, −1103 bp to −1127 bp and −1331 bp to −1355 bp, respectively. In addition, we discovered one HNF4 binding site on the CPT Iα1b promoter, located at −2379 bp to −2403 bp, one HNF4 binding site on the CPT Iα2a promoter, located at the position −406 bp to −430 bp, and one HNF4α binding site on the CPT Iα2a promoter, located at the position −2587 bp to −2611 bp. Moreover, analysis using MatInspector database revealed two PPAR binding sites on the CPT Iα1b promoter and four PPAR binding sites on the CPT Iα2a promoter. Among these sites, one PPARα/RXR binding site located at the position −1814 bp to −1836 bp and one PPARγ binding site located at the position −1719 bp to −1741 bp were predicted on the CPT Iα1b promoter. Meanwhile, there were four important binding sites of transcriptional factors on the CPT Iα2a promoter, distributed at the position −1939 bp to −1961 bp (PPARα/RXR binding site), −1179 bp to −1201 bp (PPARγ binding site), −1104 bp to −1136 bp (PPARγ binding site) and −1044 bp to −1066 bp (PPARγ binding site).

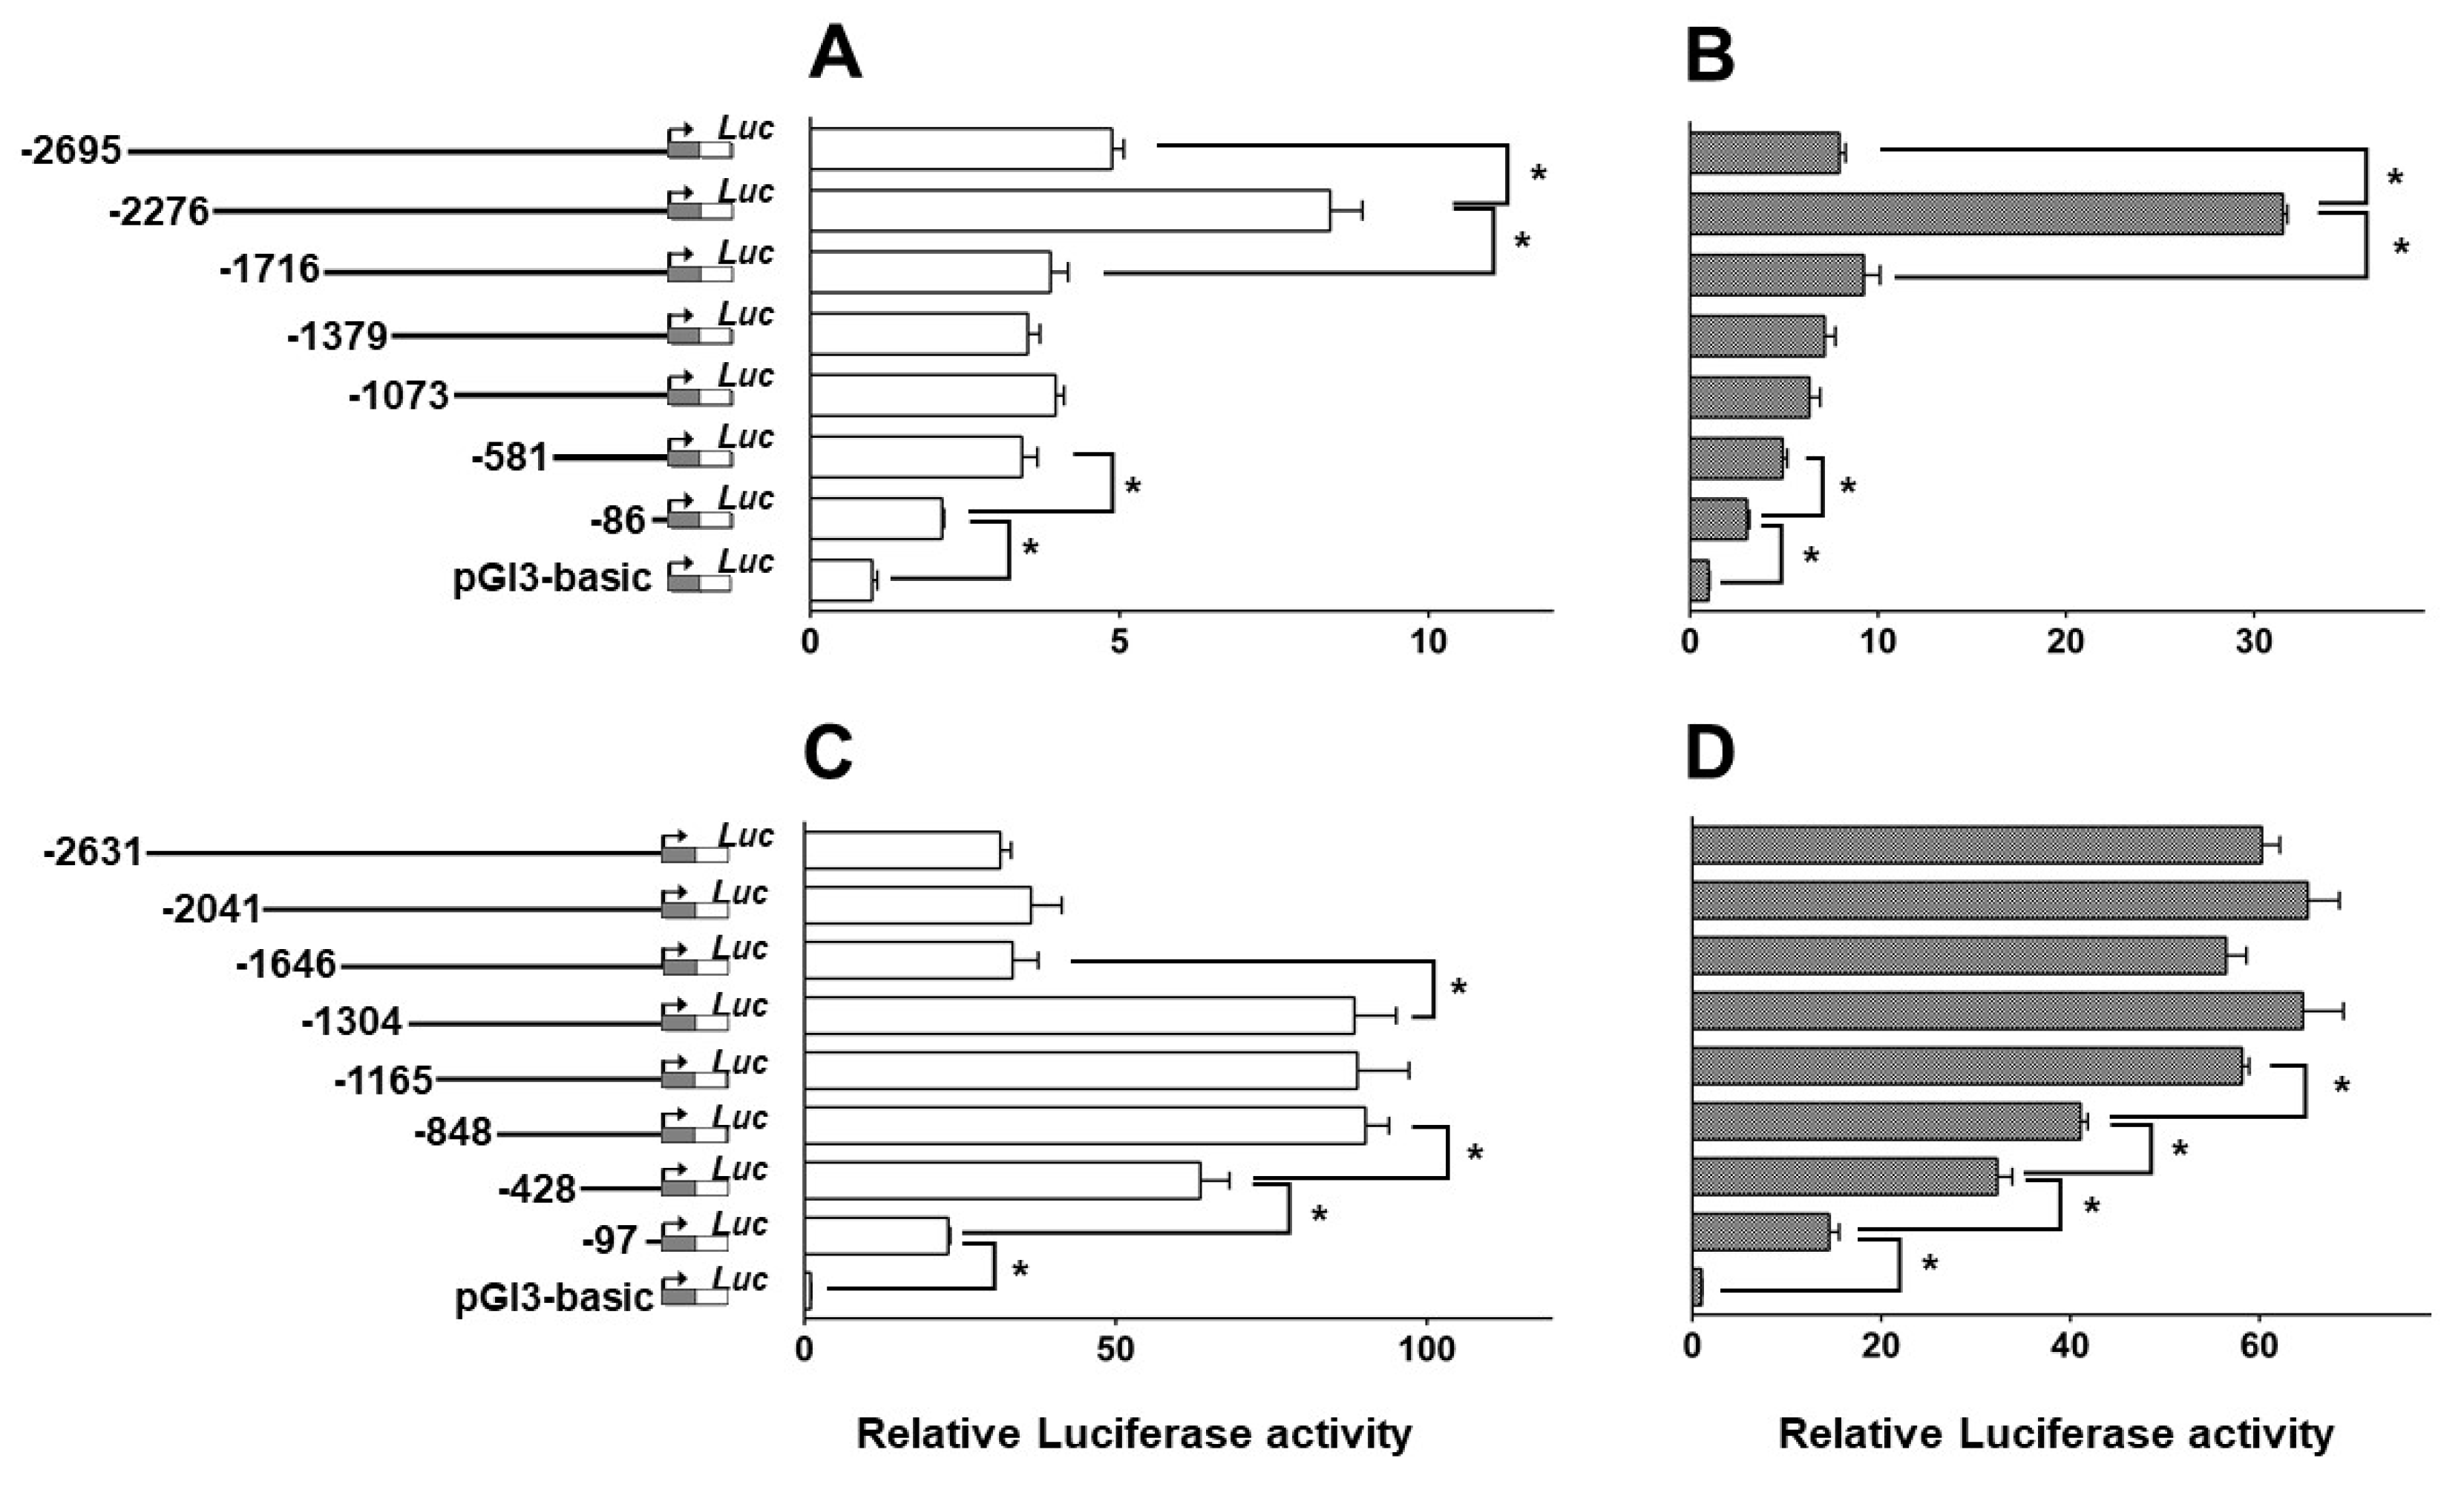
2.4. Deletion Assay of the CPT Iα1b and CPT Iα2a Promoter

Deletion analysis of CPT Iα1b and CPT Iα2a promoters was presented in Figure 5. The reporter activity for each serial deletion was compared with the activity of pGl3-basic vector, and the pGl3-basic was chosen as the baseline. Figure 5A showed the result of deletion assay of the CPT Iα1b promoter sequence from −2695 bp to −86 bp in HepG2 cells. Deletion of the region from −2276 bp to −2695 bp significantly increased the relative luciferase activity of the promoter. Subsequent deletion to −1716 bp significantly decreased the relative luciferase activity. Deletion of the sequence from −581 bp to −1716 bp showed no significant effect, whereas deletion of the sequence from −581 bp to −86 bp significantly decreased the relative luciferase activity. Figure 5B showed the result of deletion assay of the CPT Iα1b promoter in HEK293 cells. Deletion of the sequence from −2695 bp to −2276 bp significantly increased the relative luciferase activity, and the sequence deletion from −2276 bp to −1716 bp significantly reduced the activity. Subsequent deletion to −581 bp presented no significant effects on the relative luciferase activity. The sequence deletion from −581 bp to −86 bp significantly decreased the relative luciferase activity.
Figure 5C presented the result of deletion assay of the CPT Iα2a promoter sequence from −2631 bp to −97 bp in HepG2 cells. The relative luciferase activity of CPT Iα2a promoter showed no significant difference from −2631 bp to −1646 bp. Deletion of the sequence from −1646 bp to −1304 bp significantly increased the relative luciferase activity. Subsequent deletion to −848 bp presented no significant effects on the relative luciferase activity. Deletion of the sequence of −848 bp to −428 bp and −428 bp to −97 bp significantly decreased the relative luciferase activity. Figure 5D showed the result of deletion assay of CPT Iα2a promoter in HEK293 cells. Deletion of the sequence from −2631 bp to −1165 bp presented no significant effects on the relative luciferase activity. All of these sequence deletions from −1165 bp to −848 bp, −848 bp to −428 bp and −428 bp to −97 bp significantly decreased the luciferase activity.

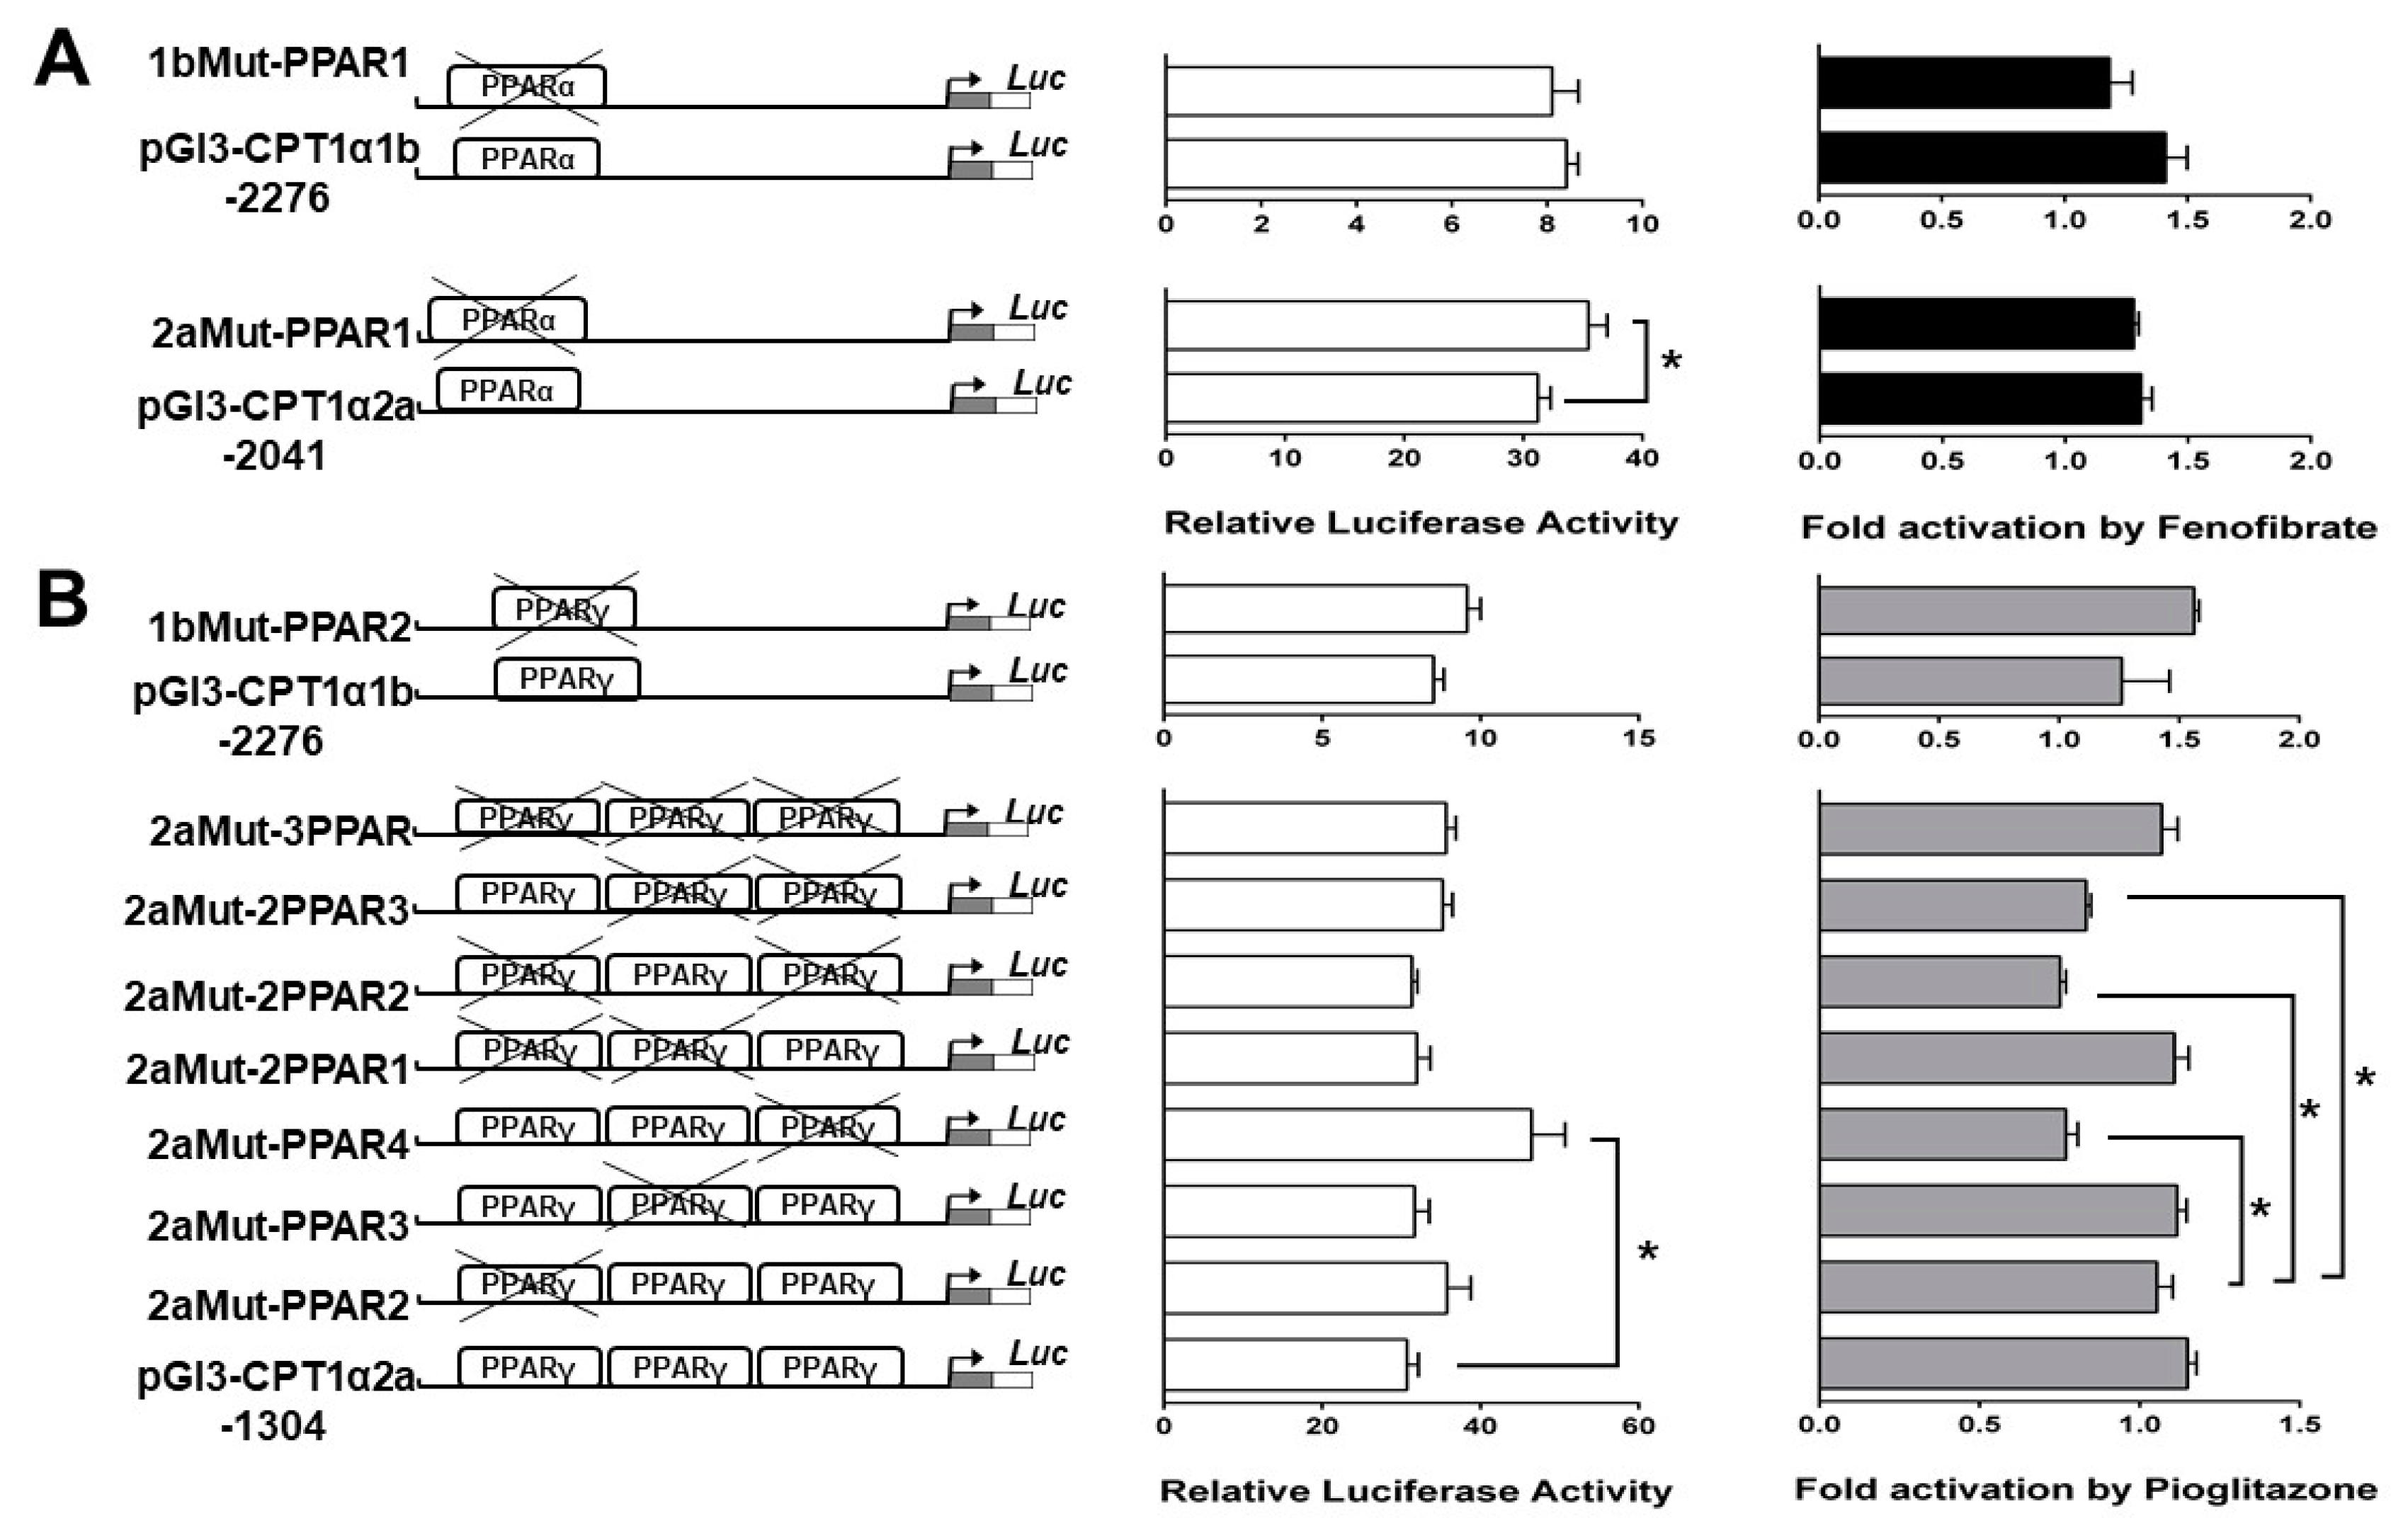
2.5. Site-Mutation Analysis of PPAR Binding Sites

Site-mutation analysis was used to evaluate the contribution of each PPAR binding site to the basal expression of the grass carp CPT Iα1b and CPT Iα2a genes in HepG2 cells (Figure 6). The disruption of the −1814/−1836 PPARα binding site did not change the relative luciferase activity against the wild-type pGl3-CPTIα1b-2276, and disruption of the −1814/−1836 PPARα binding site did not influence the fenofibrate-induced change of luciferase activity, indicating that −1814/−1836 PPARα binding site did not contribute to the transcriptional response of CPTIα1b gene to fenofibrate (Figure 6A). The disruption of the −1939/−1961 PPARα binding site significantly up-regulated the relative luciferase activity against the wild-type pGl3-CPTIα2a-2041. In contrast, disruption of the −1939/−1961 PPARα binding site did not influence the fenofibrate-induced change of luciferase activity induced, suggesting that the −1939/−1961 sequence did not contribute to the transcriptional response of CPTIα2a gene to fenofibrate. We also disrupted each PPARγ binding site by site-directed mutagenesis in the context of the pGl3-CPTIα1b-2276 and pGl3-CPTIα2a-1304 vectors, respectively; meantime, three double mutants and one triple mutant of PPARγ binding site were produced on the pGl3-CPTIα2a-1304 vector (Figure 6B). The disruption of the −1719/−1741 PPARγ binding site did not change the relative luciferase activity against the wild-type pGl3-CPTIα1b-2276, and disruption of the −1719/−1741 PPARγ binding site did not influence the pioglitazone-induced change of luciferase activity, suggesting that −1719/−1741 PPARγ binding site did not contribute to the transcriptional response of CPTIα1b gene to pioglitazone. Disruptions of the PPARγ binding sites on pGl3-CPTIα2a-1304 vectors showed that the −1044/−1066 PPARγ binding site up-regulated relative luciferase activity against the pGl3-CPTIα2a-1304. Other mutant vectors, including double and triple mutant of PPARγ binding sites, presented no significant difference in luciferase activities against the wild-type pGl3-CPTIα2a-1304, indicating that the −1044/−1066 PPARγ binding site possibly played a negative regulatory role in CPTIα2a transcription. In addition, disruption of the −1719/−1741 PPARγ binding site reduced the luciferase activity induced by pioglitazone, and disruption of −1719/−1741 PPARγ binding site along with either −1179/−1201 PPARγ binding site or −1104/−1136 PPARγ binding site also reduced the luciferase activity induced by pioglitazone, suggesting that −1719/−1741 PPARγ binding site contributed to the transcriptional response of CPTIα2a to pioglitazone. Taken together, these results indicated that PPARα could not regulate the transcription of CPT Iα1b and CPT Iα2a at their predicted binding sites, and the transcription of the grass carp CPT Iα2a gene expression could be controlled by PPARγ.

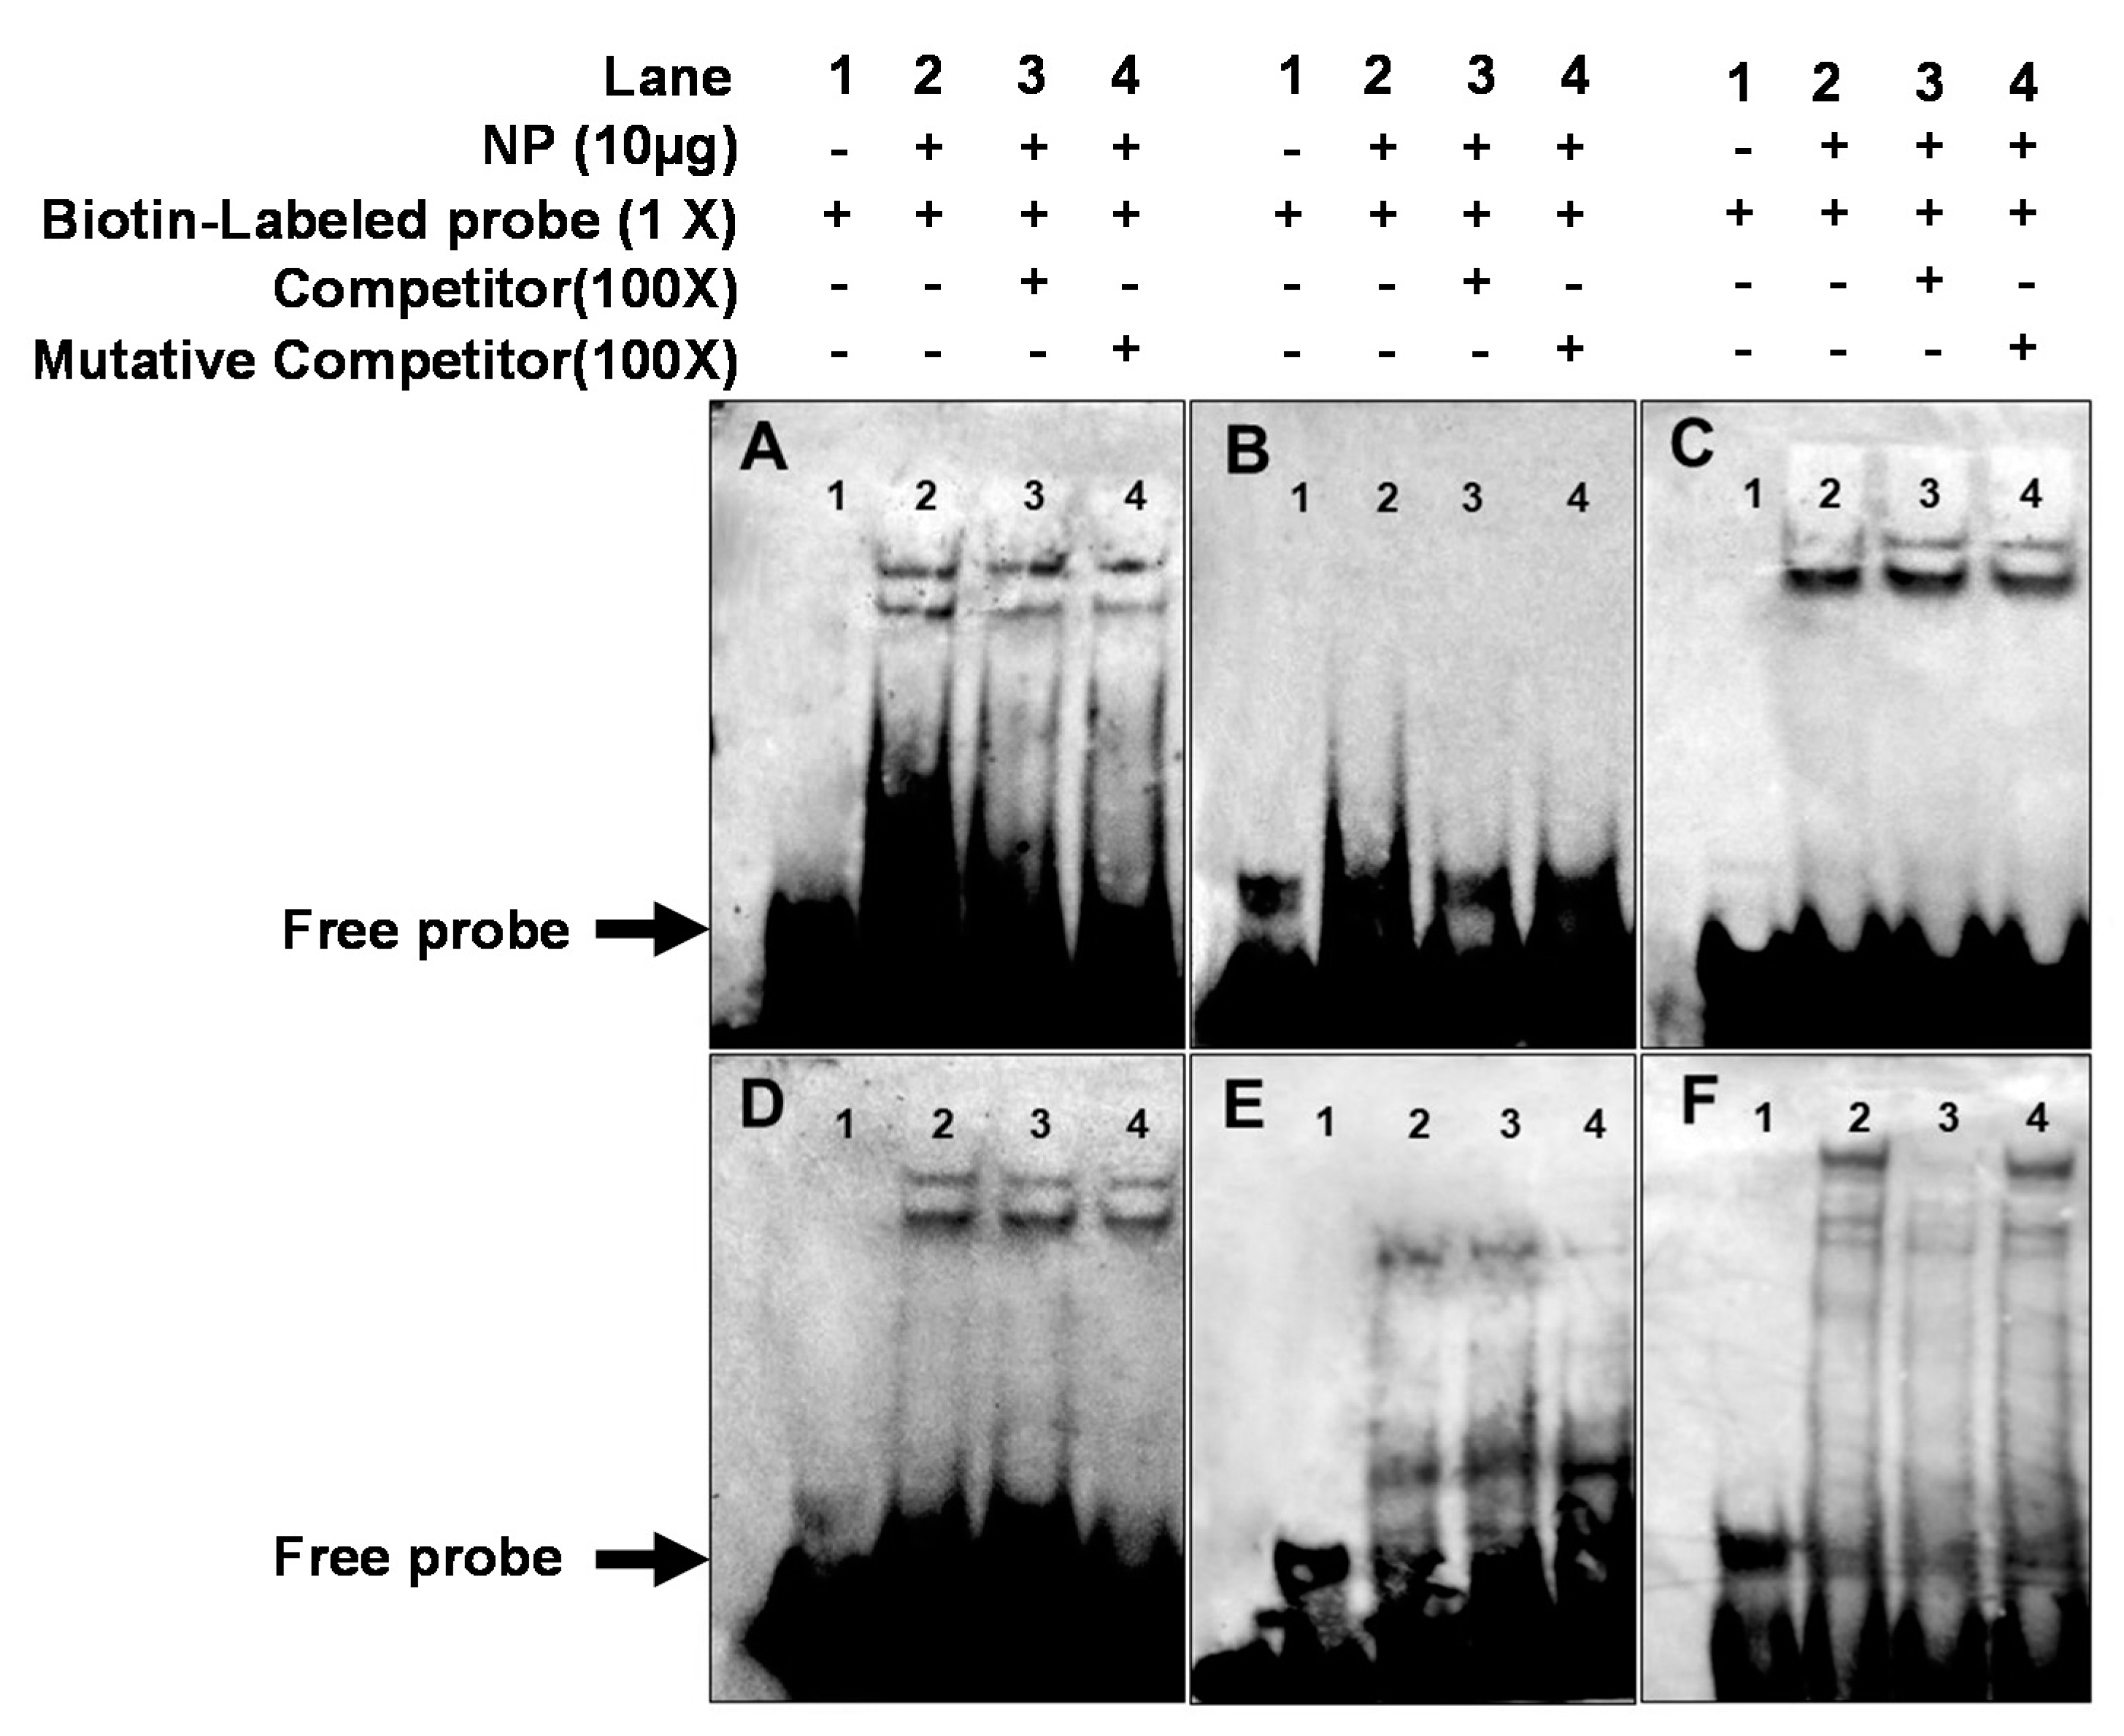
2.6. EMSA of Each PPAR Binding Sequence

Having demonstrated that the putative PPAR binding site was important for the transcriptional activities of CPT Iα1b and CPT Iα2a genes, we next examined whether PPARs could bind to this site directly. We used EMSA assay to confirm this mechanism (Figure 7). Two close weak bands were observed at the −1814/−1836 PPARα binding sequence of CPT Iα1b promoter, and neither a 100-fold excess unlabeled probe nor a 100-fold excess unlabeled point-mutated probe could compete out the labeled probe, indicating that this sequence was not bound by PPARα (Figure 7A). Only the free probe band was discovered at the −1719/−1741 PPARγ binding sequence of CPT Iα1b promoter (Figure 7B), suggesting that this sequence was not bound by any transcriptional factors. A strong band close to a weak band was observed at the −1939/−1961 PPARα binding sequence of CPT Iα2a promoter, and neither a 100-fold excess unlabeled probe nor a 100-fold excess unlabeled point-mutated probe could compete out the labeled probe, indicating that this sequence was not bound by PPARα (Figure 7C). Similarly, Figure 7D and E also indicated that the −1179/−1201 and −1104/−1136 PPARγ binding sequences of CPT Iα2a promoter were not bound by PPARγ. Only the sequence corresponding to the −1104/−1066 PPARγ binding site of the CPT Iα2a promoter could bind with proteins from HepG2 nuclear extract (NP) and be disrupted by a 100-fold excess of unlabeled wild-type, and restored by a point-mutant probe (Figure 7F), confirming that −1044/−1066 PPARγ binding site of the CPT Iα2a promoter could react with PPARγ.

3. Discussion

The reaction catalyzed by CPT I is a rate-controlling step in the pathway of LCFA β-oxidation. Currently, five isoforms of CPT I genes (CPT Iα1a, CPT Iα1b, CPT Iα2a, CPT Iα2b and CPT Iβ) were identified in grass carp (C. idella) [10,11]. Moreover, these studies indicated that, compared with other isoforms, mRNA levels of CPT Iα1b and CPT 1α2a were predominant in the liver. Therefore, CPT Iα1b and CPT 1α2a were considered as the liver isoform. To investigate their transcriptional regulatory mechanism, for the first time, we cloned the sequences of CPT Iα1b and CPT Iα2a promoters in fish, and explored their functional characteristics.
In the present study, we found two TSSs of CPT Iα1b corresponding to the alternative 5′ splice variants of CPT Iα1b mRNA. Studies suggested that alternative TSSs usually occurred in the proximal promoter of genes lacking TATA and CCAAT boxes [33]. Batarseh et al. [34] pointed out that multiple TSSs were typically TATA-less and they were located within CpG islands. Park et al. [19] found that the rat L-CPT I (CPT Iα) promoter was GC rich and TATA-less and had an alternative transcription initiation. However, our present study found some variations in TSSs of the CPT Iα1b promoter in grass carp. Grass carp CPT Iα1b promoter was AT-rich and contained two TATA elements without canonical CpG islands, but DNase I foot printing assay showed that both TATA elements were not protected from DNase I digestion, whereas the INR, which encompassed the TSS, was protected from DNase I digestion. These phenomena indicated that the basal transcription of the CPT Iα1b gene required the INR to position the basal transcription machinery. In agreement with our study, Smale and Kadonaga [35] pointed out that the INR was located at the TSS and it was independent of, or in synergy with the TATA box. Thus, our results suggested that the basal transcription of the CPT Iα1b gene might be mediated through an INR-independent mechanism. For CPT Iα2a gene, the present study indicated that the core promoter of grass carp CPT Iα2a was GC-rich and did not contain a TATA box.
In agreement with rat CPT Iα gene [21], our study indicated that the proximal promoter region of CPT Iα2a contained several Sp1 and NF-Y binding sites, whereas only one transcription initiation was identified on the promoter. Steffen et al. [21] pointed out that the Sp1, Sp3 and NF-Y factors played major roles in driving basal expression of rat CPT Iα gene. Sp1, a ubiquitously expressed prototypic C2H2-type zinc finger protein, can activate or repress transcription after physiological and pathological stimuli [36,37]. Studies demonstrated that multiple Sp1 binding sites were a common feature of TATA-less promoters [35]. Moreover, the Sp1 can bind GC-rich motifs and regulate the expression of genes via protein-protein interactions or interplay with other transcription factors and/or components of the transcriptional machinery [37]. NF-Y, one of the major transcriptional factors binding to the CCAAT box, may interact with Sp1 to regulate transcription of various genes [38,39]. In agreement with these studies, the present study indicated that Sp1 and NFY factors were identified on the core region of CPT Iα2a promoter in a similar manner, indicating a similar transcription initiation for CPT Iα2a transcription. Taken together, our study indicated that transcription initiation of the CPT Iα1b and CPT Iα2a genes presented different mechanisms, suggesting that the expression of two genes from grass carp was induced by different transcriptional initiation.
Identification of TFBSs is very important for deciphering the mechanisms of gene regulation [40]. To better understand the regulation of CPT Iα1b and CPT Iα2a at the transcriptional level, we functionally characterized the CPT Iα1b and CPT Iα2a promoters of grass carp. The present study identified a cluster of TFBS, such as TR, HNF4 and PPAR family, on the grass carp CPT Iα1b and CPT Iα2a promoters. Similarly, Jackson-Hayes et al. [41] showed that the rat CPT Iα gene had a thyroid hormone response element (TRE) which was required for the thyroid hormone receptor (TR) binding. In the present study, several TREs were also observed on the grass carp CPT Iα1b and CPT Iα2a promoters. Interestingly, our study found that CPT Iα1b and CPT Iα2a promoters were bound by different isoforms of TRs. The two TREs on the CPT Iα1b promoter were only for TRα binding, and the three TREs on the CPT Iα2a promoter were only for TRβ binding. In fish, TRα and TRβ were expressed at different developmental stages, suggesting their functional differentiation [42]. Additionally, TRα and TRβ were differentially regulated by systemic thyroid status in fish [43]. Thus, these studies strongly suggested that the transcriptions of CPT Iα1b and CPT Iα2a genes were regulated through different mechanism in the liver.
In the present study, deletion analysis indicated that several regions of the promoters contained a potential cis-active element(s) which enhanced/decreased transcriptional activities of the grass carp CPT Iα1b and CPT Iα2a genes. Furthermore, the regions of the CPT Iα1b and CPT Iα2a promoters presented different reporter activities in HepG2 and HEK293 cells. Obviously, the enhancing/decreasing reporter activity indicated the existence of potential positive/negative regulators on the regions, respectively. For the promoter of CPT Iα1b gene, we found that, compared to the region between −1716 and 1379 bp, the luciferase activity between the region from −2276 bp to −1716 bp significantly increased in HepG2 and HEK293 cells. Interestingly, we noticed that the −2067/−2091 TRα binding site, −1939/−1961 PPARα binding site and −1719/−1741 PPARγ binding site were located at the region from −2276 bp to −1716 bp, which was reported to correlated with CPT I expression in mammals [41,44,45,46]. For the promoter of CPT Iα2a gene, we discovered that the luciferase activity increased from the TSS to −848 bp in HepG2 cells, whereas the activity increased from TSS to −1165 bp in HEK293 cells, indicating a different regulation at the region from −848 bp to −1165 bp between the two kinds of cell lines. In the meantime, we found the −1103/−1127 TRβ binding site, −1044/−1066 PPARγ binding site and −1104/−1126 PPARγ binding site were located in this region. Besides, the luciferase activity declined at the region from −1304 bp to −1646 bp in HepG2 cells, but not in HEK293 cells, and this region contained the −1331/−1355 TRβ binding site. Considering different TREs on CPT Iα1b and CPT Iα2a promoter, TR enhanced the promoter activity of corresponding genes and might play important roles in regulating the expression of CPT Iα2a in different tissues. Moreover, we also discovered that the luciferase activity declined in the region from −2695 bp to −2276 bp of CPT Iα1b and the region from −1304 bp to −1646 bp of CPT Iα2a promoter in HepG2 cells. Obviously, some negative regulators binding on these regions regulated CPT Iα1b and CPT Iα2a expression. In addition, studies suggested that the luciferase activity declined in the deletion region from more that −6000 bp to −1653 bp on the promoter of rat CPT Iα [21]. However, the present study indicated that the transcription activity increased on the upstream of the promoters of grass carp CPT Iα1b and CPT Iα2a, suggesting that positive regulators existed on the upstream region of CPT Iα1b and CPT Iα2a promoters. Thus, it appears that the regulation of CPT Iα1b and CPT Iα2a transcription was more complicated in fish than mammals.
PPARs are key transcriptional factors which mediate the regulation of many enzymes related with lipid metabolism [44]. Studies suggested that CPT I was one of the target genes of PPARα [27,45]. In our study, the activities of CPT Iα1b and CPT Iα2a promoters were induced by fenofibrate, PPARα agonist. However, site-directed mutagenesis and EMSA analysis indicated that CPT Iα1b and CPT Iα2a were not regulated through those predicted PPARα binding sites. Accordingly, the reporter activities were up-regulated by fenofibrate, indicating that other potential PPARα binding sites or other related factors existed on the promoter. For instance, studies suggested that PPARα-induced activation of CPT Iα gene was enhanced in a ligand-dependent manner by PGC-1 [46], and PGC-1, as a co-activator, can activate gene transcription through HNF4α [47]. Additionally, studies established the necessity of the first intron in the transcriptional regulation of the CPT Iα gene [26,40]. Taken together, the induction of CPT Iα1b and CPT Iα2a by fenofibrate may involve several nuclear factors and/or other promoter regions of the gene.
PPARγ is one of transcriptional factors which plays important roles in lipogenesis. The present study indicated that transcription of grass carp CPT I was regulated by PPARγ. Pioglitazone, the agonist of PPARγ [48], could increase the activity of grass carp CPT Iα2a promoter, and site-mutation on the −1044/−1066 PPARγ binding site reduced the activity. Moreover, EMSA assay confirmed that the sequence at −1044 bp to −1066 bp was a functional binding locus. Similarly, Gilde et al. [49] found that overexpression of PPARγ in cardiomyocytes was accompanied by basal and ligand-activated transcription of the CPT I promoter. Patsouris et al. [50] reported that PPARγ compensated for PPARα by mediating the HFD-induced up-regulation of PPARα target genes involved in fatty acid oxidation in PPARα-null mice. Moreover, studies suggested that the addition of a classical agonist ligand promoted the dissociation of the co-repressor and the binding of co-activator proteins resulting in an enhancement in the basal transcriptional level of specific genes [51,52]. Stanley [53] found that the PPARγ-directed pioglitazone enhanced the affinity for co-activators and decreased the affinity for co-repressor on PPARγ, indicating that PPARγ possibly activated gene transcription by causing the dissociation of co-repressors and promoting the association of co-activator proteins. Similarly, the present study indicated that site-directed mutagenesis on the −1044/−1066 PPARγ binding site possibly decreased the activity of CPT Iα2a promoter, and pioglitazone-induced activation of PPARγ could up-regulate the activity of CPT Iα2a promoter. These evidences indicated that PPARγ probably played an important role in regulating CPT Iα2a transcription and compensated for PPARα-induced expression of lipolytic genes in fish.
In summary, the 2695-bp CPT Iα1b and 2631-bp CPT Iα2a promoters in grass carp had been cloned and characterized. The promoters of CPT Iα1b and CPT Iα2a genes showed the different structures in their core regions. Several putative TFBSs had been predicted in their promoter regions. Analysis of 5′ deletion mutants presented the regulatory characteristics of CPT Iα1b and CPT Iα2a promoters. Fenofibrate activated the activities of CPT Iα1b and CPT Iα2a promoters. PPARγ played an important role in regulating CPT I expression. The present study provided new insights into the regulatory mechanisms of liver isoforms of CPT I genes in fish.

4. Materials and Methods

4.1. Experimental Animals and Cells

Juvenile grass carp was obtained from Hubei Honghu Fisheries Farm (Jingzhou, Hubei Province, China). HepG2 and HEK293 cell lines were obtained from the Cell Resource Center in Fishery College of Huazhong Agricultural University. We ensured that the experiments were performed in accordance with the experimental protocols of Huazhong Agricultural University (HZAU) and approved by the ethics committee of HZAU (identification code: Fish-2015-0324, Date: 24 March 2015).

4.2. Rapid Amplification of 5′ cDNA Ends (5′ RACE)

The TSSs of CPT Iα1b and CPT Iα2a genes were determined using the GeneRacer Kit (Invitrogen, Carlsbad, CA, USA), according to the manufacturer’s instructions. Briefly, total RNA was isolated from the liver tissue using TRIzol Reagent (Invitrogen), and then the 5′-ready cDNA libraries were prepared using reverse transcription kit (Invitrogen). Nested PCR was performed using a commercial nested 5′ primer (Invitrogen) in combination with a reverse gene-specific primer complementary to CPT Iα1b and CPT Iα2a genes. The PCR reactions were performed using TaKaRa PrimeSTAR® HS DNA Polymerase kit (TaKaRa, Otsu, Japan) under the following PCR conditions: pre-incubation at 94 °C for 3 min, 30 cycles of 94 °C for 15 s, 60 °C for 30 s and 72 °C for 1 min. Amplified PCR products were gel-purified and subcloned into pMD19-T for sequencing (Tsingke, Wuhan, China).

4.3. Cloning of Promoter and Plasmid Construction

Based on the published draft genome of grass carp [32], we cloned the sequences of CPT Iα1b and CPT Iα2a promoters. Genomic DNA was extracted from grass carp tail fins using a commercial kit (Omega, Norcross, GA, USA). For amplification of the CPT Iα1b and CPT Iα2a promoter sequences, specific primers with overlapping sequence were designed and listed in Table 1. For the generation of the luciferase reporter constructs, the PCR product and pGl3-Basic vectors (Promega, Madison, WI, USA) were purified and digested using corresponding endonucleases, and then products were ligated using ClonExpress™ II One Step Cloning Kit (Vazyme, Piscataway, NJ, USA). According to the distance from its TSS, the plasmids were named as pGl3-CPTIα1b-2695 and pGl3-CPTIα2a-2632, respectively. Plasmids pGl3-CPTIα1b-2276, pGl3-CPTIα1b-1716, pGl3-CPTIα1b-1073, pGl3-CPTIα1b-581, pGl3-CPTIα1b-86, pGl3-CPTIα2a-2041, pGl3-CPTIα2a-1646, pGl3-CPTIα2a-1304, pGl3-CPTIα2a-1165, pGl3-CPTIα2a-848, pGl3-CPTIα2a-428 and pGl3-CPTIα2a-97, which contained unidirectional deletions of the promoter regions, were generated with the Erase-a-Base system (Promega) using templates of pGl3-CPTIα1b-2695 and pGl3-CPTIα2a-2632, respectively. The PCR reactions were performed using TaKaRa PrimeSTAR® HS DNA Polymerase kit (TaKaRa) as mentioned above. All plasmids were sequenced in a commercial company (Tsingke).

4.4. Sequence Analysis

For sequence analysis of promoters of CPT Iα1b and CPT Iα2a genes in grass carp, putative TFBSs were predicted by MatInspector online (http://www.genomatix.de/). Nucleotide sequences of CPT Iα1b and CPT Iα2a promoters were compared with DNA sequences present in the GenBank database (http://www.ncbi.nlm.nih.gov/genbank/) and the UCSC Genome Browser (http://genome.ucsc.edu/).

4.5. DNase I Foot Printing Assay

DNase I foot printing assays were performed based on the method of Zianni et al. [54]. In brief, 303-bp and 346-bp proximal regions of CPT Iα1b promoter, which contained two TSSs (TSS1 and TSS2, respectively), were PCR amplified and cloned into pMD-19T vector (TaKaRa). Then, the amplicons were used as the template for further preparation of fluorescent 6-carboxy-fluorescein (FAM)-labeled probes with M13F and M13R-FAM to label the coding strand. After agarose gel electrophoresis, the FAM-labeled probes were purified by Gel Extraction Kit (Omega, USA) and quantified with NanoDrop 2000 (Thermo, Waltham, MA, USA). 10 µg of proteins extracted from HepG2 cell lines were incubated with 500 ng of probes in the same binding buffer based on Zianni et al. [53]. DNase I digestion was performed for 3 min at room temperature and then terminated by the addition of DNase I stop solution (Promega). Digested samples were precipitated with alcohol and then analyzed with the 3730 DNA Analyzer in the commercial company (Tsingke).

4.6. Transfections and Luciferase Assays

HepG2 and HEK293 cells were cultured in DMEM medium supplemented with 10% (v/v) heat-inactivated FBS (Invitrogen) and 2 mM l-glutamine in a humidified atmosphere with 5% CO2 at 37 °C. Prior to the transient transfection, HepG2 or HEK293 cells were seeded in 24-well cell culture plate at a density of 1.2 × 10⁵ and cultured for 24 h to reach 70–80% convergence. Plasmids were transiently transfected into HepG2 or HEK293 cells using Lipofectamine™ 2000 (Invitrogen) following the manufacture’s protocol. All reporter plasmids were used in equimolar amounts in Opti-MEM (Invitrogen), and they were co-transfected with 35 ng pRL-TK as the control. After 4 h, the transfection medium was replaced by 10% FBS-DMEM. Then, with 24-h incubation, cells were harvested to assay the relative luciferase activity by Dual-Luciferase Reporter Assay System (Promega). The relative luciferase activity was presented as the ratio of firefly luciferase to renilla luciferase. Results were normalized to the control reporter pGl3-Basic. All experiments were performed in triplicates and measured at least three times.

4.7. Site-Mutation Analysis of PPAR Binding Sites on the Grass Carp CPT Iα1b and CPT Iα2a Promoters

To identify the corresponding PPAR binding sites on the grass carp CPT Iα1b and CPT Iα2a promoters, we performed site-directed mutagenesis according to the manufacture instruction of QuickChange II Site-Directed Mutagenesis Kit (Vazyme). pGl3-CPTIα1b-2276, pGl3-CPTIα2a-2041 and pGl3-CPTIα2a-1304 were used as templates. The mutagenesis primers were listed in Table 1, and the PCR reactions were performed as mentioned above. These mutant constructs were named as 1bMut-PPAR1, 1bMut-PPAR2, 2aMut-PPAR1, 2aMut-PPAR2, 2aMut-PPAR3, 2aMut-PPAR4, 2aMut-2PPAR1, 2aMut-2PPAR2, 2aMut-2PPAR3 and 2aMut-3PPAR, respectively. Then the constructs and pRL-TK were co-transfected into HepG2 cell lines using LipofectamineTM 2000 following the manufacture’s protocol. After 4 h, the transfection medium was replaced by 10% FBS-DMEM with 50 μM fenofibrate or 10 μM pioglitazone. After 24-h incubation, cells were harvested to assay the luciferase activity according to the procedure above.

4.8. Electrophoretic Mobility-Shift Assay (EMSA)

EMSA was performed to confirm the functional PPAR binding sites of the promoters. Proteins for EMSA were extracted from HepG2 cell lines. Nuclear and cytoplasmic extracts were prepared based on the methods of Read et al. [55]. Protein concentrations were determined by the BCA method [56]. These extracts were stored at −20 °C until analyzed. Each oligonucleotide duplex of PPAR binding sites was incubated with 10 µg nuclear extracts at room temperature according to the instruction of LightShift™ Chemiluminescent EMSA Kit (Invitrogen), and each unlabeled probe was pre-incubated 10 min prior to the addition of biotin-labeled probe. The reaction was allowed to proceed for 30 min after the addition of biotin-labeled probe at room temperature, and then were detected by electrophoresis on 6% native polyacrylamide gels. Competition analyses were performed by using 100-fold excess of unlabeled oligonucleotide duplex with or without the mutation. All the oligonucleotide sequences of EMSA were listed in Table 1.

4.9. Statistical Analysis

Results were presented as mean ± SEM (standard errors of means) in at least three independent biological experiments. Prior to statistical analysis, all data were tested for normality of distribution using the Kolmogornov-Smirnov test. Differences between wild types and drug-treated groups were compared using the Student’s t test. Difference was considered significant at p < 0.05. All statistical analyses were performed using the SPSS10.0 for Windows (SPSS, Michigan Avenue, Chicago, IL, USA).

Supplementary Materials

Supplementary File 1

Acknowledgments

This work was supported by the Fundamental Research Funds for the Central Universities, China (Grants Nos. 2014JQ002, 2662015PY017).

Author Contributions

Zhi Luo and Yi-Huan Xu designed the experiment; Yi-Huan Xu conducted the experiment with the help of Kun Wu, Yao-Fang Fan, Wen-Jing You and Li-Han Zhang; Yi-Huan Xu, Kun Wu and Zhi Luo analyzed the data; Yi-Huan Xu drafted the manuscript and Zhi Luo revised the manuscript. All the authors read and approved the manuscript.

Conflicts of Interest

The authors declare no conflicts of interest with the contents of this article.

Abbreviations

CPT Icarnitine palmitoyltransferase I
FAMfluorescent 6-carboxy-fluorescein
L-CPTliver carnitine palmitoyltransferase
LCFAlong-chain fatty acid
M-CPTmuscle carnitine palmitoyltransferase
PCRpolymerase chain reaction
PPARperoxisome proliferator-activated receptor
PPREperoxisome proliferator-responsive element
RLM-5′RACERNA ligase-mediated rapid amplification of 5′ cDNA ends
RXRretinoid X receptor
TFBStranscription factor binding site
TRthyroid hormone receptor
TREthyroid hormone response elements

References

  1. Sargent, J.R.; Tocher, D.R.; Bell, J.G. The lipids. In Fish Nutrition, 2nd ed.; Halver, J., Hardy, R., Eds.; Academic Press: New York, NY, USA; San Diego, CA, USA, 2002; pp. 181–257. [Google Scholar]
  2. Bartlett, K.; Eaton, S. Mitochondrial β-oxidation. FEBS J. 2004, 271, 462–469. [Google Scholar] [CrossRef]
  3. Skiba-Cassy, S.; Collin, A.; Chartrin, P.; Médale, F.; Simon, J.; Duclos, M.J.; Tesseraud, S. Chicken liver and muscle carnitine palmitoyltransferase 1: Nutritional regulation of messengers. Comp. Biochem. Physiol. B 2007, 147, 278–287. [Google Scholar] [CrossRef] [PubMed]
  4. Morash, A.J.; Kajimura, M.; McClelland, G.B. Intertissue regulation of carnitine palmitoyltransferase I (CPTI): Mitochondrial membrane properties and gene expression in rainbow trout (Oncorhynchus mykiss). BBA-Biomembr. 2008, 1778, 1382–1389. [Google Scholar] [CrossRef] [PubMed]
  5. Britton, C.H.; Schultz, R.A.; Zhang, B.; Esser, V.; Foster, D.W.; McGarry, J.D. Human liver mitochondrial carnitine palmitoyltransferase I: Characterization of its cDNA and chromosomal localization and partial analysis of the gene. Proc. Natl. Acad. Sci. USA 1995, 92, 1984–1988. [Google Scholar] [CrossRef] [PubMed]
  6. Yamazaki, N.; Shinohara, Y.; Shima, A.; Yamanaka, Y.; Terada, H. Isolation and characterization of cDNA and genomic clones encoding human muscle type carnitine palmitoyltransferase I. BBA-Gene Struct. Expr. 1996, 1307, 157–161. [Google Scholar] [CrossRef]
  7. Price, N.T.; van der Leij, F.R.; Jackson, V.N.; Corstorphine, C.G.; Thomson, R.; Sorensen, A.; Zammit, V.A. A novel brain-expressed protein related to carnitine palmitoyltransferase I. Genomics 2002, 80, 433–442. [Google Scholar] [CrossRef] [PubMed]
  8. Zheng, J.L.; Luo, Z.; Zhu, Q.L.; Chen, Q.L.; Gong, Y. Molecular characterization, tissue distribution and kinetic analysis of carnitine palmitoyltransferase I in juvenile yellow catfish Pelteobagrus fulvidraco. Genomics 2013, 101, 195–203. [Google Scholar] [CrossRef] [PubMed]
  9. Wu, K.; Zheng, J.L.; Luo, Z.; Chen, Q.L.; Zhu, Q.L. Carnitine palmitoyltransferase I gene in Synechogobius hasta: Cloning, mRNA expression and transcriptional regulation by insulin in vitro. Gene 2016, 576, 429–440. [Google Scholar] [CrossRef] [PubMed]
  10. Hu, W. Isolation, Purification, Cloning, Kinetic Properties of Enzymes Related to Lipid Metabolism and Response to Copper and Zinc in Ctenopharyngodon idella. Ph.D. Dissertation, Huazhong Agricultural University, Wuhan, China, 2015. [Google Scholar]
  11. Shi, X.C.; Sun, J.; Yang, Z.; Li, X.X.; Ji, H.; Li, Y.; Chang, Z.G.; Du, Z.Y.; Chen, L.Q. Molecular characterization and nutritional regulation of carnitine palmitoyltransferase (CPT) family in grass carp (Ctenopharyngodon idellus). Comp. Biochem. Physiol. 2017, 203, 11–19. [Google Scholar] [CrossRef] [PubMed]
  12. McGarry, J.D.; Brown, N.F. The mitochondrial carnitine palmitoyltransferase system: From concept to molecular analysis. Eur. J. Biochem. 1997, 244, 1–14. [Google Scholar] [CrossRef] [PubMed]
  13. Boukouvala, E.; Leaver, M.J.; Favre-Krey, L.; Theodoridou, M.; Krey, G. Molecular characterization of a gilthead sea bream (Sparus aurata) muscle tissue cDNA for carnitine palmitoyltransferase 1B (CPT 1B). Comp. Biochem. Physiol. 2010, 157, 189–197. [Google Scholar] [CrossRef] [PubMed]
  14. Zheng, J.L.; Hu, W.; Luo, Z.; Zhao, Y.H.; Zhu, Q.L.; Li, X.D. Comparative study on the kinetic behaviour of carnitine palmitoyltransferase I between Javelin goby Synechogobius hasta (carnivorous) and grass carp Ctenopharyngodon idella (herbirovous). Aquacult. Nutr. 2013, 19, 665–676. [Google Scholar] [CrossRef]
  15. Plagnes-Juan, E.; Lansard, M.; Seiliez, I.; Médale, F.; Corraze, G.; Kaushik, S.; Panserat, S.; Skiba-Cassy, S. Insulin regulates the expression of several metabolism-related genes in the liver and primary hepatocytes of rainbow trout (Oncorhynchus mykiss). J. Exp. Biol. 2008, 211, 2510–2518. [Google Scholar] [CrossRef] [PubMed]
  16. Morash, A.J.; Bureau, D.P.; McClelland, G.B. Effects of dietary fatty acid composition on the regulation of carnitine palmitoyltransferase (CPT) I in rainbow trout (Oncorhynchus mykiss). Comp. Biochem. Physiol. 2009, 152, 85–93. [Google Scholar] [CrossRef] [PubMed]
  17. Polakof, S.; Médale, F.; Skiba-Cassy, S.; Corraze, G.; Panserat, S. Molecular regulation of lipid metabolism in liver and muscle of rainbow trout subjected to acute and chronic insulin treatments. Domest. Anim. Endocrin. 2010, 39, 26–33. [Google Scholar] [CrossRef] [PubMed]
  18. Zheng, J.L.; Luo, Z.; Hu, W.; Liu, C.X.; Chen, Q.L. Differential effects of dietary Zn deficiency and excess on carnitine status, kinetics and expression of CPT I in yellow catfish Pelteobagrus fulvidraco. Aquaculture 2014, 420–421, 10–17. [Google Scholar] [CrossRef]
  19. Chen, Q.L.; Luo, Z.; Liu, C.X.; Zheng, J.L. Differential effects of dietary Cu deficiency and excess on carnitine status, kinetics and expression of CPT I in liver and muscle of yellow catfish Pelteobagrus fulvidraco. Comp. Biochem. Physiol. 2015, 188, 24–30. [Google Scholar] [CrossRef] [PubMed]
  20. Park, A.E.; Steffen, L.M.; Song, S.; Park, M.V.; Cook, A.G. Cloning and characterization of the promoter for the liver isoform of the rat carnitine palmitoyltransferase I (L-CPT I) gene. Biochem. J. 1998, 330, 217–224. [Google Scholar] [CrossRef] [PubMed]
  21. Steffen, M.L.; Harrison, W.R.; Elder, F.F. Expression of the rat liver carnitine palmitoyltransferase I (CPT-Iα) gene is regulated by Sp1 and nuclear factor Y: Chromosomal localization and promoter characterization. Biochem. J. 1999, 340, 425–432. [Google Scholar] [CrossRef] [PubMed]
  22. Mascaró, C.; Acosta, E.; Ortiz, J.A.; Marrero, P.F.; Hegardt, F.G.; Haro, D. Control of human muscle-type carnitine palmitoyltransferase I gene transcription by peroxisome proliferator-activated receptor. J. Biol. Chem. 1998, 273, 8560–8563. [Google Scholar] [CrossRef] [PubMed]
  23. Leone, T.C.; Weinheimer, C.J.; Kelly, D.P. A critical role for the peroxisome proliferator-activated receptor α (PPARα) in the cellular fasting response: The PPARα-null mouse as a model of fatty acid oxidation disorders. Proc. Natl. Acad. Sci. USA 1999, 96, 7473–7478. [Google Scholar] [CrossRef] [PubMed]
  24. Ribet, C.; Montastier, E.; Valle, C.; Bezaire, V.; Mazzucotelli, A.; Mairal, A.; Viguerie, N.; Langin, D. Peroxisome proliferator-activated receptor-α control of lipid and glucose metabolism in human white adipocytes. Endocrinology 2010, 151, 123–133. [Google Scholar] [CrossRef] [PubMed]
  25. Zheng, J.L.; Zhuo, M.Q.; Luo, Z.; Song, Y.F.; Pan, Y.X.; Huang, C.; Hu, W.; Chen, Q.L. Peroxisome proliferator-activated receptor alpha1 in yellow catfish Pelteobagrus fulvidraco: Molecular characterization, mRNA tissue expression and transcriptional regulation by insulin in vivo and in vitro. Comp. Biochem. Physiol. 2015, 183, 58–66. [Google Scholar] [CrossRef] [PubMed]
  26. Hsu, S.C.; Huang, C.J. Changes in liver PPARα mRNA expression in response to two levels of high-safflower-oil diets correlate with changes in adiposity and serum leptin in rats and mice. J. Nutr. Biochem. 2007, 18, 86–96. [Google Scholar] [CrossRef] [PubMed]
  27. Napal, L.; Marrero, P.F.; Haro, D. An intronic peroxisome proliferator-activated receptor-binding sequence mediates fatty acid induction of the human carnitine palmitoyltransferase 1A. J. Mol. Biol. 2005, 354, 751–759. [Google Scholar] [CrossRef] [PubMed]
  28. Song, S.; Attia, R.R.; Connaughton, S.; Niesen, M.I.; Ness, G.C.; Elam, M.B.; Hori, R.T.; Cook, G.A.; Park, E.A. Peroxisome proliferator activated receptor α (PPARα) and PPAR gamma coactivator (PGC-1α) induce carnitine palmitoyltransferase IA (CPT-1A) via independent gene elements. Mol. Cell. Endocrinol. 2010, 325, 54–63. [Google Scholar] [CrossRef] [PubMed]
  29. Zheng, J.L.; Zhuo, M.Q.; Luo, Z.; Pan, Y.X.; Song, Y.F.; Huang, C.; Zhu, Q.L.; Hu, W.; Chen, Q.L. Peroxisome proliferator-activated receptor gamma (PPARγ) in yellow catfish Pelteobagrus fulvidraco: Molecular characterization, mRNA expression and transcriptional regulation by insulin in vivo and in vitro. Gen. Comp. Endocr. 2015, 212, 51–62. [Google Scholar] [CrossRef] [PubMed]
  30. Chen, X.; Feng, Y.; Yang, W.J.; Shu, G.; Jiang, Q.Y.; Wang, X.Q. Effects of dietary thiazolidinedione supplementation on growth performance, intramuscular fat and related genes mRNA abundance in the longissimus dorsi muscle of finishing pigs. Asian Australas. J. Anim. 2013, 26, 1012. [Google Scholar] [CrossRef] [PubMed]
  31. Opuszynski, K.; Shireman, J.V. Herbivorous Fishes: Culture and Use for Weed Management; CRC Press Inc.: Boca Raton, FL, USA, 1995. [Google Scholar]
  32. Wang, Y.; Lu, Y.; Zhang, Y.; Ning, Z.; Li, Y.; Zhao, Q.; Lu, H.; Huang, R.; Xia, X.; Feng, Q.; et al. The draft genome of the grass carp (Ctenopharyngodon idellus) provides insights into its evolution and vegetarian adaptation. Nat. Genet. 2015, 47, 625–631. [Google Scholar] [CrossRef] [PubMed]
  33. Valen, E.; Sandelin, A. Genomic and chromatin signals underlying transcription start-site selection. Trends Genet. 2011, 27, 475–485. [Google Scholar] [CrossRef] [PubMed]
  34. Batarseh, A.; Barlow, K.D.; Martinez-Arguelles, D.B.; Papadopoulos, V. Functional characterization of the human translocator protein (18kDa) gene promoter in human breast cancer cell lines. BBA-Gene Regul. Mech. 2012, 1819, 38–56. [Google Scholar] [CrossRef] [PubMed]
  35. Smale, S.T.; Kadonaga, J.T. The RNA polymerase II core promoter. Annu. Rev. Biochem. 2003, 72, 449–479. [Google Scholar] [CrossRef] [PubMed]
  36. Suske, G. The Sp-family of transcription factors. Gene 1999, 238, 291–300. [Google Scholar] [CrossRef]
  37. Wierstra, I. Sp1: Emerging roles-beyond constitutive activation of TATA-less housekeeping genes. Biochem. Biophys. Res. Commun. 2008, 372, 1–13. [Google Scholar] [CrossRef] [PubMed]
  38. Bolognese, F.; Pitarque-Martì, M.; Cicero, V.L.; Mantovani, R.; Maier, J.A. Characterization of the human EDF-1 minimal promoter: Involvement of NFY and Sp1 in the regulation of basal transcription. Gene 2006, 374, 87–95. [Google Scholar] [CrossRef] [PubMed]
  39. Sun, F.; Xie, Q.; Ma, J.; Yang, S.; Chen, Q.; Hong, A. Nuclear factor Y is required for basal activation and chromatin accessibility of fibroblast growth factor receptor 2 promoter in osteoblast-like cells. J. Biol. Chem. 2009, 284, 3136–3147. [Google Scholar] [CrossRef] [PubMed]
  40. Chan, T.M.; Leung, K.S.; Lee, K.H. TFBS identification based on genetic algorithm with combined representations and adaptive post-processing. Bioinformatics 2007, 24, 341–349. [Google Scholar] [CrossRef] [PubMed]
  41. Jackson-Hayes, L.; Song, S.; Lavrentyev, E.N.; Jansen, M.S.; Hillgartner, F.B.; Tian, L.; Wood, P.A.; Cook, G.A.; Park, E.A. A thyroid hormone response unit formed between the promoter and first intron of the carnitine palmitoyltransferase-Iα gene mediates the liver-specific induction by thyroid hormone. J. Biol. Chem. 2003, 278, 7964–7972. [Google Scholar] [CrossRef] [PubMed]
  42. Liu, Y.W.; Lo, L.J.; Chan, W.K. Temporal expression and T3 induction of thyroid hormone receptors α1 and β1 during early embryonic and larval development in zebrafish, Danio rerio. Mol. Cell. Endocrinol. 2000, 159, 187–195. [Google Scholar] [CrossRef]
  43. Johnson, K.M.; Lema, S.C. Tissue-specific thyroid hormone regulation of gene transcripts encoding iodothyronine deiodinases and thyroid hormone receptors in striped parrotfish (Scarus iseri). Gen. Comp. Endocrinol. 2011, 172, 505–517. [Google Scholar] [CrossRef] [PubMed]
  44. Reddy, J.K., III. Peroxisomal β-oxidation, PPARα, and steatohepatitis. Am. J. Physiol. 2001, 281, G1333–G1339. [Google Scholar]
  45. Lawrence, J.W.; Li, Y.; Chen, S.; DeLuca, J.G.; Berger, J.P.; Umbenhauer, D.R.; Moller, D.E.; Zhou, G. Differential gene regulation in human versus rodent hepatocytes by peroxisome proliferator-activated receptor (PPAR) α: PPARα fails to induce peroxisome proliferation-associated genes in human cells independently of the level of receptor expression. J. Biol. Chem. 2001, 276, 31521–31527. [Google Scholar] [CrossRef] [PubMed]
  46. Koo, S.H.; Satoh, H.; Herzig, S.; Lee, C.H.; Hedrick, S.; Kulkarni, R.; Evans, R.M.; Olefsky, J.; Montminy, M. PGC-1 promotes insulin resistance in liver through PPAR-α-dependent induction of TRB-3. Nat. Med. 2004, 10, 530–534. [Google Scholar] [CrossRef] [PubMed]
  47. Yoon, J.C.; Puigserver, P.; Chen, G.; Donovan, J.; Wu, Z.; Rhee, J.; Adelmant, G.; Stafford, J.; Kahn, C.R.; Granner, D.K.; et al. Control of hepatic gluconeogenesis through the transcriptional coactivator PGC-1. Nature 2001, 413, 131–138. [Google Scholar] [CrossRef] [PubMed]
  48. Lehmann, J.M.; Moore, L.B.; Smith-Oliver, T.A.; Wilkison, W.O.; Willson, T.M.; Kliewer, S.A. An antidiabetic thiazolidinedione is a high affinity ligand for peroxisome proliferator-activated receptor γ (PPARγ). J. Biol. Chem. 1995, 270, 12953–12956. [Google Scholar] [CrossRef] [PubMed]
  49. Gilde, A.J.; van der Lee, K.A.; Willemsen, P.H.; Chinetti, G.; van der Leij, F.R.; van der Vusse, G.J.; Staels, B.; van Bilsen, M. Peroxisome proliferator-activated receptor (PPAR) α and PPARβ/δ, but not PPARγ, modulate the expression of genes involved in cardiac lipid metabolism. Circ. Res. 2003, 92, 518–524. [Google Scholar] [CrossRef] [PubMed]
  50. Patsouris, D.; Reddy, J.K.; Muller, M.; Kersten, S. Peroxisome proliferator-activated receptor α mediates the effects of high-fat diet on hepatic gene expression. Endocrinology 2006, 147, 1508–1516. [Google Scholar] [CrossRef] [PubMed]
  51. Xu, L.; Glass, C.K.; Rosenfeld, M.G. Coactivator and corepressor complexes in nuclear receptor function. Curr. Opin. Genet. Dev. 1999, 9, 140–147. [Google Scholar] [CrossRef]
  52. Robyr, D.; Wolffe, A.P.; Wahli, W. Nuclear hormone receptor coregulators in action: Diversity for shared tasks. Mol. Endocrinol. 2000, 14, 329–347. [Google Scholar] [CrossRef] [PubMed]
  53. Stanley, T.B.; Leesnitzer, L.M.; Montana, V.G.; Galardi, C.M.; Lambert, M.H.; Holt, J.A.; Xu, H.E.; Moore, L.B.; Blanchard, S.G.; Stimmel, J.B. Subtype specific effects of peroxisome proliferator-activated receptor ligands on corepressor affinity. Biochemistry 2003, 42, 9278–9287. [Google Scholar] [CrossRef] [PubMed]
  54. Zianni, M.; Tessanne, K.; Merighi, M.; Laguna, R.; Tabita, F.R. Identification of the DNA bases of a DNase I footprint by the use of dye primer sequencing on an automated capillary DNA analysis instrument. J. Biomol. Tech. 2006, 17, 103–113. [Google Scholar] [PubMed]
  55. Read, M.A.; Cordle, S.R.; Veach, R.A.; Carlisle, C.D.; Hawiger, J. Cell-free pool of CD14 mediates activation of transcription factor NF-kappa B by lipopolysaccharide in human endothelial cells. Proc. Natl. Acad. Sci. USA 1993, 90, 9887–9891. [Google Scholar] [CrossRef] [PubMed]
  56. Smith, P.K.; Krohn, R.I.; Hermanson, G.T.; Mallia, A.K.; Gartner, F.H.; Provenzano, M.; Fujimoto, N.M.; Goeke, B.J.; Olson, B.J.; Klenk, D.C. Measurement of protein using bicinchoninic acid. Anal. Biochem. 1985, 150, 76–85. [Google Scholar] [CrossRef]
Figure 1. A map of the first two exons in the CPT Iα1b and CPT Iα2a genes was shown. Exons were denoted by black rectangles, introns by a fold line and transcriptional direction (5′-3′) by an arrow line. The initiation codon (ATG) in exon 2 represented the start site of protein translation. Numbers were relative to the distance from transcription start site (+1). (A) structure of transcription start site (TSS) of CPT Iα1b gene (B) structure of alternative splicing transcription start site (TSS’) of CPT Iα1b gene (C) structure of transcription start site of CPT Iα2a gene.
Ijms 18 02405 g001
Figure 2. DNase I foot printing assay of proximal promoter of CPT Iα1b. (A) 303-bp proximal promoter region of CPT Iα1b (B) 346-bp proximal promoter region of CPT Iα1b. The sequence used for FAM-labeled probe was presented, based on the result of DNase I foot printing. Putative binding sequence was underlined and italicized with labels. Capital letters indicate the coding sequence of proximal promoter region of CPT Iα1b, and lowcase letters indicate the partial sequence of pMD-19T vector. The primer sequences used for DNase I foot printing assay M13F and M13R-FAM were labeled by arrows.
Ijms 18 02405 g002
Figure 3. Nucleotide sequence of grass carp CPT Iα1b promoter. +1 denoted the transcription start site (TSS1) obtained from RLM-5′RACE experiment. TSS2 presented another transcription start site (−346, TSS′). Numbers indicated the distance from TSS1. The highlighted sequences show putative transcription factor binding sites.
Ijms 18 02405 g003
Figure 4. Nucleotide sequence of grass carp CPT Iα2a promoter. +1 denotes the TSS obtained from RLM-5′RACE experiment. Numbers present distance from TSS. The highlighted sequences show putative transcription factor binding sites.
Ijms 18 02405 g004
Figure 5. 5′ Unidirectional deletion analysis of the CPT Iα1b and CPT Iα2a promoter regions for grass carp. Schematic diagrams of truncated promoters were shown at the left panel. The corresponding luciferase reporter assay results were shown in the right panel. Promoter activity of constructs is presented with the values of relative light unit. A series of plasmids containing 5′ unidirectional deletions of the CPT Iα1b promoter region fused in frame to the luciferase gene were transfected into HepG2 cells (A) and HEK293 cells (B), and a series of plasmids containing 5′ unidirectional deletions of the CPT Iα2a promoter region were transfected into HepG2 cells (C) and HEK293 cells (D). Values represent the ratio between firefly and renilla luciferase activities, normalized to the control plasmid pGl3-Basic. Results were expressed as the mean ± SEM of three independent experiments (Student’s t-test, * p < 0.05).
Ijms 18 02405 g005
Figure 6. Analysis of putative PPAR binding sites by site-directed mutagenesis. Site-mutation constructs are presented in the left panel. Promoter activity of constructs is presented in the middle. Promoter activity treated with agonist was presented in the right panel. (A) site-mutations of PPARα binding sites on pGl3-CPTIα1b-2276 and pGl3-CPTIα2a-2041 vectors (B) site-mutation of PPARγ binding sites on pGl3-CPTIα1b-2276 and pGl3-CPTIα2a-1304 vectors. Values represent the ratio between firefly and renilla luciferase activities, normalized to the control plasmid pGL3-Basic. Bars are the mean ± SEM of three independent experiments (Student’s t-test, * p < 0.05).
Ijms 18 02405 g006
Figure 7. Electrophoretic mobility-shift assay (EMSA) of putative PPAR binding sequences. The 5′-biotin labeled double-stranded oligomers were incubated with HepG2 nuclear extract (NP). A 100-fold excess of the competitor and Mutative competitor oligomers was added to the competition and mutant competition assay, respectively. The oligonucleotide sequences are given in Table 1. (A) PPARα/RXR binding sequence located at −1814 bp to −1836 bp of CPT Iα1b promoter (B) PPARγ binding sequence located at −1719 bp to −1741 bp of CPT Iα1b promoter (C) PPARα/RXR binding sequence located at −1939 bp to −1961 bp of CPT Iα2a promoter (D) PPARγ binding sequence located at −1179 bp to −1201 bp of CPT Iα2a promoter (E) PPARγ binding sequence located at −1104 bp to −1136 bp of CPT Iα2a promoter (F) PPARγ binding sequence located at −1044 bp to −1066 bp of CPT Iα2a promoter.
Ijms 18 02405 g007
Table 1. Primers used in the experiments.
NamePrimerSequence (5′–3′)
Primers for promoter construct
CPT Iα1b+36RCCCAAGCTTCTAACAATTCCGATGATGTGG
−2695FCGAGCTCAAGCAAGAAGGCAATAGGGT
CPT Iα2a+30RCCCAAGCTTCGTGCCTTTGATACTAAGTGCG
−2631FCGAGCTCGGGCTACCAGTAACTATAAGGG
Primers for deleting PPAR binding sites of promoters
1bMut- PPAR1FGCACTTTTCTTTTCCAGAATTTTGTAGTTGTGAGTCA
- PPAR1RCTGGAAAAGAAAAGTGCCTTTAATTTCTTGCTC
- PPAR2FTGTAGTGGCGACATCTCAGTATCATCTGGGTGG
- PPAR2RTGAGATGTCGCCACTACAGGGAGGTGGAAAGGG
2aMut- PPAR1FGTTTTACAATTTGTTGGAAATTTTGTTTTGTTTAATG
- PPAR1RTCCAACAAATTGTAAAACAAGCATTGCCAACAA
- PPAR2FGACTTCGGTAACACTAACAAAACAGTGGGGTAAATC
- PPAR2RGTTAGTGTTACCGAAGTCAACATTCTCACATTG
- PPAR3FATGCTCACCGAACAGCTTATGTAAGGCAAGGGA
- PPAR3RAAGCTGTTCGGTGAGCATGGAACAGGATTTACC
- PPAR4FGGAAGGGGTGATGGAAAAAATCTGTGGTGTCTG
- PPAR4RTTTTCCATCACCCCTTCCCTTGCCTTACATAAG
Oligonucleotide for EMSA assay
CPT Iα1b
- PPAR1
Biotin-probeBiotin—TAAGCAACTTTGCACTGATTTAC
Mutative-competitorTAAGCAACCCCCCACTGATTTAC
CPT Iα1b
- PPAR2
Biotin-probeBiotin—ATTTGTTCTTTCCCCCAATGGCC
Mutative-competitorATTTGTTCCCCCCCCCAATGGCC
CPT Iα2a
- PPAR1
Biotin-probeBiotin—CGATCAACTATTTCATAGTTGTT
Mutative-competitorCGATCAAGGGGTTCATAGTTGTT
CPT Iα2a
- PPAR2
Biotin-probeBiotin—AATAATTGTGGGAAAGGTGAAAG
Mutative-competitorAATAATTGTGGGGGGGGTGAAAG
CPT Iα2a
- PPAR3
Biotin-probeBiotin—TCTTGCTGTGAAATAGGTCAGTT
Mutative-competitorTCTTGCTGTGAAGGGGGTCAGTT
CPT Iα2a
- PPAR3
Biotin-probeBiotin—GGCTGGGTGGTCTTTTCCCACTT
Mutative-competitorGGCCCCCTGGTCTTTTCCCACTT
Primer for DNase I foot printing assay
M13FGTAAAACGACGGCCAGT
M13R-FAMFAM-CAGGAAACAGCTATGAC

