The Na, K-ATPase β-Subunit Isoforms Expression in Glioblastoma Multiforme: Moonlighting Roles

 ,
,  , , and
Abstract
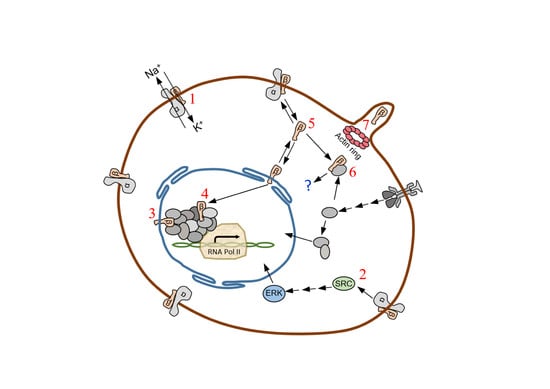
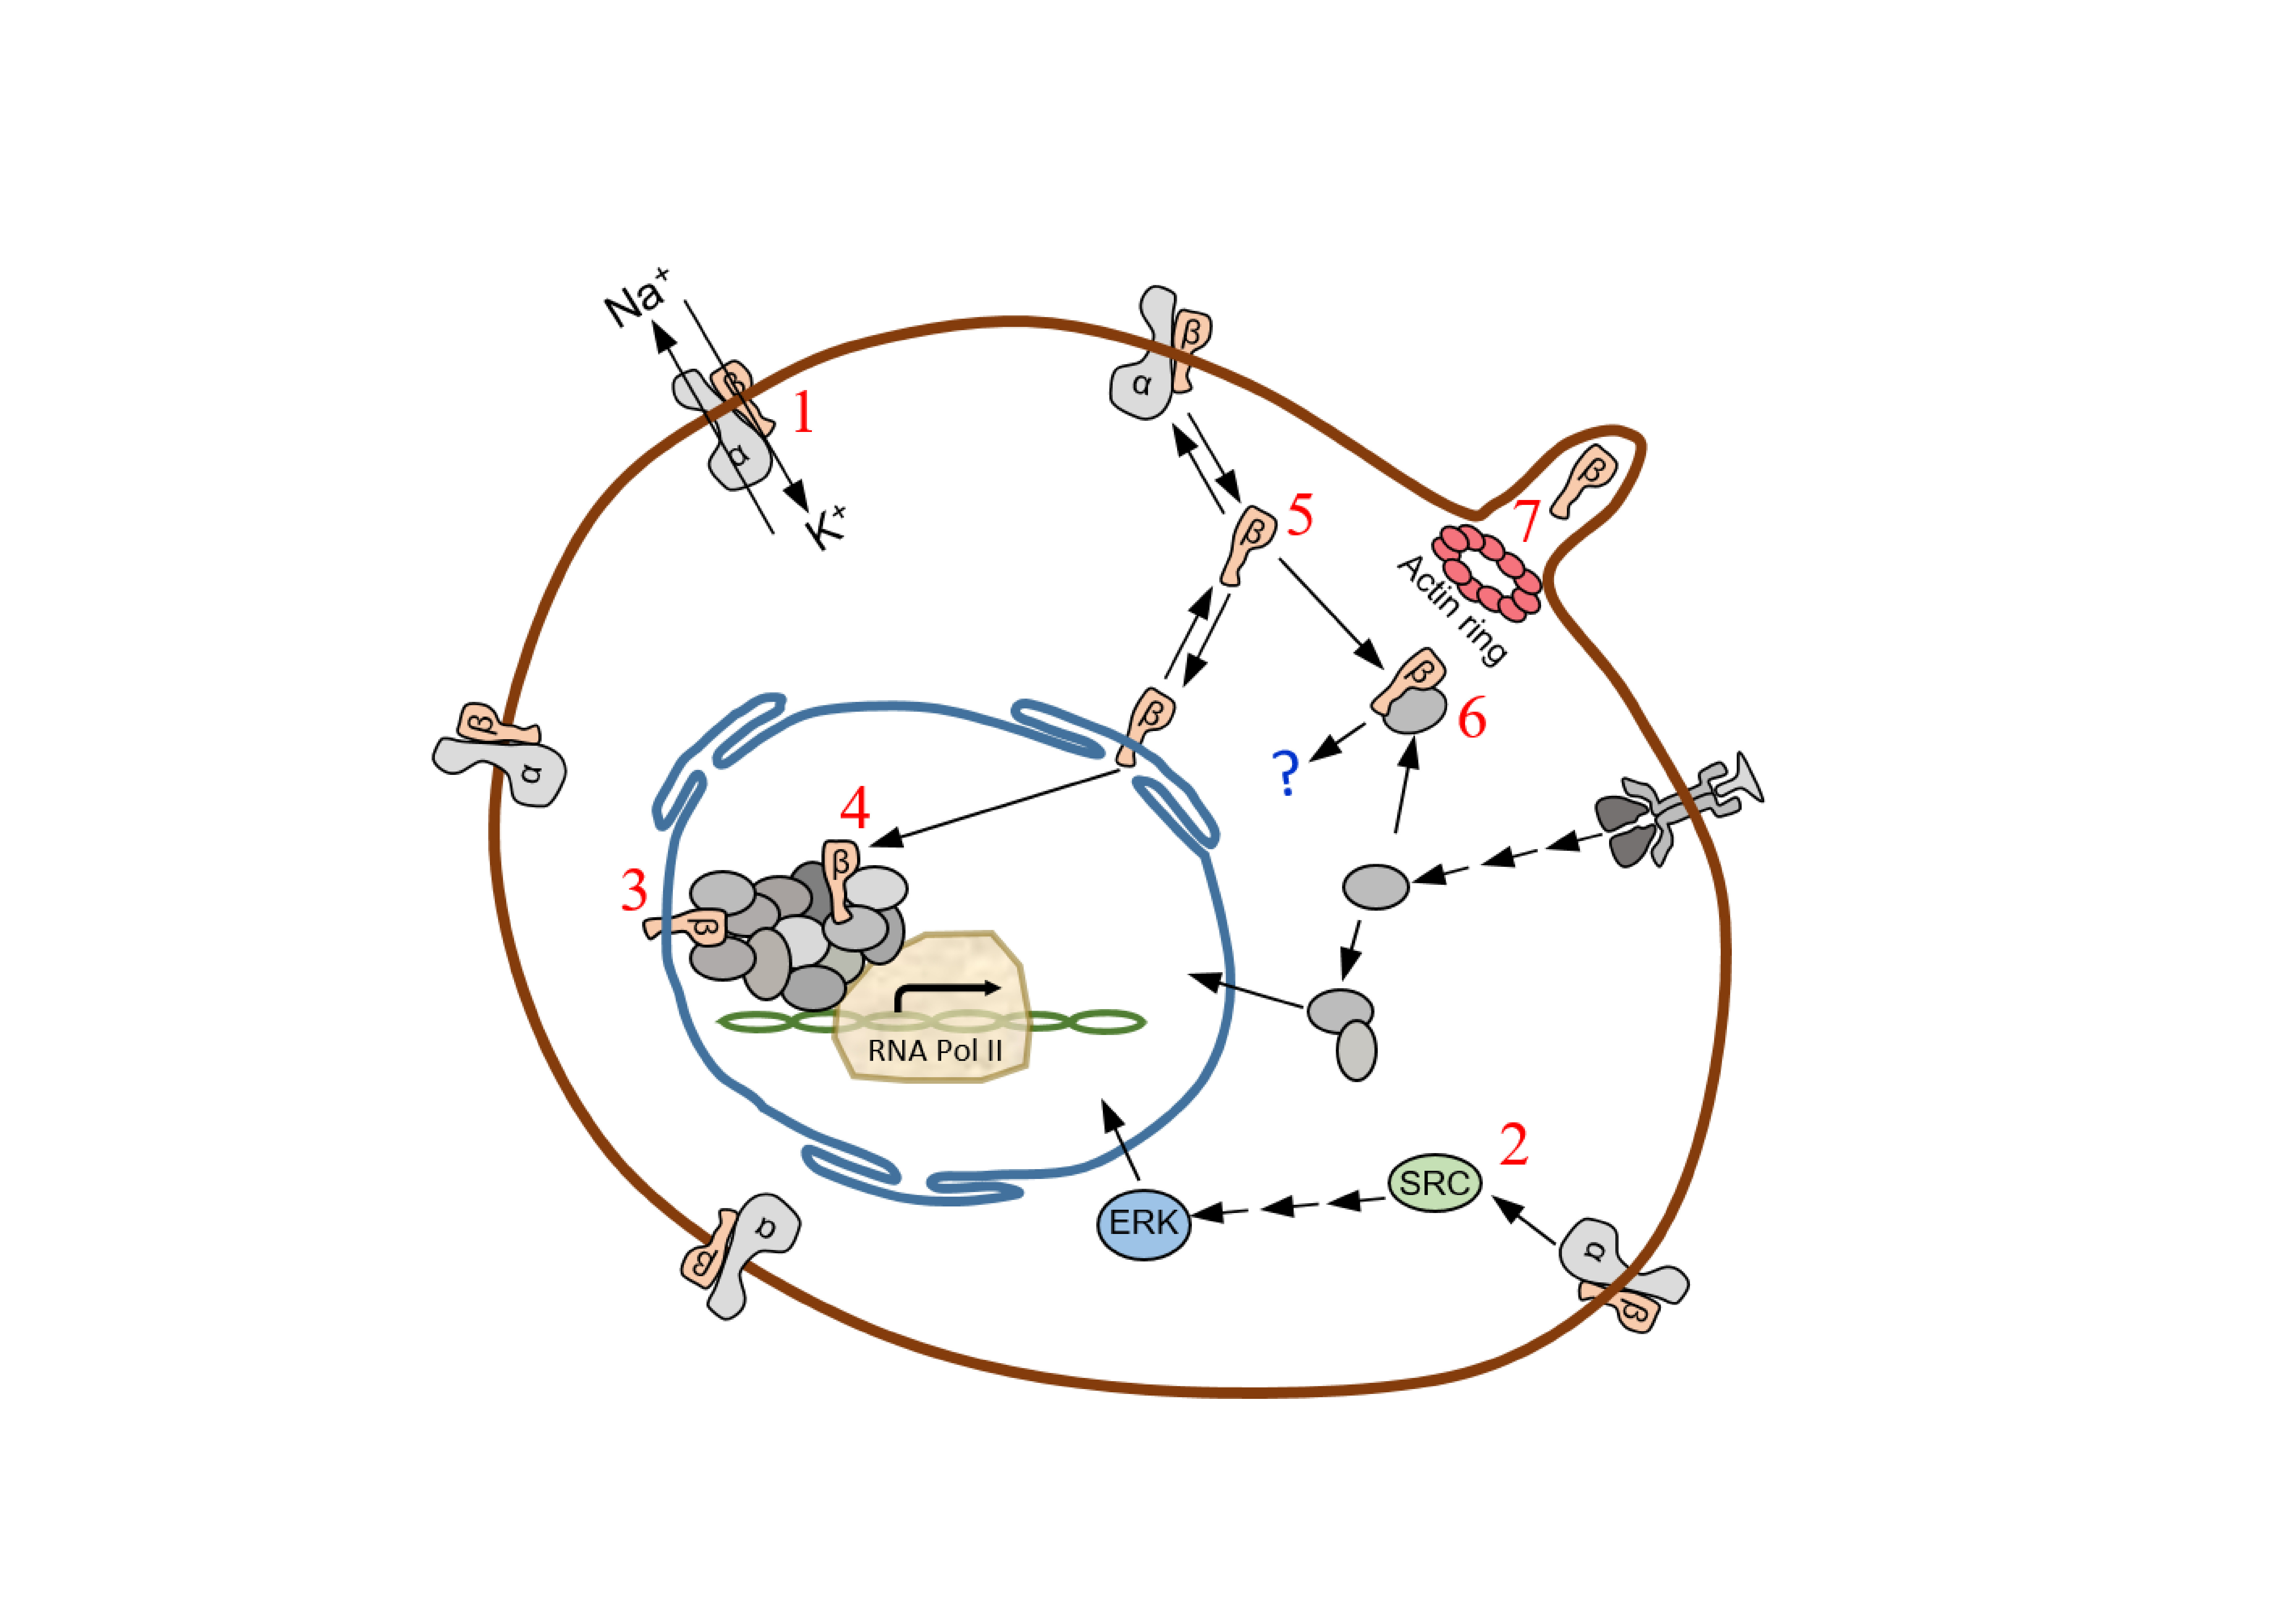
1. Introduction
2. Results
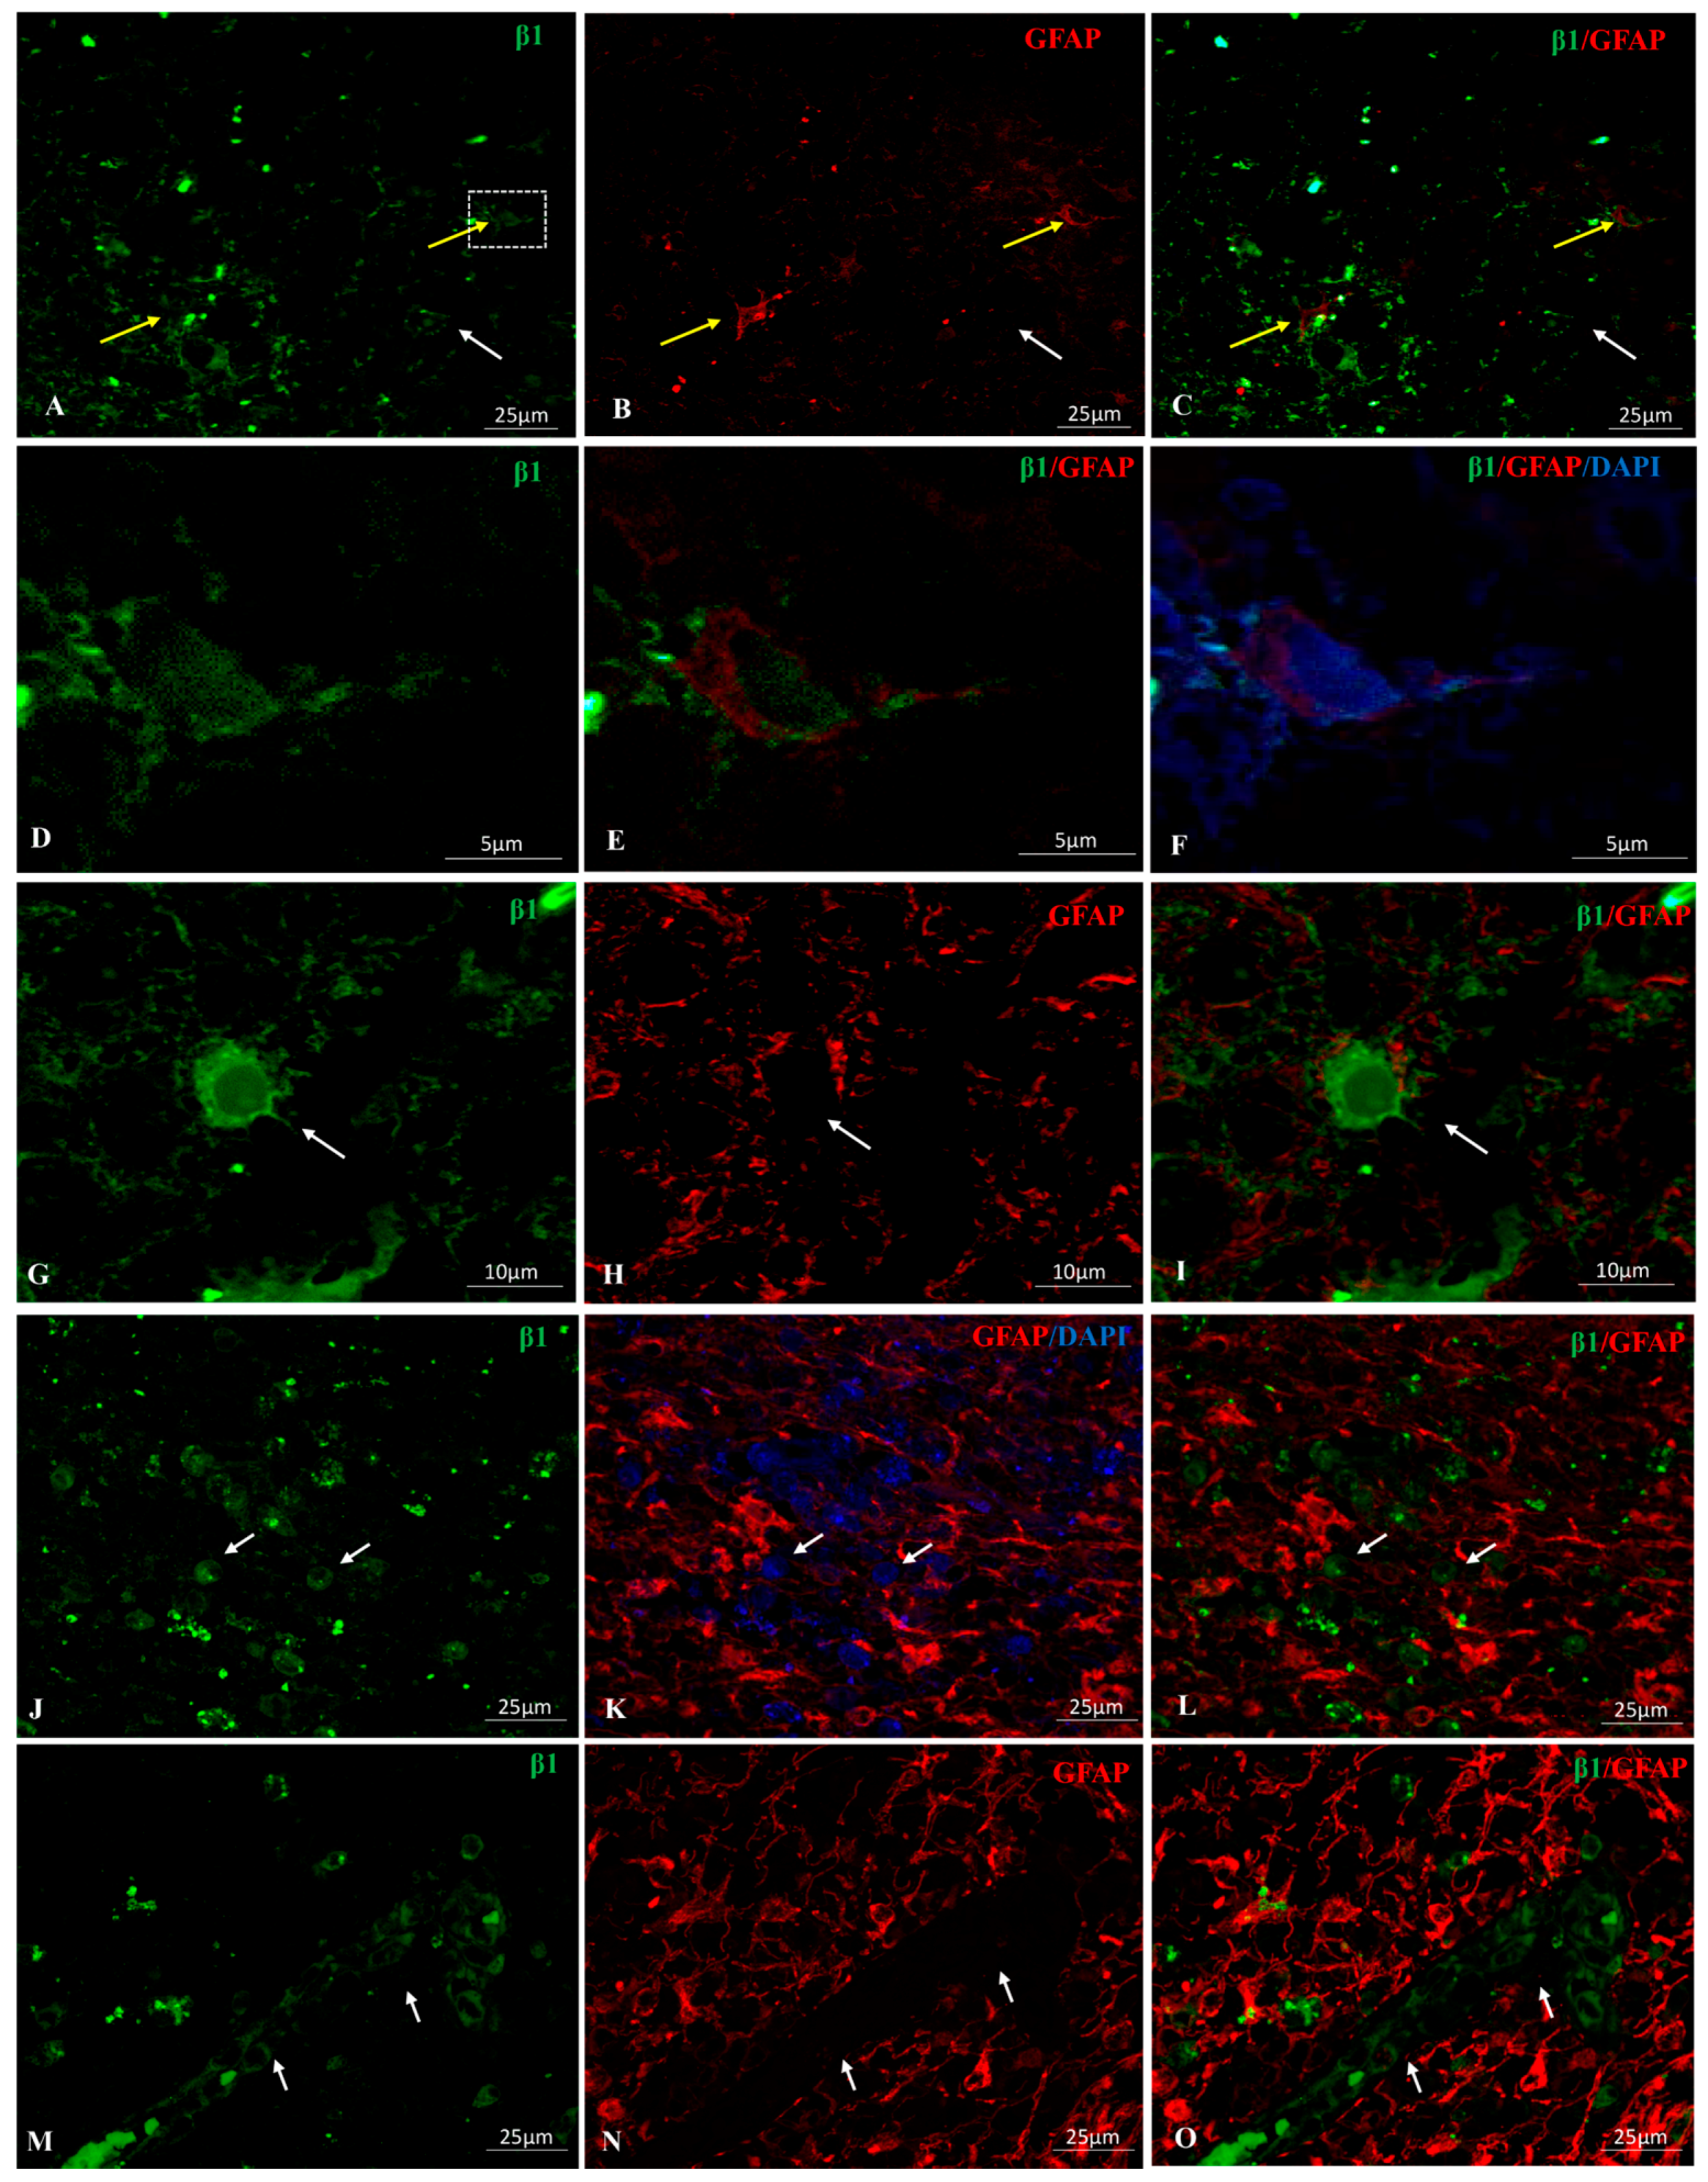
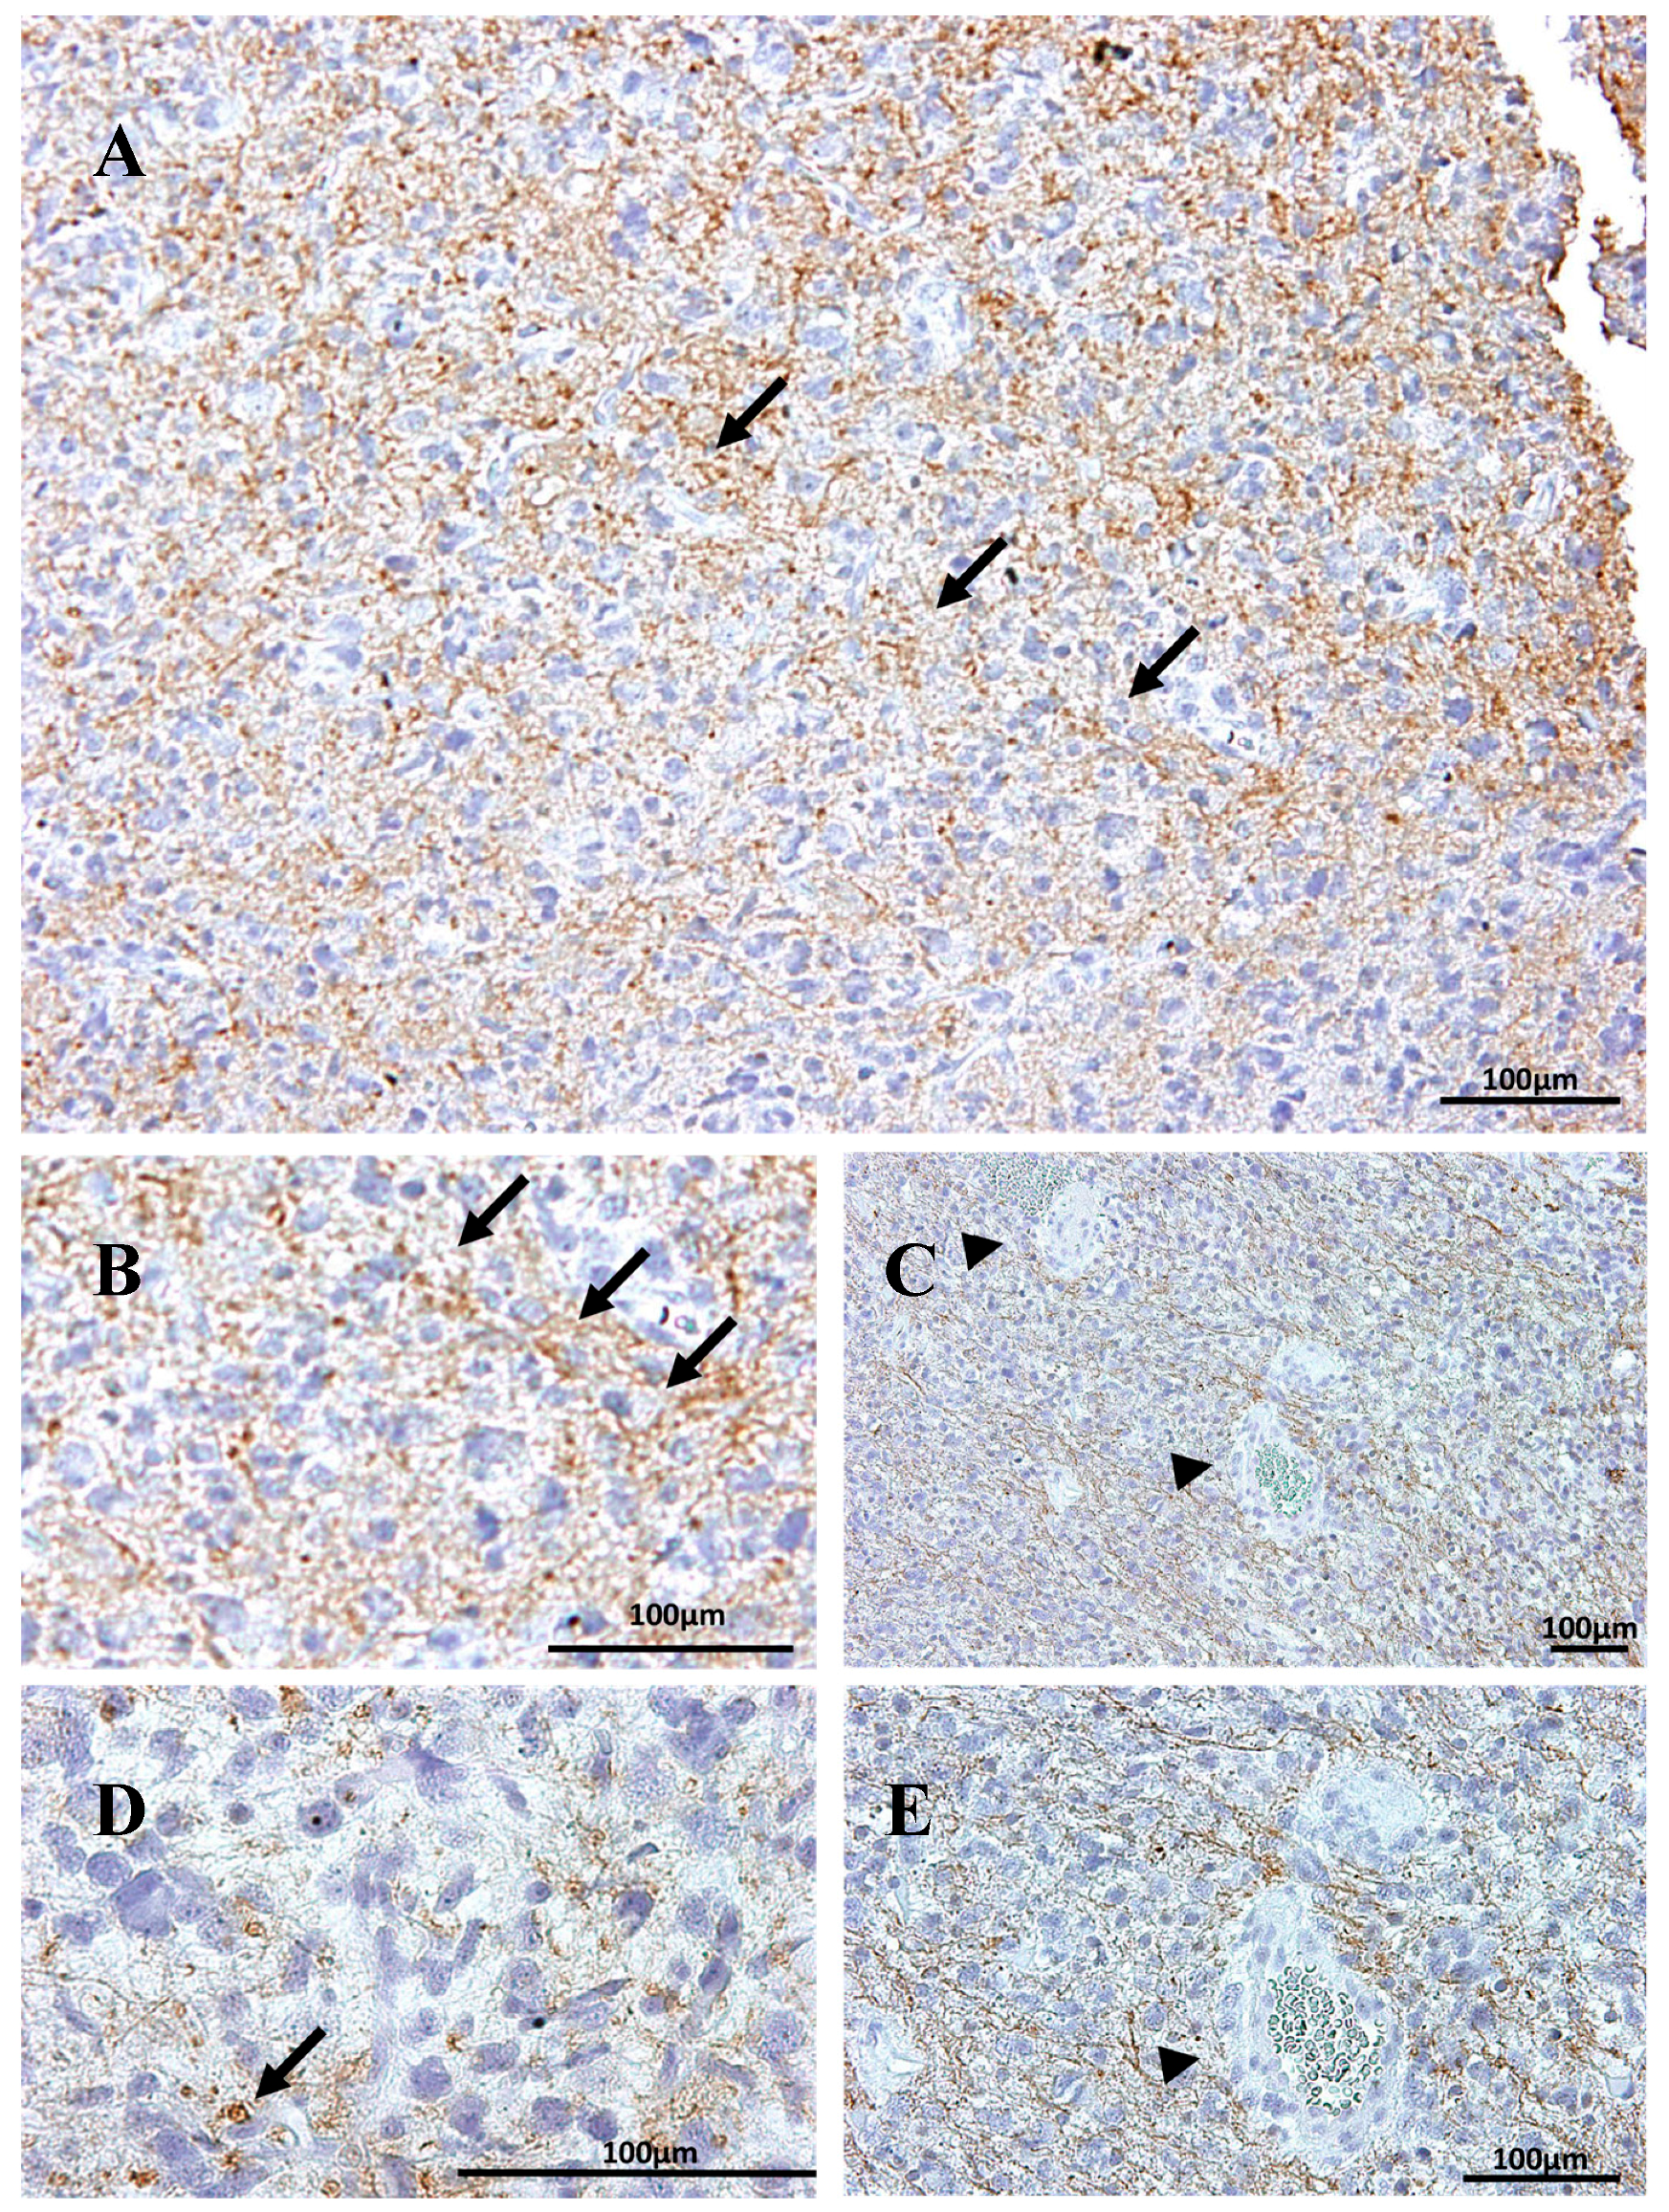
2.1. Na, K-ATPase β1 Isoform Expression in GBM
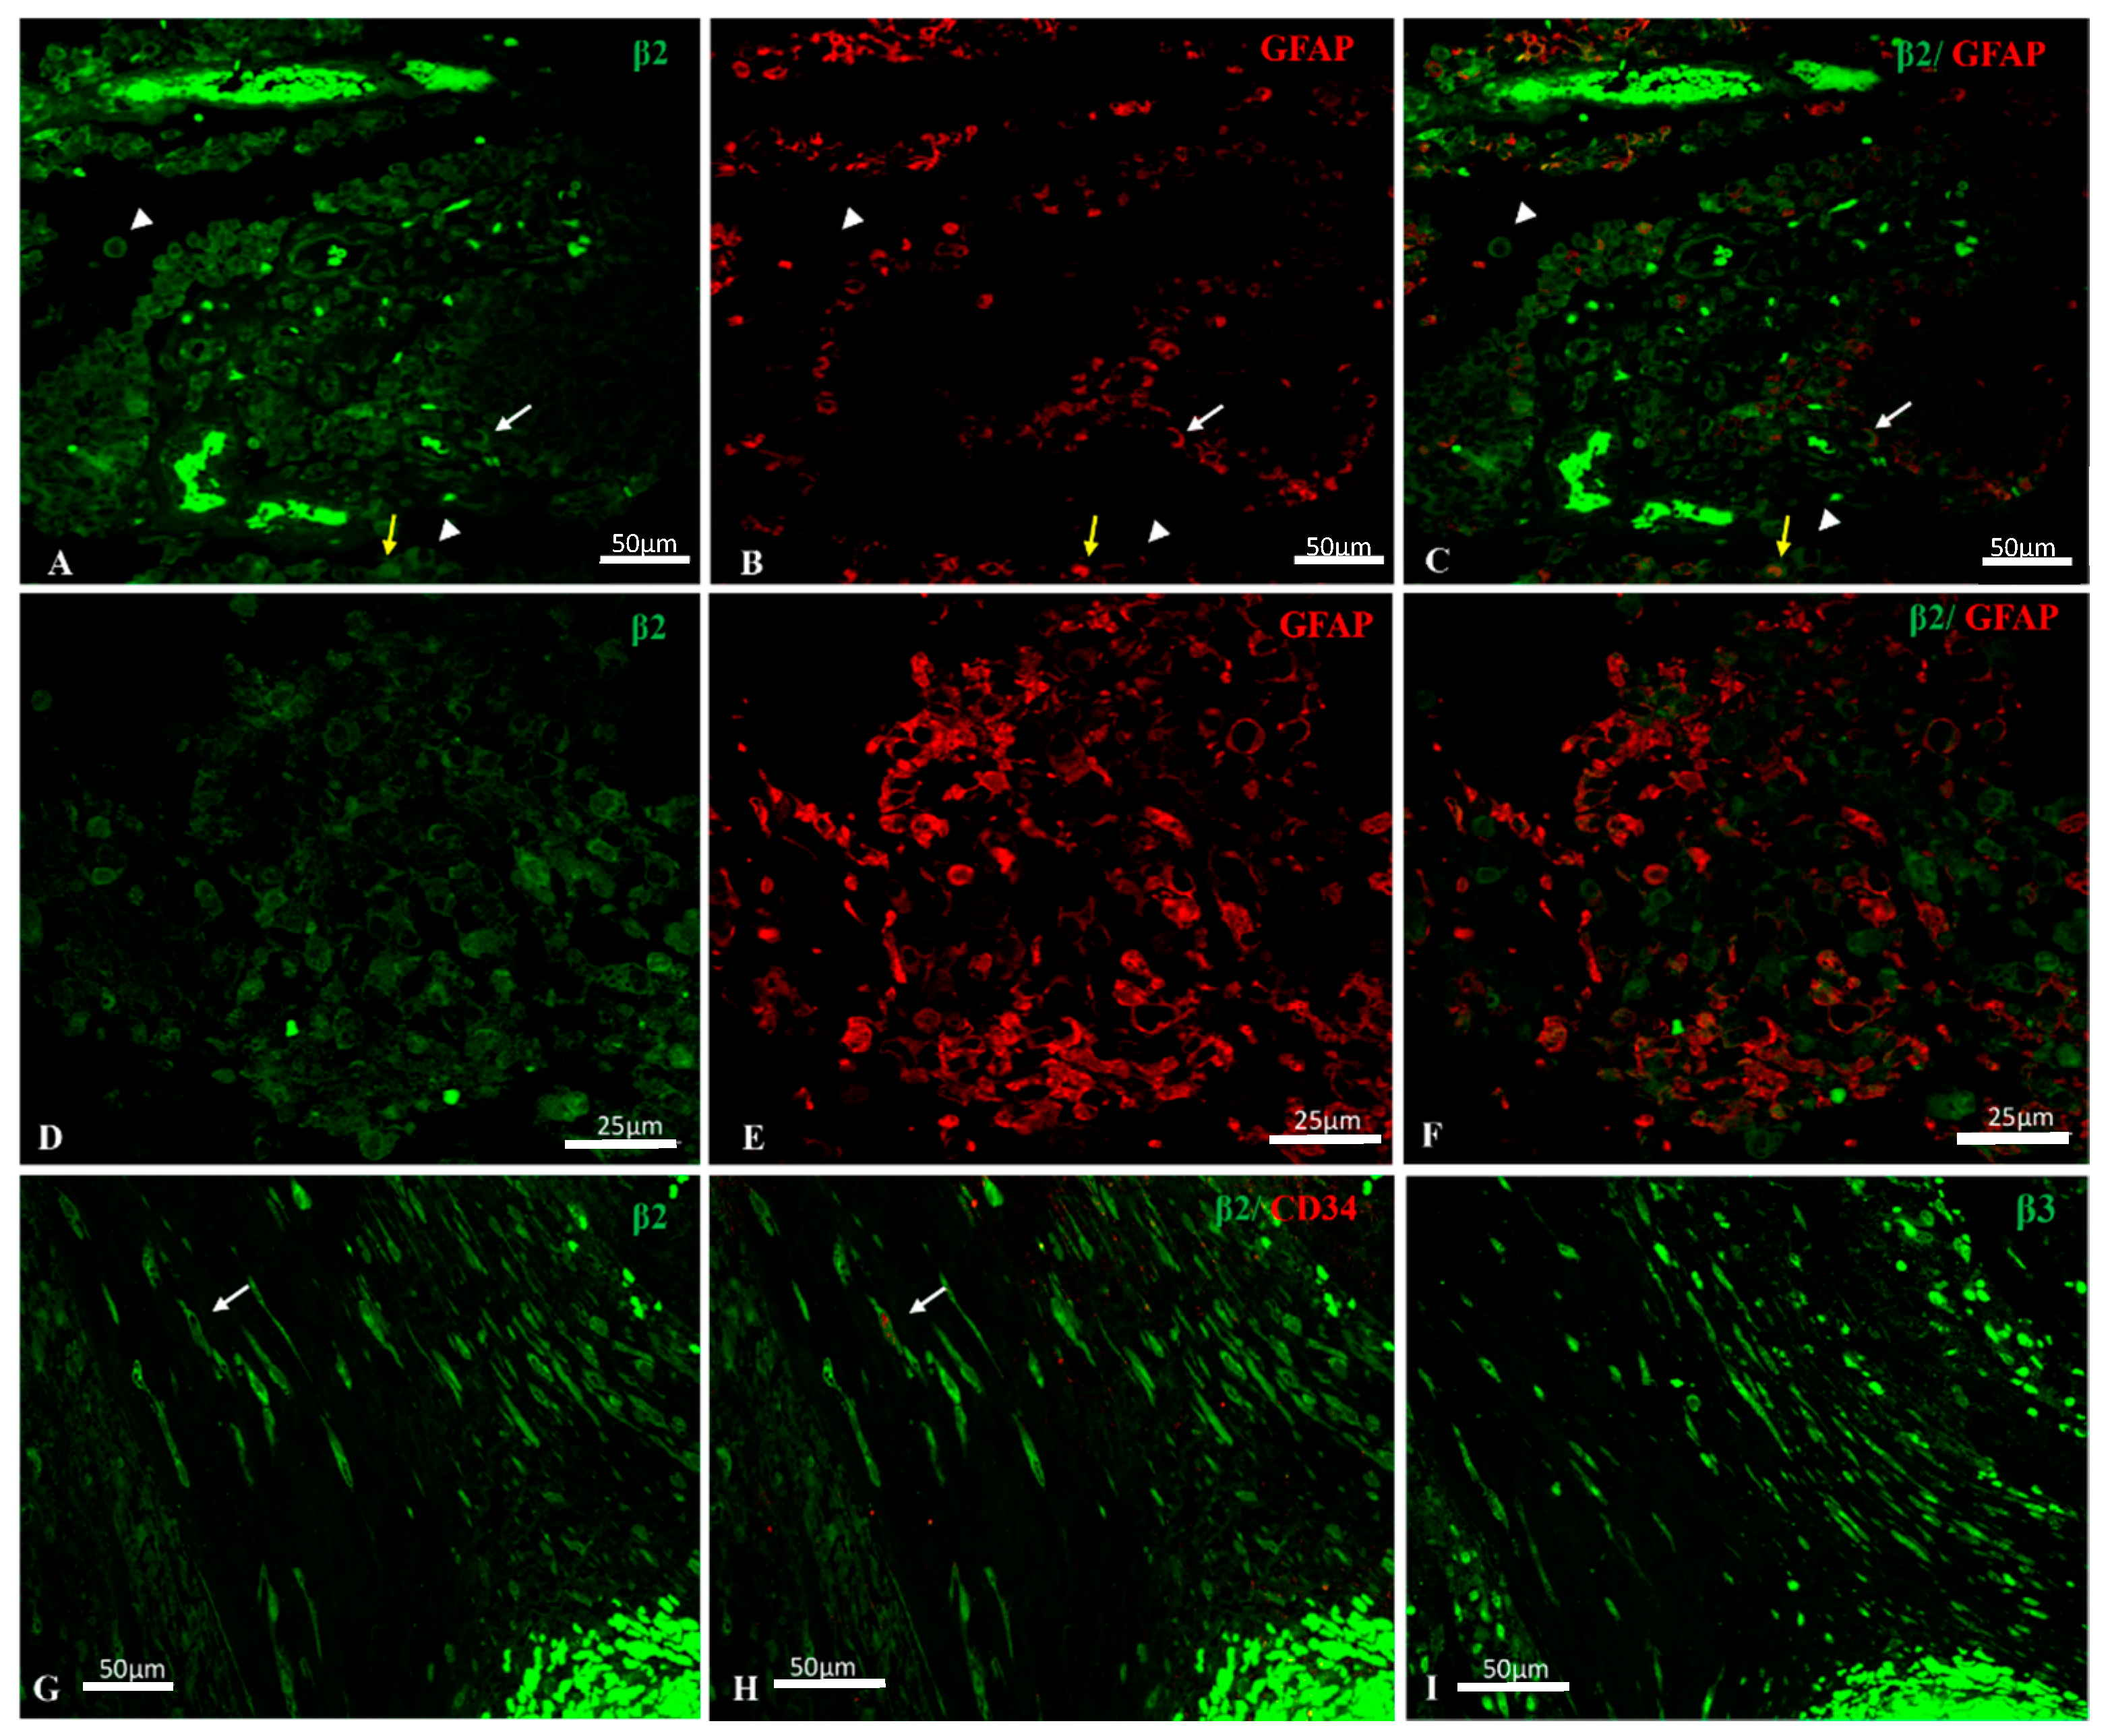
2.2. Na, K-ATPase β2/AMOG Isoform Expression in GBM
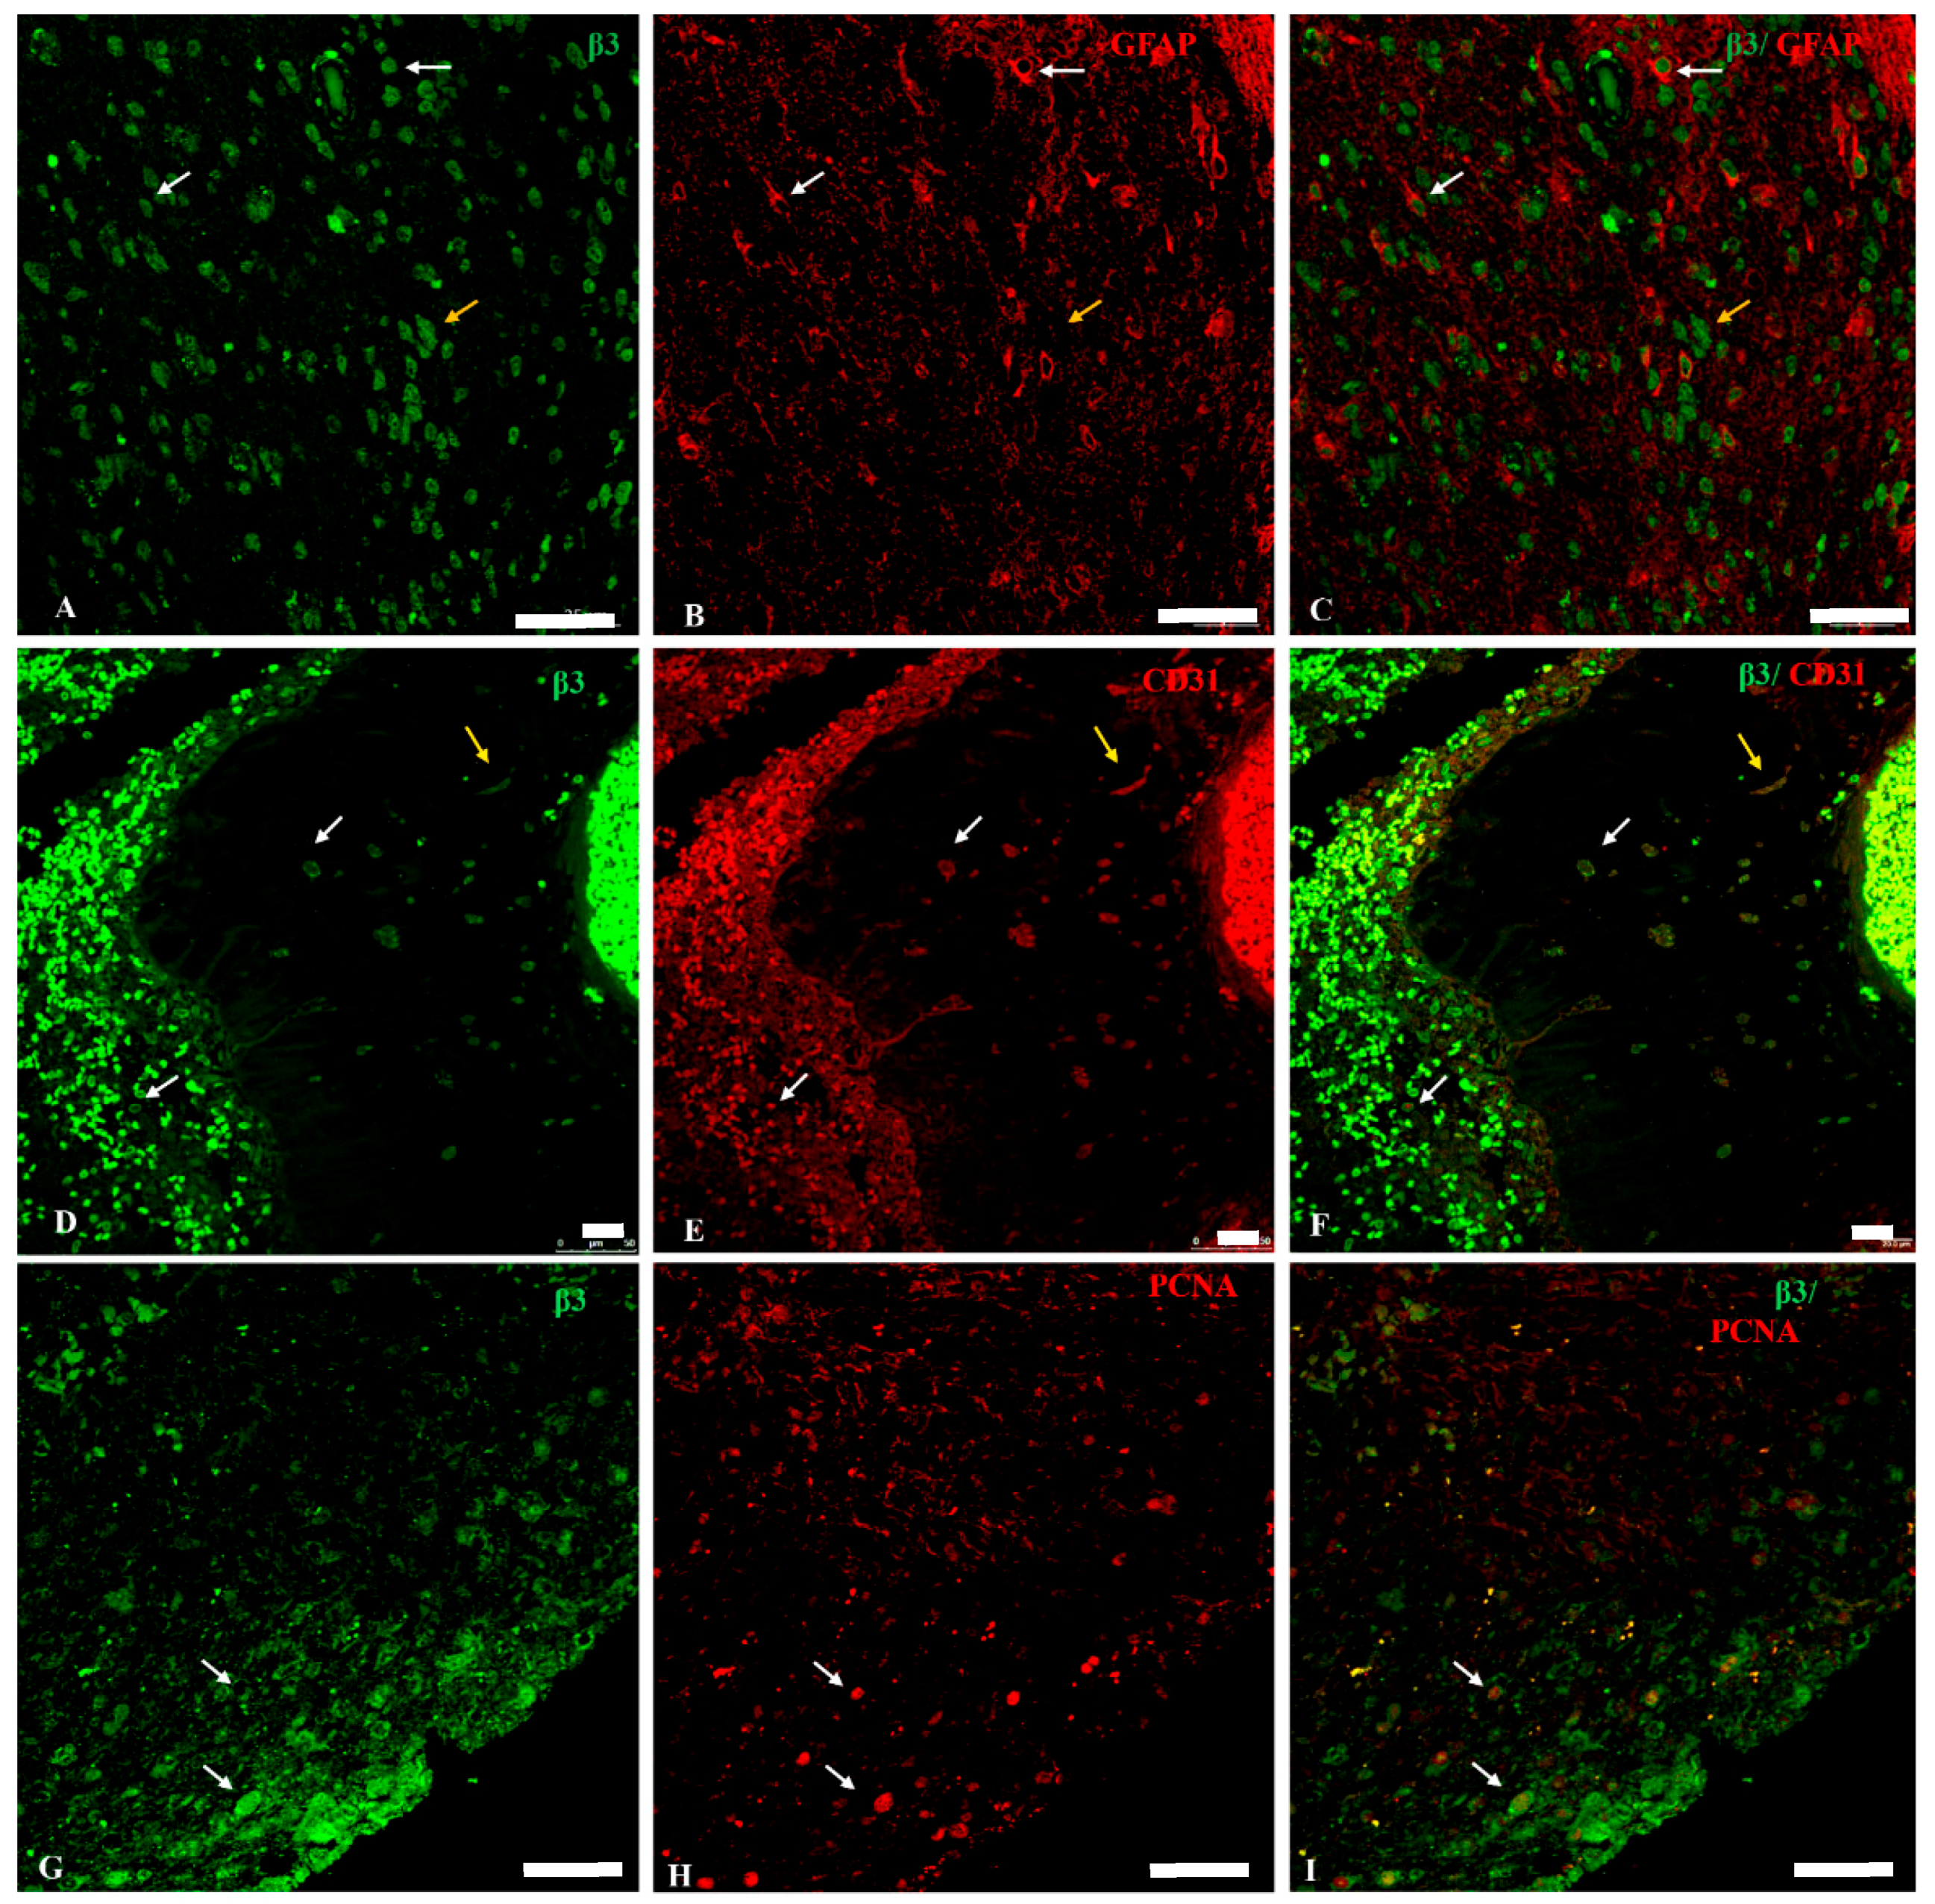
2.3. Na, K-ATPase β3 Isoform Expression in GBM
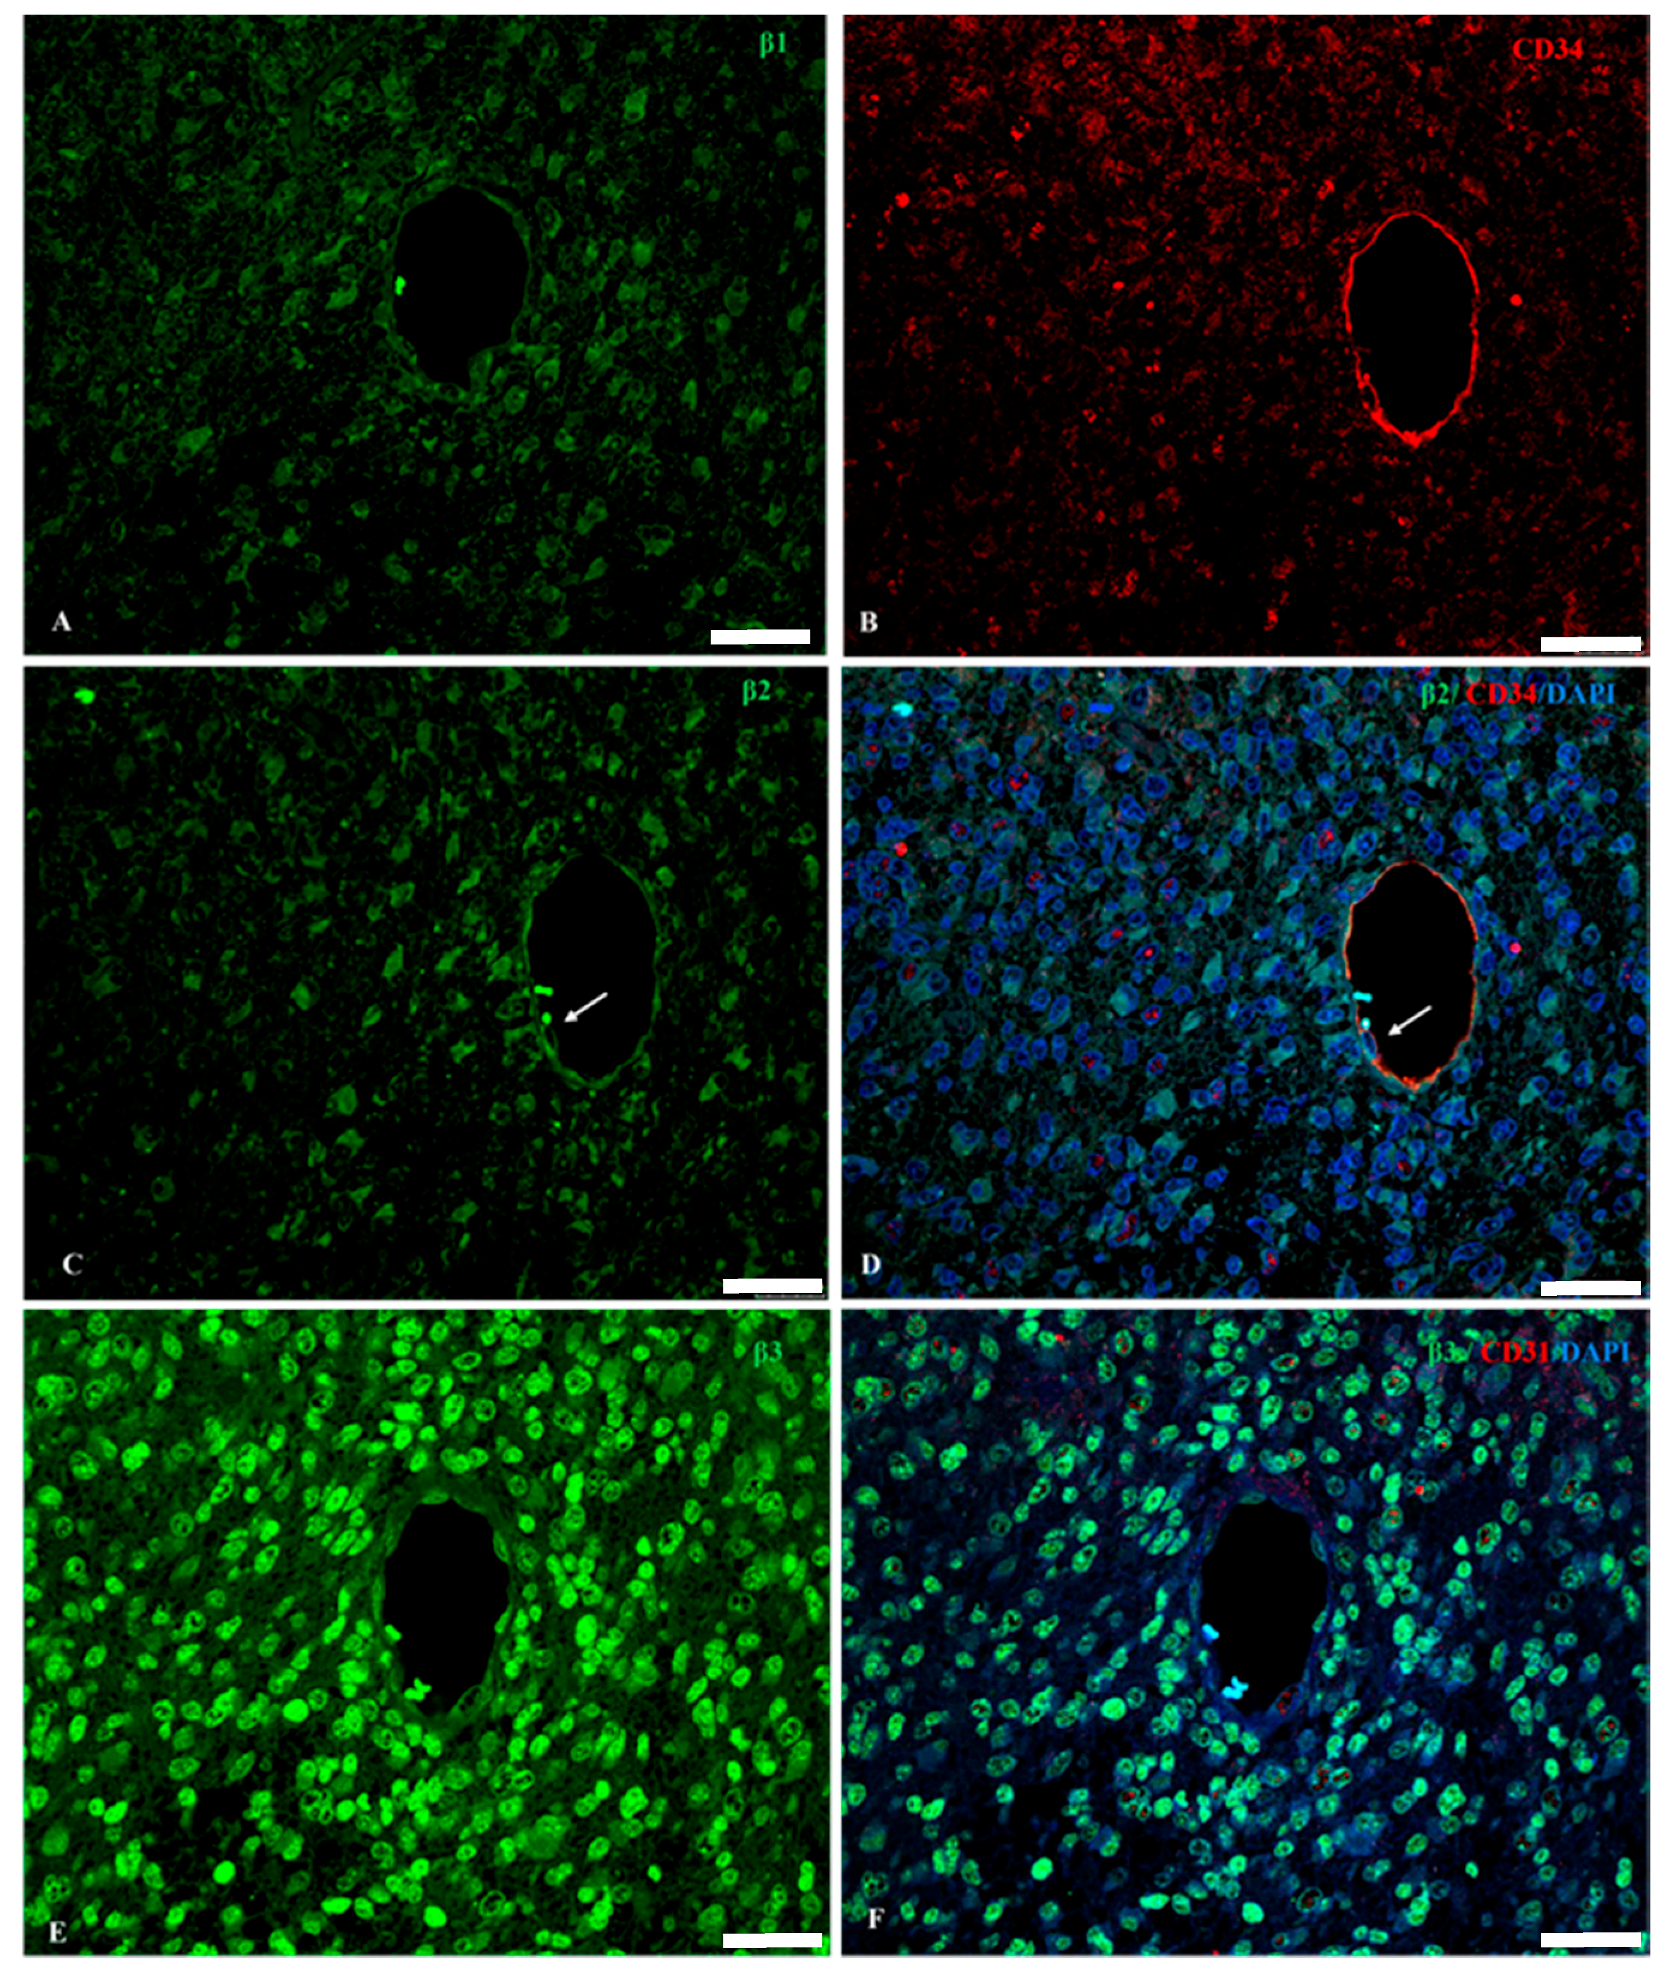
2.4. Na, K-ATPase β-Isoforms Expression in Blood Vessel Cells and Perivascular Niche of GBM
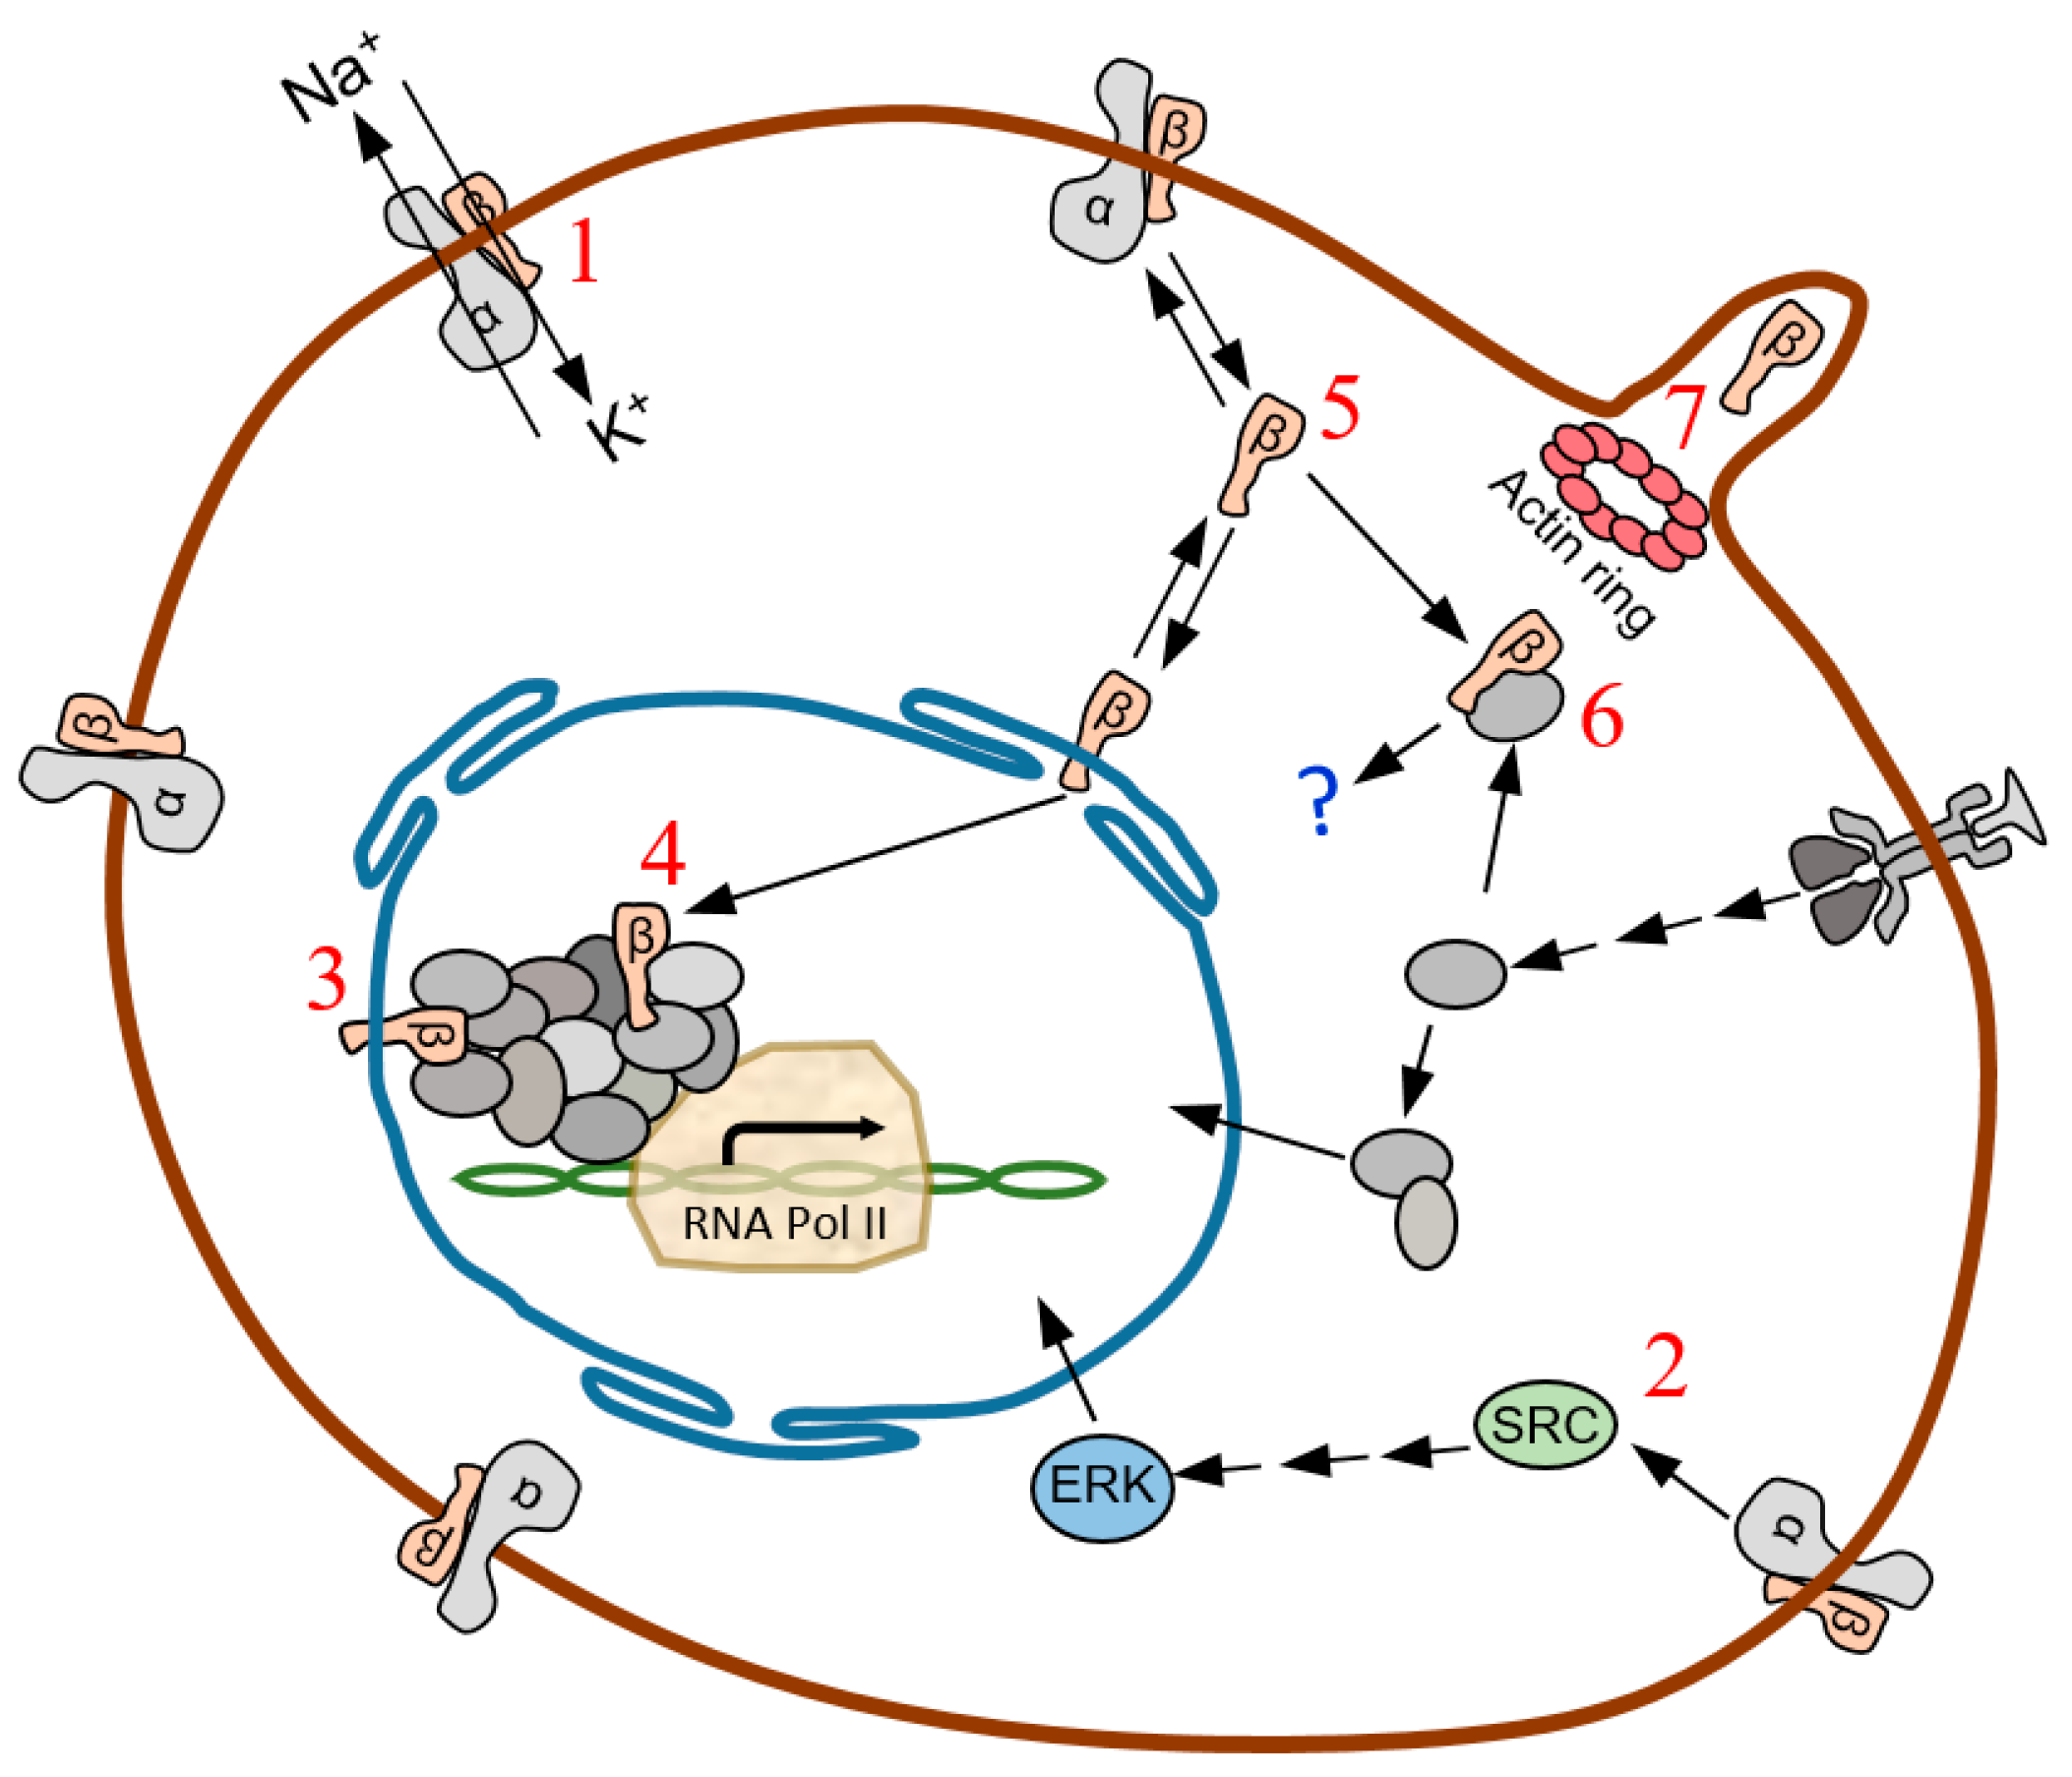
3. Discussion
4. Materials and Methods
4.1. Patients and Tumor Tissue
4.2. Antibodies
4.3. Image Analysis and Statistical Analysis
4.4. Immunohistochemistry
4.5. Double Immunofluorescence Simultaneous Staining
5. Conclusions
Acknowledgments
Author Contributions
Conflicts of Interest
Abbreviations
| ECM | Extracellular matrix |
| EMT | Epithelial-mesenchymal transition |
| FITC | Fluorescein isothiocyanate |
| DAPI | Diamond Anti-fade Mountant |
| GBM | Glioblastoma multiforme |
| GIMs | Glioma-infiltrating myeloid cells |
| Iba1 | Ionized calcium binding adaptor molecule 1 |
| IQGAP1 | IQ motif containing GTPase-activating protein |
| MAP2 | Microtubule-associated protein 2 |
| PCNA | Proliferating cell nuclear antigen |
| TAMs | Tumor associated macrophages |
| TRITC | Tetramethylrhodamine B isothiocyanate |
References
- Lacroix, M.; Abi-Said, D.; Fourney, D.R.; Gokaslan, Z.L.; Shi, W.; DeMonte, F.; Lang, F.F.; McCutcheon, I.E.; Hassenbusch, S.J.; Holland, E.; et al. A multivariate analysis of 416 patients with glioblastoma multiforme: Prognosis, extent of resection, and survival. J. Neurosurg. 2001, 95, 190–198. [Google Scholar] [CrossRef] [PubMed]
- Riemenschneider, M.J.; Reifenberger, G. Molecular neuropathology of gliomas. Int. J. Mol. Sci. 2009, 10, 184–212. [Google Scholar] [CrossRef] [PubMed]
- Stupp, R.; Mason, W.P.; van den Bent, M.J.; Weller, M.; Fisher, B.; Taphoorn, M.J.; Belanger, K.; Brandes, A.A.; Marosi, C.; Bogdahn, U.; et al. Radiotherapy plus concomitant and adjuvant temozolomide for glioblastoma. N. Engl. J. Med. 2005, 352, 987–996. [Google Scholar] [CrossRef] [PubMed]
- Weller, M.; Cloughesy, T.; Perry, J.R.; Wick, W. Standards of care for treatment of recurrent glioblastoma—Are we there yet? Neuro Oncol. 2013, 15, 4–27. [Google Scholar] [CrossRef] [PubMed]
- Sturm, D.; Bender, S.; Jones, D.T.; Lichter, P.; Grill, J.; Becher, O.; Hawkins, C.; Majewski, J.; Jones, C.; Costello, J.F.; et al. Paediatric and adult glioblastoma: Multiform (epi)genomic culprits emerge. Nat. Rev. Cancer 2014, 14, 92–107. [Google Scholar] [CrossRef] [PubMed]
- Bleeker, F.E.; Molenaar, R.J.; Leenstra, S. Recent advances in the molecular understanding of glioblastoma. J. Neurooncol. 2012, 108, 11–27. [Google Scholar] [CrossRef] [PubMed]
- Ohgaki, H.; Kleihues, P. Genetic pathways to primary and secondary glioblastoma. Am. J. Pathol. 2007, 170, 1445–1453. [Google Scholar] [CrossRef] [PubMed]
- Diaz-Flores, L.; Gutierrez, R.; Madrid, J.F.; Varela, H.; Valladares, F.; Acosta, E.; Martin-Vasallo, P.; Diaz-Flores, L., Jr. Pericytes. Morphofunction, interactions and pathology in a quiescent and activated mesenchymal cell niche. Histol. Histopathol. 2009, 24, 909–969. [Google Scholar] [PubMed]
- Wesseling, P.; Schlingemann, R.O.; Rietveld, F.J.; Link, M.; Burger, P.C.; Ruiter, D.J. Early and extensive contribution of pericytes/vascular smooth muscle cells to microvascular proliferation in glioblastoma multiforme: An immuno-light and immuno-electron microscopic study. J. Neuropathol. Exp. Neurol. 1995, 54, 304–310. [Google Scholar] [CrossRef] [PubMed]
- Diaz-Flores, L.; Gutierrez, R.; Diaz-Flores, L., Jr.; Gomez, M.G.; Saez, F.J.; Madrid, J.F. Behaviour of telocytes during physiopathological activation. Semin. Cell Dev. Biol. 2016, 55, 50–61. [Google Scholar] [CrossRef] [PubMed]
- Diaz-Flores, L.; Gutierrez, R.; Saez, F.J.; Diaz-Flores, L., Jr.; Madrid, J.F. Telocytes in neuromuscular spindles. J. Cell Mol. Med. 2013, 17, 457–465. [Google Scholar] [CrossRef] [PubMed]
- Marusyk, A.; Almendro, V.; Polyak, K. Intra-tumour heterogeneity: A looking glass for cancer? Nat. Rev. Cancer 2012, 12, 323–334. [Google Scholar] [CrossRef] [PubMed]
- Ransom, C.B.; O’Neal, J.T.; Sontheimer, H. Volume-activated chloride currents contribute to the resting conductance and invasive migration of human glioma cells. J. Neurosci. 2001, 21, 7674–7683. [Google Scholar] [PubMed]
- Laws, E.R., Jr.; O’Connor, J.S. ATPase in human brain tumors. J. Neurosurg. 1970, 33, 167–171. [Google Scholar] [CrossRef] [PubMed]
- Skou, J.C. The influence of some cations on an adenosine triphosphatase from peripheral nerves. Biochim. Biophys. Acta 1957, 23, 394–401. [Google Scholar] [CrossRef]
- Mobasheri, A.; Avila, J.; Cozar-Castellano, I.; Brownleader, M.D.; Trevan, M.; Francis, M.J.; Lamb, J.F.; Martin-Vasallo, P. Na+, K+-ATPase isozyme diversity; comparative biochemistry and physiological implications of novel functional interactions. Biosci. Rep. 2000, 20, 51–91. [Google Scholar] [CrossRef] [PubMed]
- Aizman, O.; Uhlen, P.; Lal, M.; Brismar, H.; Aperia, A. Ouabain, a steroid hormone that signals with slow calcium oscillations. Proc. Natl. Acad. Sci. USA 2001, 98, 13420–13424. [Google Scholar] [CrossRef] [PubMed]
- Harwood, S.; Yaqoob, M.M. Ouabain-induced cell signaling. Front. Biosci. 2005, 10, 2011–2017. [Google Scholar] [CrossRef] [PubMed]
- Miyakawa-Naito, A.; Uhlen, P.; Lal, M.; Aizman, O.; Mikoshiba, K.; Brismar, H.; Zelenin, S.; Aperia, A. Cell signaling microdomain with Na, K-ATPase and inositol 1,4,5-trisphosphate receptor generates calcium oscillations. J. Biol. Chem. 2003, 278, 50355–50361. [Google Scholar] [CrossRef] [PubMed]
- Yuan, Z.; Cai, T.; Tian, J.; Ivanov, A.V.; Giovannucci, D.R.; Xie, Z. Na/K-ATPase tethers phospholipase C and IP3 receptor into a calcium-regulatory complex. Mol. Biol. Cell 2005, 16, 4034–4045. [Google Scholar] [CrossRef] [PubMed]
- Zhang, S.; Malmersjo, S.; Li, J.; Ando, H.; Aizman, O.; Uhlen, P.; Mikoshiba, K.; Aperia, A. Distinct role of the N-terminal tail of the Na, K-ATPase catalytic subunit as a signal transducer. J. Biol. Chem. 2006, 281, 21954–21962. [Google Scholar] [CrossRef] [PubMed]
- Abramowitz, J.; Dai, C.; Hirschi, K.K.; Dmitrieva, R.I.; Doris, P.A.; Liu, L.; Allen, J.C. Ouabain- and marinobufagenin-induced proliferation of human umbilical vein smooth muscle cells and a rat vascular smooth muscle cell line, A7r5. Circulation 2003, 108, 3048–3053. [Google Scholar] [CrossRef] [PubMed]
- Barwe, S.P.; Anilkumar, G.; Moon, S.Y.; Zheng, Y.; Whitelegge, J.P.; Rajasekaran, S.A.; Rajasekaran, A.K. Novel role for Na, K-ATPase in phosphatidylinositol 3-kinase signaling and suppression of cell motility. Mol. Biol. Cell 2005, 16, 1082–1094. [Google Scholar] [CrossRef] [PubMed]
- Wang, X.Q.; Yu, S.P. Novel regulation of Na, K-ATPase by Src tyrosine kinases in cortical neurons. J. Neurochem. 2005, 93, 1515–1523. [Google Scholar] [CrossRef] [PubMed]
- Venugopal, J.; Blanco, G. On the Many Actions of Ouabain: Pro-Cystogenic Effects in Autosomal Dominant Polycystic Kidney Disease. Molecules 2017, 22, 729. [Google Scholar] [CrossRef]
- Mercer, R.W.; Biemesderfer, D.; Bliss, D.P., Jr.; Collins, J.H.; Forbush, B., III. Molecular cloning and immunological characterization of the γ polypeptide, a small protein associated with the Na, K-ATPase. J. Cell Biol. 1993, 121, 579–586. [Google Scholar] [CrossRef] [PubMed]
- Blanco, G. Na, K-ATPase subunit heterogeneity as a mechanism for tissue-specific ion regulation. Semin. Nephrol. 2005, 25, 292–303. [Google Scholar] [CrossRef] [PubMed]
- Crambert, G.; Geering, K. FXYD proteins: New tissue-specific regulators of the ubiquitous Na, K-ATPase. Sci. STKE 2003, 2003, RE1. [Google Scholar] [CrossRef] [PubMed]
- Clausen, M.V.; Hilbers, F.; Poulsen, H. The Structure and Function of the Na, K-ATPase Isoforms in Health and Disease. Front. Physiol. 2017, 8, 371. [Google Scholar] [CrossRef] [PubMed]
- Gloor, S.; Antonicek, H.; Sweadner, K.J.; Pagliusi, S.; Frank, R.; Moos, M.; Schachner, M. The adhesion molecule on glia (AMOG) is a homologue of the β subunit of the Na, K-ATPase. J. Cell Biol. 1990, 110, 165–174. [Google Scholar] [CrossRef] [PubMed]
- Lefranc, F.; Mijatovic, T.; Kiss, R. The sodium pump could constitute a new target to combat glioblastomas. Bull. Cancer 2008, 95, 271–281. [Google Scholar] [CrossRef] [PubMed]
- Lefranc, F.; Mijatovic, T.; Kondo, Y.; Sauvage, S.; Roland, I.; Debeir, O.; Krstic, D.; Vasic, V.; Gailly, P.; Kondo, S.; et al. Targeting the α1 subunit of the sodium pump to combat glioblastoma cells. Neurosurgery 2008, 62, 211–221. [Google Scholar] [CrossRef] [PubMed]
- Lefranc, F.; Kiss, R. The sodium pump α1 subunit as a potential target to combat apoptosis-resistant glioblastomas. Neoplasia 2008, 10, 198–206. [Google Scholar] [CrossRef] [PubMed]
- Garcia, D.G.; Amorim, L.M.; de Castro Faria, M.V.; Freire, A.S.; Santelli, R.E.; da Fonseca, C.O.; Quirico-Santos, T.; Burth, P. The anticancer drug perillyl alcohol is a Na/K-ATPase inhibitor. Mol. Cell Biochem. 2010, 345, 29–34. [Google Scholar] [CrossRef] [PubMed]
- Martin-Vasallo, P.; Dackowski, W.; Emanuel, J.R.; Levenson, R. Identification of a putative isoform of the Na, K-ATPase β subunit. Primary structure and tissue-specific expression. J. Biol. Chem. 1989, 264, 4613–4618. [Google Scholar] [PubMed]
- Lavoie, L.; Levenson, R.; Martin-Vasallo, P.; Klip, A. The molar ratios of α and β subunits of the Na+-K+-ATPase differ in distinct subcellular membranes from rat skeletal muscle. Biochemistry 1997, 36, 7726–7732. [Google Scholar] [CrossRef] [PubMed]
- Peng, L.; Martin-Vasallo, P.; Sweadner, K.J. Isoforms of Na, K-ATPase α and β subunits in the rat cerebellum and in granule cell cultures. J. Neurosci. 1997, 17, 3488–3502. [Google Scholar] [PubMed]
- Arystarkhova, E.; Sweadner, K.J. Tissue-specific expression of the Na, K-ATPase β3 subunit. The presence of β3 in lung and liver addresses the problem of the missing subunit. J. Biol. Chem. 1997, 272, 22405–22408. [Google Scholar] [CrossRef] [PubMed]
- Malik, N.; Canfield, V.A.; Beckers, M.C.; Gros, P.; Levenson, R. Identification of the mammalian Na, K-ATPase 3 subunit. J. Biol. Chem. 1996, 271, 22754–22758. [Google Scholar] [CrossRef] [PubMed]
- Martin-Vasallo, P.; Wetzel, R.K.; Garcia-Segura, L.M.; Molina-Holgado, E.; Arystarkhova, E.; Sweadner, K.J. Oligodendrocytes in brain and optic nerve express the β3 subunit isoform of Na, K-ATPase. Glia 2000, 31, 206–218. [Google Scholar] [CrossRef]
- Zahler, R.; Gilmore-Hebert, M.; Sun, W.; Benz, E.J. Na, K-ATPase isoform gene expression in normal and hypertrophied dog heart. Basic Res. Cardiol. 1996, 91, 256–266. [Google Scholar] [CrossRef] [PubMed]
- McGrail, K.M.; Phillips, J.M.; Sweadner, K.J. Immunofluorescent localization of three Na, K-ATPase isozymes in the rat central nervous system: Both neurons and glia can express more than one Na, K-ATPase. J. Neurosci. 1991, 11, 381–391. [Google Scholar] [PubMed]
- Brines, M.L.; Robbins, R.J. Cell-type specific expression of Na+, K(+)-ATPase catalytic subunits in cultured neurons and glia: Evidence for polarized distribution in neurons. Brain Res. 1993, 631, 1–11. [Google Scholar] [CrossRef]
- Cameron, R.; Klein, L.; Shyjan, A.W.; Rakic, P.; Levenson, R. Neurons and astroglia express distinct subsets of Na, K-ATPase α and β subunits. Brain Res. Mol. Brain Res. 1994, 21, 333–343. [Google Scholar] [CrossRef]
- Fink, D.; Knapp, P.E.; Mata, M. Differential expression of Na, K-ATPase isoforms in oligodendrocytes and astrocytes. Dev. Neurosci. 1996, 18, 319–326. [Google Scholar] [CrossRef] [PubMed]
- Peng, L.; Arystarkhova, E.; Sweadner, K.J. Plasticity of Na, K-ATPase isoform expression in cultures of flat astrocytes: Species differences in gene expression. Glia 1998, 24, 257–271. [Google Scholar] [CrossRef]
- Corthesy-Theulaz, I.; Merillat, A.M.; Honegger, P.; Rossier, B.C. Differential regulation of Na-K-ATPase isoform gene expression by T3 during rat brain development. Am. J. Physiol 1991, 261, C124–C131. [Google Scholar] [PubMed]
- Liu, K.; Zhang, J.; Ren, J.J.; Wang, X.J.; Yang, H.L.; Lin, P. Interference of human Na/K-ATPase B1 subunit on proliferation and migration of gastric adenocarcinoma cell line SGC-7901. Ai Zheng 2009, 28, 225–231. [Google Scholar] [PubMed]
- Vagin, O.; Tokhtaeva, E.; Sachs, G. The role of the β1 subunit of the Na, K-ATPase and its glycosylation in cell-cell adhesion. J. Biol. Chem. 2006, 281, 39573–39587. [Google Scholar] [CrossRef] [PubMed]
- Vagin, O.; Dada, L.A.; Tokhtaeva, E.; Sachs, G. The Na-K-ATPase α(1)β(1) heterodimer as a cell adhesion molecule in epithelia. Am. J. Physiol. Cell Physiol. 2012, 302, C1271–C1281. [Google Scholar] [CrossRef] [PubMed]
- Rajasekaran, S.A.; Ball, W.J., Jr.; Bander, N.H.; Liu, H.; Pardee, J.D.; Rajasekaran, A.K. Reduced expression of β-subunit of Na, K-ATPase in human clear-cell renal cell carcinoma. J. Urol. 1999, 162, 574–580. [Google Scholar] [CrossRef]
- Rajasekaran, S.A.; Palmer, L.G.; Moon, S.Y.; Peralta, S.A.; Apodaca, G.L.; Harper, J.F.; Zheng, Y.; Rajasekaran, A.K. Na, K-ATPase activity is required for formation of tight junctions, desmosomes, and induction of polarity in epithelial cells. Mol. Biol. Cell 2001, 12, 3717–3732. [Google Scholar] [CrossRef] [PubMed]
- Rajasekaran, S.A.; Palmer, L.G.; Quan, K.; Harper, J.F.; Ball, W.J., Jr.; Bander, N.H.; Peralta, S.A.; Rajasekaran, A.K. Na, K-ATPase β-subunit is required for epithelial polarization, suppression of invasion, and cell motility. Mol. Biol. Cell 2001, 12, 279–295. [Google Scholar] [CrossRef] [PubMed]
- Rajasekaran, S.A.; Huynh, T.P.; Wolle, D.G.; Espineda, C.E.; Inge, L.J.; Skay, A.; Lassman, C.; Nicholas, S.B.; Harper, J.F.; Reeves, A.E.; et al. Na, K-ATPase subunits as markers for epithelial-mesenchymal transition in cancer and fibrosis. Mol. Cancer Ther. 2010, 9, 1515–1524. [Google Scholar] [CrossRef] [PubMed]
- Sun, M.Z.; Kim, J.M.; Oh, M.C.; Safaee, M.; Kaur, G.; Clark, A.J.; Bloch, O.; Ivan, M.E.; Kaur, R.; Oh, T.; et al. Na(+)/K(+)-ATPase β2-subunit (AMOG) expression abrogates invasion of glioblastoma-derived brain tumor-initiating cells. Neuro. Oncol. 2013, 15, 1518–1531. [Google Scholar] [CrossRef] [PubMed]
- Scheidenhelm, D.K.; Cresswell, J.; Haipek, C.A.; Fleming, T.P.; Mercer, R.W.; Gutmann, D.H. Akt-dependent cell size regulation by the adhesion molecule on glia occurs independently of phosphatidylinositol 3-kinase and Rheb signaling. Mol. Cell Biol. 2005, 25, 3151–3162. [Google Scholar] [CrossRef] [PubMed]
- Senner, V.; Schmidtpeter, S.; Braune, S.; Puttmann, S.; Thanos, S.; Bartsch, U.; Schachner, M.; Paulus, W. AMOG/β2 and glioma invasion: Does loss of AMOG make tumour cells run amok? Neuropathol. Appl. Neurobiol. 2003, 29, 370–377. [Google Scholar] [CrossRef] [PubMed]
- Ballanyi, K.; Grafe, P.; Ten, B.G. Ion activities and potassium uptake mechanisms of glial cells in guinea-pig olfactory cortex slices. J. Physiol. 1987, 382, 159–174. [Google Scholar] [CrossRef] [PubMed]
- D’Ambrosio, R.; Gordon, D.S.; Winn, H.R. Differential role of KIR channel and Na(+)/K(+)-pump in the regulation of extracellular K(+) in rat hippocampus. J. Neurophysiol. 2002, 87, 87–102. [Google Scholar] [CrossRef] [PubMed]
- Larsen, B.R.; Assentoft, M.; Cotrina, M.L.; Hua, S.Z.; Nedergaard, M.; Kaila, K.; Voipio, J.; MacAulay, N. Contributions of the Na(+)/K(+)-ATPase, NKCC1, and Kir4.1 to hippocampal K(+) clearance and volume responses. Glia 2014, 62, 608–622. [Google Scholar] [CrossRef] [PubMed]
- Larsen, B.R.; Stoica, A.; MacAulay, N. Managing Brain Extracellular K(+) during Neuronal Activity: The Physiological Role of the Na(+)/K(+)-ATPase Subunit Isoforms. Front. Physiol. 2016, 7, 141. [Google Scholar] [CrossRef] [PubMed]
- Bleau, A.M.; Agliano, A.; Larzabal, L.; de Aberasturi, A.L.; Calvo, A. Metastatic dormancy: A complex network between cancer stem cells and their microenvironment. Histol. Histopathol. 2014, 29, 1499–1510. [Google Scholar] [PubMed]
- Kubben, F.J.; Peeters-Haesevoets, A.; Engels, L.G.; Baeten, C.G.; Schutte, B.; Arends, J.W.; Stockbrugger, R.W.; Blijham, G.H. Proliferating cell nuclear antigen (PCNA): A new marker to study human colonic cell proliferation. Gut 1994, 35, 530–535. [Google Scholar] [CrossRef] [PubMed]
- Akopyanz, N.S.; Broude, N.E.; Bekman, E.P.; Marzen, E.O.; Sverdlov, E.D. Tissue-specific expression of Na, K-ATPase β-subunit. Does β2 expression correlate with tumorigenesis? FEBS Lett. 1991, 289, 8–10. [Google Scholar] [CrossRef]
- Espineda, C.E.; Chang, J.H.; Twiss, J.; Rajasekaran, S.A.; Rajasekaran, A.K. Repression of Na, K-ATPase β1-subunit by the transcription factor snail in carcinoma. Mol. Biol. Cell 2004, 15, 1364–1373. [Google Scholar] [CrossRef] [PubMed]
- Avila, J.; Lecuona, E.; Morales, M.; Soriano, A.; Alonso, T.; Martin-Vasallo, P. Opposite expression pattern of the human Na, K-ATPase β1 isoform in stomach and colon adenocarcinomas. Ann. N. Y. Acad. Sci. 1997, 834, 653–655. [Google Scholar] [CrossRef] [PubMed]
- Baker, B.M.; Rotoli, D.; Morales, M.; Maeso, M.C.; Garcia, M.P.; Avila, J.; Mobasheri, A.; Martin-Vasallo, P. Na, K-ATPase Isozymes in Colorectal Cancer and Liver Metastases. Front. Physiol. 2016, 7, 9. [Google Scholar] [CrossRef]
- Arteaga, M.F.; Gutierrez, R.; Avila, J.; Mobasheri, A.; Diaz-Flores, L.; Martin-Vasallo, P. Regeneration influences expression of the Na+, K+-atpase subunit isoforms in the rat peripheral nervous system. Neuroscience 2004, 129, 691–702. [Google Scholar] [CrossRef] [PubMed]
- Fields, S.; Song, O. A novel genetic system to detect protein-protein interactions. Nature 1989, 340, 245–246. [Google Scholar] [CrossRef] [PubMed]
- Chien, C.T.; Bartel, P.L.; Sternglanz, R.; Fields, S. The two-hybrid system: A method to identify and clone genes for proteins that interact with a protein of interest. Proc. Natl. Acad. Sci. USA 1991, 88, 9578–9582. [Google Scholar] [CrossRef] [PubMed]
- Avila, J.; Martín-Vasallo, P. Department of Biochemistry and Molecular Biology, University of La Laguna. La Laguna, Tenerife, Spain. Screening of a Matchmaker Two-Hybrid system brain library using β2/AMOG as a probe to find interacting factors. Unpublished work. 1995. [Google Scholar]
- Rotoli, D.; Perez-Rodriguez, N.D.; Morales, M.; Maeso, M.D.; Avila, J.; Mobasheri, A.; Martin-Vasallo, P. IQGAP1 in Podosomes/Invadosomes Is Involved in the Progression of Glioblastoma Multiforme Depending on the Tumor Status. Int. J. Mol. Sci. 2017, 18, 150. [Google Scholar] [CrossRef] [PubMed]
- Coniglio, S.J.; Segall, J.E. Review: Molecular mechanism of microglia stimulated glioblastoma invasion. Matrix Biol. 2013, 32, 372–380. [Google Scholar] [CrossRef] [PubMed]
- Gonzalez-Martinez, L.M.; Avila, J.; Marti, E.; Lecuona, E.; Martin-Vasallo, P. Expression of the β-subunit isoforms of the Na, K-ATPase in rat embryo tissues, inner ear and choroid plexus. Biol. Cell 1994, 81, 215–222. [Google Scholar] [CrossRef]


| Antibody | Specificity |
|---|---|
| SpETβ1 | Na, K-ATPase β1 subunit isoform |
| SpETβ2 | Na, K-ATPase β2 subunit isoform |
| RNTβ3 | Na, K-ATPase β3 subunit isoform |
| Anti-GFAP | Astrocytes |
| Anti-PCNA | Proliferative cells |
| Anti-CD31 | Endothelial cells/Monocyte derived macrophages |
| Anti-CD34 | Macrophages |
| Primary GBM | β1 | β2 | β3 |
| Astrocytes | −/+ c,n | ++ c,n,m | ++ n |
| Endothelial cells | −/+ c | ++ c,n | ++ n |
| Pericytes | ++ c,m | ++ c,n | ++ c,m |
| Telocytes | ? | +++ c,n | +++ c |
| TAMs | ++ m | ++ c,n | ++ c,m |
| Tumor cells | −/+ c,n,m | + c,n,m | +++ c,n |
| Secondary GBM | β1 | β2 | β3 |
| Astrocytes | − | −/+ c,n,m | +++ c,n,m |
| Endothelial cells | + c,m | ++ c,n | +++ n |
| Pericytes | +/++ c,m | ? | ++ c,m |
| Telocytes | − | +++ c,n | +++ c,n |
| TAMs | + c,n,m | ++ c,n | ++ c,m |
| Tumor cells | −/+ c,n | + c,m,n | +++ n |
© 2017 by the authors. Licensee MDPI, Basel, Switzerland. This article is an open access article distributed under the terms and conditions of the Creative Commons Attribution (CC BY) license (http://creativecommons.org/licenses/by/4.0/).
Share and Cite
Rotoli, D.; Cejas, M.-M.; Maeso, M.-d.-C.; Pérez-Rodríguez, N.-D.; Morales, M.; Ávila, J.; Mobasheri, A.; Martín-Vasallo, P. The Na, K-ATPase β-Subunit Isoforms Expression in Glioblastoma Multiforme: Moonlighting Roles. Int. J. Mol. Sci. 2017, 18, 2369. https://doi.org/10.3390/ijms18112369
Rotoli D, Cejas M-M, Maeso M-d-C, Pérez-Rodríguez N-D, Morales M, Ávila J, Mobasheri A, Martín-Vasallo P. The Na, K-ATPase β-Subunit Isoforms Expression in Glioblastoma Multiforme: Moonlighting Roles. International Journal of Molecular Sciences. 2017; 18(11):2369. https://doi.org/10.3390/ijms18112369
Chicago/Turabian StyleRotoli, Deborah, Mariana-Mayela Cejas, María-del-Carmen Maeso, Natalia-Dolores Pérez-Rodríguez, Manuel Morales, Julio Ávila, Ali Mobasheri, and Pablo Martín-Vasallo. 2017. "The Na, K-ATPase β-Subunit Isoforms Expression in Glioblastoma Multiforme: Moonlighting Roles" International Journal of Molecular Sciences 18, no. 11: 2369. https://doi.org/10.3390/ijms18112369
APA StyleRotoli, D., Cejas, M.-M., Maeso, M.-d.-C., Pérez-Rodríguez, N.-D., Morales, M., Ávila, J., Mobasheri, A., & Martín-Vasallo, P. (2017). The Na, K-ATPase β-Subunit Isoforms Expression in Glioblastoma Multiforme: Moonlighting Roles. International Journal of Molecular Sciences, 18(11), 2369. https://doi.org/10.3390/ijms18112369