
Preventive Effects of Rhodiola rosea L. on Bleomycin-Induced Pulmonary Fibrosis in Rats

Abstract
:
1. Introduction
2. Results
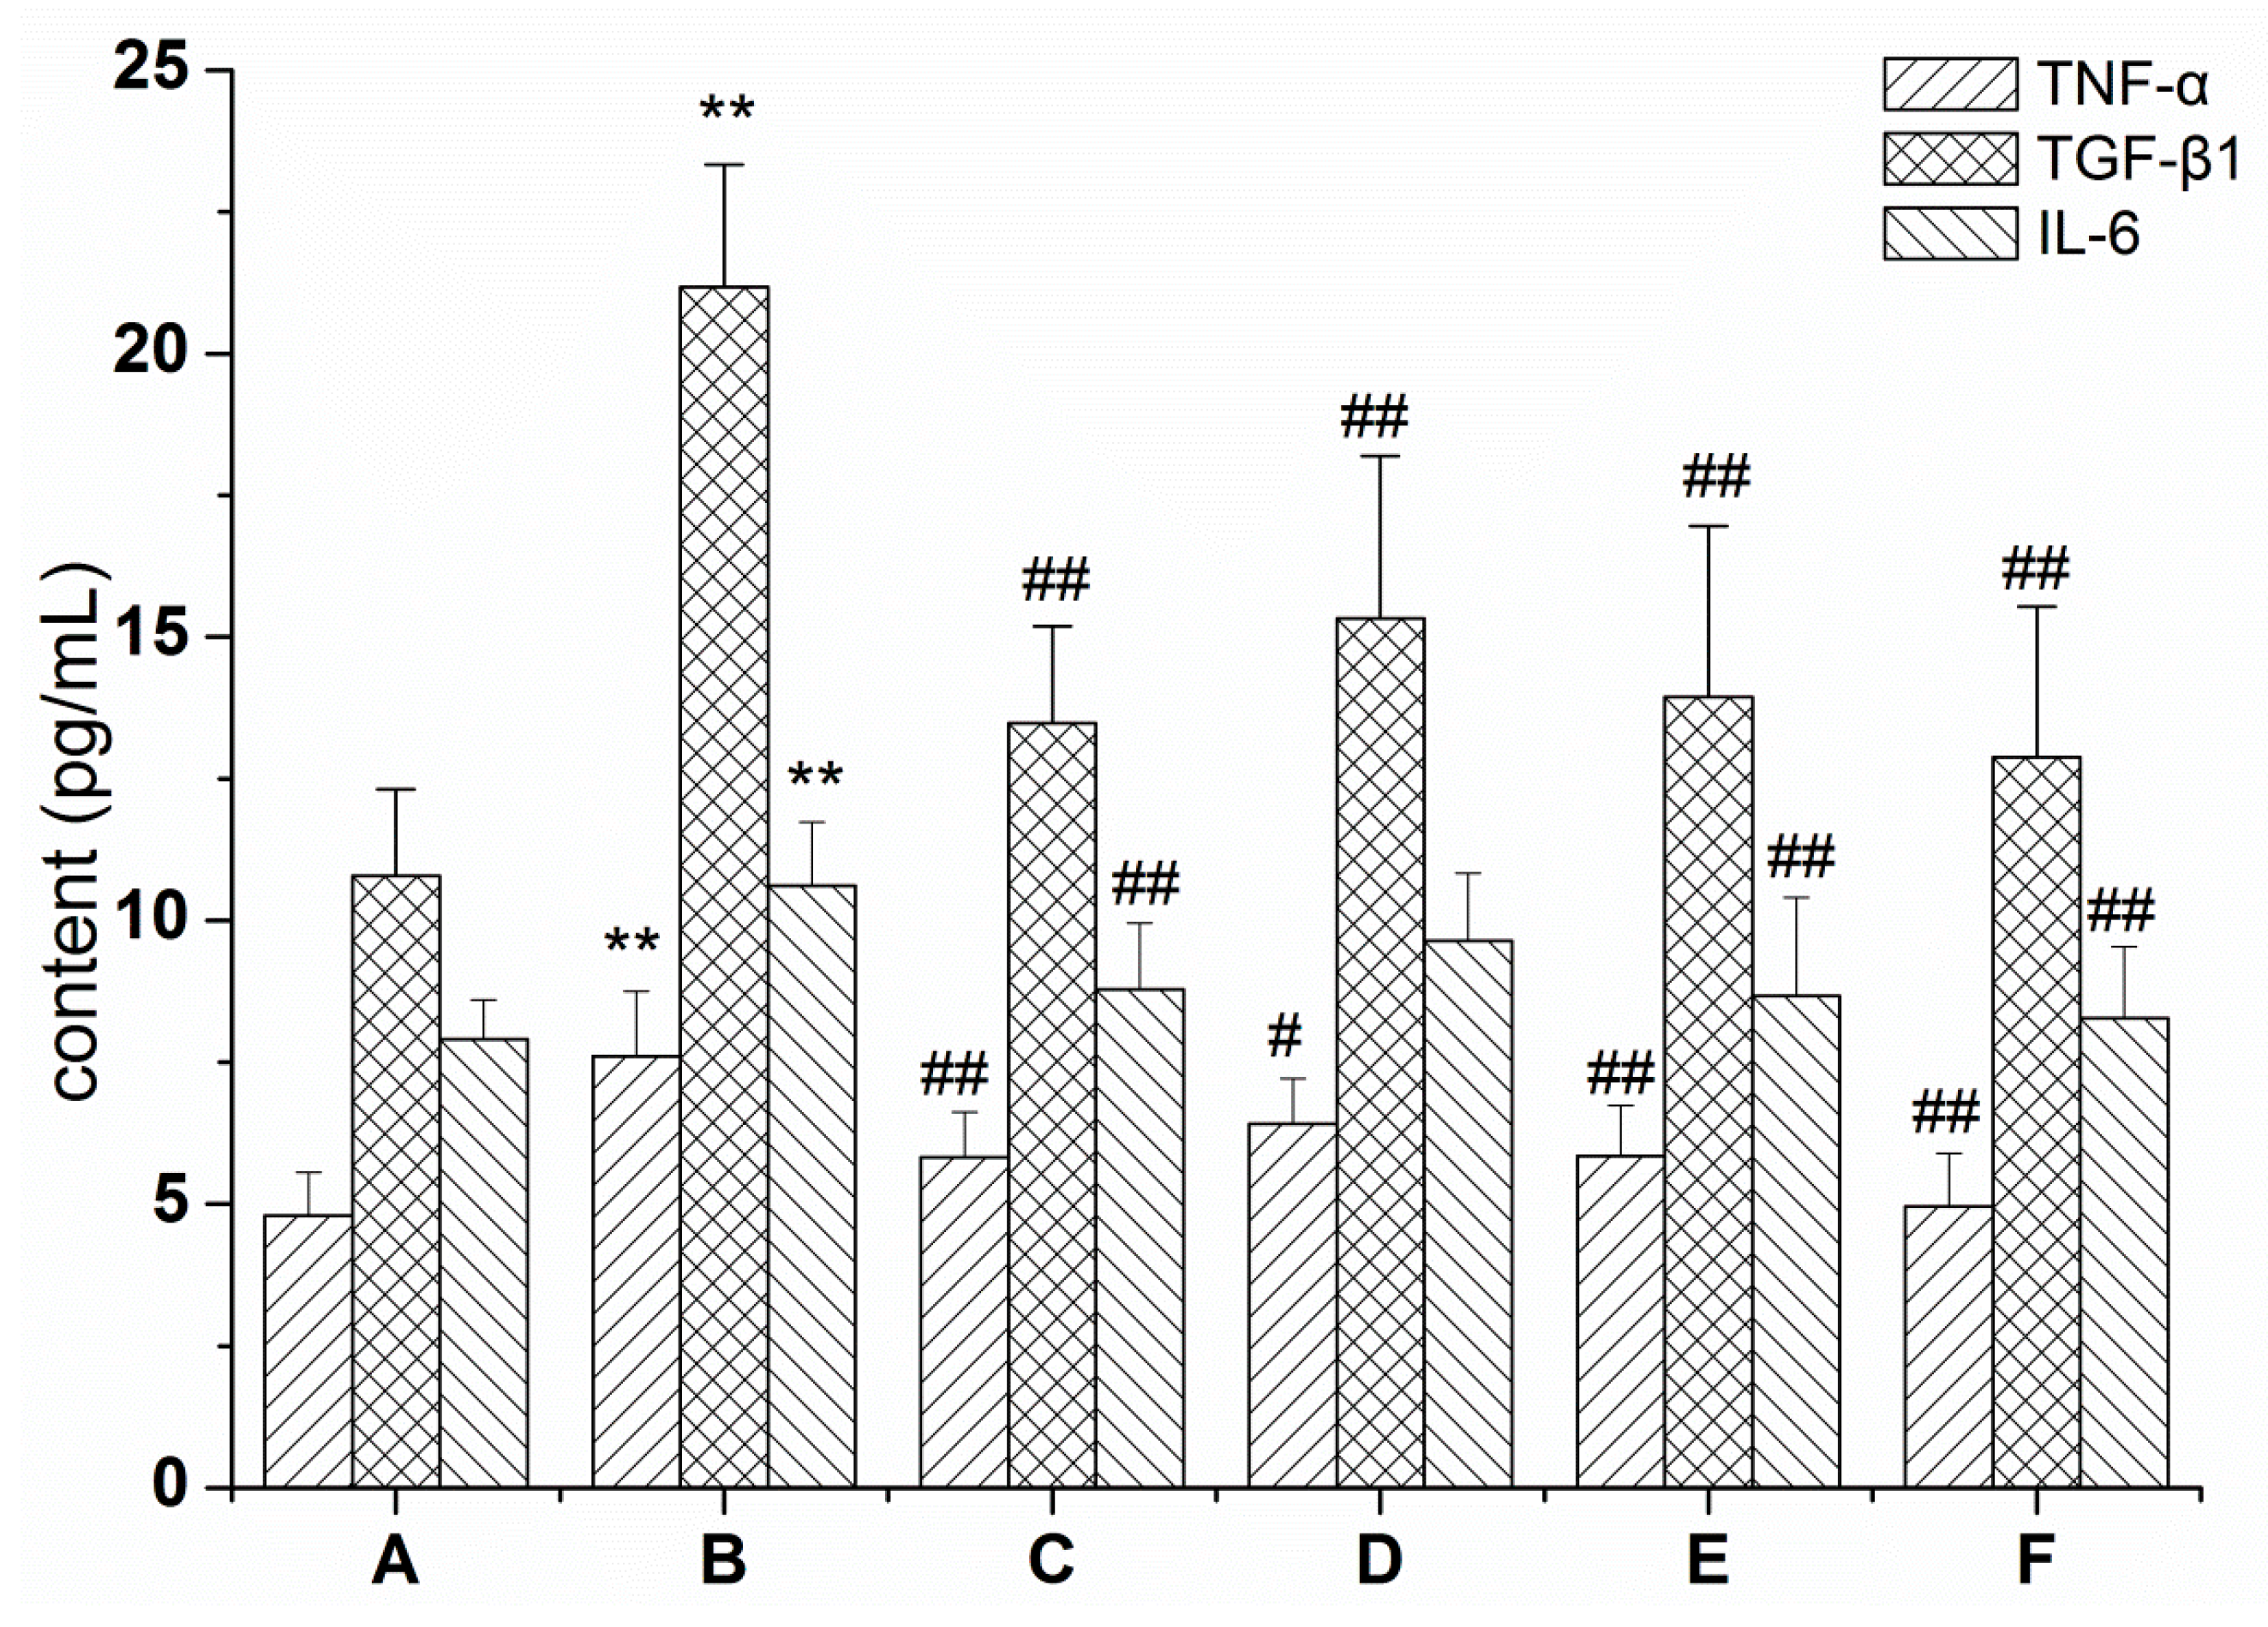
2.1. RRL Mitigates Inflammation in Rats with BLM-Induced Pulmonary Fibrosis
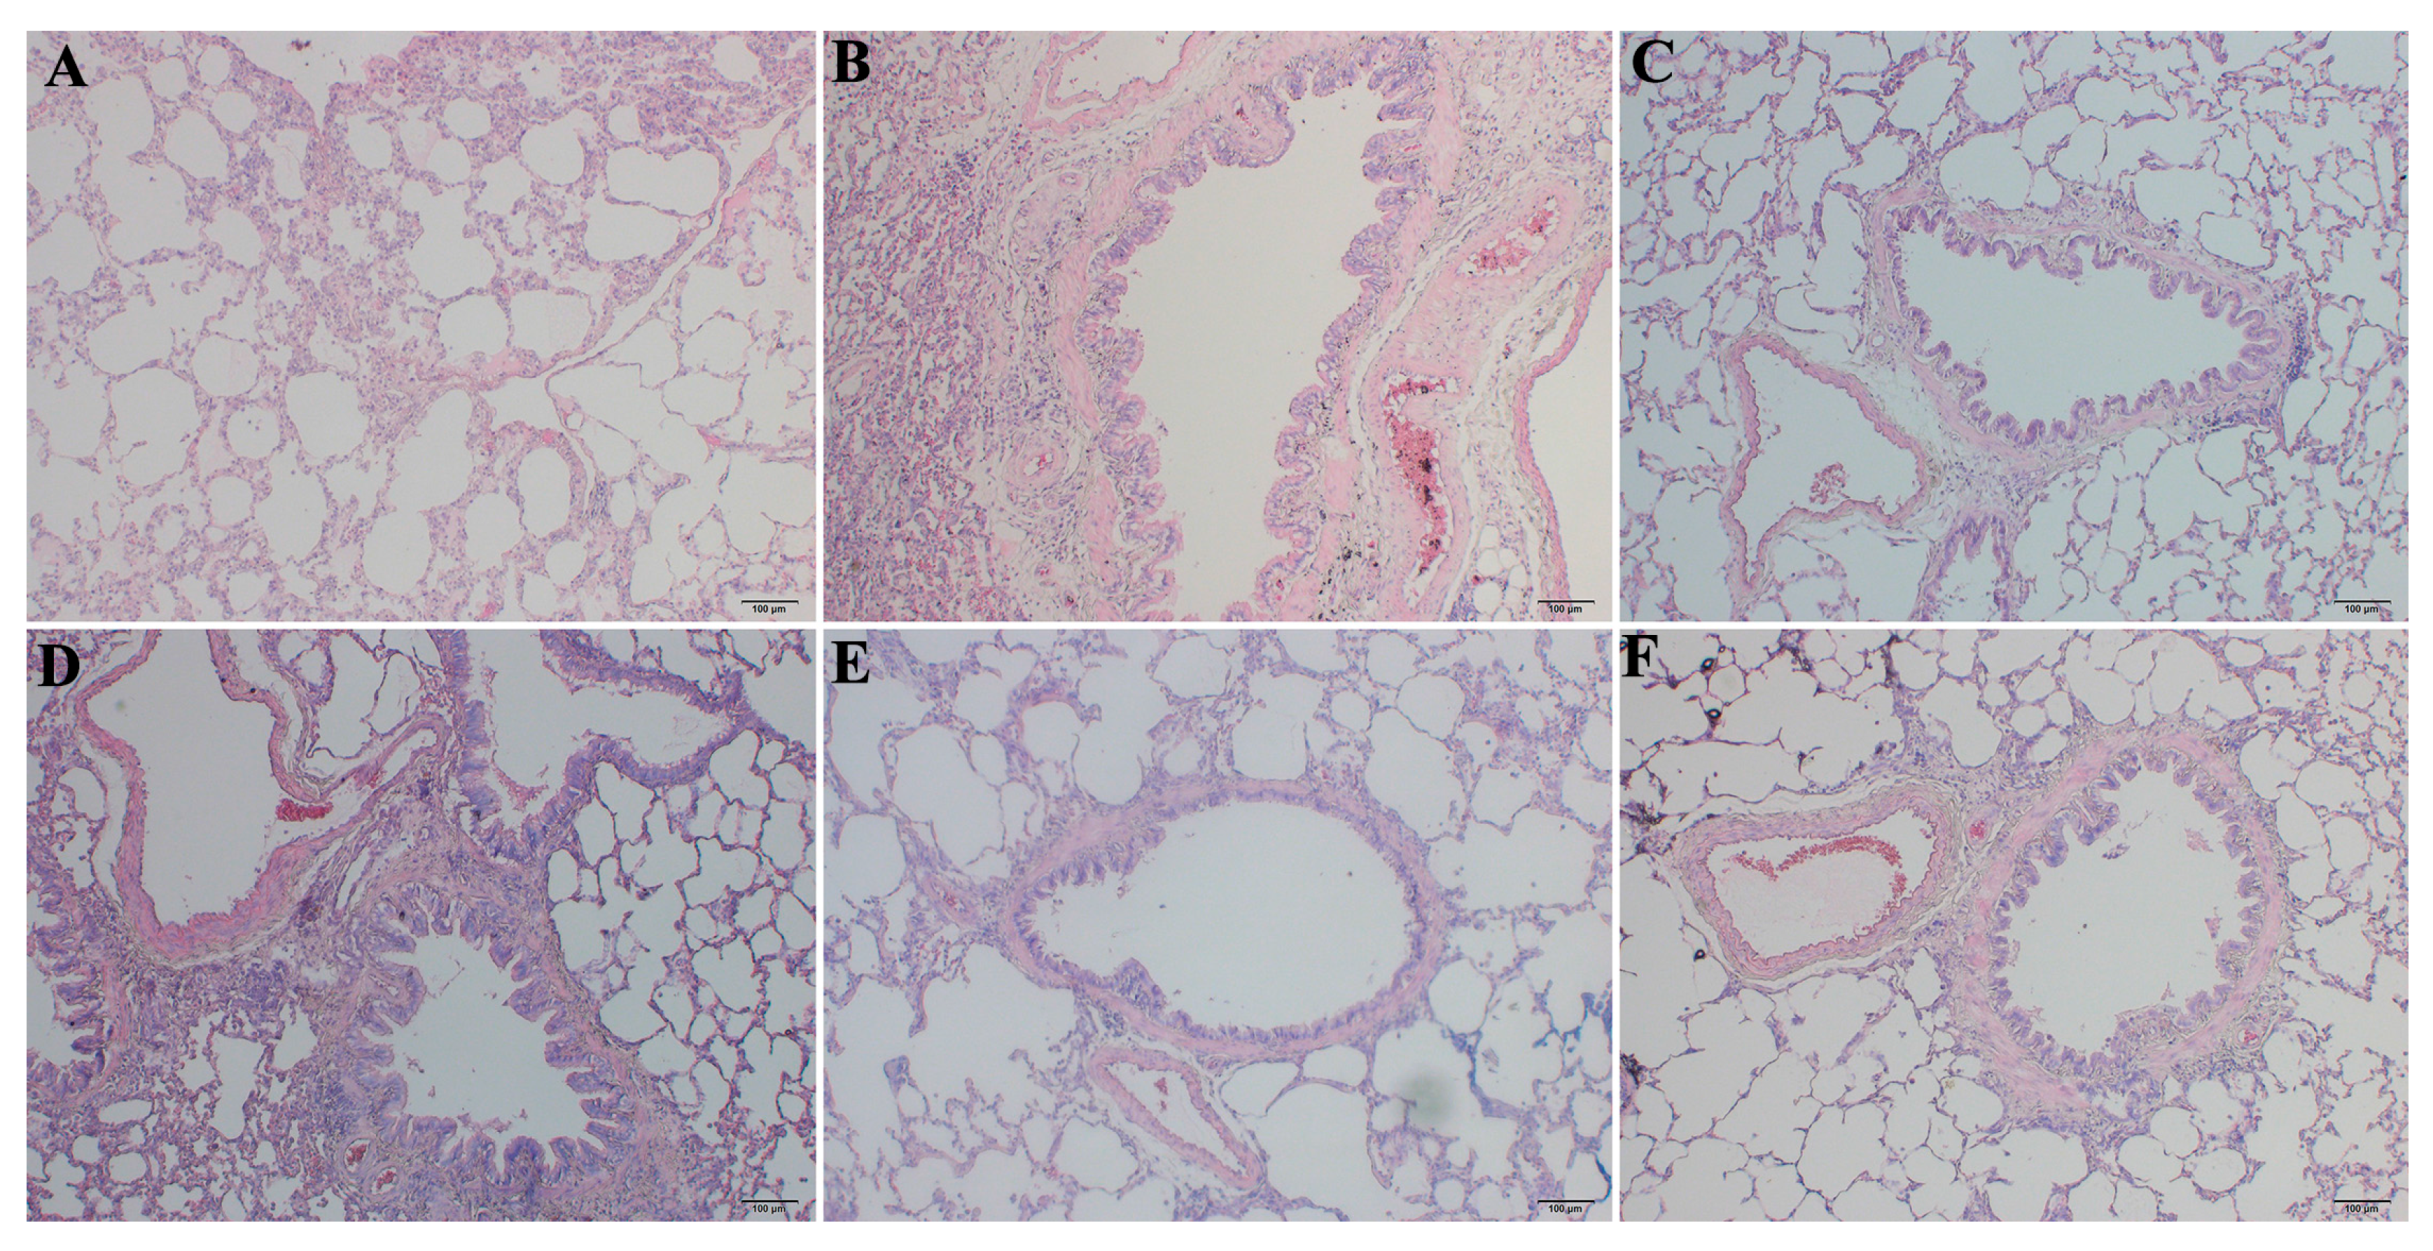
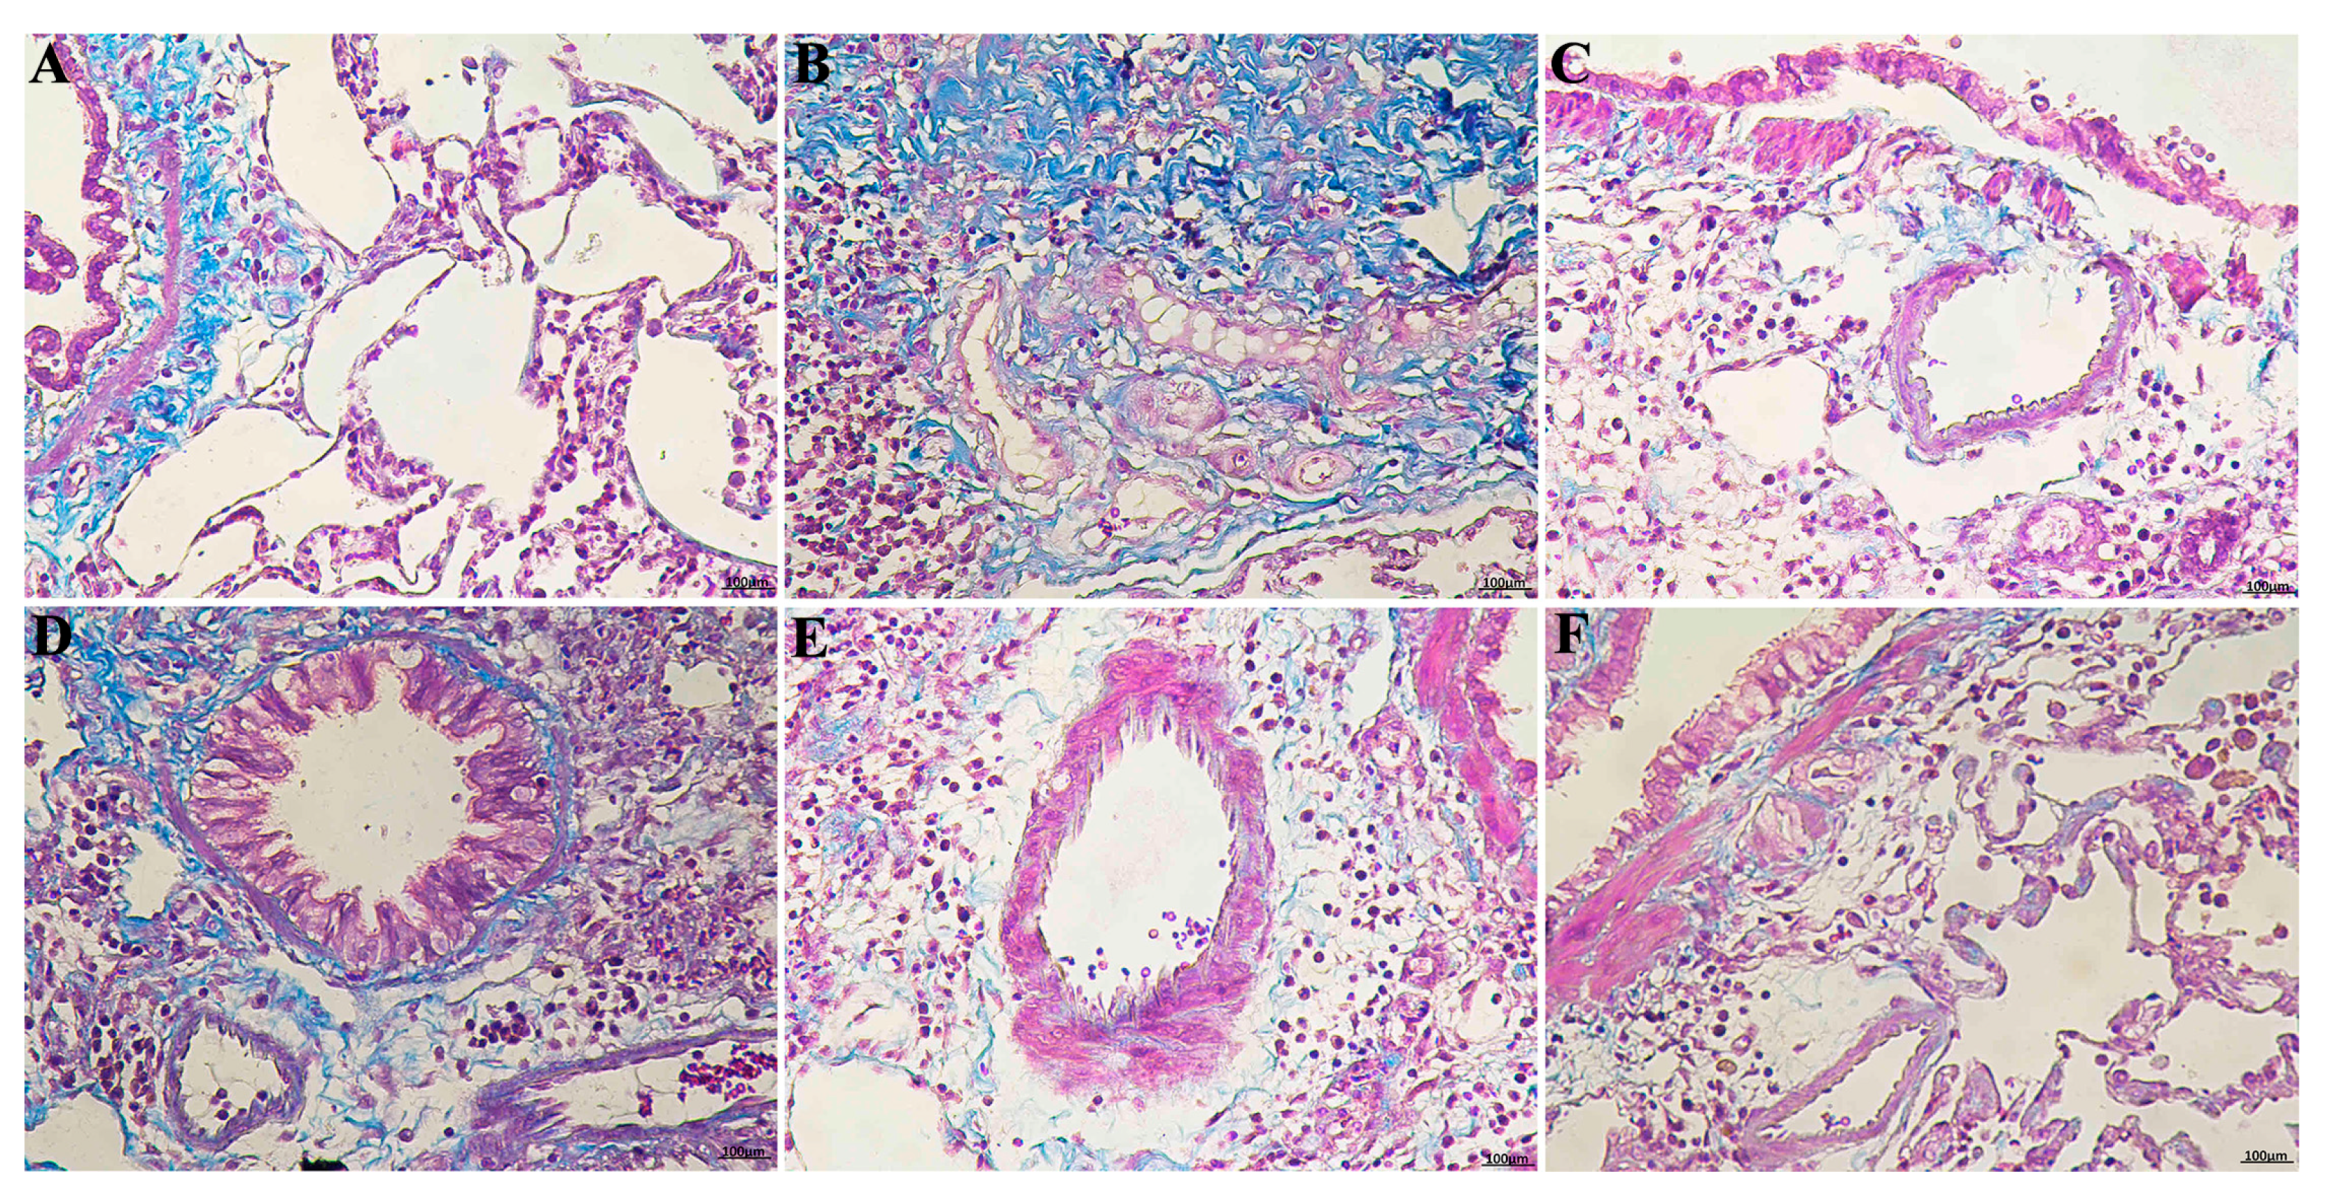
2.2. RRL Alleviates Pathological Changes
2.3. RRL Reduces the BLM-Induced Loss of Body Weight in Rats
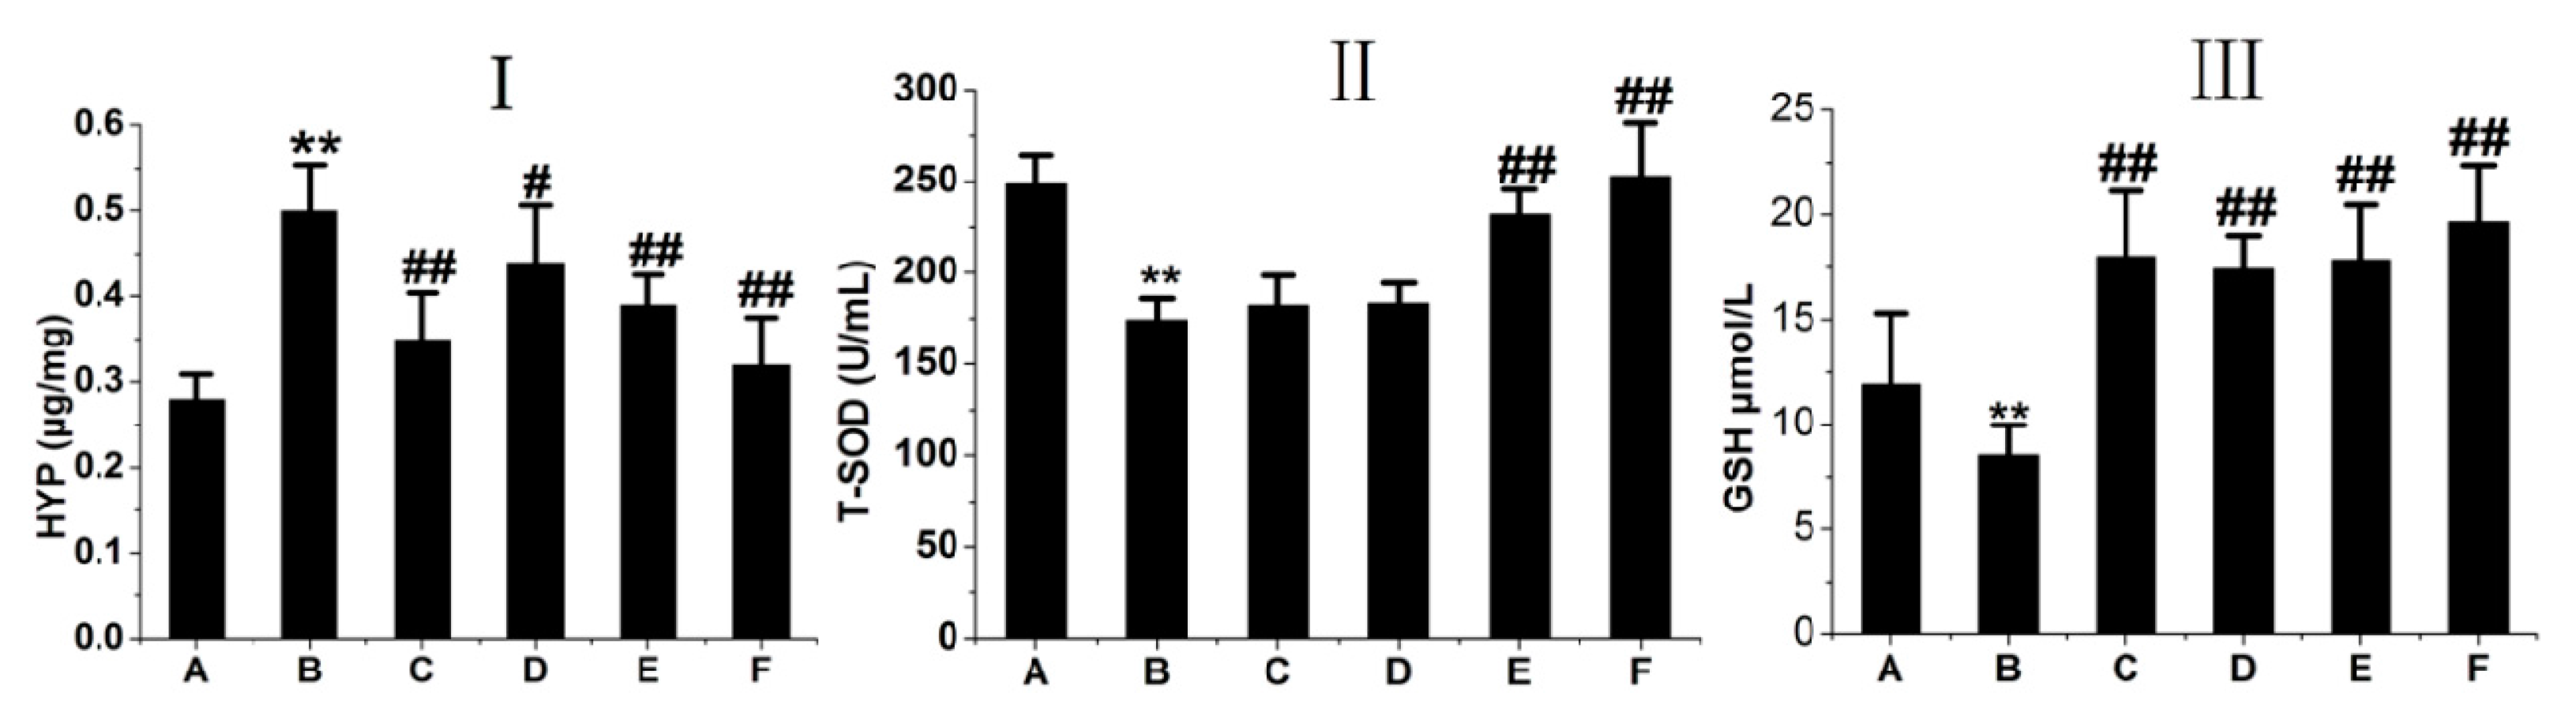
2.4. RRL Attenuates HYP Expression and Increases GSH and T-SOD Activities in BLM-Treated Rats
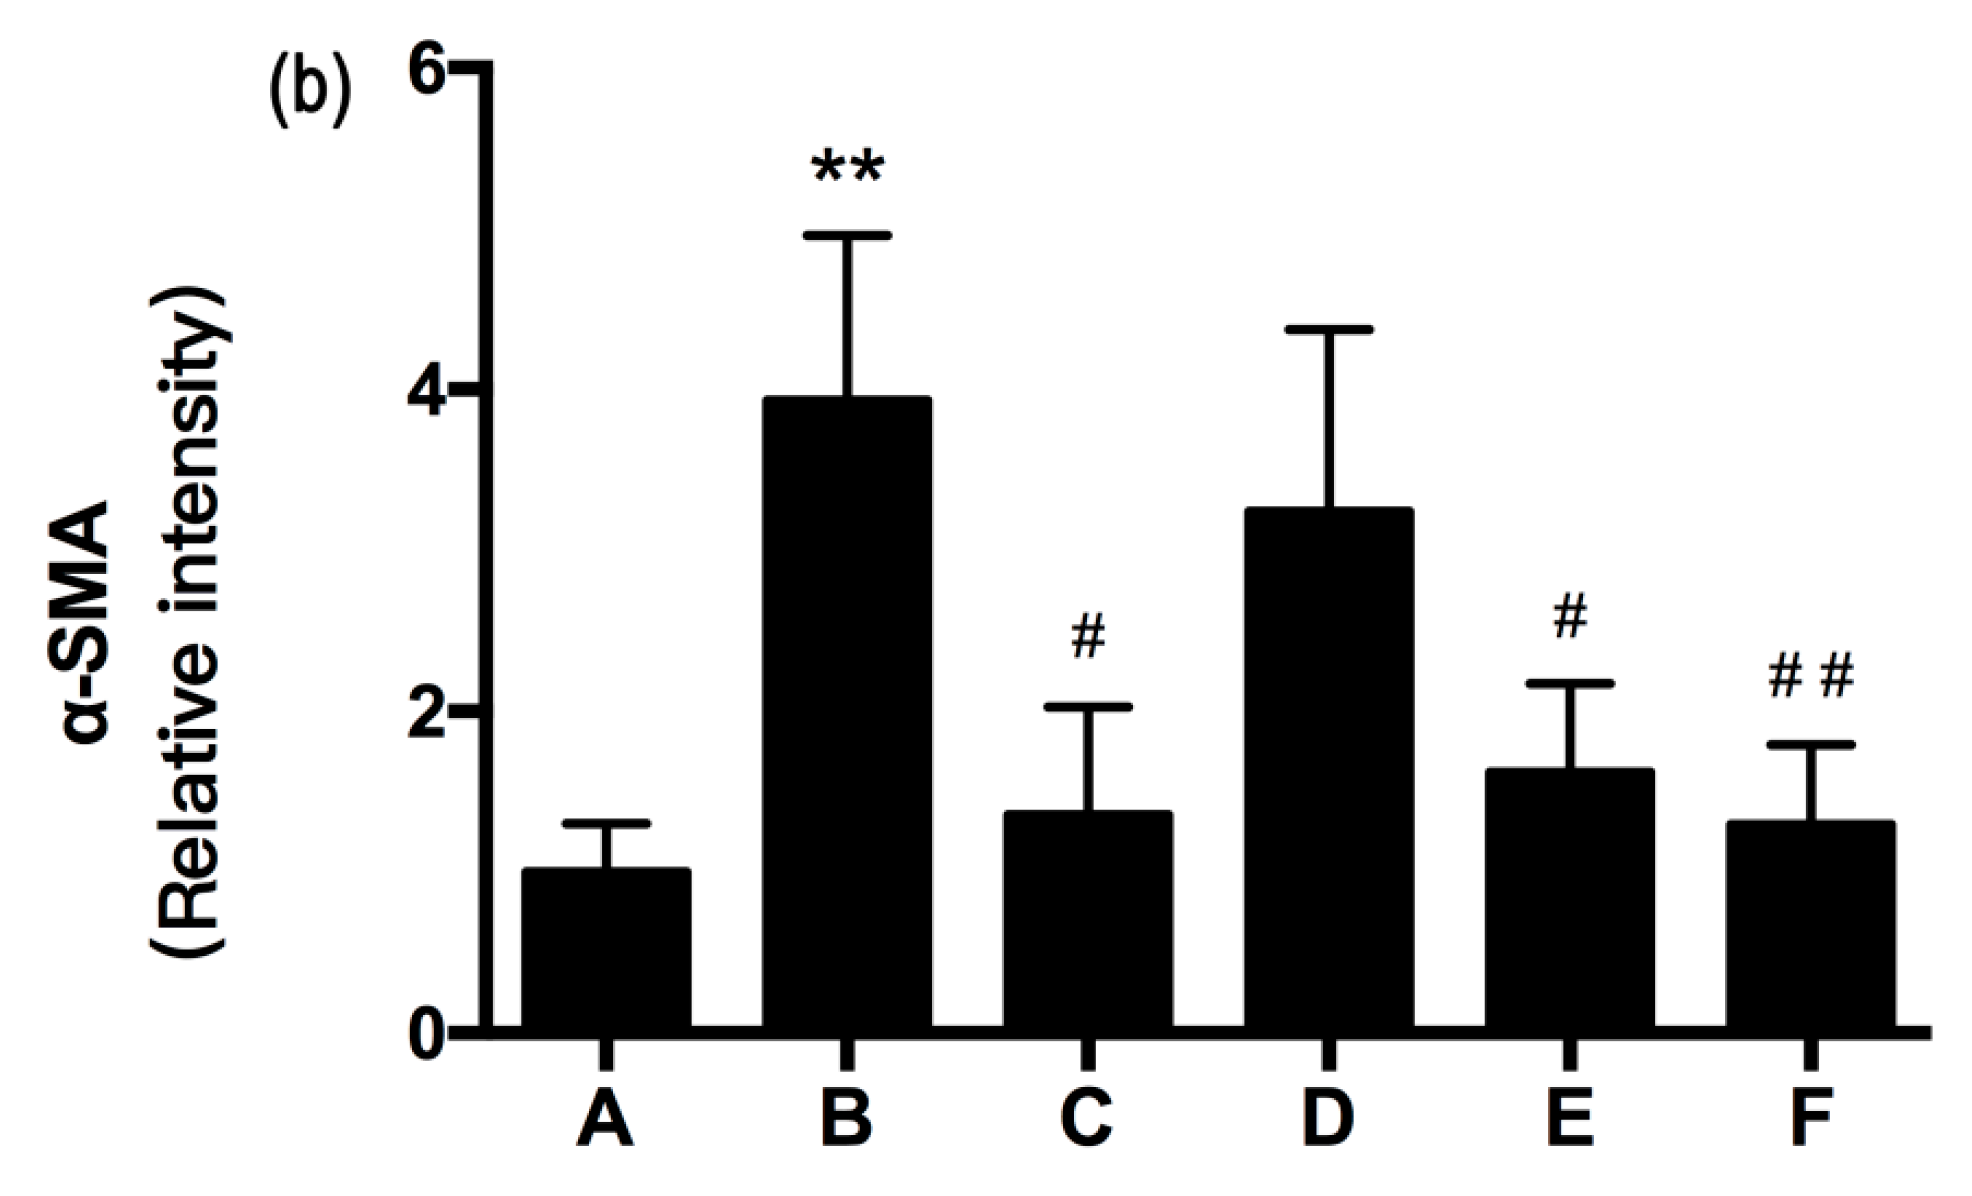
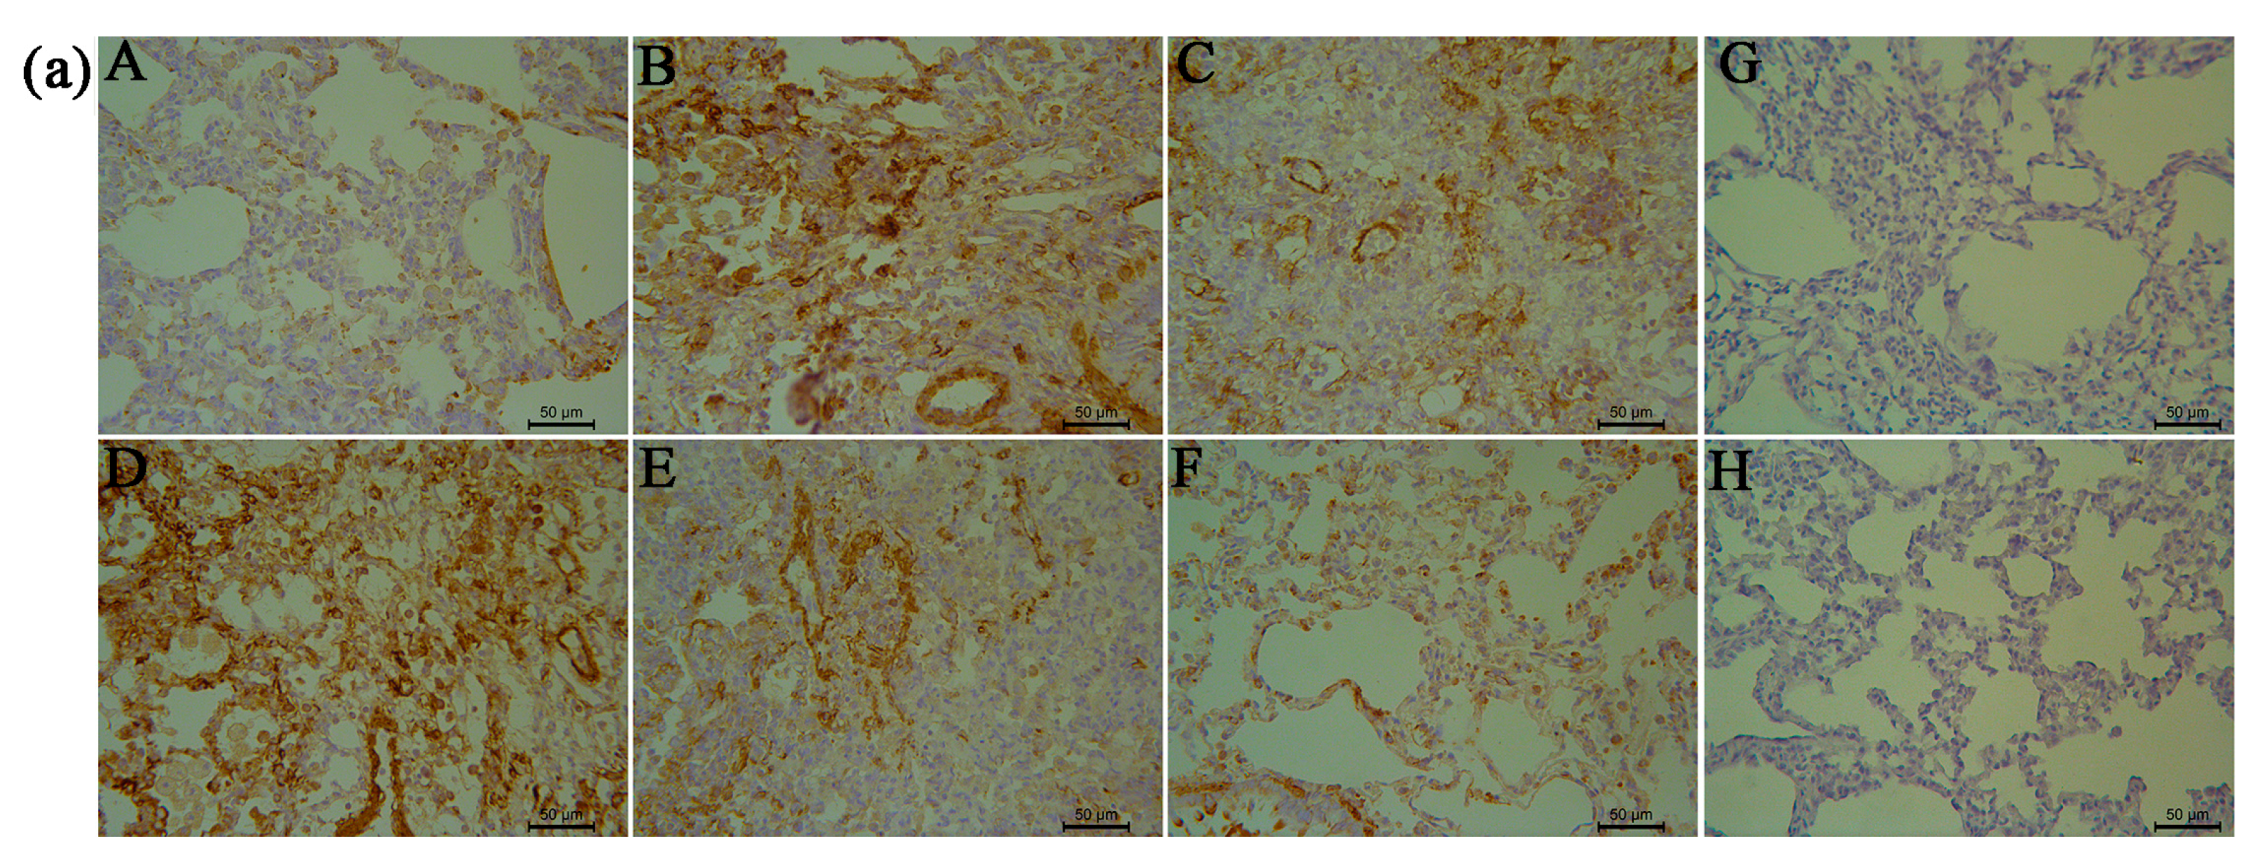
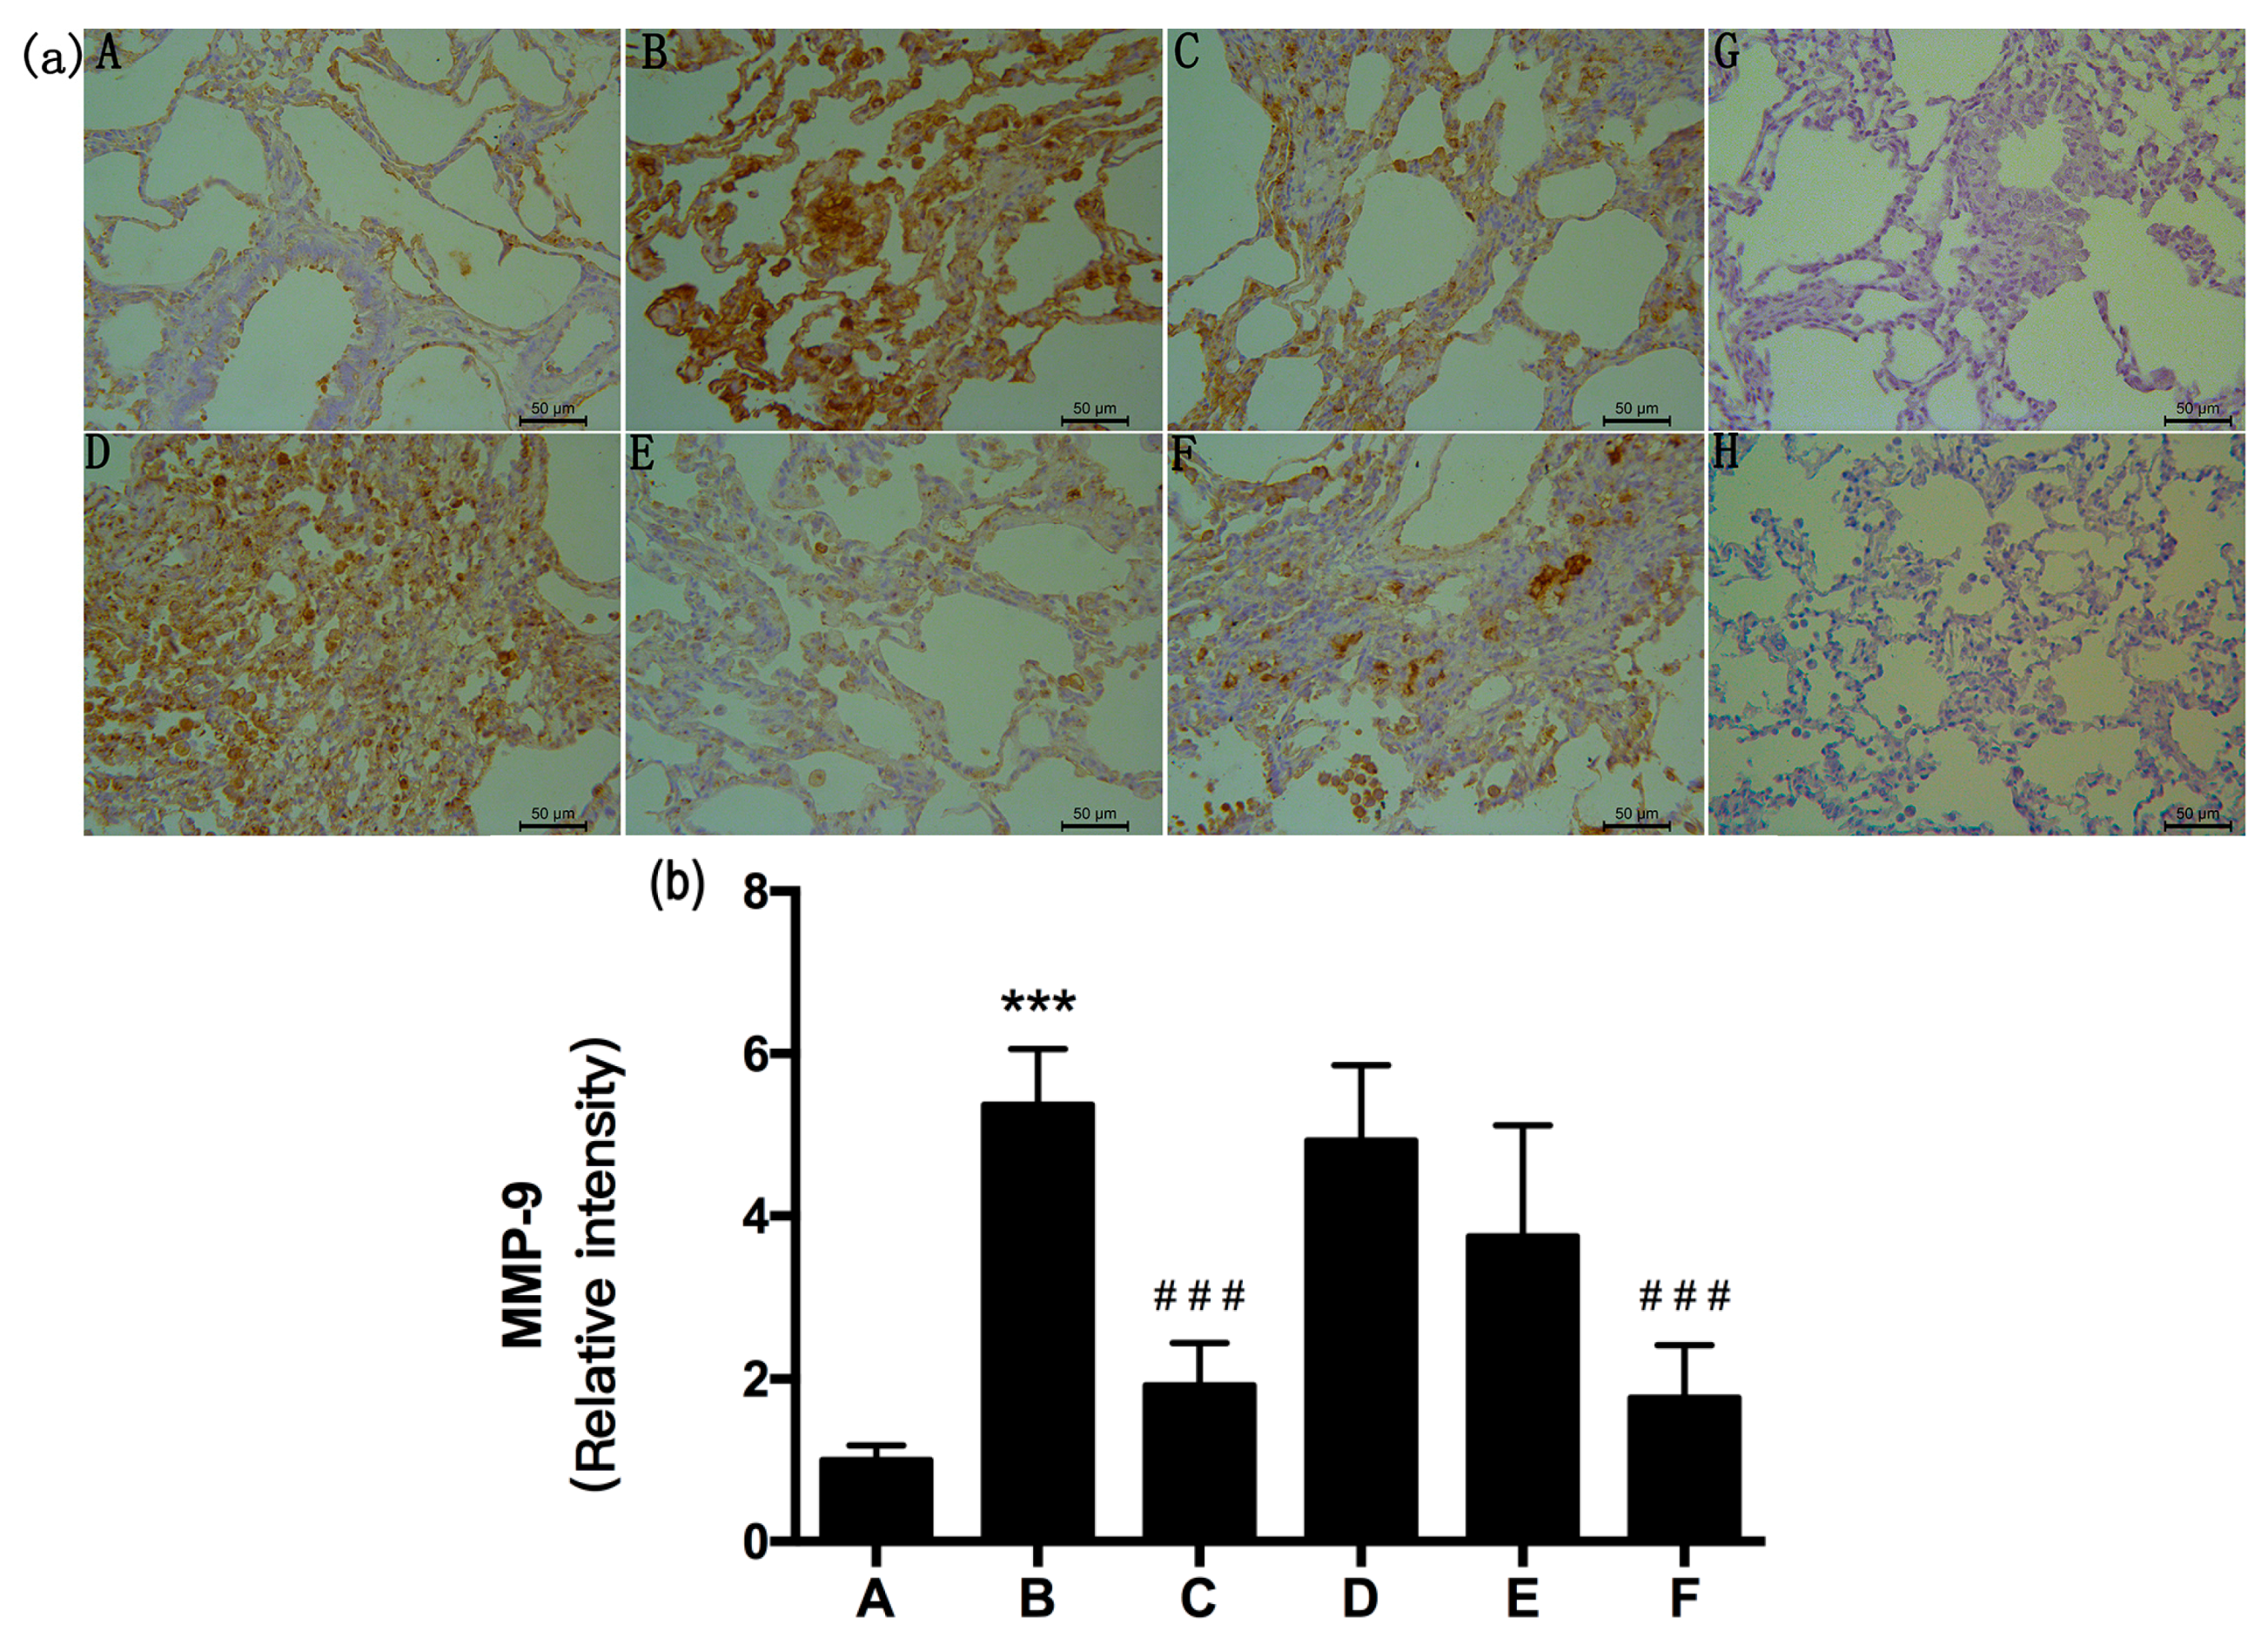
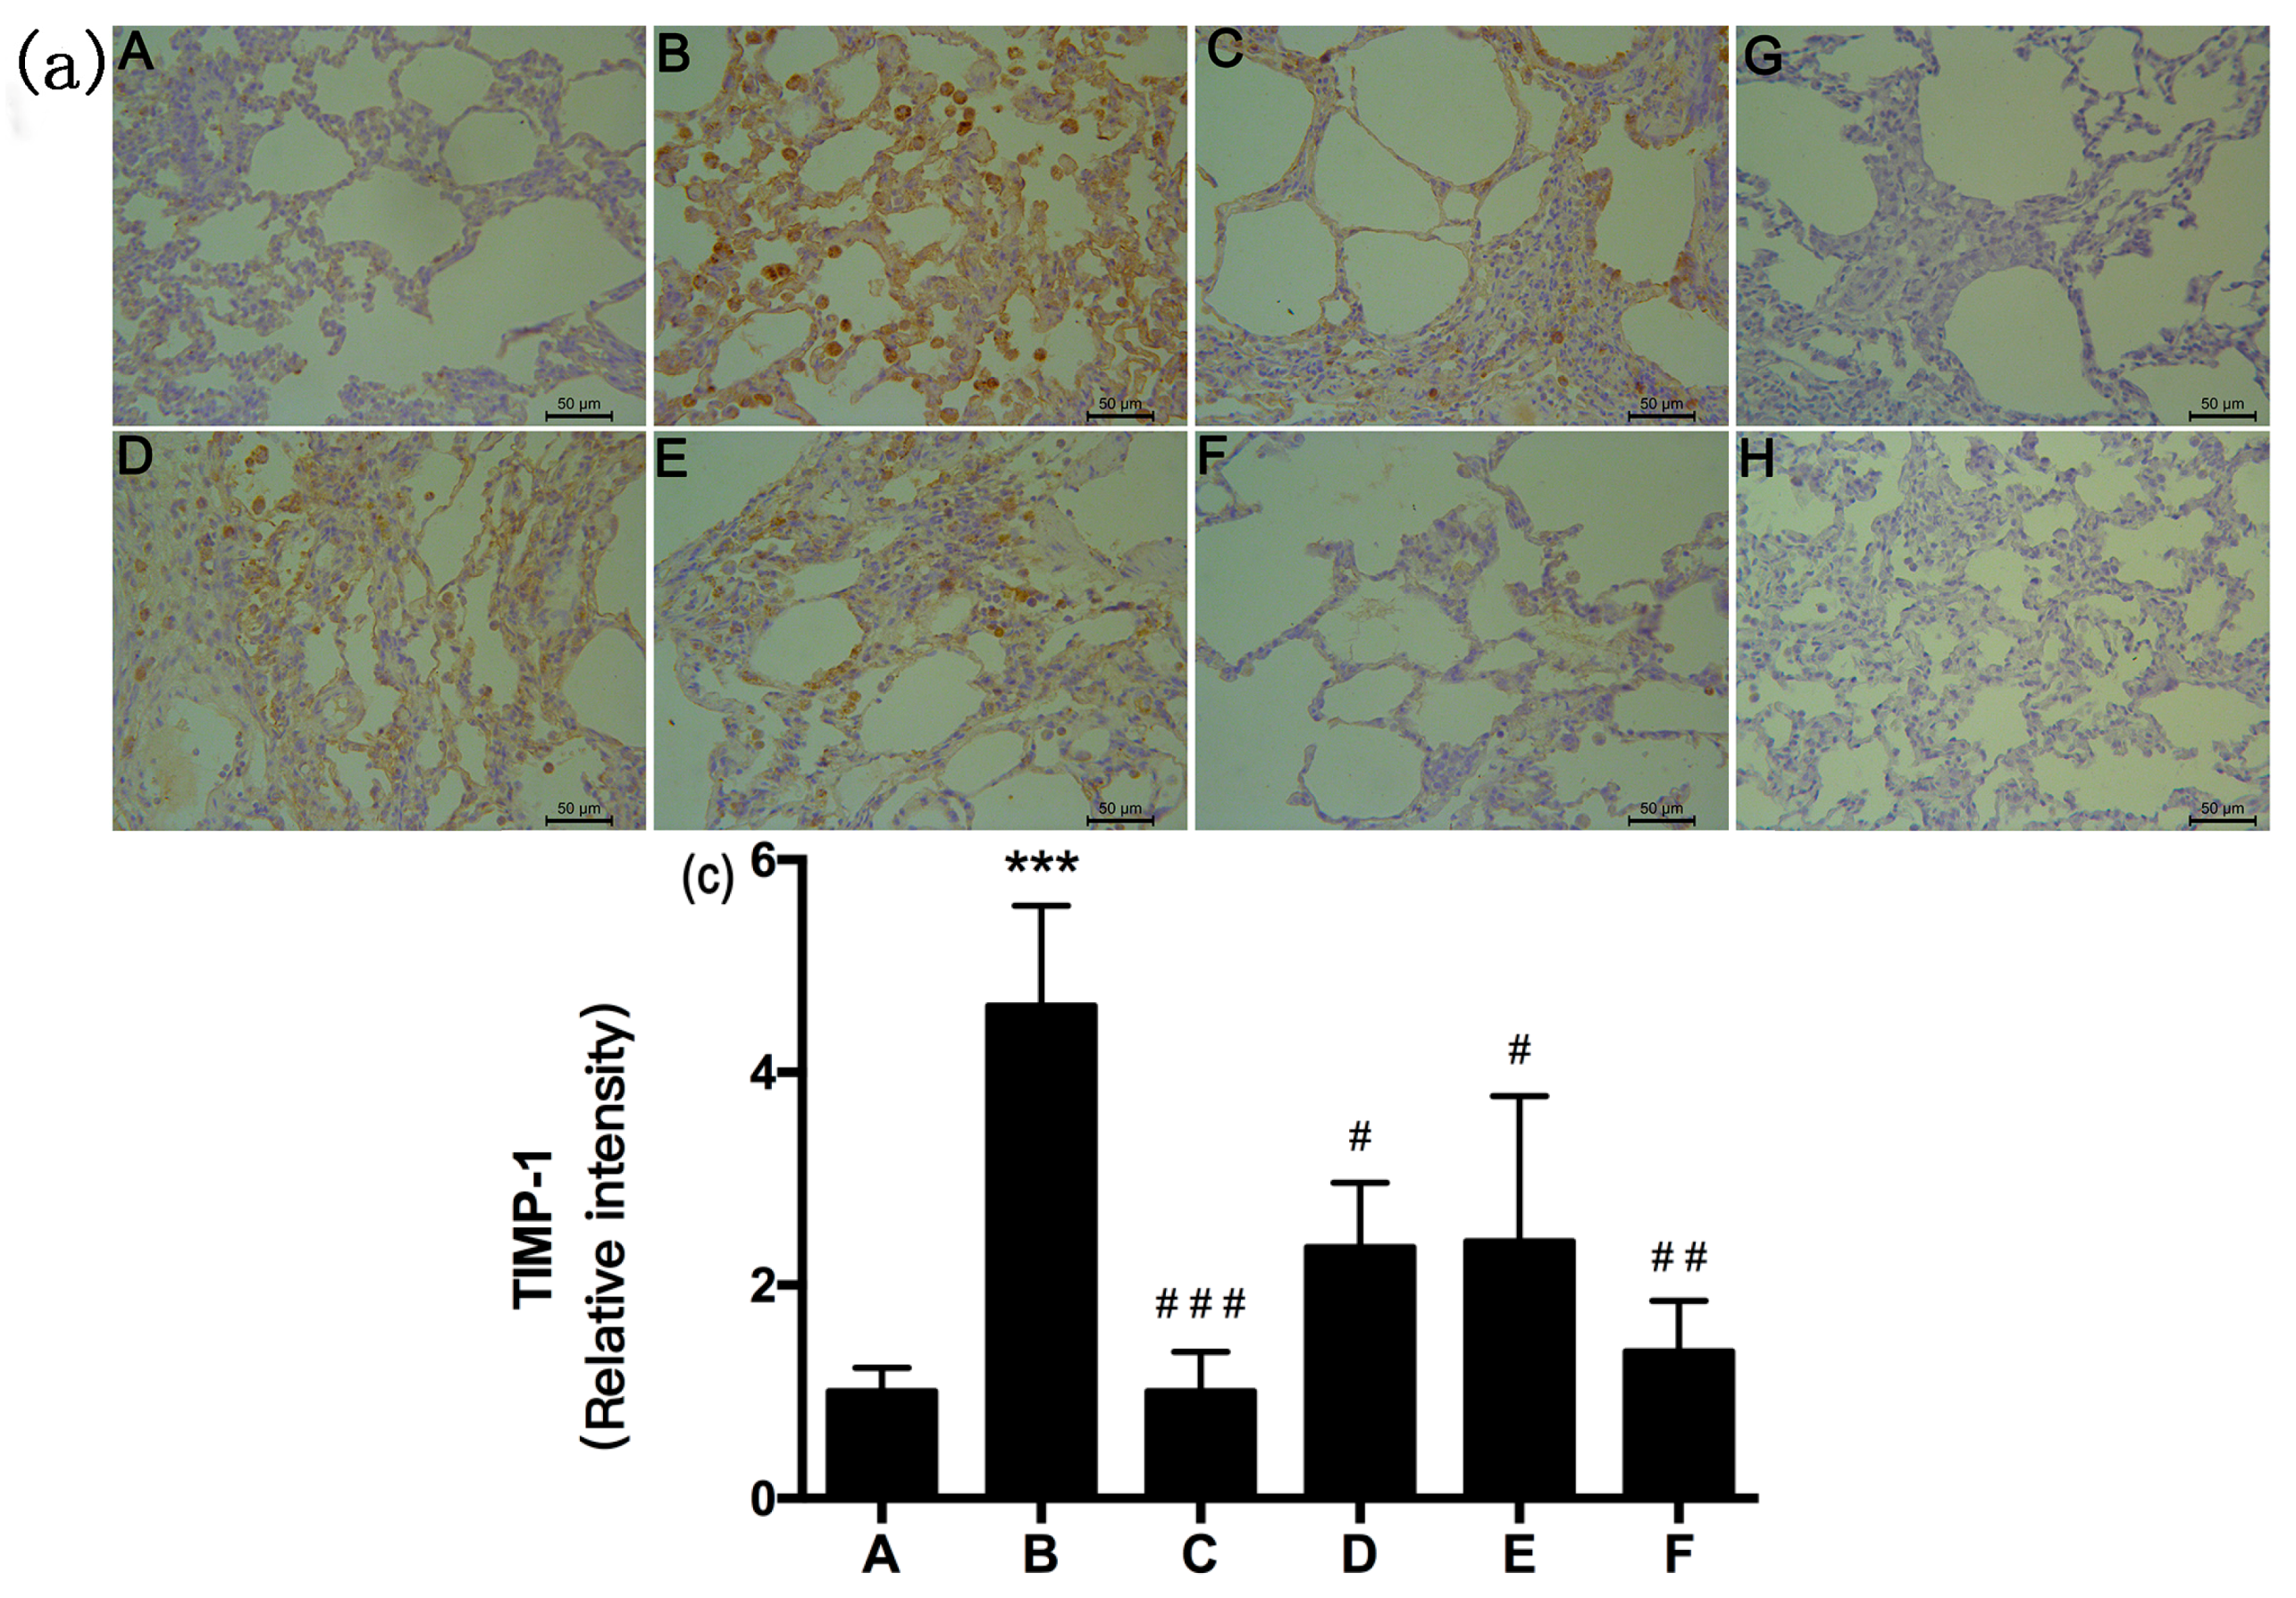
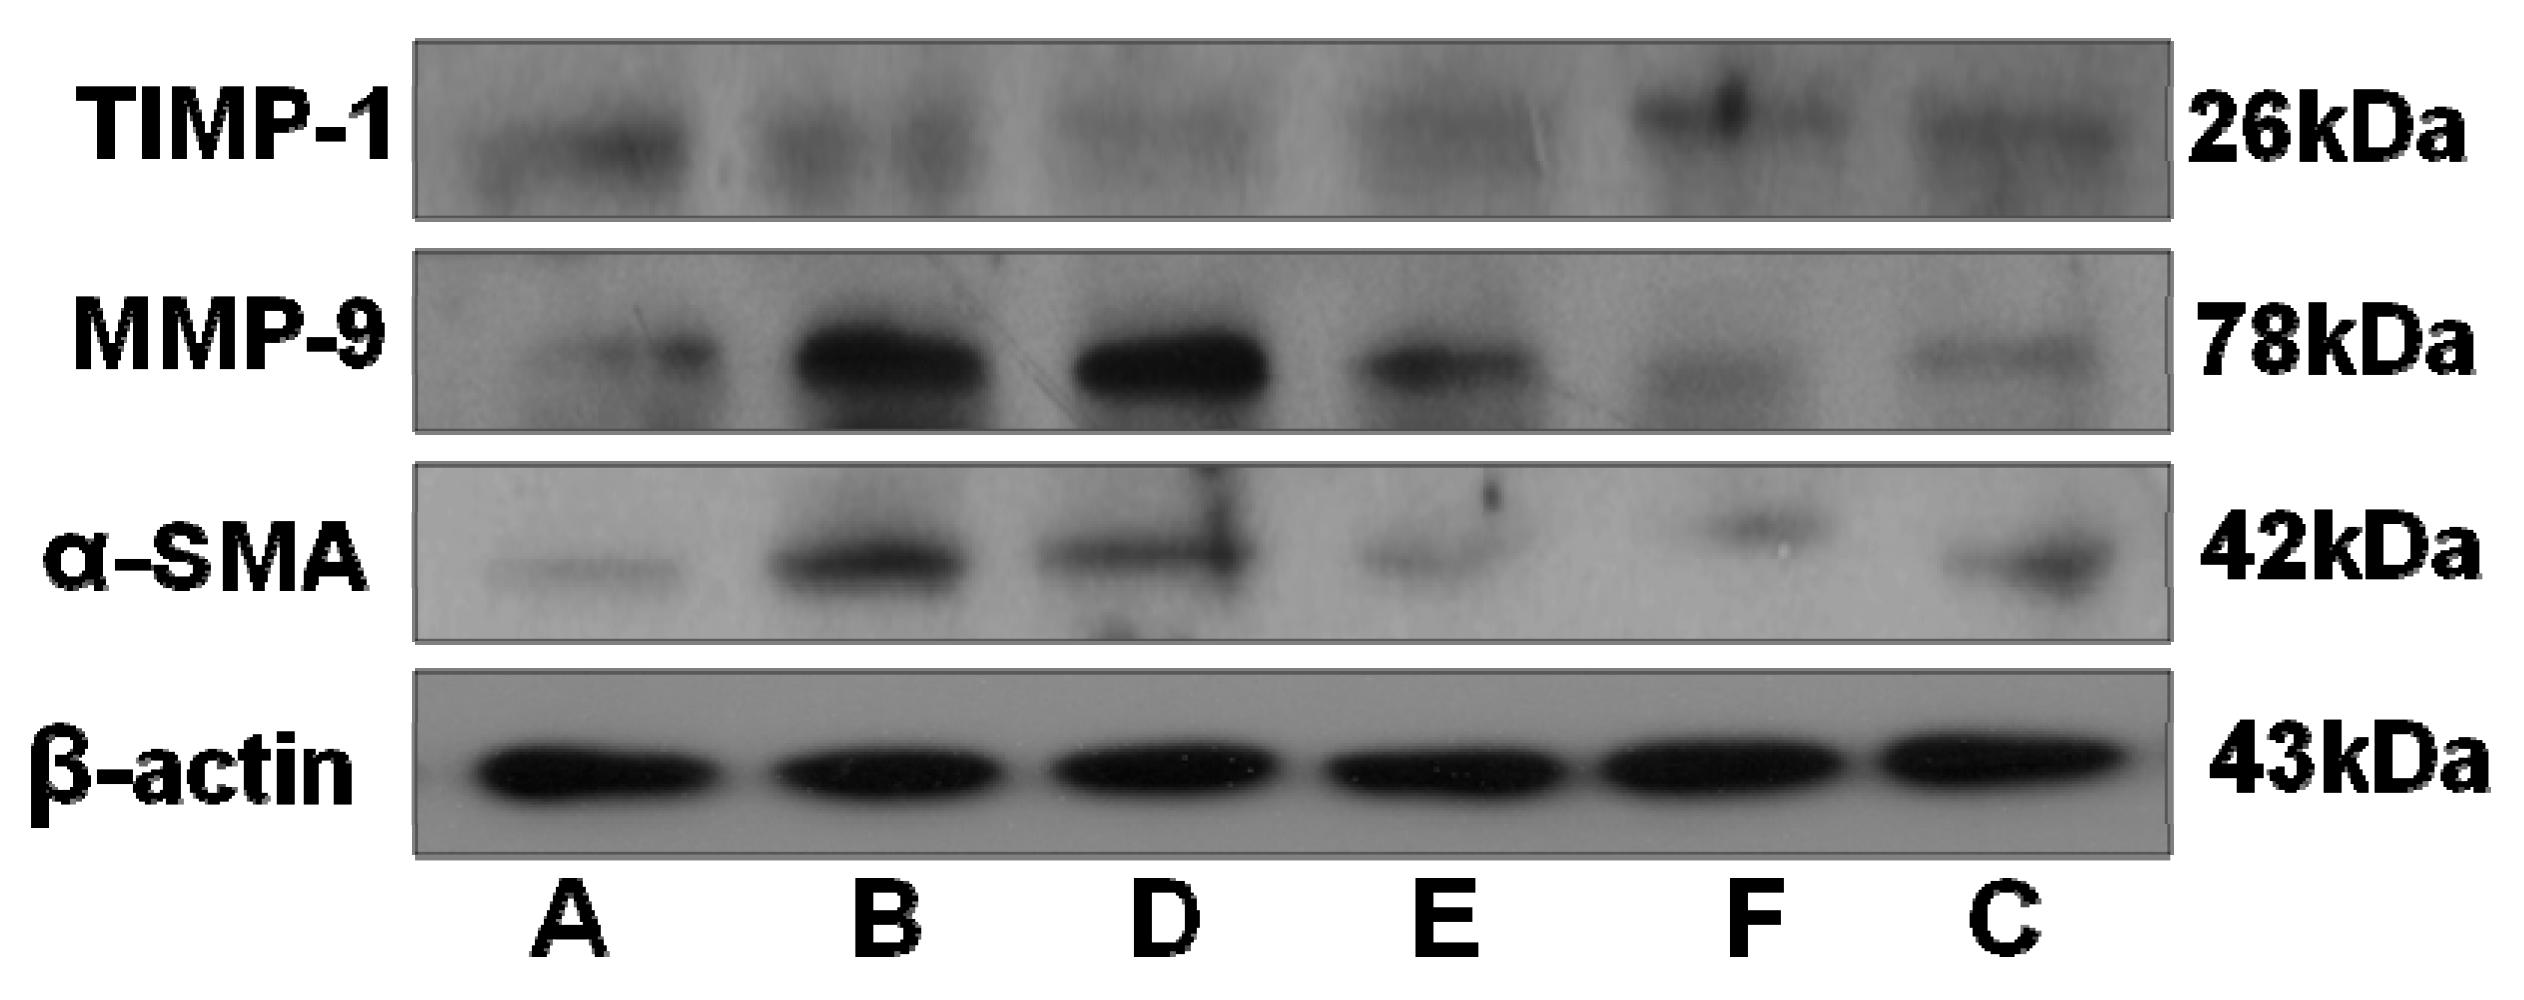
2.5. RRL Attenuates BLM-Induced α-SMA, MMP-9, and TIMP-1 Expression in Rats
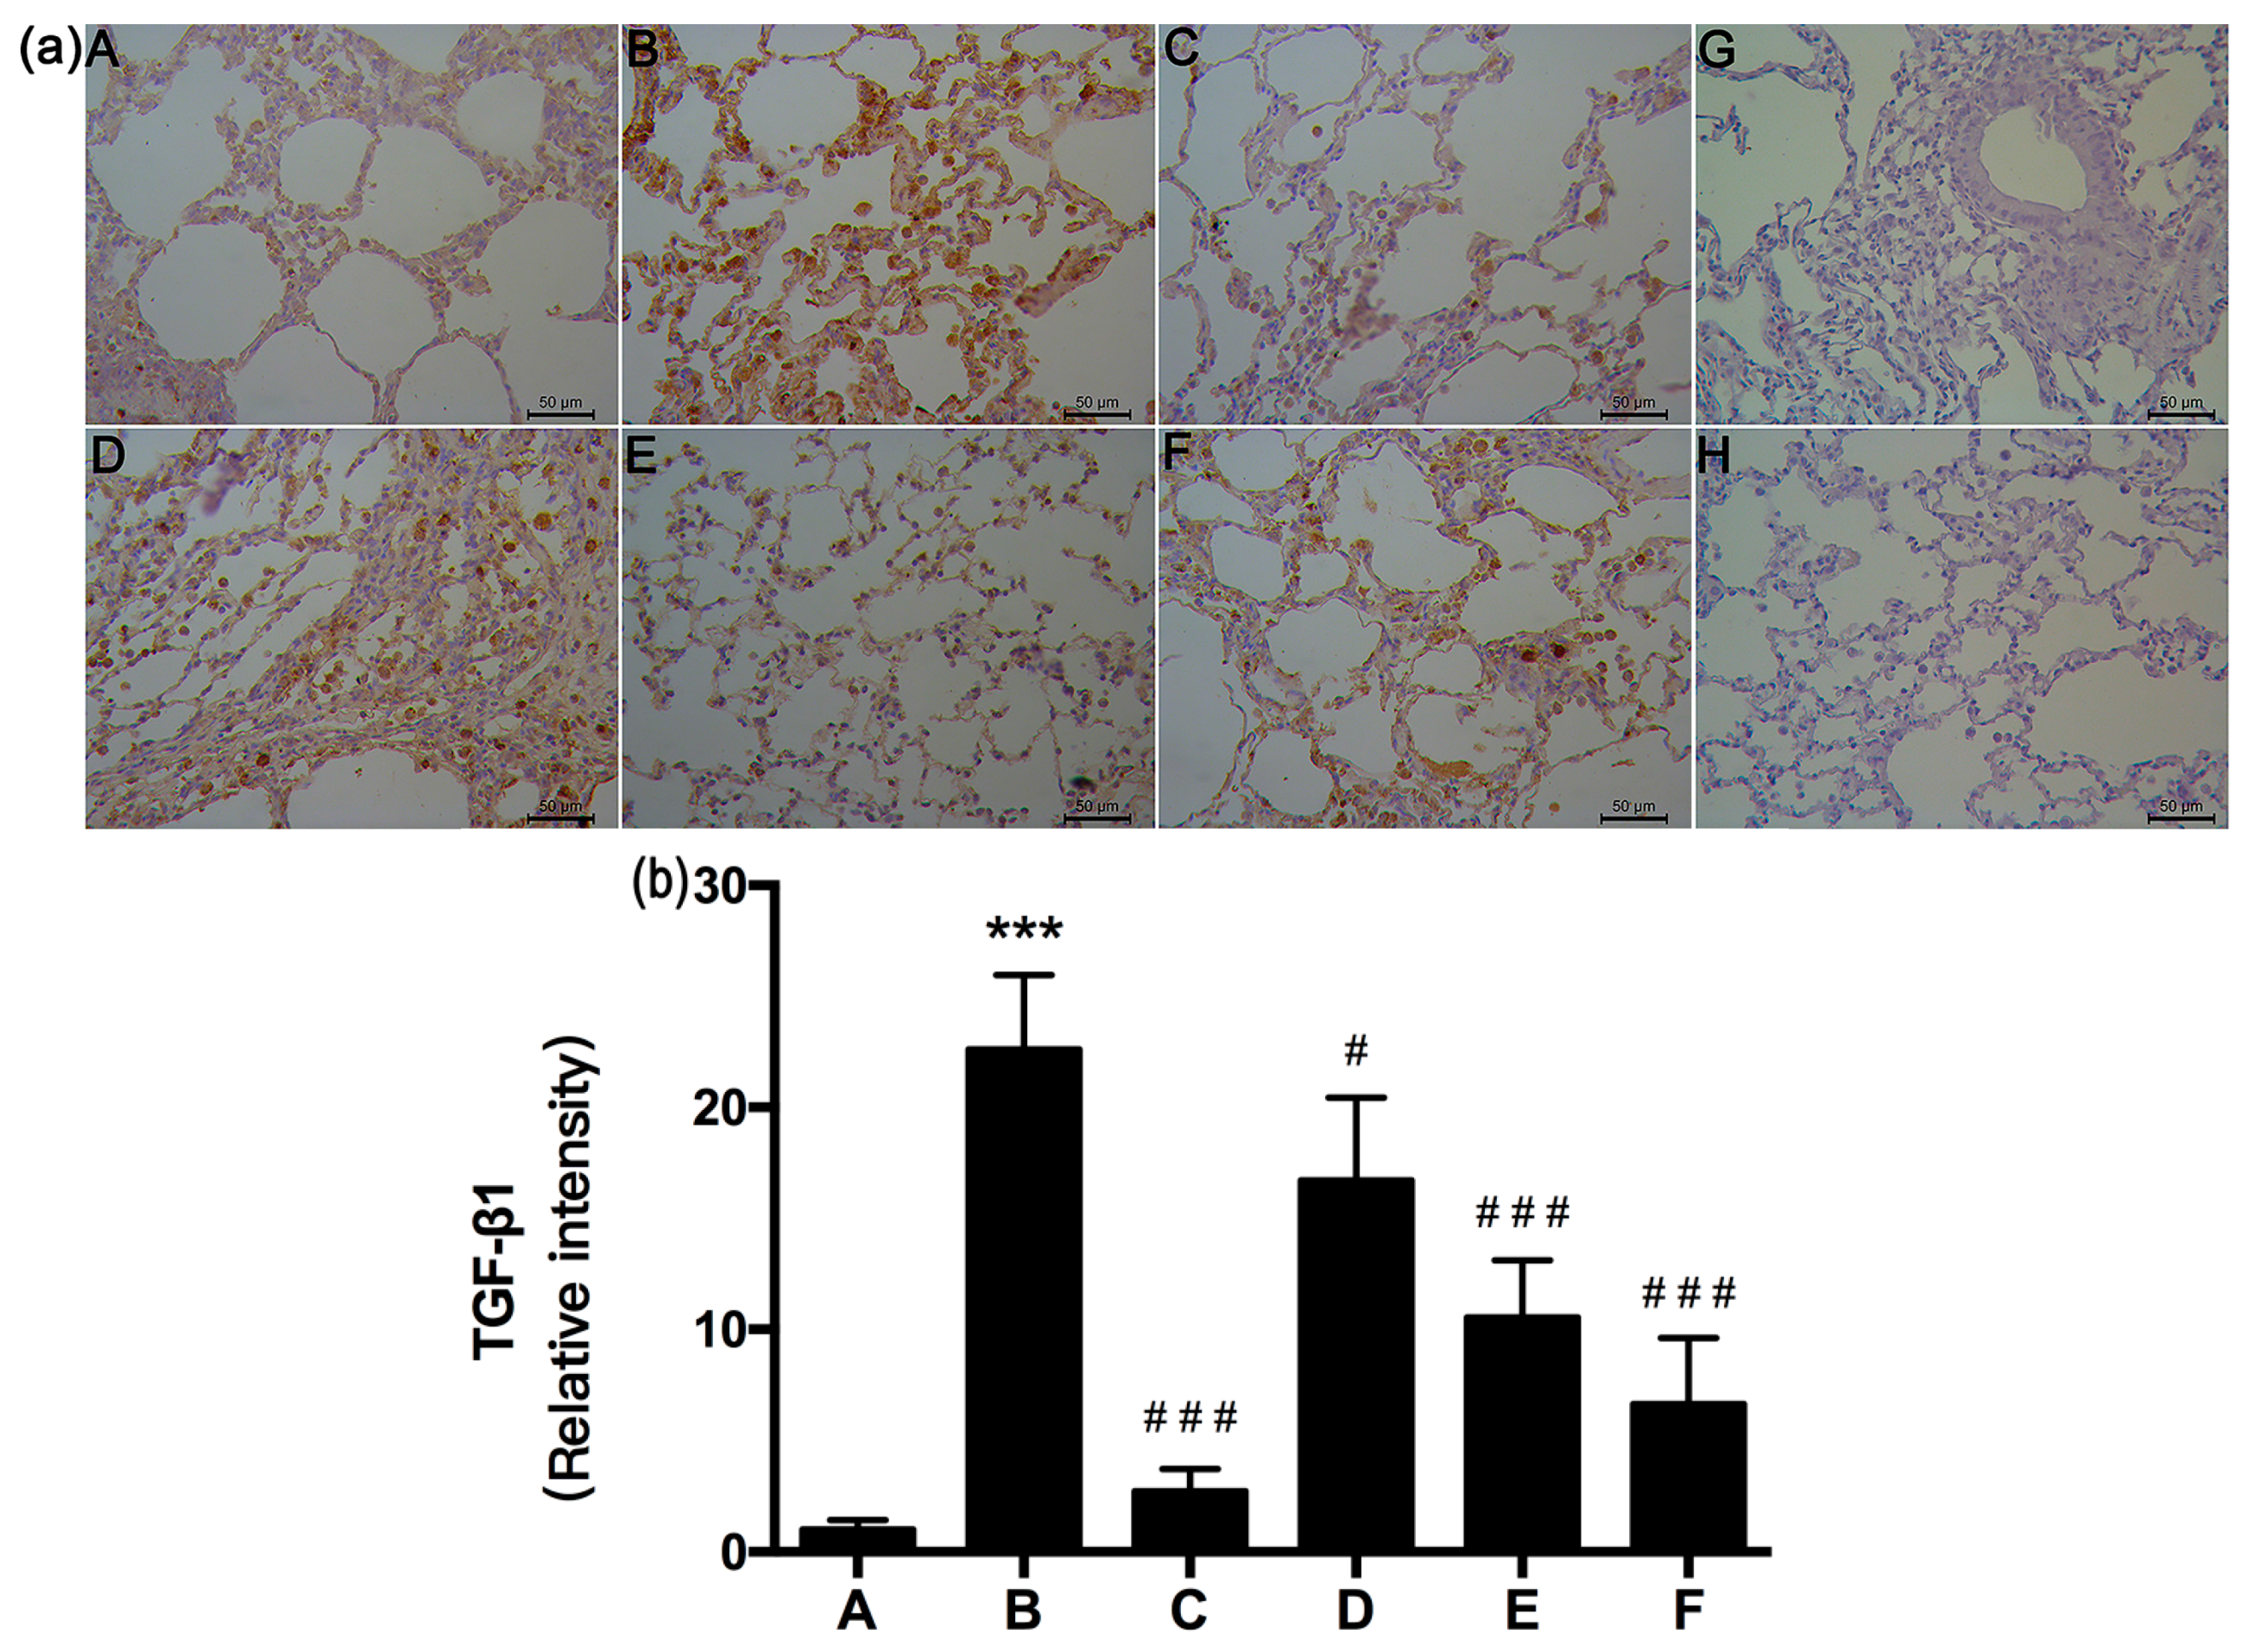
2.6. RRL Attenuated BLM-Induced TGF-β1 Expression in Rats
2.7. Small Molecule Compounds
2.8. Characterization of the RRL Constitutents by UPLC-TOF-MS
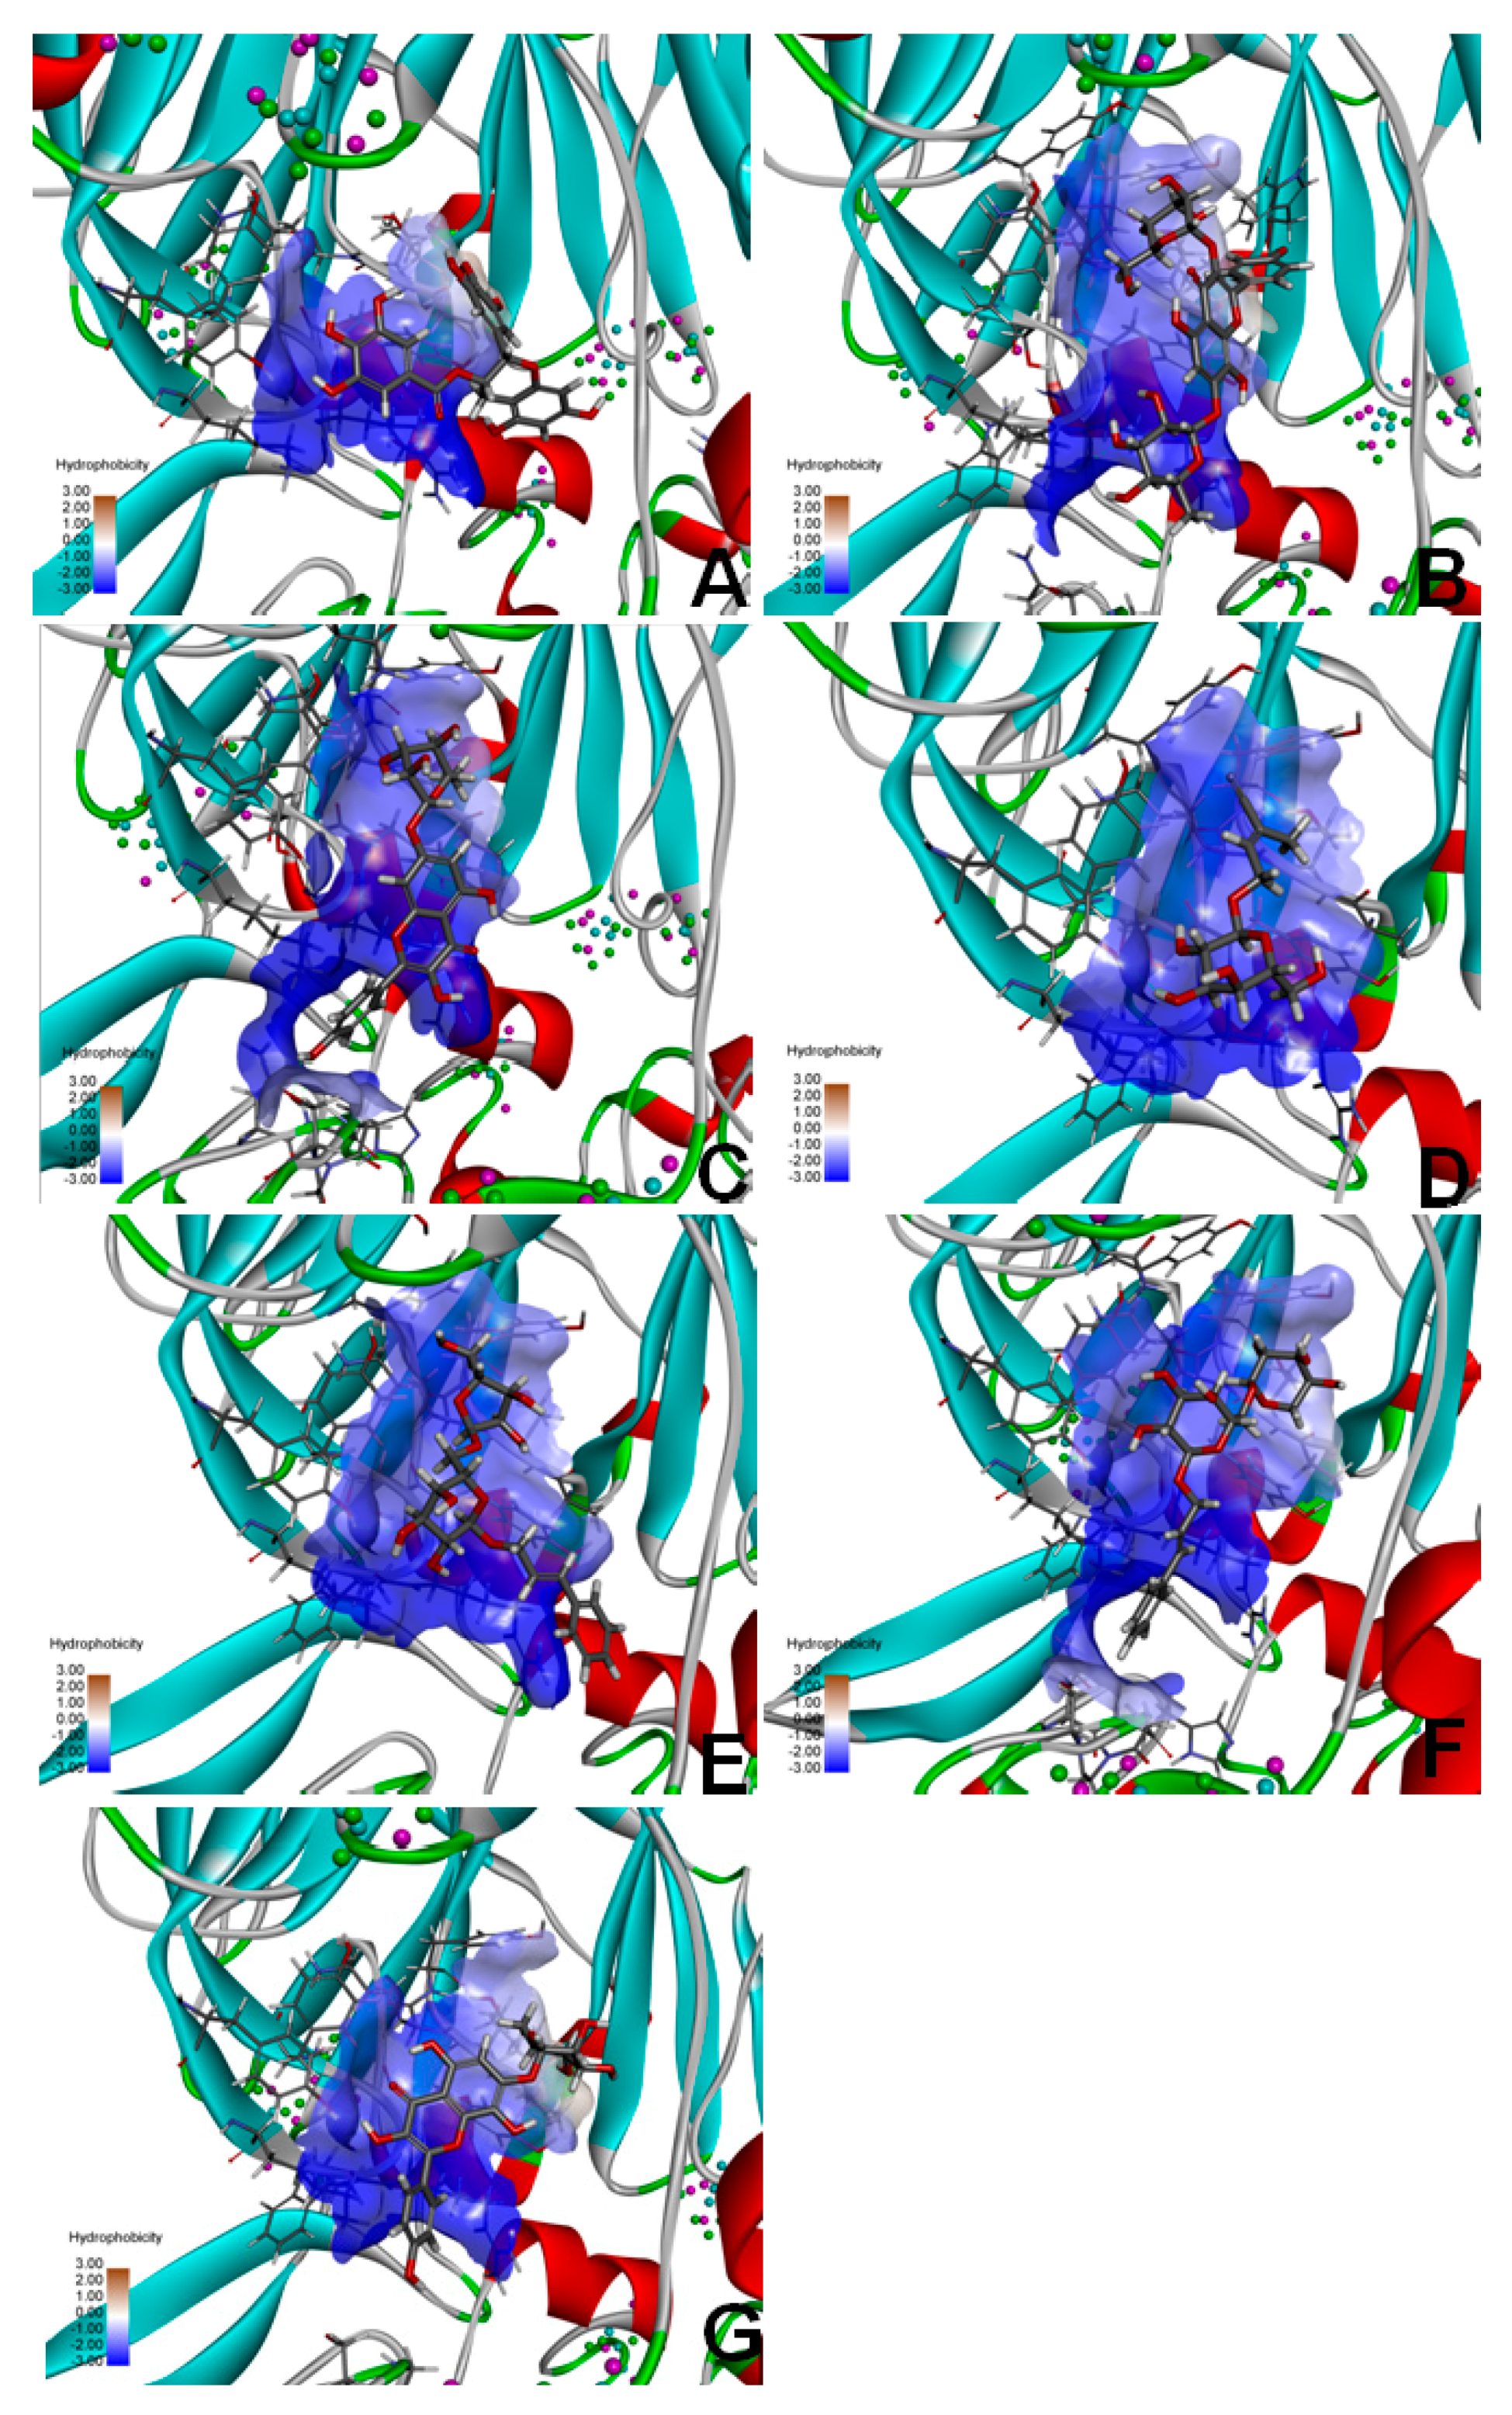
2.9. Molecular Docking of FAP-α
3. Discussion
4. Materials and Methods
4.1. Reagents
4.2. Preparation of RRL Extract
4.3. Ultra High Pressure Liquid Chromatography Time-of-Flight Mass Spectrometry (UPLC-TOF-MS) Analysis
4.4. Animals
4.5. BLM-Induced PF Rat Model
4.6. Lung Collagen Content
4.7. Antioxidant Enzyme Activities
4.8. BALF Biochemical Analysis
4.9. Histopathological Examination
4.10. Immunohistochemical Staining
4.11. Western Blotting
4.12. Isolation and Identification of the Main Components in Rhodiola rosea L.
4.13. Molecular Docking
4.14. Statistical Analysis
5. Conclusions
Acknowledgments
Author Contributions
Conflicts of Interest
References
- Calabrese, F.; Kipar, A.; Lunardi, F.; Balestro, E.; Perissinotto, E.; Rossi, E.; Nannini, N.; Marulli, G.; Stewart, J.P.; Rea, F. Herpes virus infection is associated with vascular remodeling and pulmonary hypertension in idiopathic pulmonary fibrosis. PLoS ONE 2013, 8, e55715. [Google Scholar] [CrossRef] [PubMed]
- Higashiyama, H.; Yoshimoto, D.; Kaise, T.; Matsbara, S.; Fujiwara, M.; Kikkawa, H.; Asano, S.; Kinoshita, M. Inhibition of activin receptor-like kinase 5 attenuates bleomycin-induced pulmonary fibrosis. Exp. Mol. Pathol. 2007, 83, 39–46. [Google Scholar] [CrossRef] [PubMed]
- Tan, S.Z.; Liu, C.H.; Zhang, W.; Lu, X.; Ye, W.C.; Cai, Z.Z.; Liu, P. Feature changes of MMP-2/9 activities and TIMP-1/2 protein expressions during the progression of pulmonary fibrosis in rats. J. Chin. Integr. Med. 2006, 4, 402–407. [Google Scholar] [CrossRef]
- Smith, R.E.; Strieter, R.M.; Phan, S.H.; Lukacs, N.; Kunkel, S.L. TNF and IL-6 mediate MIP-1α expression in bleomycin-induced lung injury. J. Leukoc. Biol. 1998, 64, 528–536. [Google Scholar] [PubMed]
- Oikonomou, N.; Harokopos, V.; Zalevsky, J.; Valavanis, C.; Kotanidou, A.; Szymkowski, D.E.; Kollias, G.; Aidinis, V. Soluble TNF mediates the transition from pulmonary inflammation to fibrosis. PLoS ONE 2006, 1, e108. [Google Scholar] [CrossRef] [PubMed]
- Beeh, K.M.; Beier, J.; Kornmann, O.; Buhl, R. Sputum matrix metalloproteinase-9, tissue inhibitor of metalloprotinease-I, and their molar ratio in patients with chronic obstructive pulmonary disease, idiopathic pulmonary fibrosis and healthy subjects. Respir. Med. 2003, 97, 634–639. [Google Scholar] [CrossRef] [PubMed]
- Chung, K.F. Inflammatory mediators in chronic obstructive pulmonary disease. Curr. Drug Targets Inflamm. Allergy 2005, 4, 619–625. [Google Scholar] [CrossRef] [PubMed]
- John, M.; Oltmanns, U.; Fietze, I.; Witt, C.; Jung, K. Increased production of matrix metalloproteinase-2 in alveolar macrophages and regulation by interleukin-10 in patients with acute pulmonary sarcoidosis. Exp. Lung Res. 2002, 28, 55–68. [Google Scholar] [CrossRef] [PubMed]
- Sasaki, M.; Kashima, M.; Ito, T.; Watanabe, A.; Izumiyama, N.; Sano, M.; Kagaya, M.; Shioya, T.; Miura, M. Differential regulation of metalloproteinase production, proliferation and chemotaxis of human lung fibroblasts by PDGF, interleukin-1β and TNF-α. Mediat. Inflamm. 2000, 9, 155–160. [Google Scholar] [CrossRef] [PubMed]
- Saratikov, A.S.; Krasnov, E.A. Rhodiola rosea (Golden Root), 4th ed.; Tomsk State University Publishing House: Tomsk, Russia, 2004; pp. 22–41. [Google Scholar]
- Schriner, S.E.; Avanesian, A.; Liu, Y.; Luesch, H.; Jafari, M. Protection of human cultured cells against oxidative stress by Rhodiola rosea without activation of antioxidant defenses. Free Radic. Biol. Med. 2009, 47, 577–584. [Google Scholar] [CrossRef] [PubMed]
- Diermen, D.V.; Marsto, A.; Bravo, J.; Reist, M.; Carrupt, P.A.; Hostettmann, K. Monoamine oxidase inhibition by Rhodiola rosea L. roots. J. Ethnopharmacol. 2009, 122, 397–401. [Google Scholar] [CrossRef] [PubMed]
- Panossian, A.; Wikman, G.; Sarris, J. Rosenroot (Rhodiola rosea): Traditional use, chemical composition, pharmacology and clinical efficacy. Phytomedicine 2010, 17, 481–493. [Google Scholar] [CrossRef] [PubMed]
- Chen, A.Y.; Chen, Y.C. A review of the dietary flavonoid, kaempferol on human health and cancer chemoprevention. Food Chem. 2013, 138, 2099–2107. [Google Scholar] [CrossRef] [PubMed]
- Qiao, Y.; Xiang, Q.; Yuan, L.; Xu, L.; Liu, Z.; Liu, X. Herbacetin induces apoptosis in HepG2 cells: Involvements of ROS and PI3K/Akt pathway. Food Chem. Toxicol. 2013, 51, 426–433. [Google Scholar] [CrossRef] [PubMed]
- Díaz, L.A.M.; Abad, M.M.J.; Fernández, M.L.; Recuero, C.C.; Villaescusa, C.L.; Silván, S.A.M.; Bermejo, B.P. Lignan and phenyl propanoid glycosides from Phillyrea latifolia and their in vitro anti-inflammatory activity. Planta Med. 2001, 67, 219–223. [Google Scholar] [CrossRef]
- Doncheva, N.D.; Mihaylova, A.S.; Getova, D.P. Antinociceptive and anti-inflammatory effects of Rhodiola rosea L. Extract in rats. Folia Med. 2013, 55, 70–75. [Google Scholar] [CrossRef]
- Tang, H.; Gao, L.; Mao, J.; He, H.; Liu, J.; Cai, X.; Lin, H.; Wu, T. Salidroside protects against bleomycin-induced pulmonary fibrosis: Activation of Nrf2-antioxidant signaling, and inhibition of NF-κB and TGF-β1/Smad-2/-3 pathways. Cell Stress Chaperones 2015, 11, 1–11. [Google Scholar] [CrossRef] [PubMed]
- Sener, G.; Topaloglu, N.; Sehirli, A.O.; Ercan, F.; Gedik, N. Resveratrol alleviates bleomycin-induced lung injury in rats. Pulm. Pharmacol. Ther. 2007, 20, 642–649. [Google Scholar] [CrossRef] [PubMed]
- Letterio, J.J.; Roberts, A.B. Regulation of immune responses by TGF-β. Annu. Rev. Immunol. 1998, 16, 137–161. [Google Scholar] [CrossRef] [PubMed]
- Assoian, R.K.; Fleurdelys, B.E.; Stevenson, H.C.; Miller, P.J.; Madtes, D.K.; Raines, E.W.; Ross, R.; Sporn, M.B. Expression and secretion of type β transforming growth factor by activated human macrophages. Proc. Natl. Acad. Sci. USA 1987, 84, 6020–6024. [Google Scholar]
- Grotendorst, G.R.; Smale, G.; Pencev, D. Production of transforming growth factor β by human peripheral blood monocytes and neutrophils. J. Cell. Physiol. 1989, 140, 396–402. [Google Scholar] [CrossRef] [PubMed]
- Thrall, R.S.; McCormick, J.R.; Jack, R.M.; McReynolds, R.A.; Ward, P.A. Bleomycin-induced pulmonary fibrosis in the rat: Inhibition by indomethacin. Am. J. Pathol. 1979, 95, 117–130. [Google Scholar] [PubMed]
- Claussen, C.A.; Long, E.C. Nucleic acid recognition by metal complexes of bleomycin. Chem. Rev. 1999, 99, 2797–2816. [Google Scholar] [CrossRef] [PubMed]
- Blaisdell, R.J.; Giri, S.N. Mechanism of antifibrotic effect of taurine and niacin in the multidose bleomycin-hamster model of lung fibrosis: Inhibition of lysyl oxidase and collagenase. J. Biochem. Toxicol. 1995, 10, 203–210. [Google Scholar] [CrossRef] [PubMed]
- Balestrini, J.; Chaudhry, S.; Sarrazy, V.; Hinz, B. The mechanical memory of lung myofibroblasts. Integr. Biol. 2012, 4, 410–421. [Google Scholar] [CrossRef] [PubMed]
- Tanjore, H.; Xu, X.C.; Polosukhin, V.V.; Degryse, A.L.; Li, B.; Han, W.; Sherrill, T.P.; Plieth, D.; Neilson, E.G.; Blackwell, T.S.; et al. Contribution of epithelial-derived fibroblasts to bleomycin-induced lung fibrosis. Am. J. Respir. Crit. Care Med. 2009, 180, 657–665. [Google Scholar] [CrossRef] [PubMed]
- Tang, H.; He, H.; Ji, H.; Gao, L.; Mao, J.; Liu, J.; Lin, H.; Wu, T. Tanshinone IIA ameliorates bleomycin-induced pulmonary fibrosis and inhibits transforming growth factor-beta-β-dependent epithelial to mesenchymal transition. J. Surg. Res. 2015, 197, 167–175. [Google Scholar] [CrossRef] [PubMed]
- Qu, Y.; Zhang, L.; Kang, Z.; Jiang, W.; Lv, C. Ponatinib ameliorates pulmonary fibrosis by suppressing TGF-β1/Smad3 pathway. Pulm. Pharmacol. Ther. 2015, 34, 1–7. [Google Scholar] [CrossRef] [PubMed]
- Degryse, A.L.; Tanjore, H.; Xu, X.C.; Polosukhin, V.V.; Jones, B.R.; McMahon, F.B.; Gleaves, L.A.; Blackwell, T.S.; Lawson, W.E. Repetitive intratracheal bleomycin models several features of idiopathic pulmonary fibrosis. Am. J. Physiol. Lung Cell. Mol. Physiol. 2010, 299, 442–452. [Google Scholar] [CrossRef] [PubMed]
- Pera, T.; Zuidhof, A.; Valadas, J.; Smit, M.; Schoemaker, R.G.; Gosens, R.; Maarsingh, H.; Zaagsma, J.; Meurs, H. Tiotropium inhibits pulmonary inflammation and remodelling in a guinea pig model of COPD. Eur. Respir. J. 2011, 38, 789–796. [Google Scholar] [CrossRef] [PubMed]
- Zhu, B.; Ma, A.Q.; Yang, L.; Dang, X.M. Atorvastatin attenuates bleomycin-induced pulmonary fibrosis via suppressing iNOS expression and the CTGF (CCN2)/ERK signaling pathway. Int. J. Mol. Sci. 2013, 14, 24476–24491. [Google Scholar] [CrossRef] [PubMed]
- Lee, M.W.; Lee, Y.A.; Park, H.M.; Toh, S.H.; Lee, E.J.; Jang, H.D.; Kim, Y.H. Antioxidative phenolic compounds from the roots of Rhodiolasachalinensis A. Bor. Arch. Pharm. Res. 2000, 23, 455–458. [Google Scholar] [CrossRef] [PubMed]
- Zhang, K.; Li, G.Y.; Wang, H.Y.; Meng, H.; Xie, S.A.; Gao, J.B.; Wang, J.H. Study on the flavonoids constituents of Rhodiola Rosea L. Mod. Chin. Med. 2010, 12, 20–23. [Google Scholar]
- Zapesochnaya, G.G.; Kurkin, V.A. Glycosides of cinnamyl alcohol from the rhizomes of Rhodiolarosea. Chem. Nat. Compd. 1982, 18, 685–688. [Google Scholar] [CrossRef]
- Yoshikawa, M.; Shimada, H.; Shimoda, H.; Murakami, N.; Yamahara, J.; Matsuda, H. Development of bioactive functions in hydrangeae dulcis folium. V. On the antiallergic and antimicrobial principles of hydrangeae dulcis folium. (2). Thunberginols C, D, and E, thunberginol G 3′-O-glucoside, (−)-hydrangenol 4′-O-glucoside, and (+)-hydrangenol 4′-O-glucoside. Chem. Pharm. Bull. 1996, 44, 2086–2091. [Google Scholar] [PubMed]
- Comte, G.; Chulia, A.J.; Vercauteren, J.; Allais, D.P. Phenylpropane glycosides from Juniperus phoenicea. Planta Med. 1996, 62, 88–89. [Google Scholar] [CrossRef] [PubMed]
- Protein Data Bank (PDB), Research Collaboratory for Structural Bioinformatics, New York, NY, USA. Available online: http://www.pdb.org/pdb/home/home.do (accessed on 29 December 2015).
- Chem3D Ultra12.0, Cambridge Soft Corporation, Cambridge, MA, USA. Available online: http://chembiodraw-ultra.software.informer.com/13.0/ (accessed on 27 December 2015).
- UCSF DOCK6.5 Program. Regents of the University of California All Rights Reserved; San Francisco, CA, USA, 2015. [Google Scholar]


| Group | Day 1 | Day 7 | Day 14 | Day 21 | Day 28 |
|---|---|---|---|---|---|
| A | 185.3 ± 2.2 | 209.9 ± 8.5 | 243.3 ± 13.4 | 262.5 ± 19.6 | 294.0 ± 16.6 |
| B | 190.7 ± 5.4 | 190.4 ± 22.2 * | 195.0 ± 18.9 ** | 227.7 ± 21.4 ** | 236.0 ± 18.5 ** |
| C | 186.9 ± 6.5 | 181.1 ± 15.1 | 183.8 ± 19.2 | 255.4 ± 21.9 ## | 270.3 ± 20.3 ## |
| D | 187.3 ± 4.8 | 192.6 ± 18.0 | 219.1 ± 9.6 ## | 253.0 ± 14.3 # | 279.3 ± 14.8 ## |
| E | 190.9 ± 3.1 | 196.2 ± 12.0 | 225.5 ± 12.8 ## | 273.4 ± 20.8 ## | 282.0 ± 18.4 ## |
| F | 189.6 ± 6.9 | 197.6 ± 8.9 | 223.3 ± 8.8 ## | 272.9 ± 23.7 ## | 284.6 ± 9.3 ## |
| No. | Name | Structure | Identification Methods |
|---|---|---|---|
| 1 | 3,4,5-trihydroxybenzoic acid (2S-cis)-3,4-dihydro-5,7-dihydroxy-2-(3,4,5-trihydroxyphenyl)-2H-benzo[b]pyran-3-yl ester | 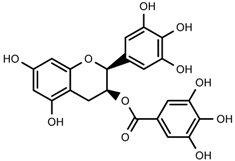 | 1H-NMR, 13C-NMR, HMBC, HSQC, CD, IR, UV, HR-ESI-TOF-MS |
| 2 | herbacetin-3-O-β-d-glucopyranoside-7-O-α-l-rhamnoside | 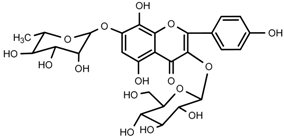 | 1H-NMR, 13C-NMR, HMBC, HR-ESI-TOF-MS |
| 3 | kaempferol-7-O-α-l-rhamnoside |  | 1H-NMR, 13C-NMR, HR-ESI-TOF-MS, m.p. |
| 4 | Rhodiocyanoside A | 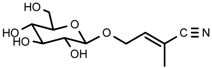 | 1H-NMR, 13C-NMR, HR-ESI-TOF-MS |
| 5 | Rosarin | 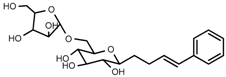 | 1H-NMR, 13C-NMR, HR-ESI-TOF-MS |
| 6 | Rosavin | 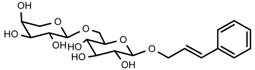 | 1H-NMR, 13C-NMR, HR-ESI-TOF-MS |
| 7 | Rhodionin | 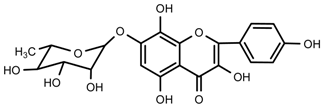 | 1H-NMR, 13C-NMR, HR-ESI-TOF-MS, m.p. |
| 8 | β-sitosterol | 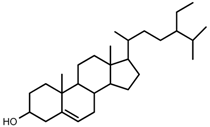 | m.p., TLC |
| 9 | daucosterol | 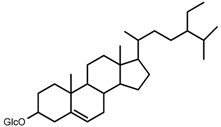 | m.p., TLC |
| Compound No. | Compound Name | Molecular Formula | Molecular Weight | Rt (min) | [M + H]+/[M + Na]+ | Error (ppm) |
|---|---|---|---|---|---|---|
| 1 | 3,4,5-trihydroxybenzoic acid (2S-cis)-3,4-dihydro-5,7-dihydroxy-2-(3,4,5-trihydroxyphenyl)-2H-benzo[b]pyran-3-yl ester | C22H18O11 | 458.0849 | 5.10 | 459.0927 | −0.7 |
| 2 | herbacetin-3-O-β-d-glucopyranoside-7-O-α-l-rhamnoside | C27H30O16 | 610.1534 | 21.56 | 611.1612 | 0.8 |
| 3 | kaempferol-7-O-α-l-rhamnoside | C21H20O10 | 432.1056 | 12.29 | 433.1135 | 0.7 |
| 4 | Rhodiocyanoside A | C11H17NO6 | 450.2465 | 1.86 | 260.1138 | 1.2 |
| 5 | Rosarin | C20H28O10 | 428.1682 | 9.76 | 451.1578 | −0.4 |
| 6 | Rosavin | C20H28O10 | 428.1682 | 10.58 | 451.1581 | 0.2 |
| 7 | Rhodionin | C21H20O11 | 449.1084 | 21.60 | 449.1084 | 0.9 |
© 2016 by the authors; licensee MDPI, Basel, Switzerland. This article is an open access article distributed under the terms and conditions of the Creative Commons Attribution (CC-BY) license (http://creativecommons.org/licenses/by/4.0/).
Share and Cite
Zhang, K.; Si, X.-P.; Huang, J.; Han, J.; Liang, X.; Xu, X.-B.; Wang, Y.-T.; Li, G.-Y.; Wang, H.-Y.; Wang, J.-H. Preventive Effects of Rhodiola rosea L. on Bleomycin-Induced Pulmonary Fibrosis in Rats. Int. J. Mol. Sci. 2016, 17, 879. https://doi.org/10.3390/ijms17060879
Zhang K, Si X-P, Huang J, Han J, Liang X, Xu X-B, Wang Y-T, Li G-Y, Wang H-Y, Wang J-H. Preventive Effects of Rhodiola rosea L. on Bleomycin-Induced Pulmonary Fibrosis in Rats. International Journal of Molecular Sciences. 2016; 17(6):879. https://doi.org/10.3390/ijms17060879
Chicago/Turabian StyleZhang, Ke, Xiao-Ping Si, Jian Huang, Jian Han, Xu Liang, Xiao-Bo Xu, Yi-Ting Wang, Guo-Yu Li, Hang-Yu Wang, and Jin-Hui Wang. 2016. "Preventive Effects of Rhodiola rosea L. on Bleomycin-Induced Pulmonary Fibrosis in Rats" International Journal of Molecular Sciences 17, no. 6: 879. https://doi.org/10.3390/ijms17060879
APA StyleZhang, K., Si, X.-P., Huang, J., Han, J., Liang, X., Xu, X.-B., Wang, Y.-T., Li, G.-Y., Wang, H.-Y., & Wang, J.-H. (2016). Preventive Effects of Rhodiola rosea L. on Bleomycin-Induced Pulmonary Fibrosis in Rats. International Journal of Molecular Sciences, 17(6), 879. https://doi.org/10.3390/ijms17060879