
The Effect of Hydrofluoric Acid Etching Duration on the Surface Micromorphology, Roughness, and Wettability of Dental Ceramics

 ,
,
Abstract
:
1. Introduction
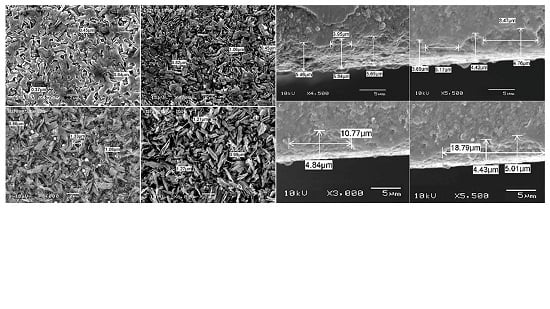
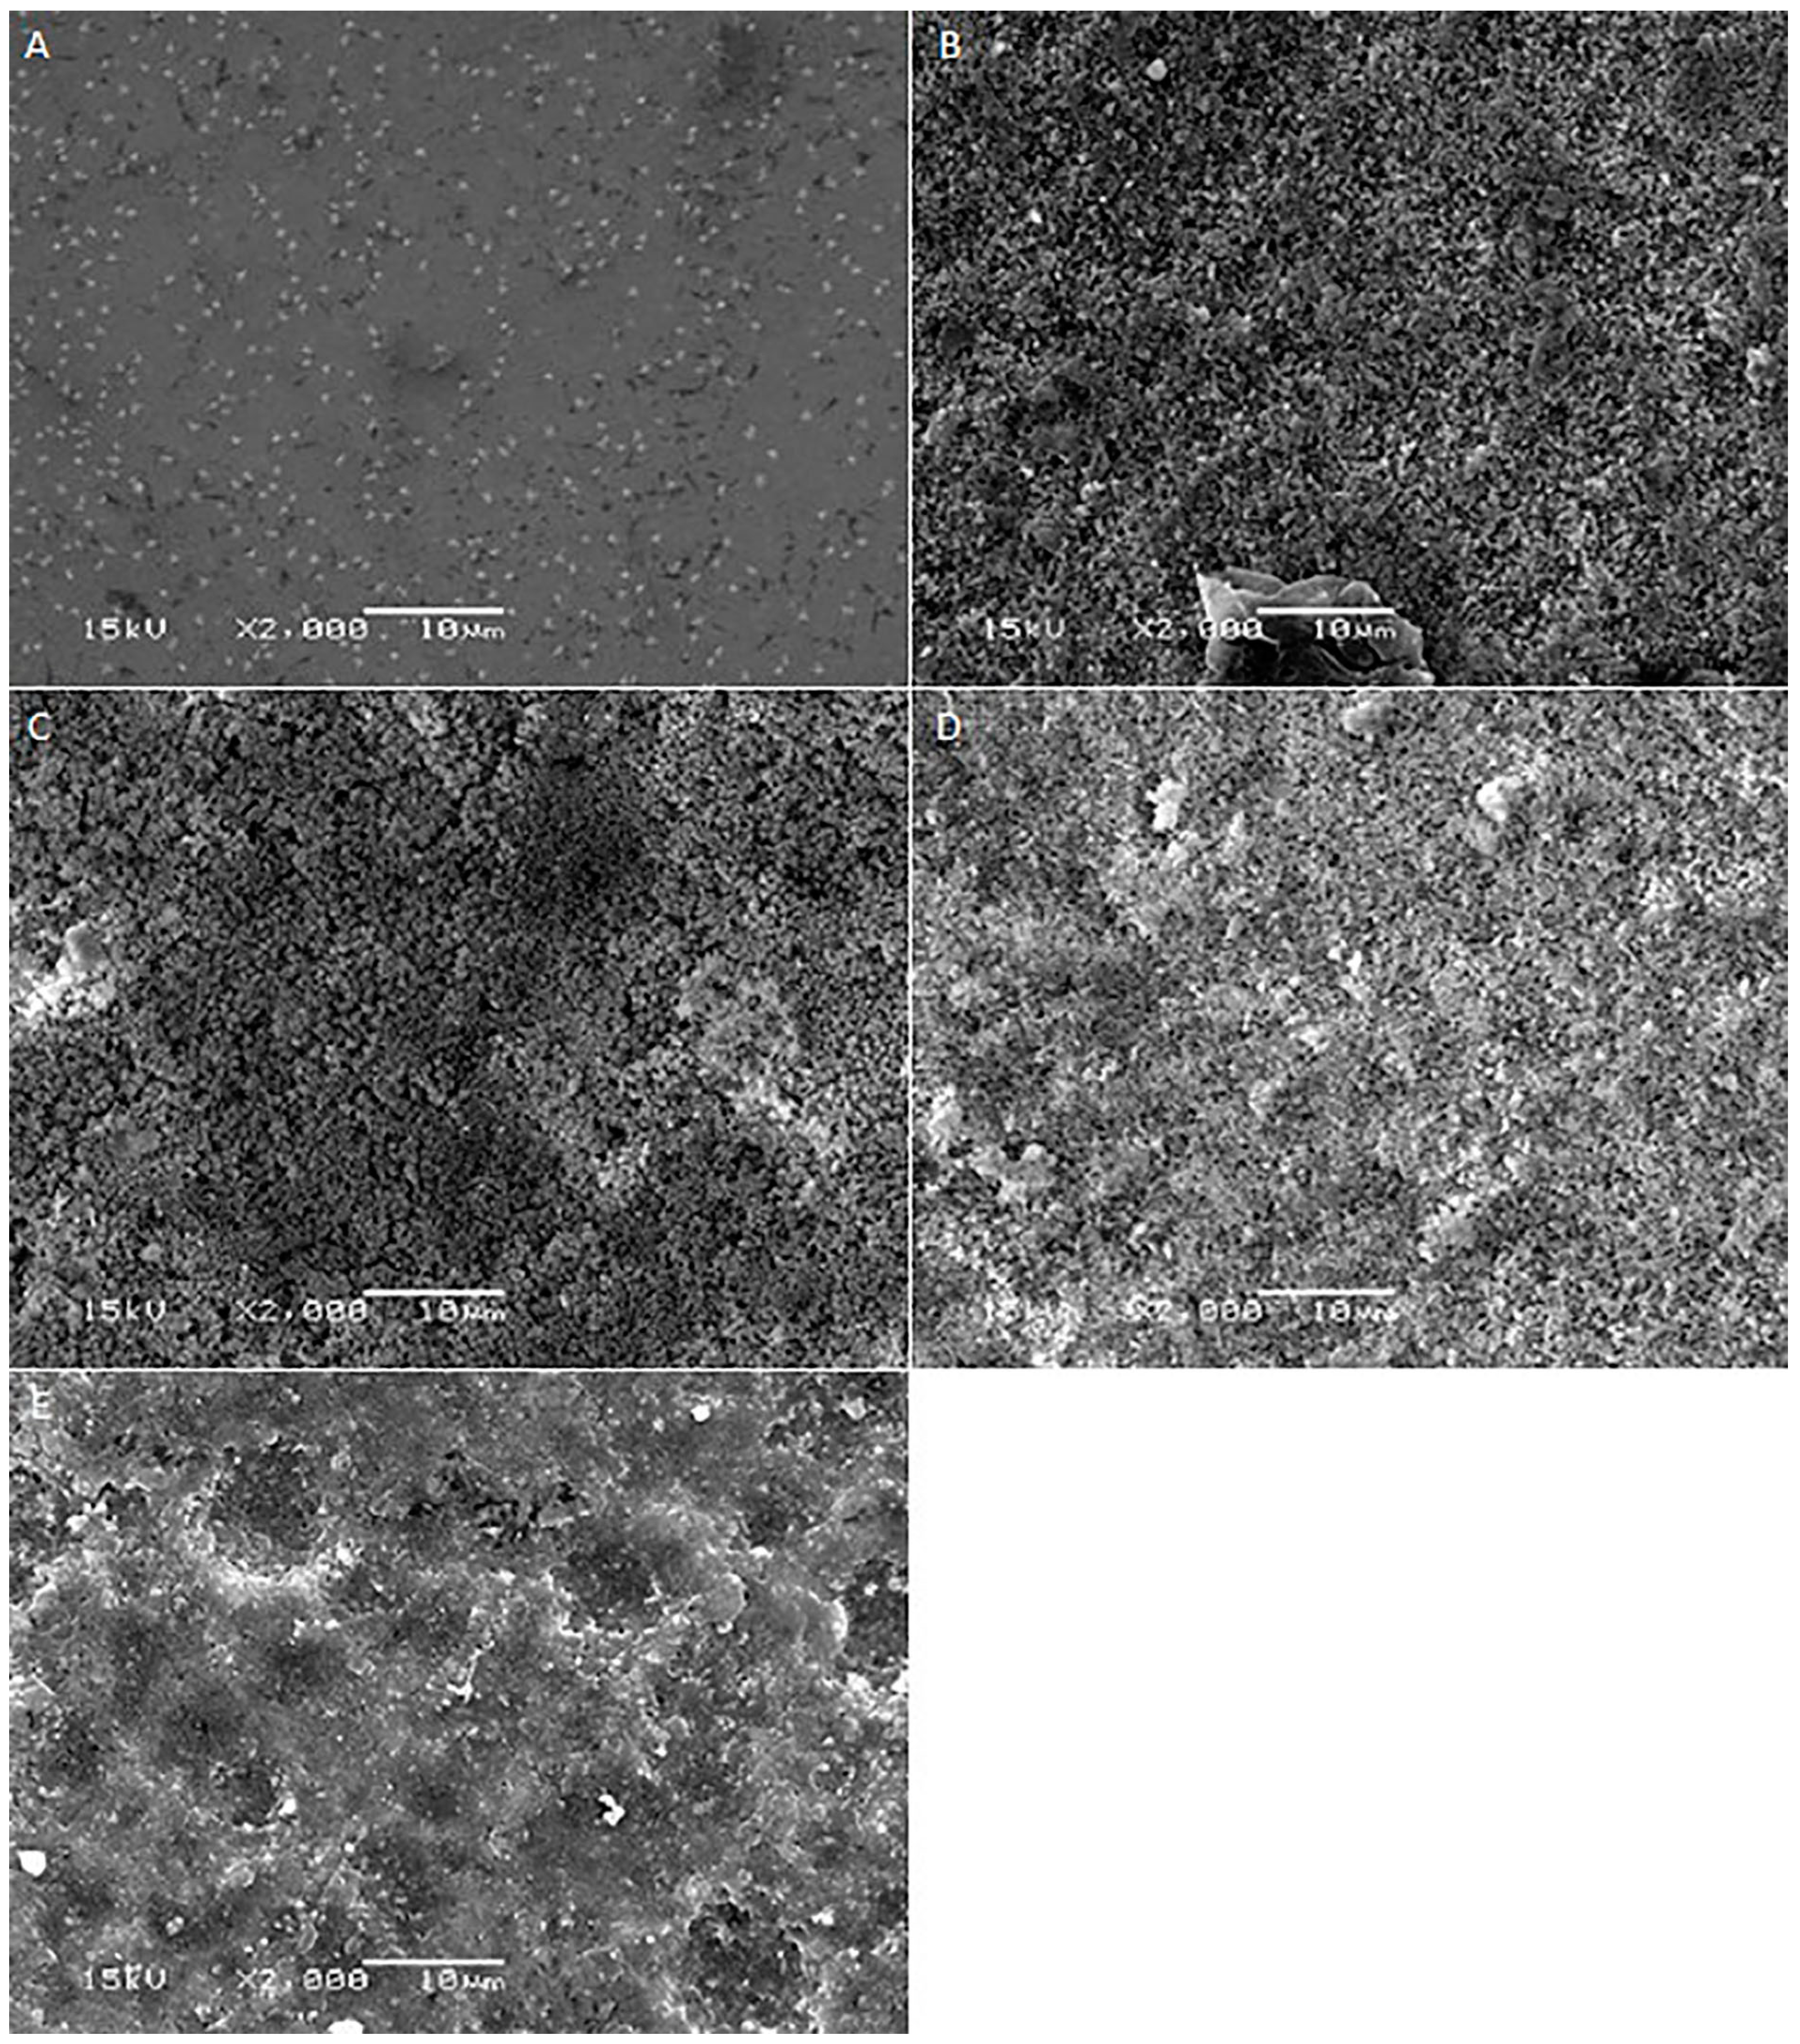
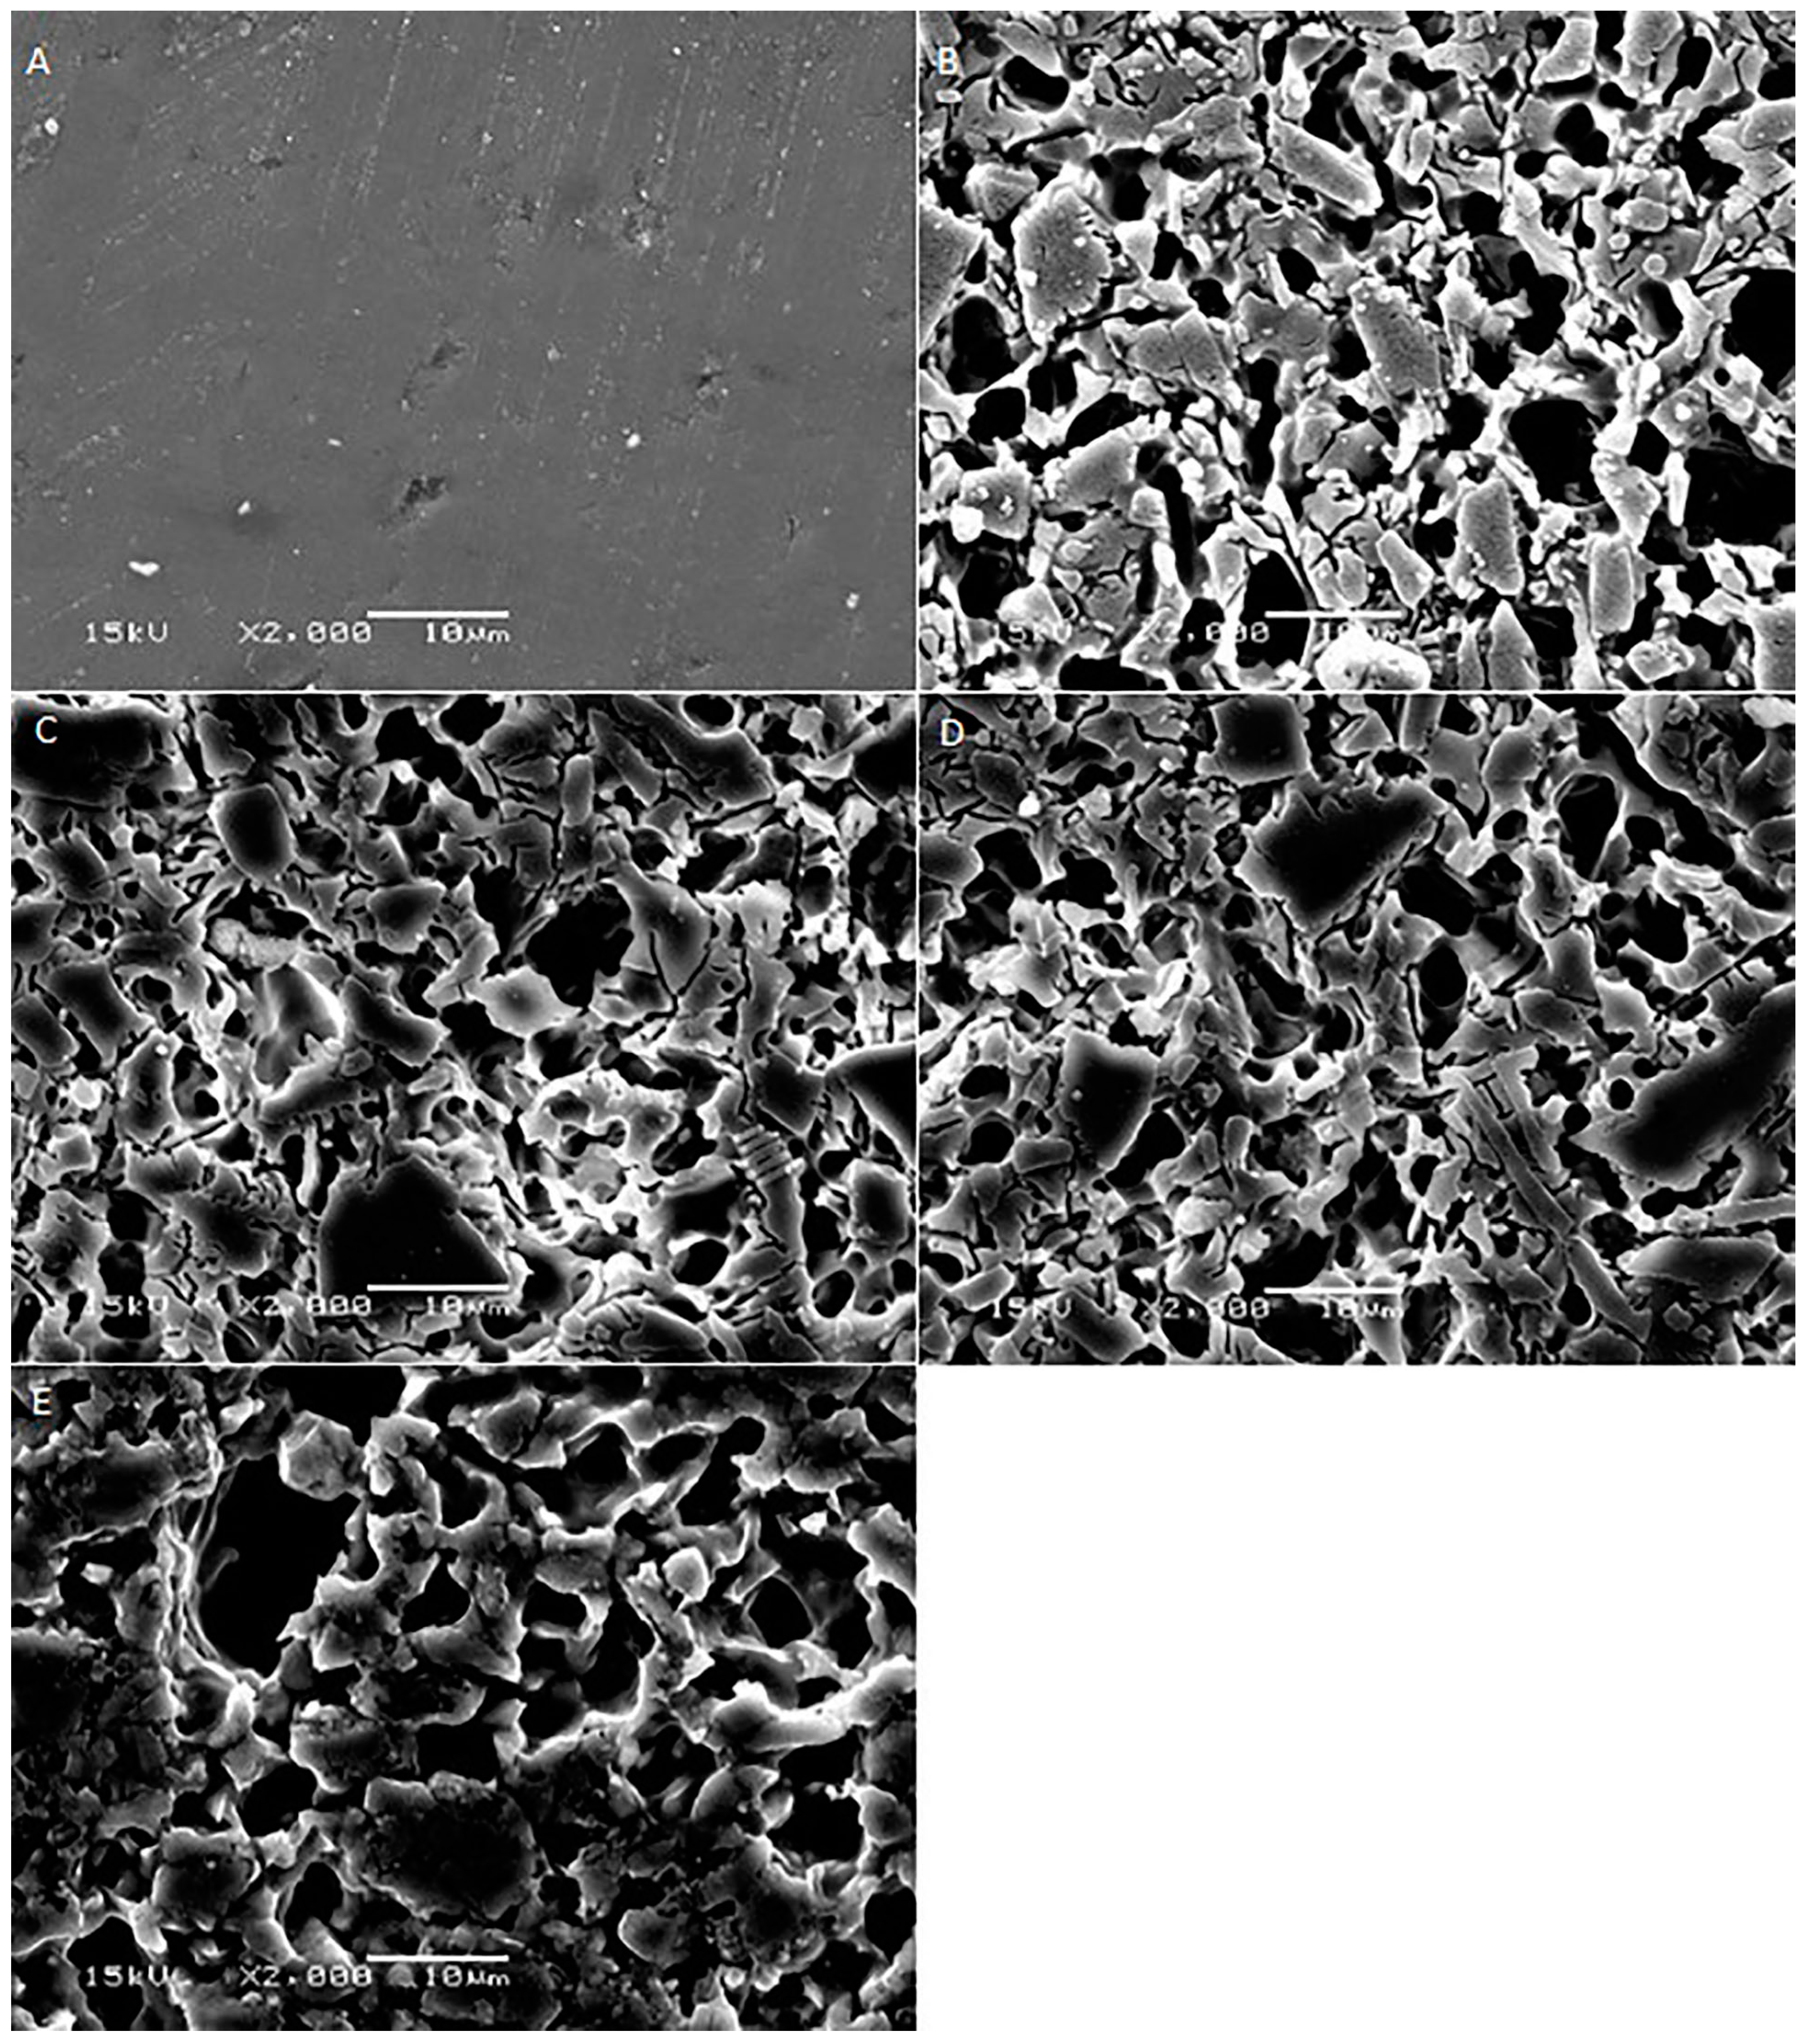
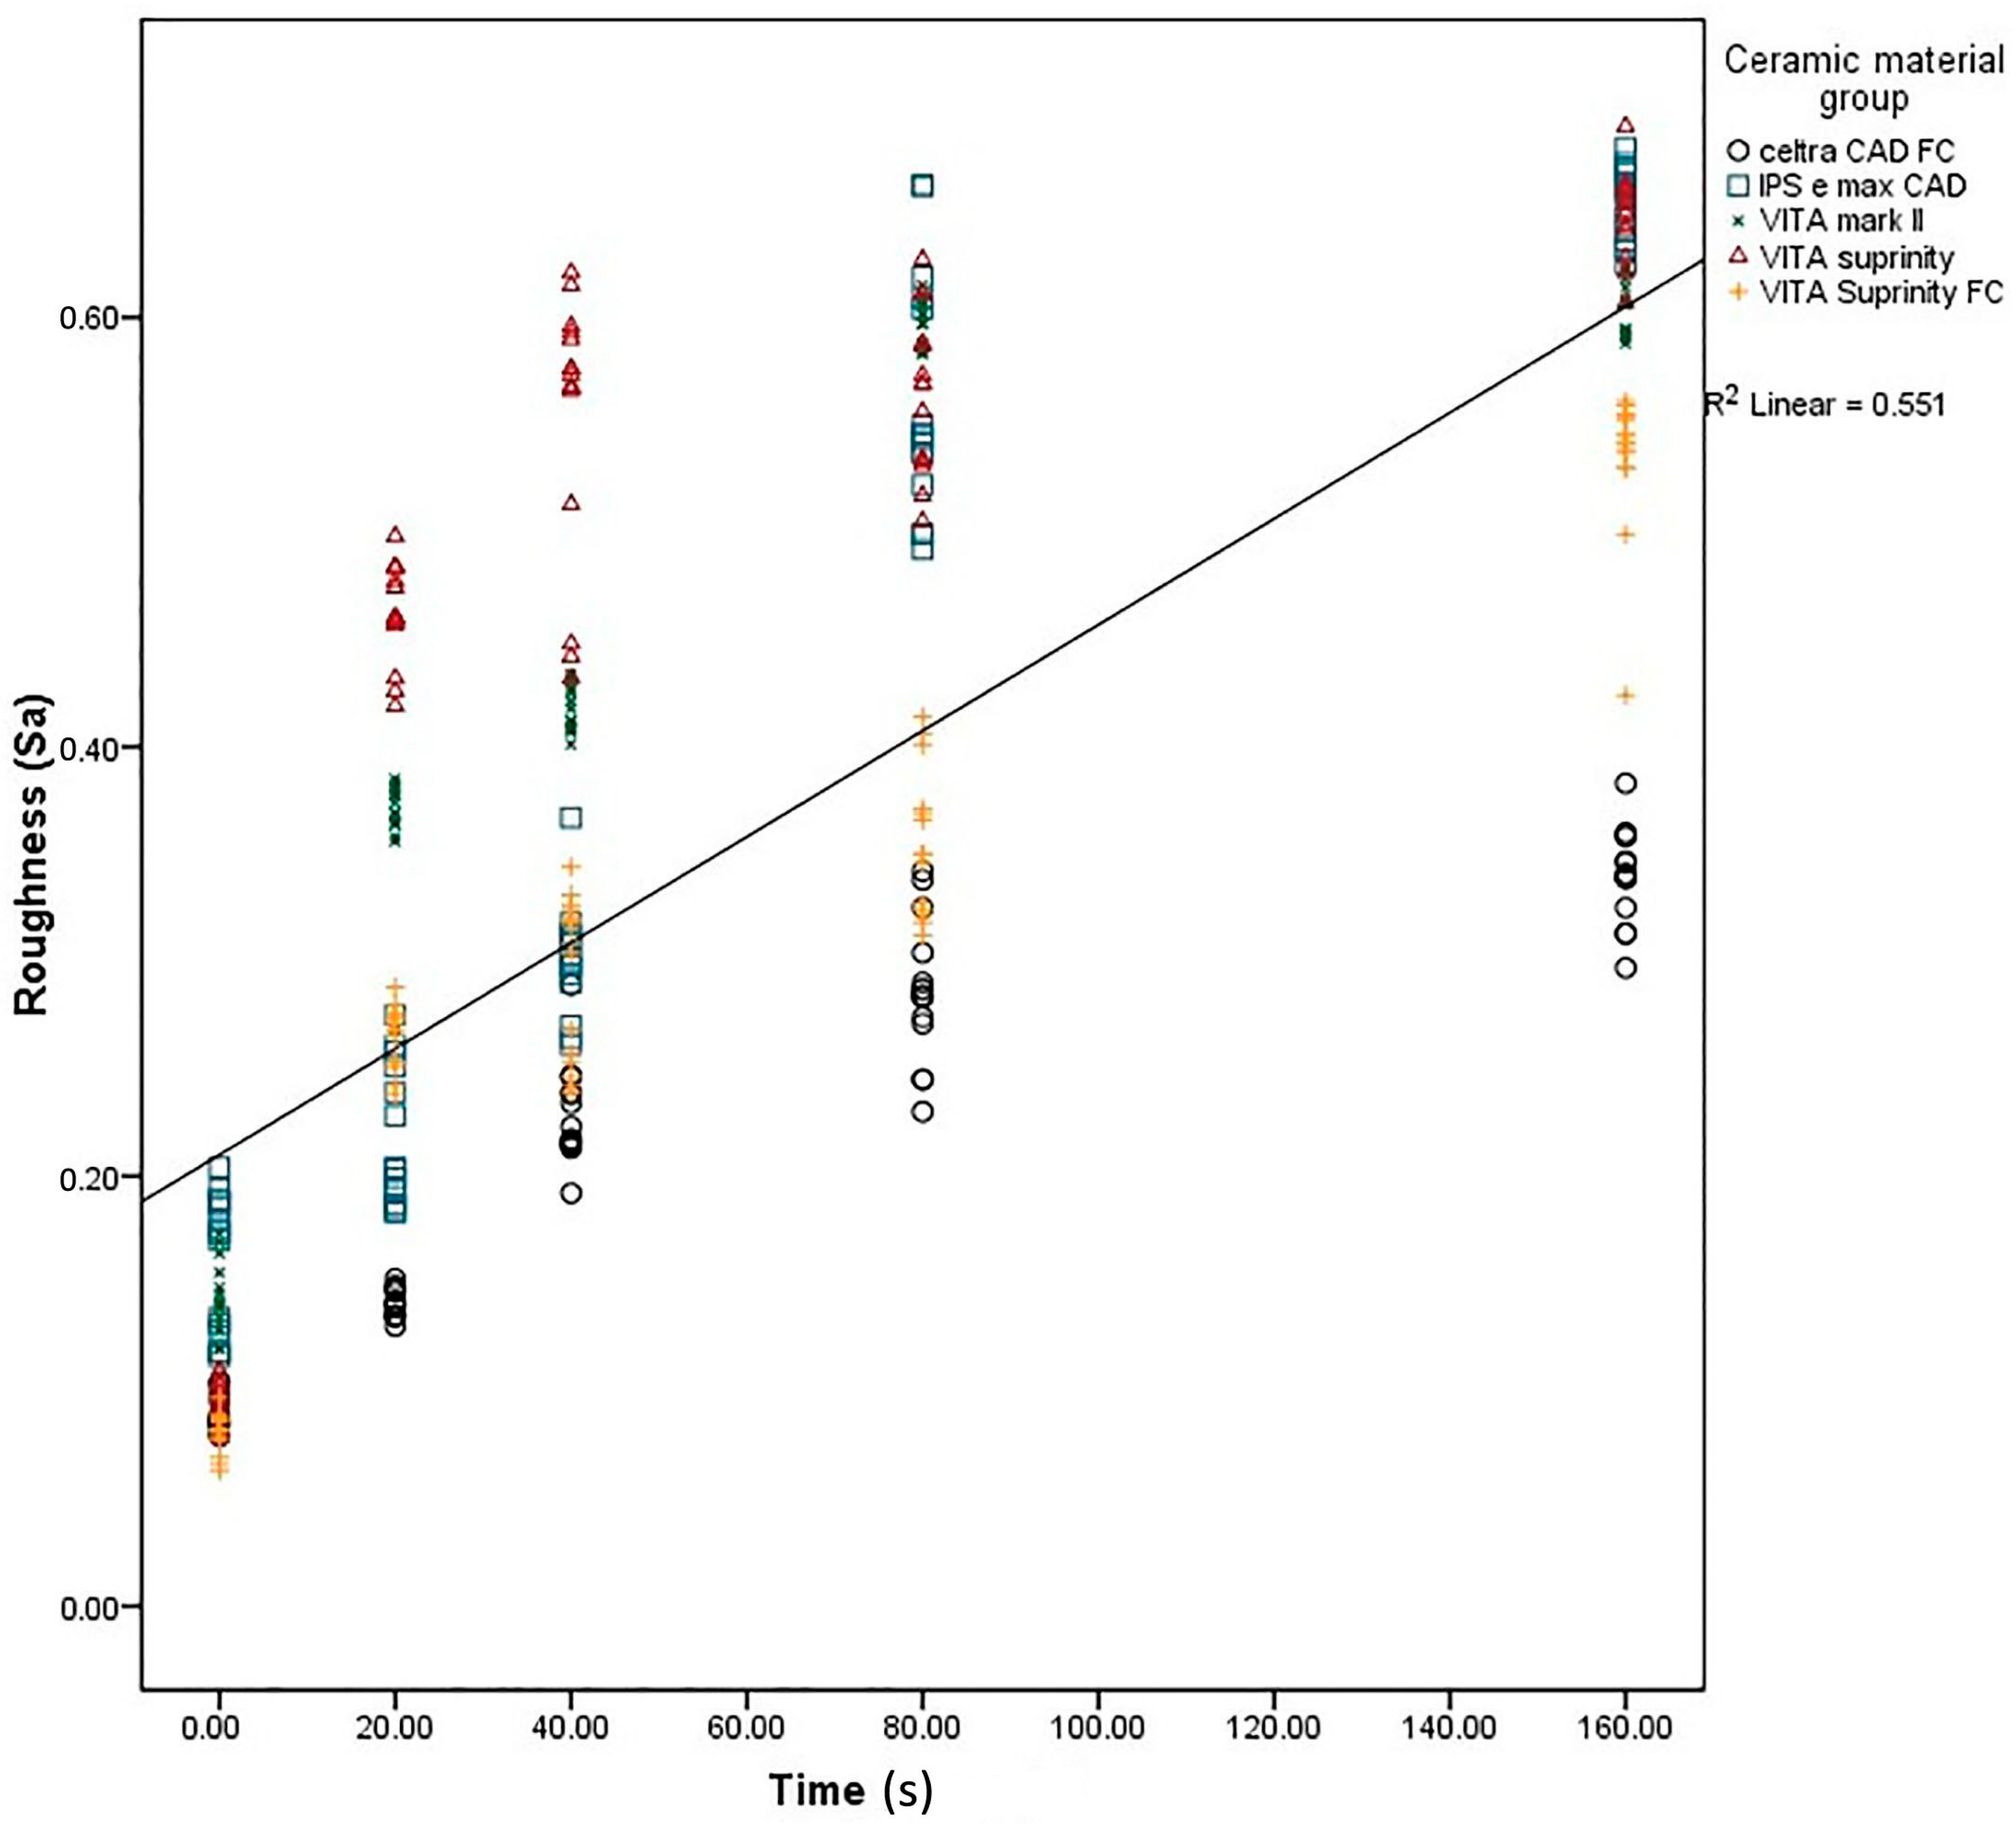
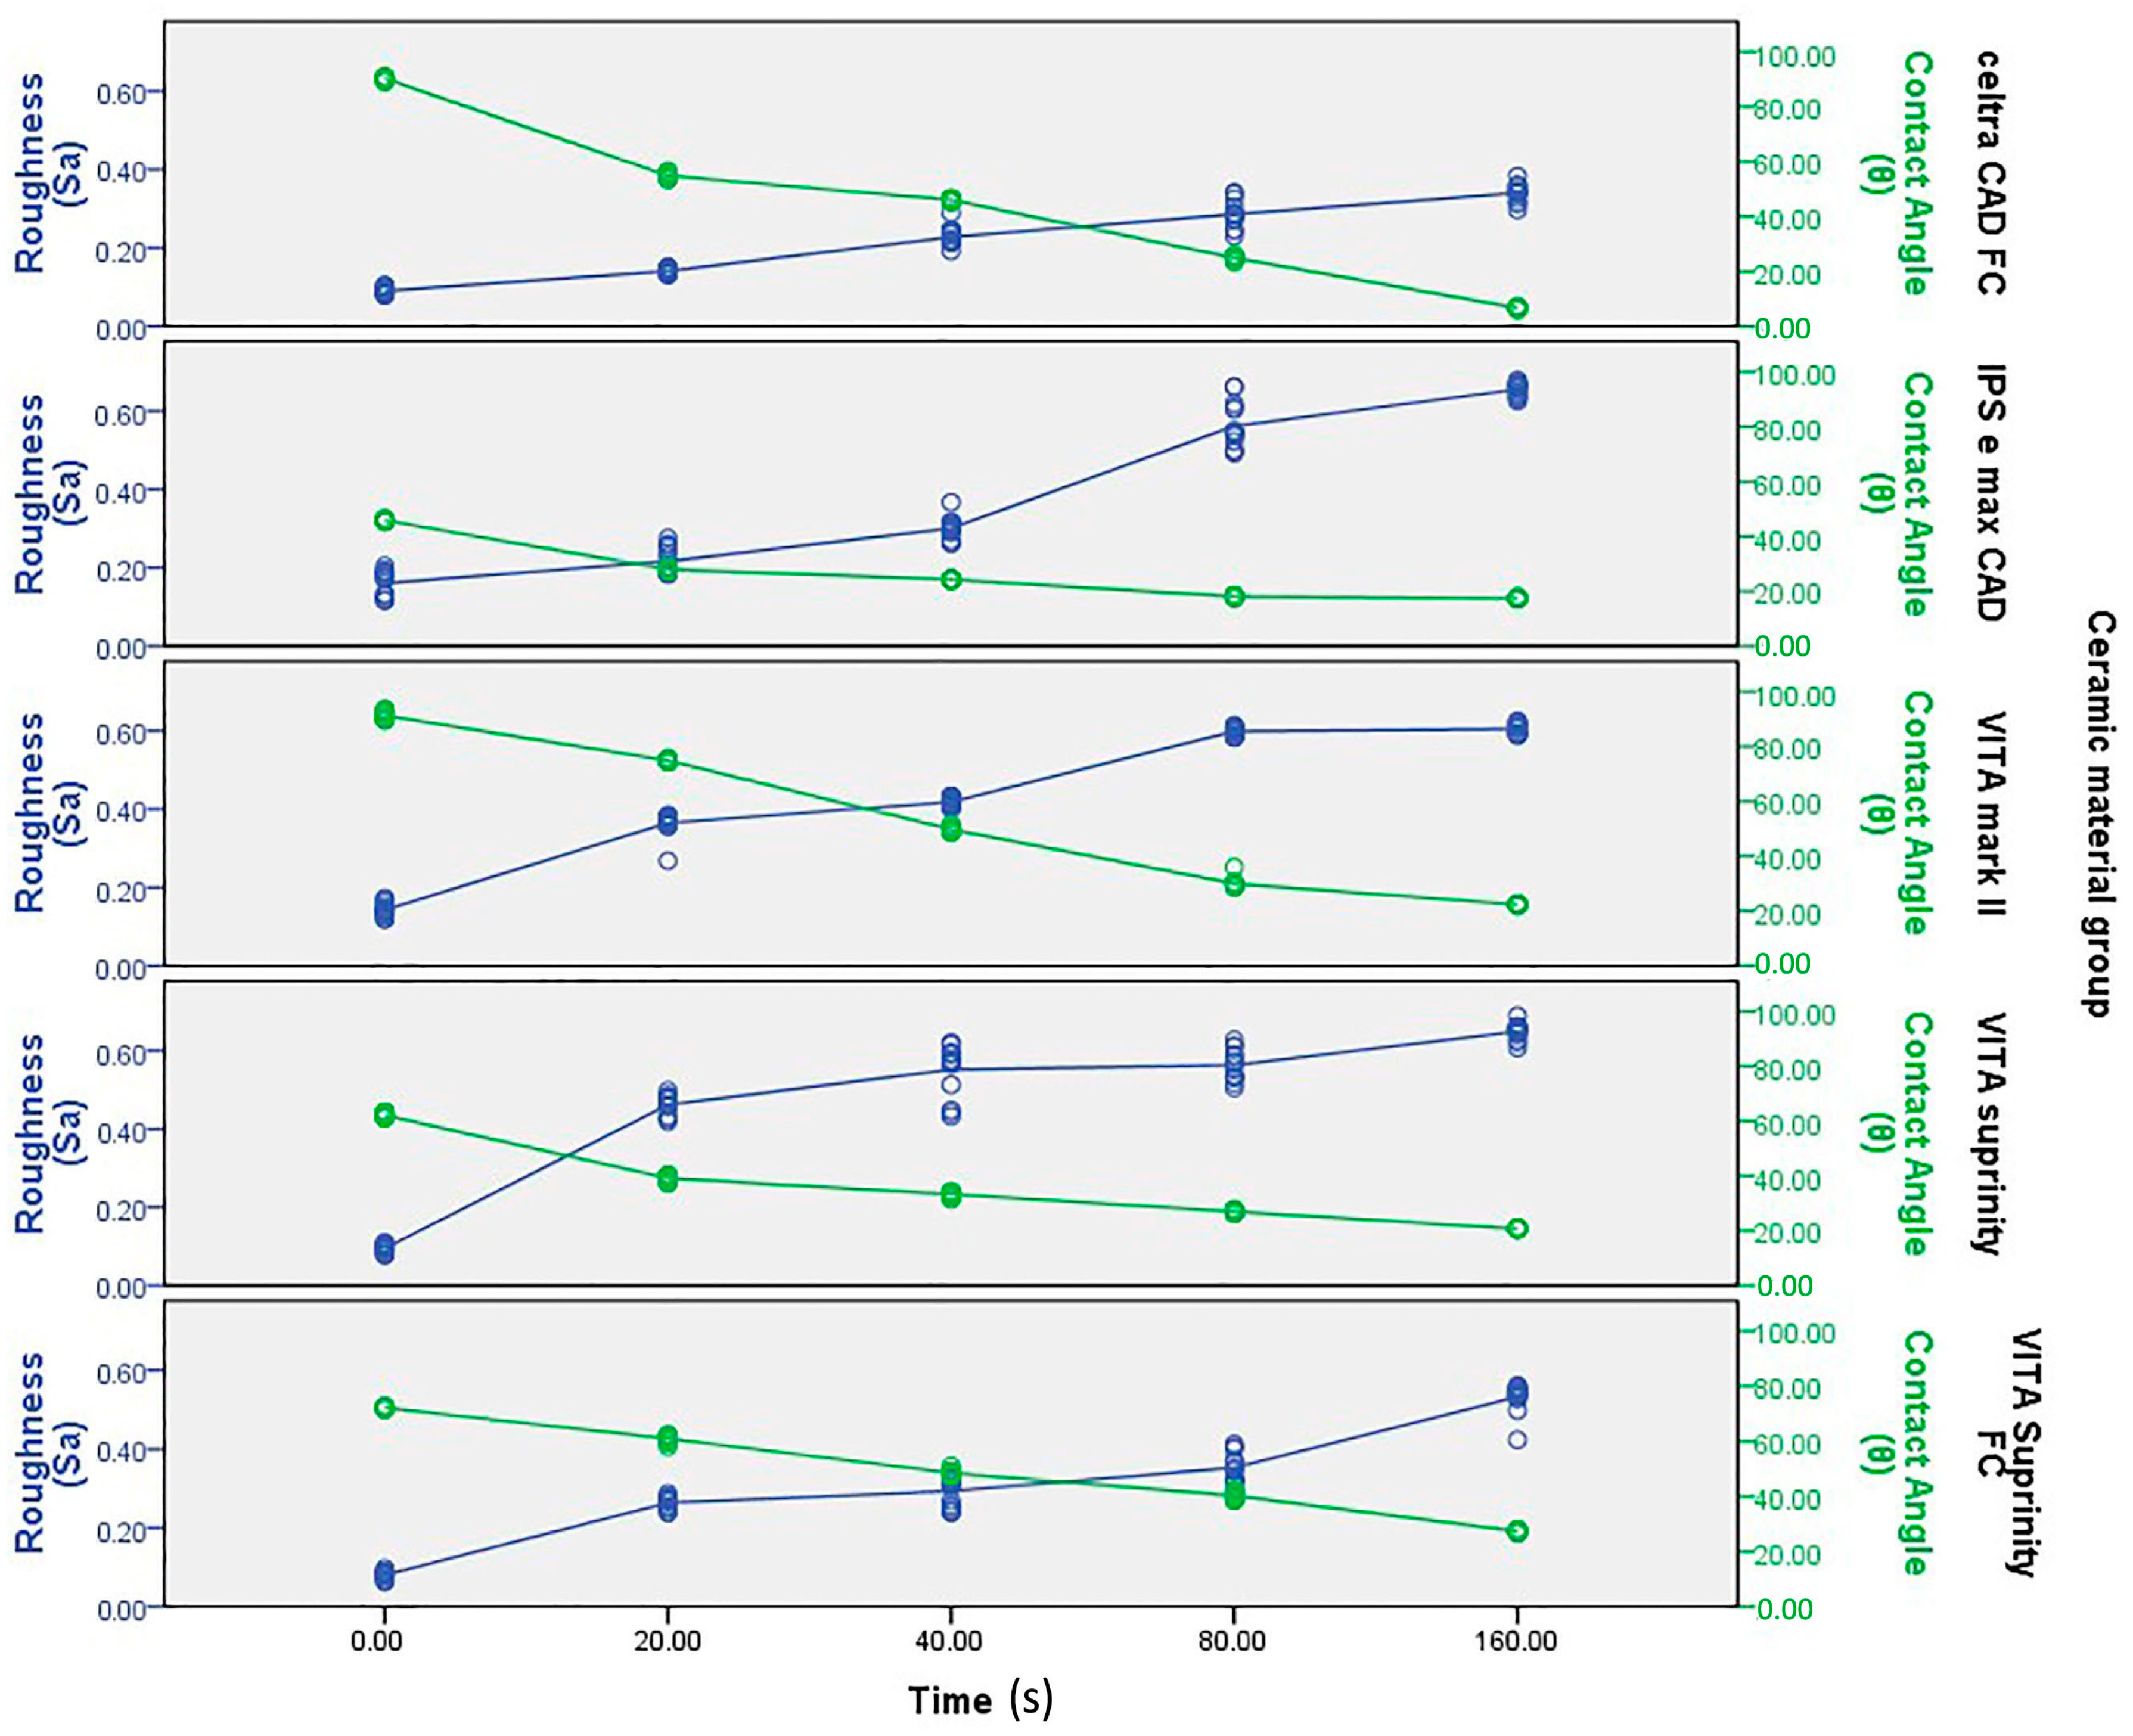
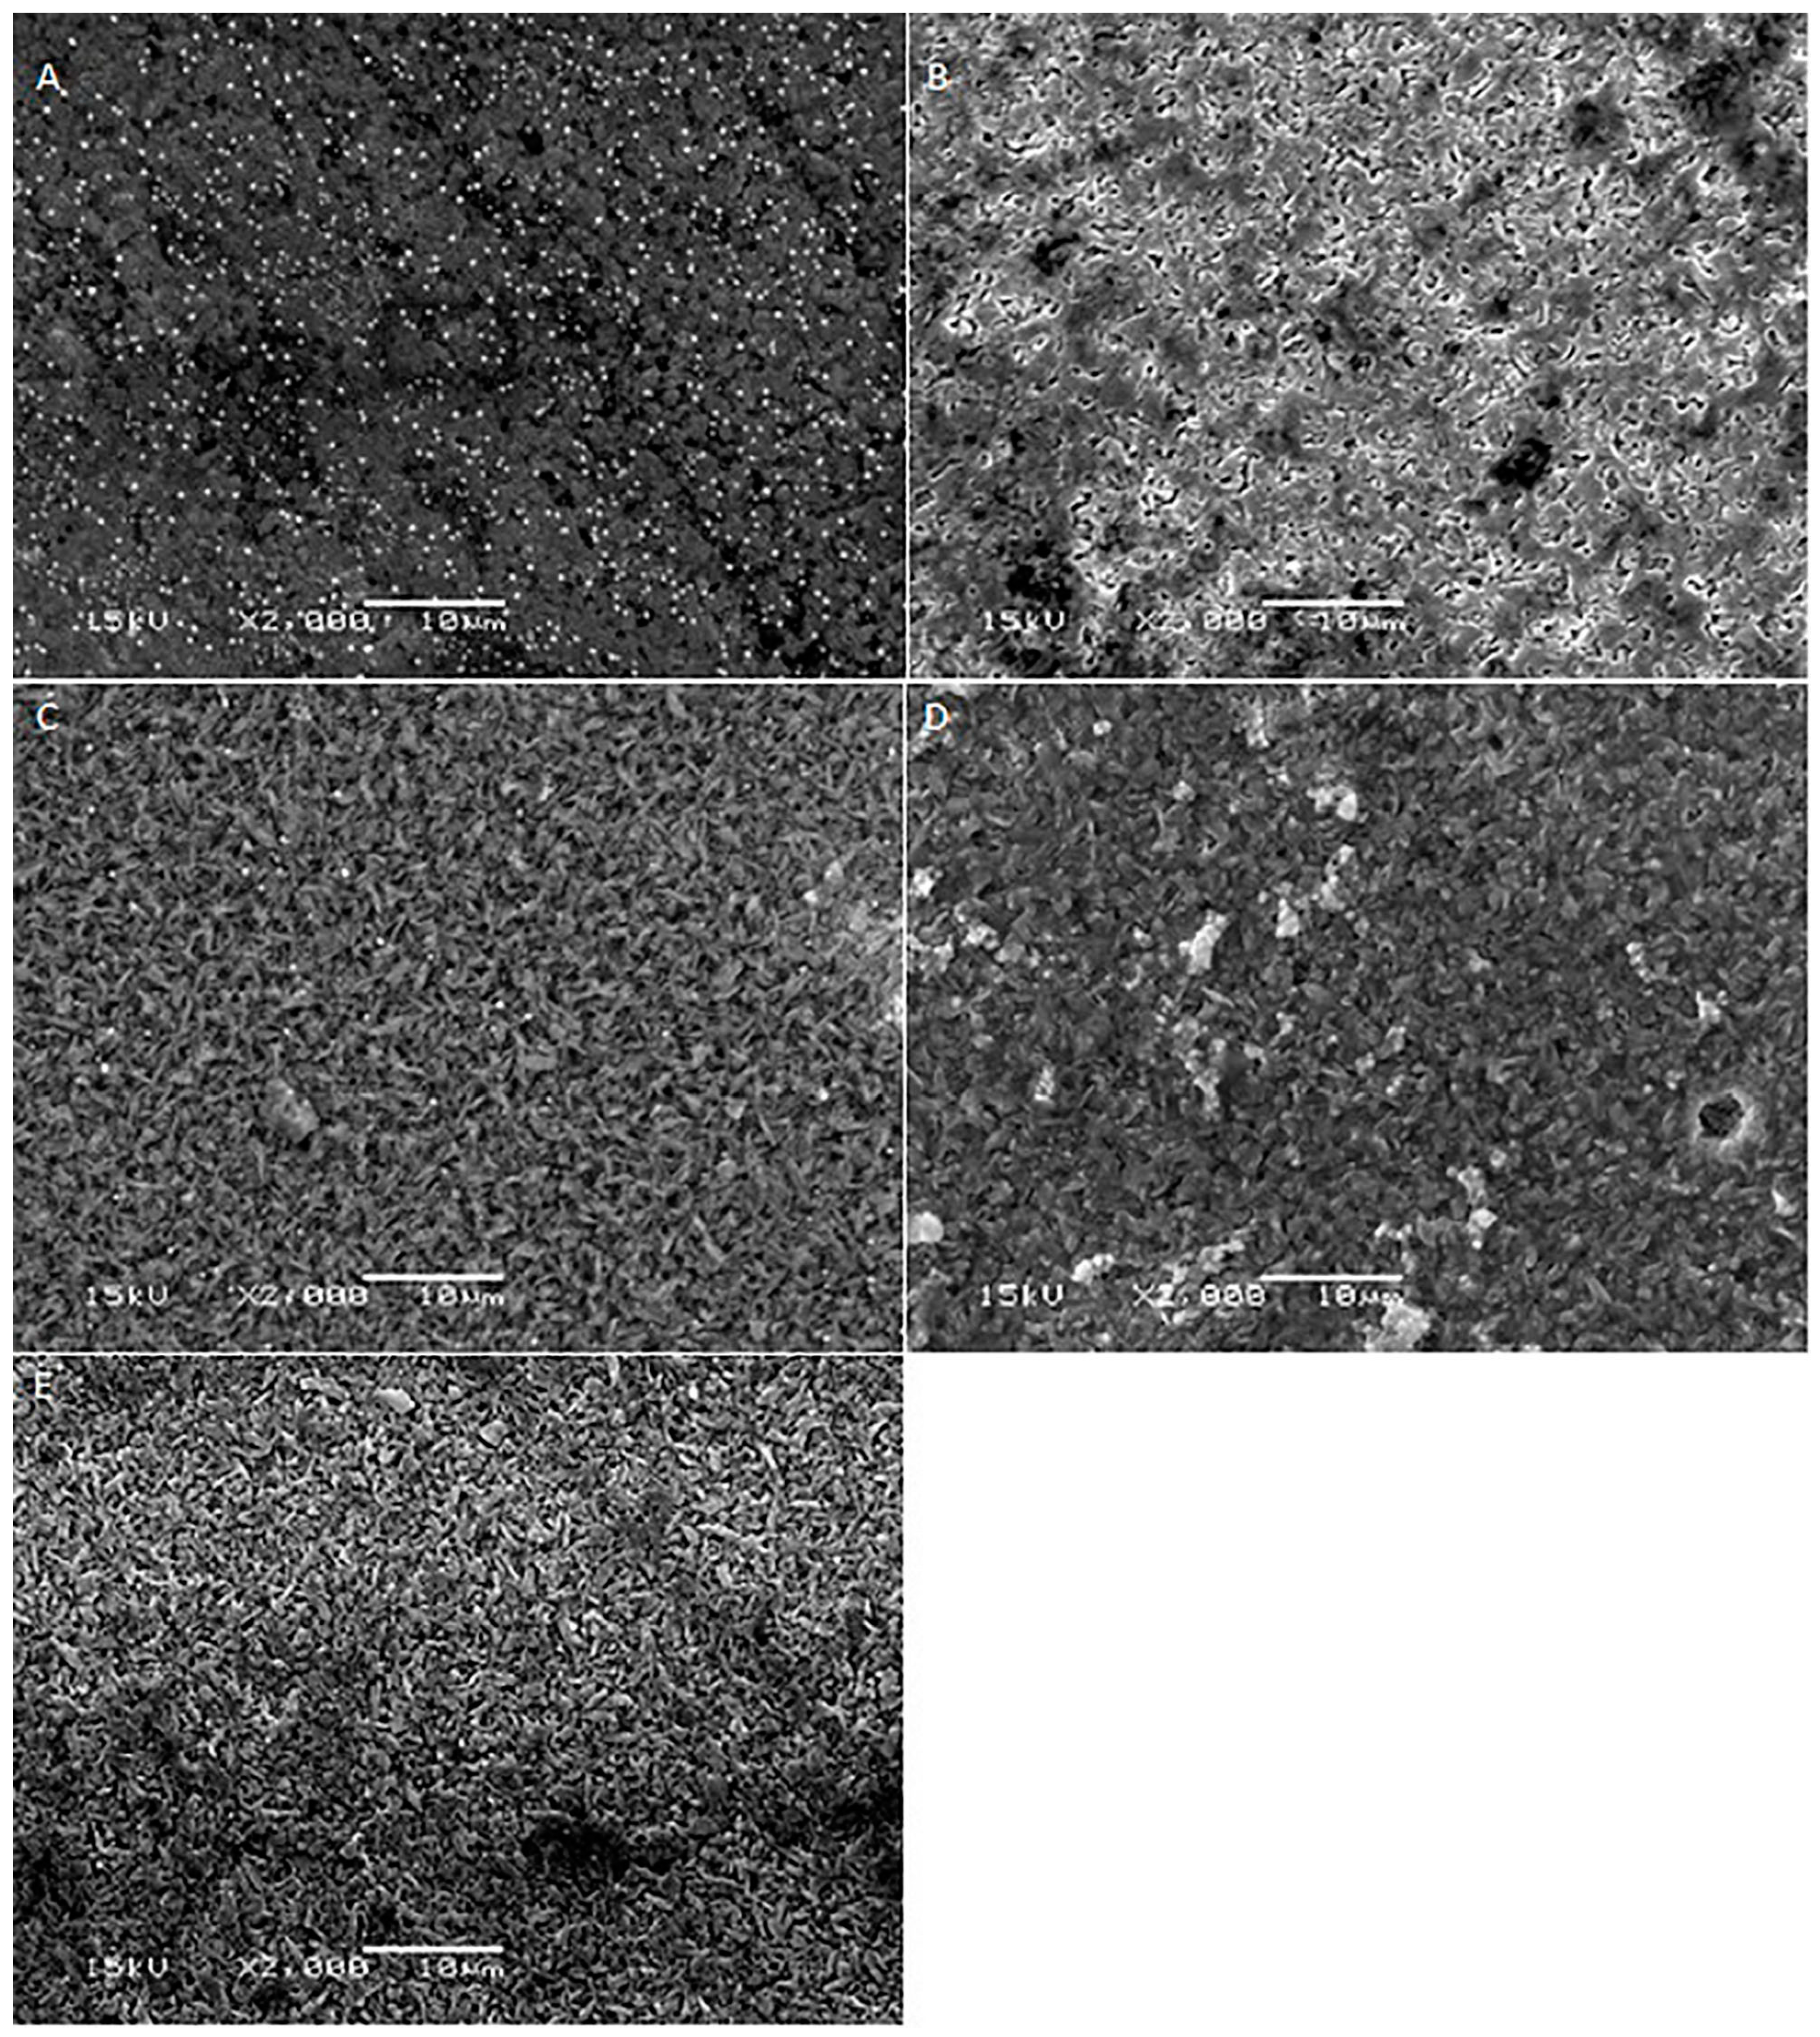
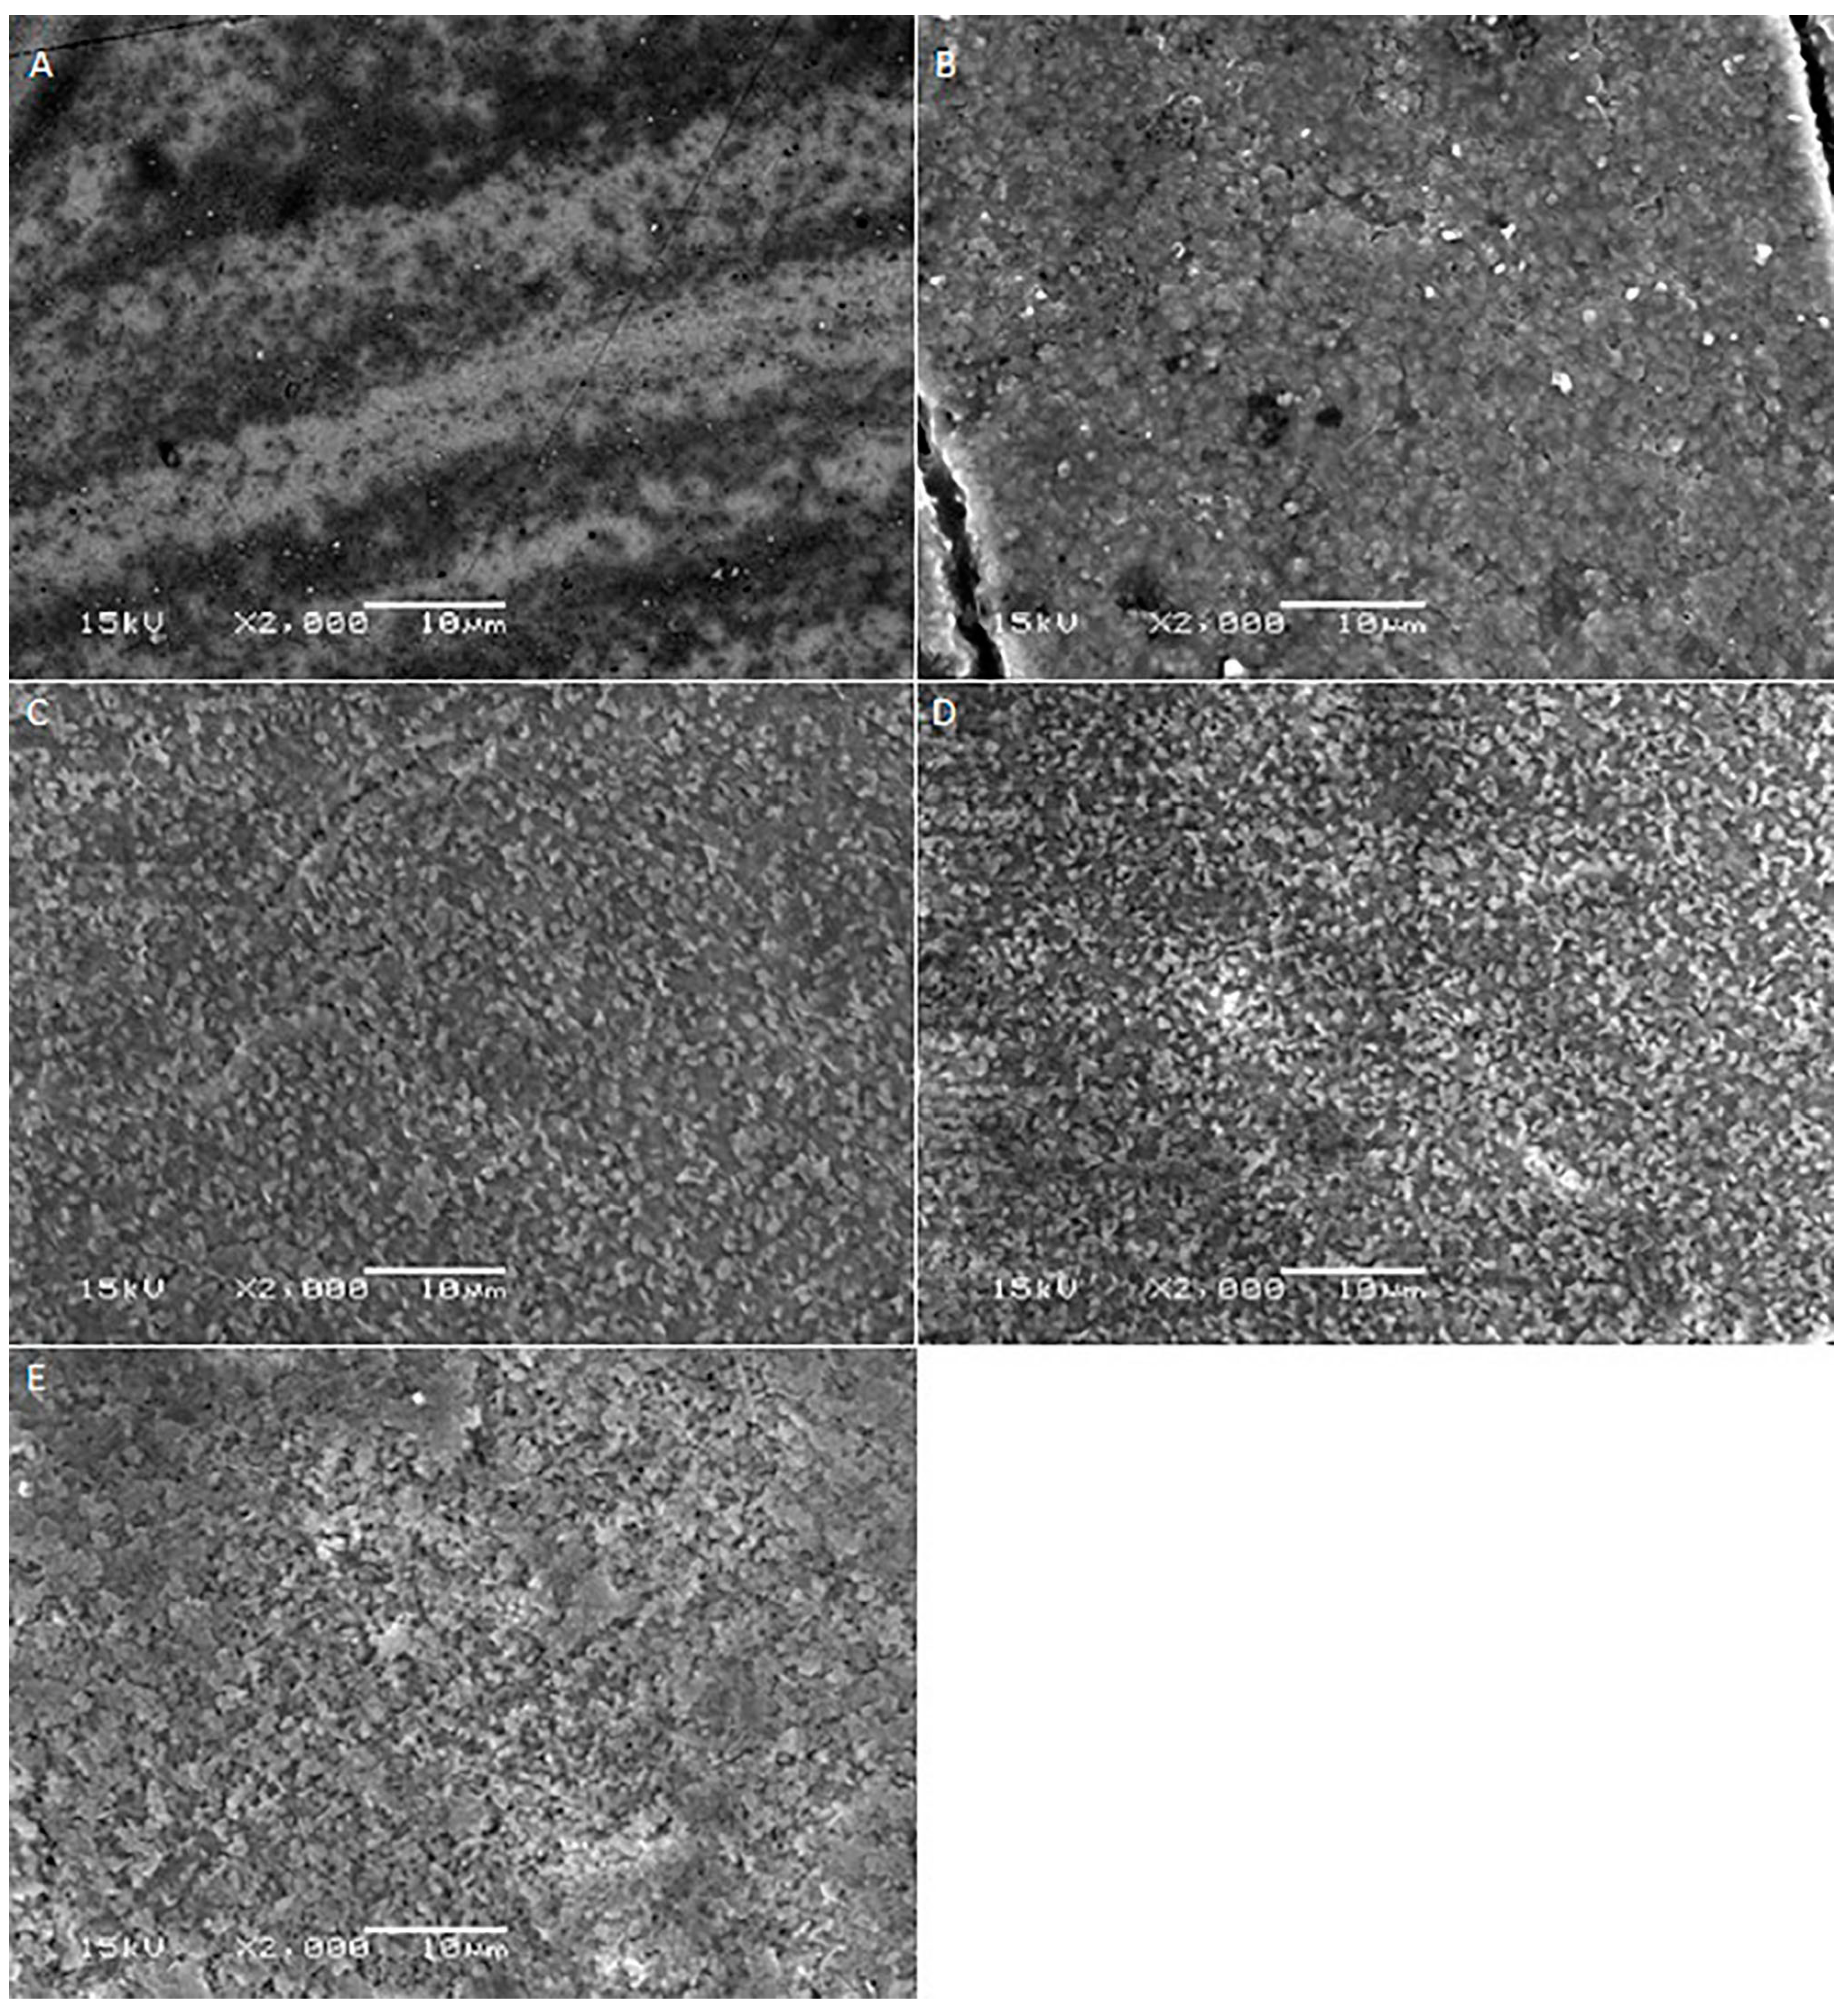
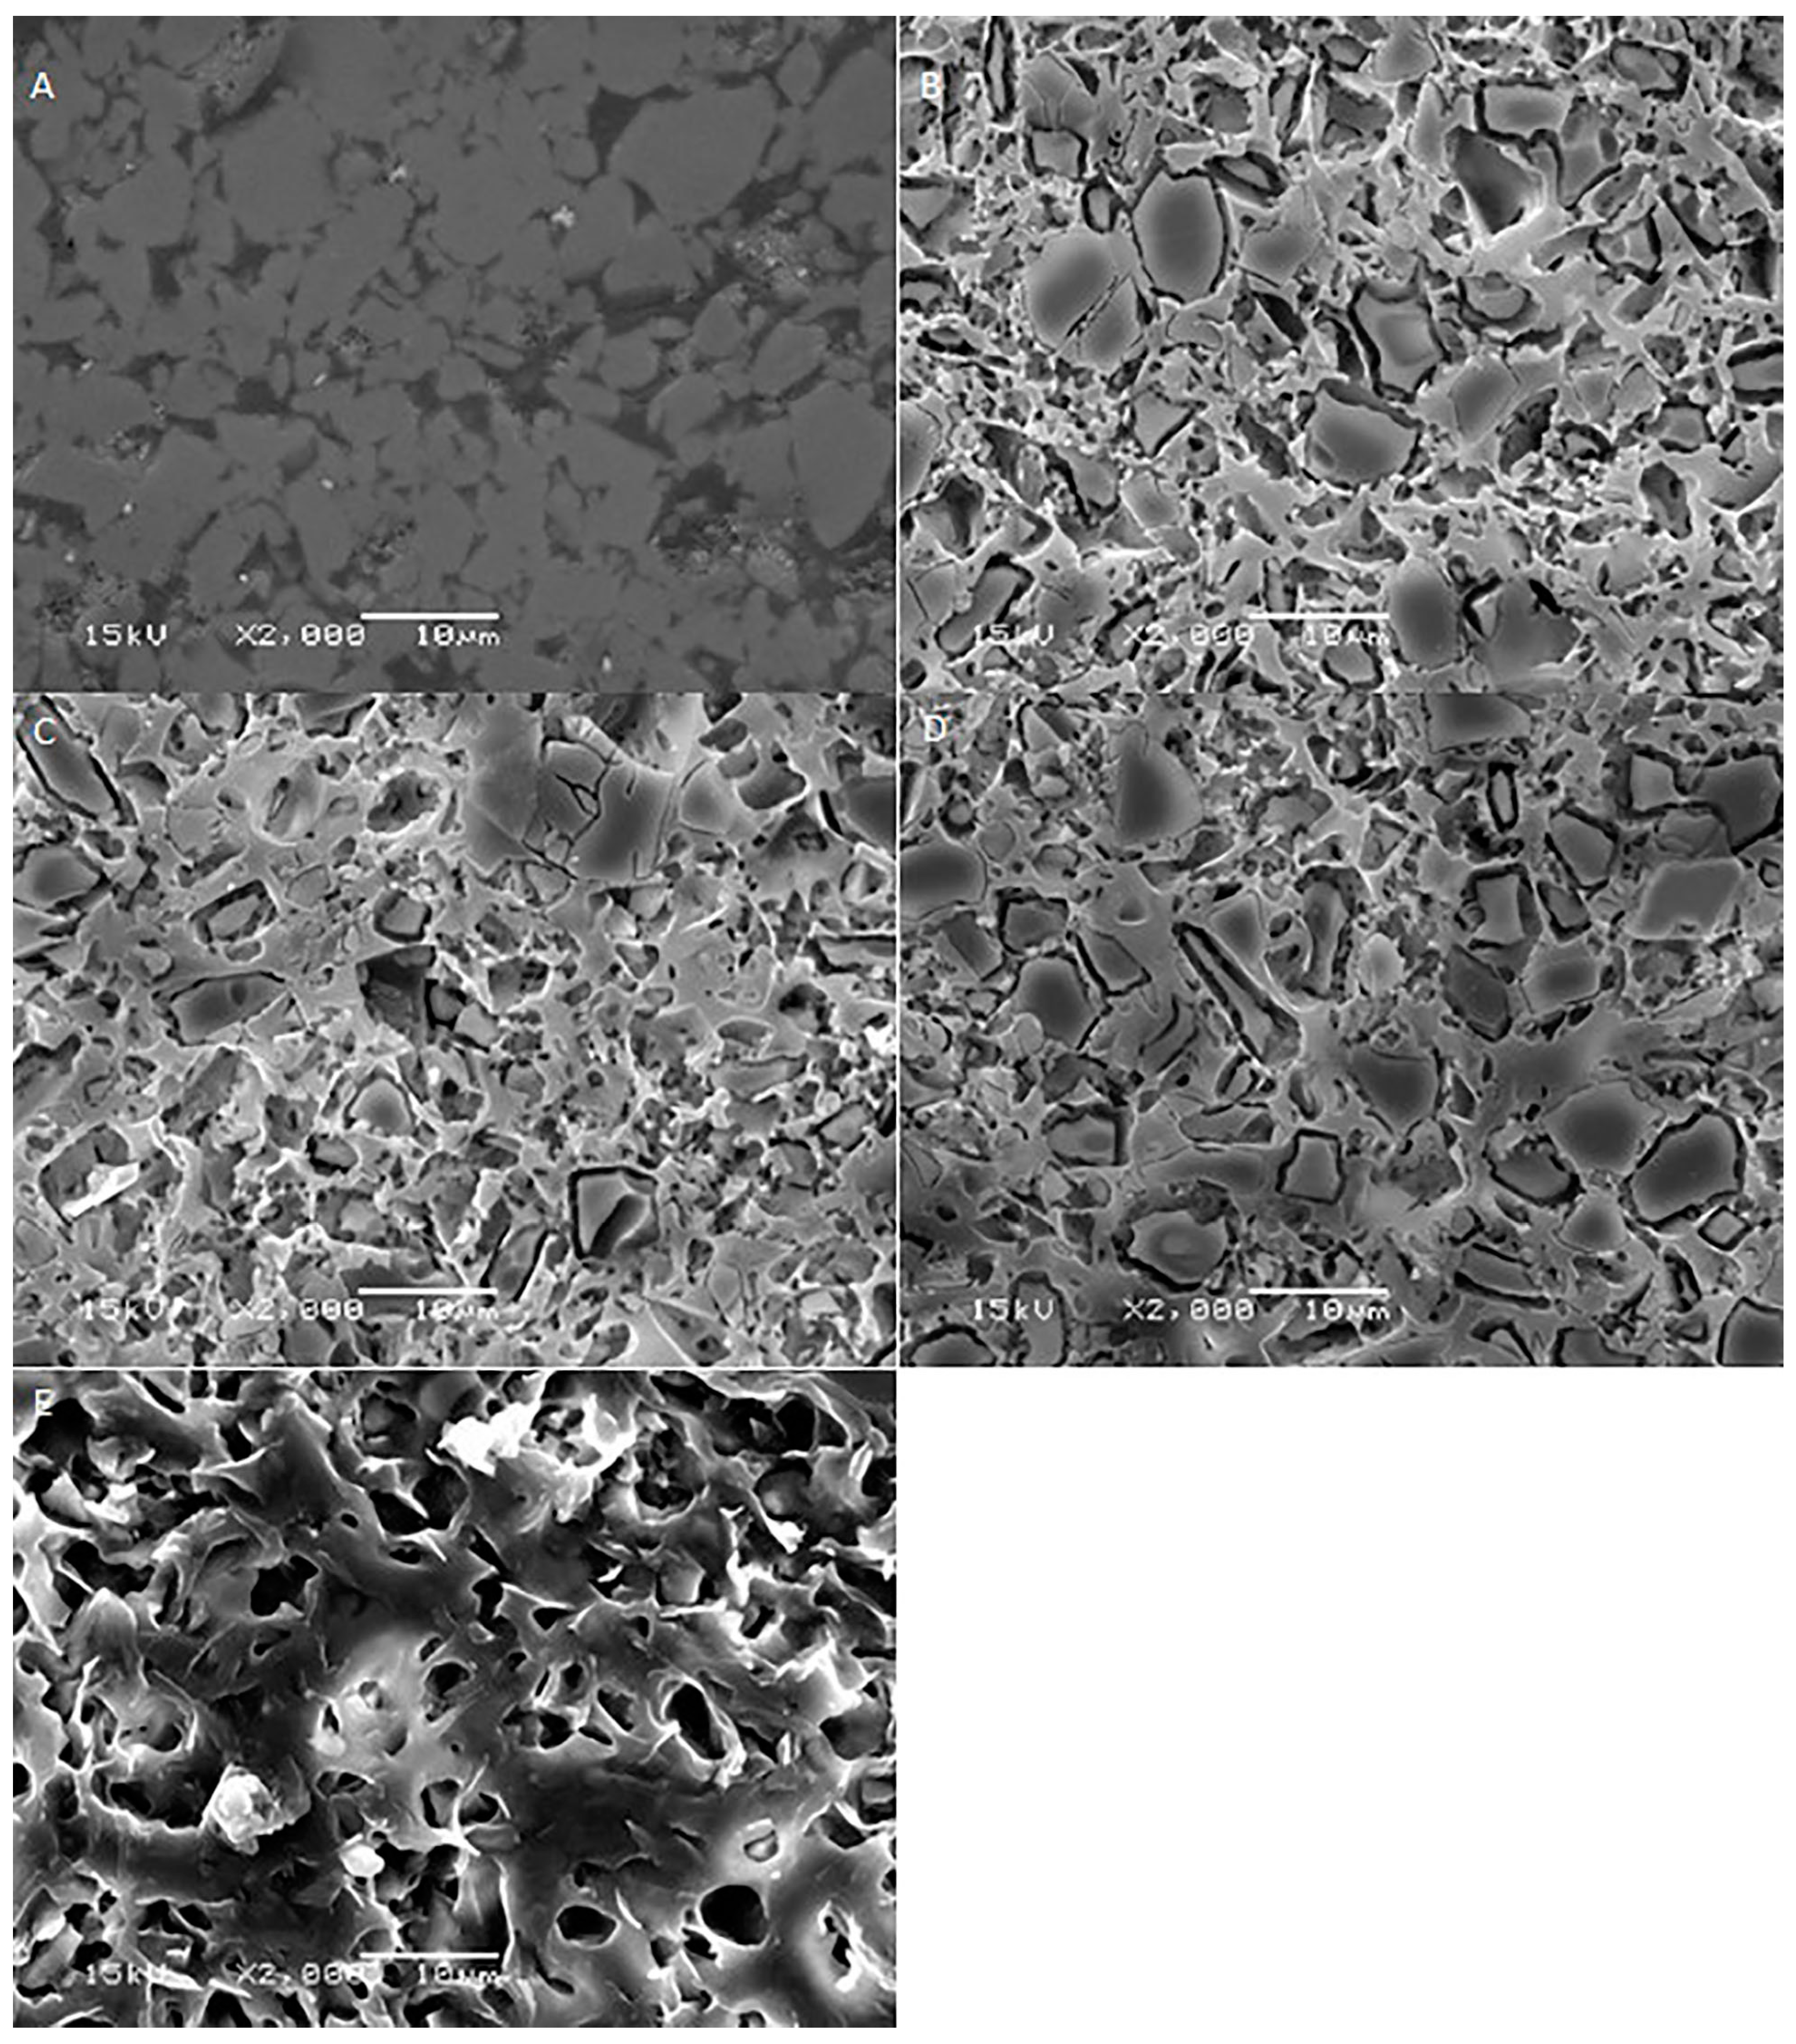
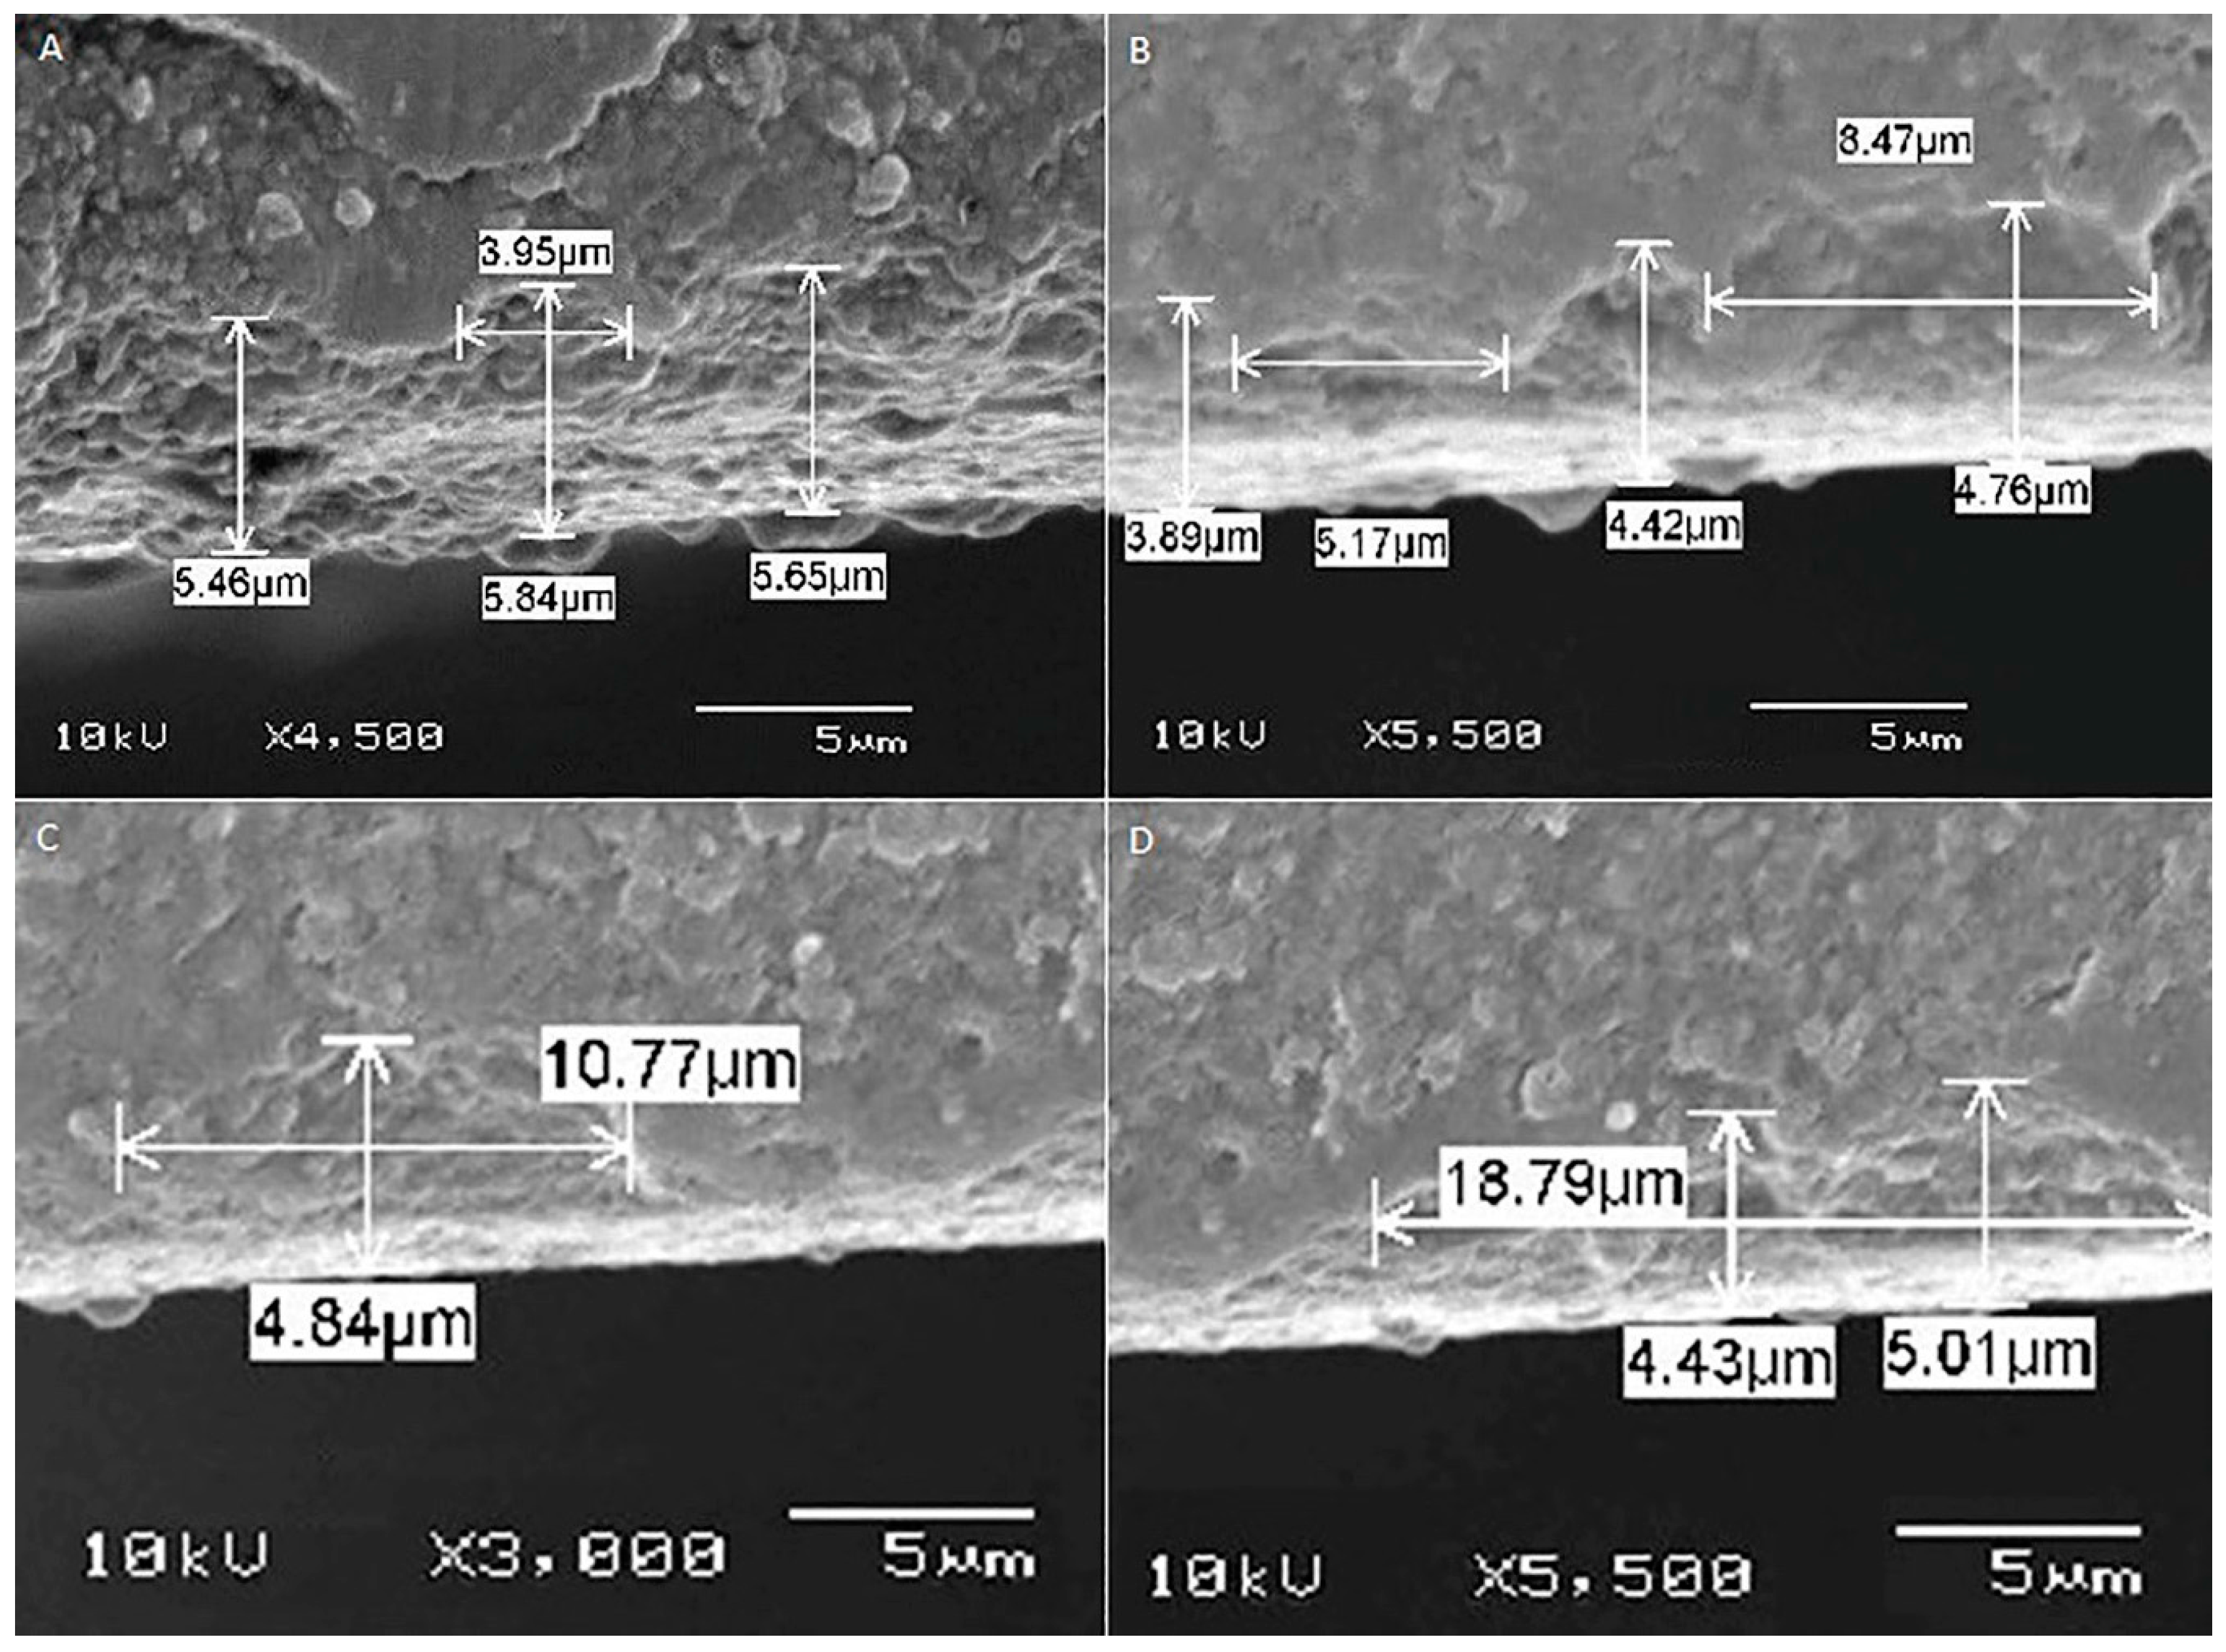
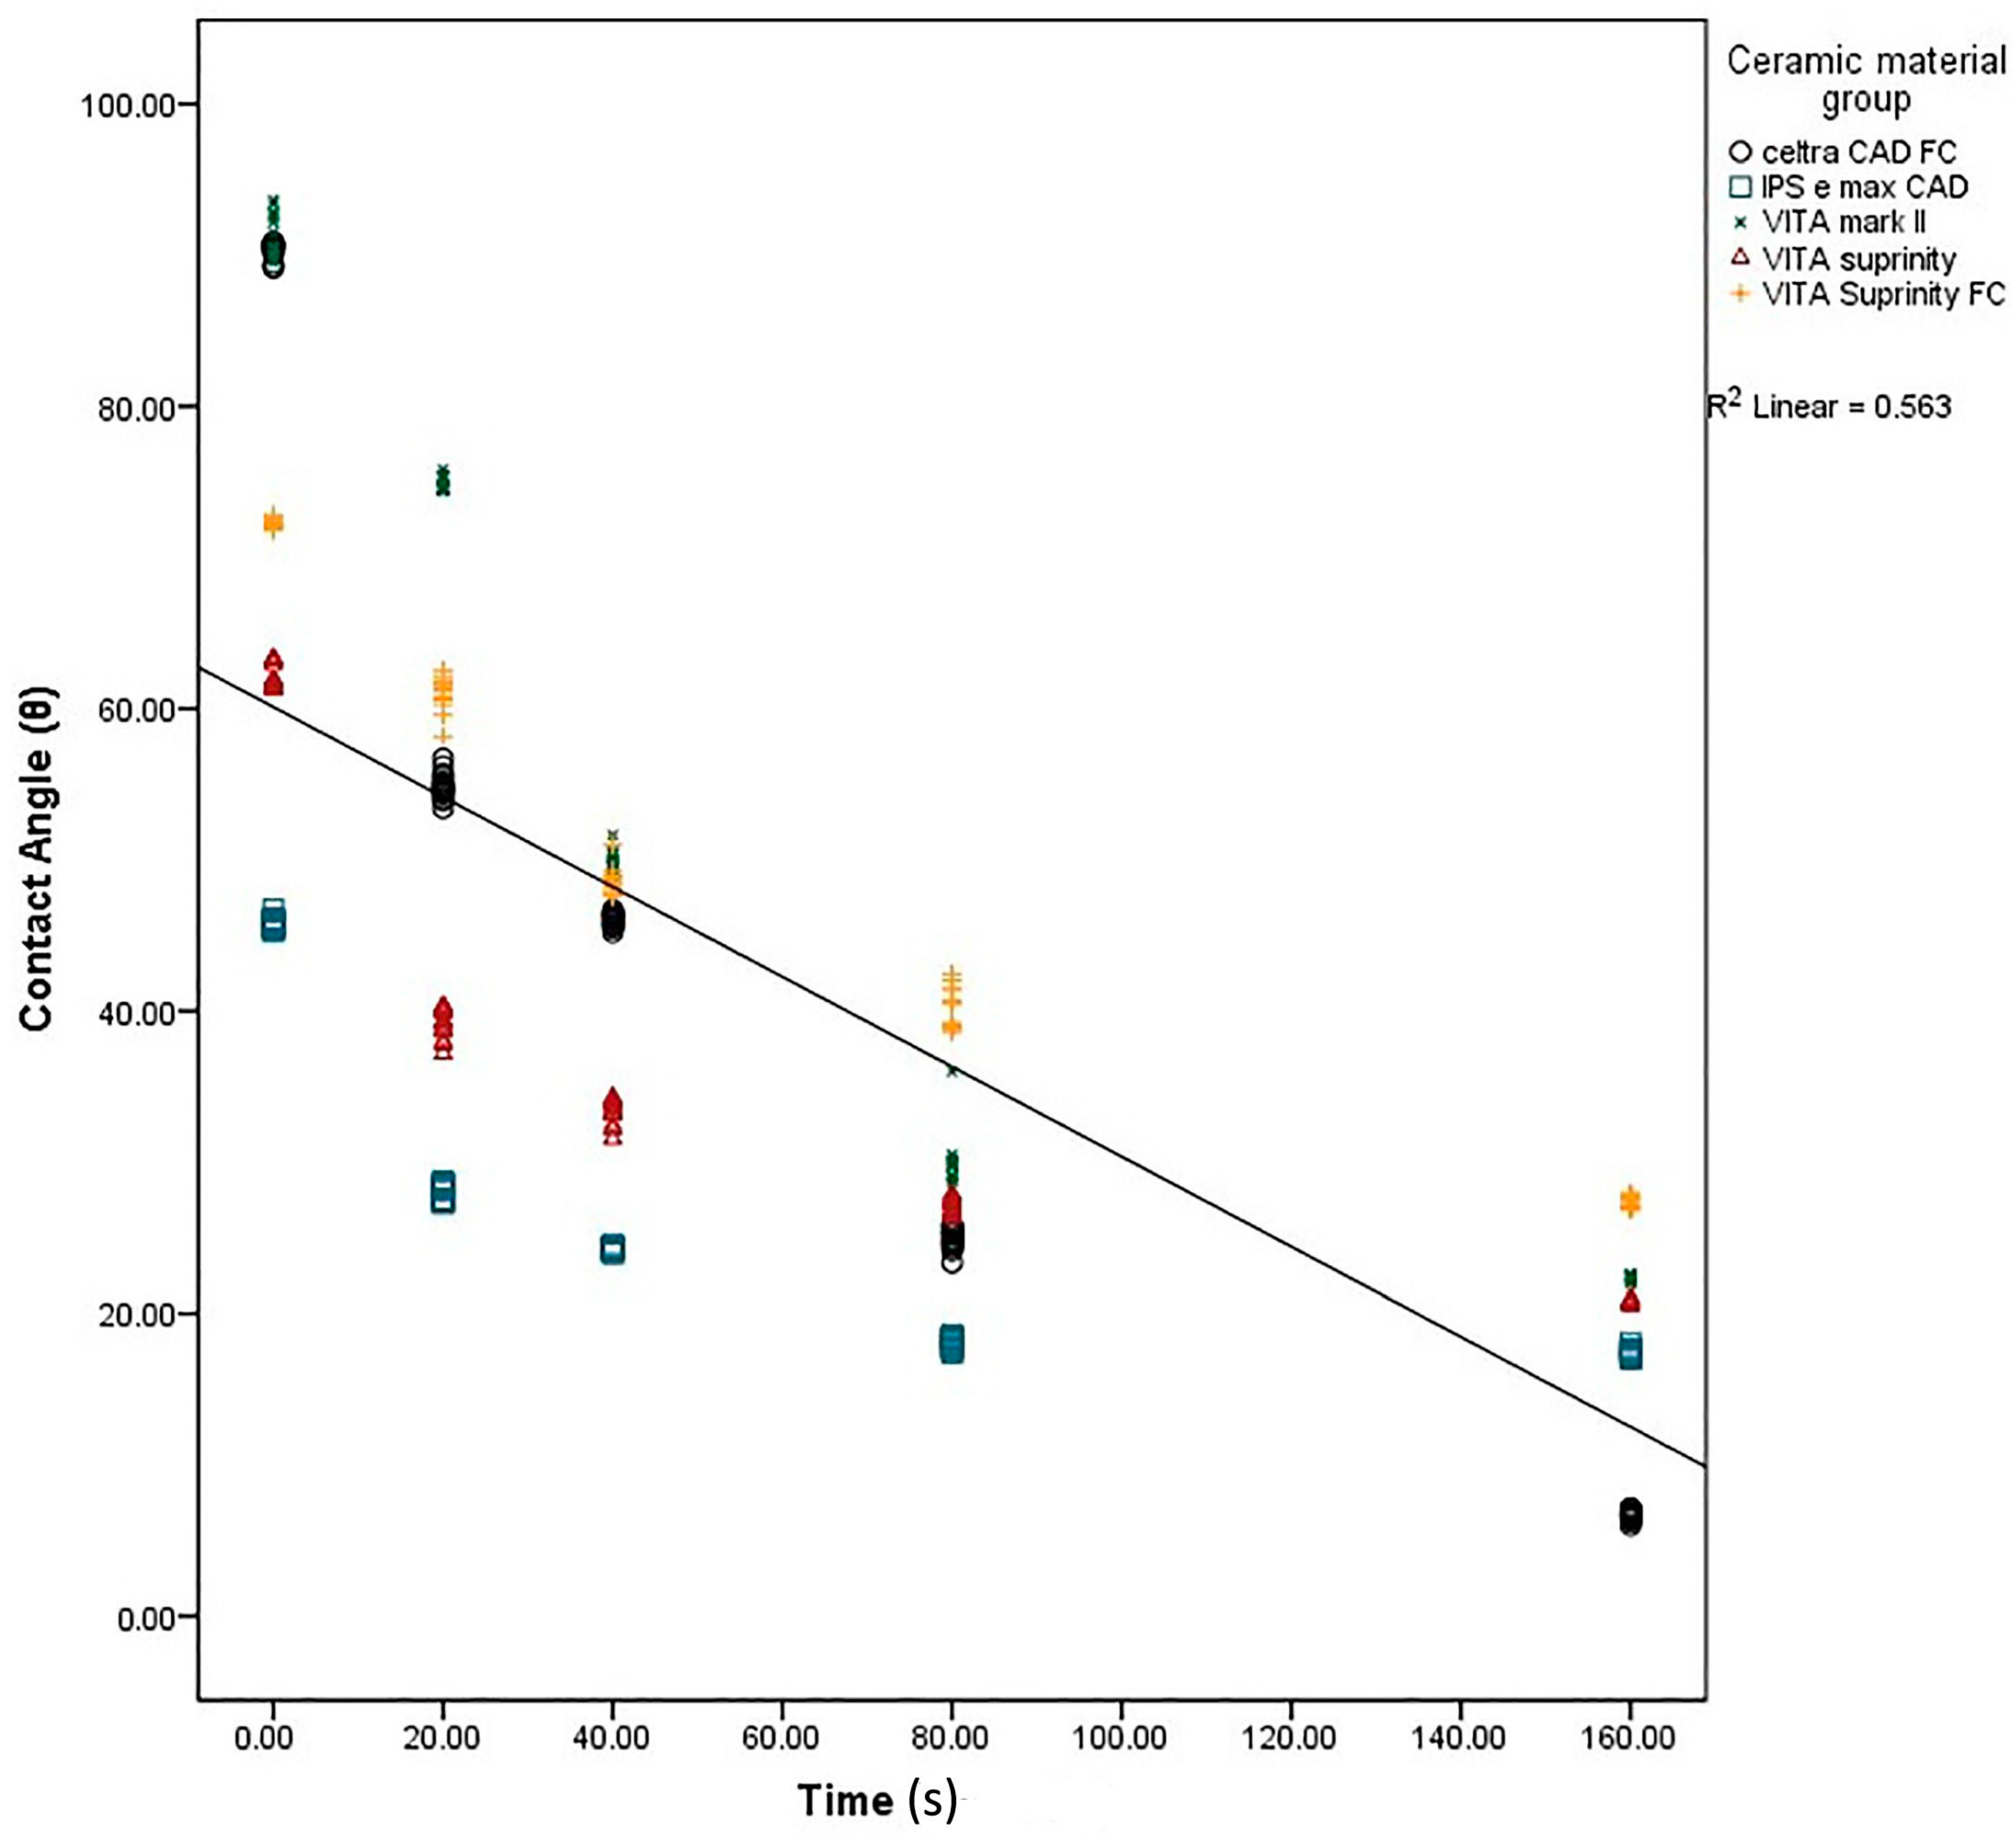
2. Results
3. Discussion
4. Materials and Methods
4.1. Materials and Study Design
4.2. Specimen Preparation
4.3. Specimen Organization and Etching Procedure
4.4. Analysis
4.5. Statistical Analysis
5. Conclusions
Acknowledgments
Author Contributions
Conflicts of Interest
Abbreviations
| CAD/CAM | computer-aided design/computer-aided machining |
| SEM | scanning electron microscope |
| Sa | surface roughness |
| CA | contact angle |
| ANOVA | analysis of variance |
References
- Ozkurt, Z.; Kazazoglu, E. Zirconia dental implants: A literature review. J. Oral. Implantol. 2011, 37, 367–376. [Google Scholar] [CrossRef] [PubMed]
- Kohal, R.J.; Klaus, G. A zirconia implant-crown system: A case report. Int. J. Periodontics. Restorative. Dent. 2004, 24, 147–153. [Google Scholar] [PubMed]
- Ho, G.W.; Matinlinna, J.P. Insights on ceramics as dental materials. Part I: Ceramic material types in dentistry. Silicon 2011, 3, 109–115. [Google Scholar] [CrossRef]
- Chaiyabutr, Y.; McGowan, S.; Phillips, K.M.; Kois, J.C.; Giordano, R.A. The effect of hydrofluoric acid surface treatment and bond strength of a zirconia veneering ceramic. J. Prosthet. Dent. 2008, 100, 194–202. [Google Scholar] [CrossRef]
- Ayad, M.F.; Fahmy, N.Z.; Rosenstiel, S.F. Effect of surface treatment on roughness and bond strength of a heat-pressed ceramic. J. Prosthet. Dent. 2008, 99, 123–130. [Google Scholar] [CrossRef]
- Matinlinna, J.P.; Vallittu, P.K. Silane based concepts on bonding resin composite to metals. J. Contemp. Dent. Pract. 2007, 8, 1–8. [Google Scholar] [PubMed]
- O’Brien, W.J. Dental Materials and Their Selection, 2nd ed.; Quintessence: Carol stream, IL, USA, 1997; pp. 259–265. [Google Scholar]
- Lung, C.Y.; Matinlinna, J.P. Aspects of silane coupling agents and surface conditioning in dentistry: An overview. Dent. Mater. 2012, 28, 467–477. [Google Scholar] [CrossRef] [PubMed]
- Qeblawi, D.M.; Muñoz, C.A.; Brewer, J.D.; Monaco, E.A., Jr. The effect of zirconia surface treatment on flexural strength and shear bond strength to a resin cement. J. Prosthet. Dent. 2010, 103, 210–220. [Google Scholar] [CrossRef]
- Höland, W.; Schweiger, M.; Frank, M.; Rheinberger, V. A comparison of the microstructure and properties of the IPS Empress 2 and the IPS Empress glass-ceramics. J. Biomed. Mater. Res. 2000, 53, 297–303. [Google Scholar] [CrossRef]
- Zogheib, L.V.; Bona, A.D.; Kimpara, E.T.; McCabe, J.F. Effect of hydrofluoric acid etching duration on the roughness and flexural strength of a lithium disilicate-based glass ceramic. Braz. Dent. J. 2011, 22, 45–50. [Google Scholar] [PubMed]
- Bona, A.D.; Anusavice, K.J. Microstructure, composition, and etching topography of dental ceramics. Int. J. Prosthodont. 2002, 15, 159–167. [Google Scholar] [PubMed]
- Ozcan, M.; Volpato, C.A. Surface conditioning protocol for the adhesion of resin-based materials to glassy matrix ceramics: How to condition and why? J. Adhes. Dent. 2015, 17, 292–293. [Google Scholar] [PubMed]
- Matinlinna, J.P.; Vallittu, P.K. Bonding of resin composites to etchable ceramic surfaces-an insight review of the chemical aspects on surface conditioning. J. Oral. Rehabil. 2007, 34, 622–630. [Google Scholar] [CrossRef] [PubMed]
- Matinlinna, J.P.; Choi, A.H.; Tsoi, J.H. Bonding promotion of resin composite to silica-coated zirconia implant surface using a novel silane system. Clin. Oral. Implants. Res. 2013, 24, 290–296. [Google Scholar] [CrossRef] [PubMed]
- Matinlinna, J.; Ozcan, M.; Lassila, L.; Kalk, W.; Vallittu, P. Effect of the cross-linking silane concentration in a novel silane system on bonding resin-composite cement. Acta. Odontol. Scand. 2008, 66, 250–255. [Google Scholar] [CrossRef] [PubMed]
- Rosen, M.R. From treating solution to filler surface and beyond: the life history of a silane coupling agent. J. Coatings. Technol. 1978, 50, 70–82. [Google Scholar]
- Matinlinna, J.P.; Lassila, L.V.; Vallittu, P.K. The effect of three silane coupling agents and their blends with a cross-linker silane on bonding a bis-GMA resin to silicatized titanium (a novel silane system). J. Dent. 2006, 34, 740–746. [Google Scholar] [CrossRef] [PubMed]
- Matinlinna, J.P.; Lassila, L.V.; Vallittu, P.K. The effect of a novel silane blend system on resin bond strength to silica-coated Ti substrate. J. Dent. 2006, 34, 436–443. [Google Scholar] [CrossRef] [PubMed]
- Della Bona, A.; Anusavice, K.J.; Hood, J.A. Effect of ceramic surface treatment on tensile bond strength to a resin cement. Int. J. Prosthodont. 2002, 15, 248–253. [Google Scholar] [PubMed]
- Matinlinna, J.P.; Tsoi, J.K.; de Vries, J.; Busscher, H.J. Characterization of novel silane coatings on titanium implant surfaces. Clin. Oral. Implants. Res. 2013, 24, 688–697. [Google Scholar] [CrossRef] [PubMed]
- Kern, M.; Thompson, V.P. Effects of sandblasting and silica-coating procedures on pure titanium. J. Dent. 1994, 22, 300–306. [Google Scholar] [CrossRef]
- Anusavice, K.J. Phillips’ Science of Dental Materials, 11th ed.; W.B. Saunders Co: Philadelphia, PA, USA, 1996; pp. 445–458. [Google Scholar]
- Matinlinna, J.P. Processing and bonding of dental ceramics. In Non-Metallic Biomaterials for Tooth Repair and Replacement, 1st ed.; Vallittu, P., Ed.; Woodhead Publishing Limited: Philadelphia, PA, USA, 2013; pp. 129–160. [Google Scholar]
- Della Bona, A.; van Noort, R. Ceramic surface preparations for resin bonding. Am. J. Dent. 1998, 11, 276–280. [Google Scholar] [PubMed]
- Ho, G.M.; Matinlinna, J.P. Insights on ceramics as dental materials. Part II: Chemical surface treatments. Silicon 2011, 3, 117–123. [Google Scholar] [CrossRef]
- Xiaoping, L.; Dongfeng, R.; Silikas, N. Effect of etching time and resin bond on the flexural strength of IPS e.max Press glass ceramic. Dent. Mater. 2014, 30, 330–336. [Google Scholar] [CrossRef] [PubMed]
- Ren, D.F.; Luo, X.P. Effect of hydrofluoric acid etching time and resin bonding on the flexural strength of lithium disilicate glass ceramic. Zhonghua Kou Qiang Yi Xue Za Zhi 2013, 48, 462–466. (In Chinese) [Google Scholar] [PubMed]
- Colares, R.C.; Neri, J.R.; Souza, A.M.; Pontes, K.M.; Mendonça, J.S.; Santiago, S.L. Effect of surface pretreatments on the microtensile bond strength of lithium-disilicate ceramic repaired with composite resin. Braz. Dent. J. 2013, 24, 349–352. [Google Scholar] [CrossRef] [PubMed]
- Addison, O.; Marquis, P.M.; Fleming, G.J. The impact of hydrofluoric acid surface treatments on the performance of a porcelain laminate restorative material. Dent. Mater. 2007, 23, 461–468. [Google Scholar] [CrossRef] [PubMed]
- Stawarczyk, B.; Hristova, E.; Sener, B.; Roos, M.; Edelhoff, D.; Keul, C. Effect of hydrofluoric acid etching duration on fracture load and surface properties of three CAD/CAM glass-ceramics. Oral. Health. Dent. Manag. 2014, 13, 1131–1139. [Google Scholar]
- Kang, S.H.; Chang, J.; Son, H.H. Flexural strength and microstructure of two lithium disilicate glass ceramics for CAD/CAM restoration in the dental clinic. Restor. Dent. Endod. 2013, 38, 134–140. [Google Scholar] [CrossRef] [PubMed]
- Sakaki, T.; Fukushima, T.; Kawai, S.; Matsumoto, M. Effect of physical properties of direct bonding adhesives on bonding to etched enamel. J. Prosthet. Dent. 1994, 71, 552–559. [Google Scholar] [CrossRef]
- Stacey, G.D. A shear stress analysis of the bonding of porcelain veneers to enamel. J. Prosthet. Dent. 1993, 70, 395–402. [Google Scholar] [CrossRef]
- Nagi, T.; Kawamoto, Y. Effect of hydrofluoric acid etching on bond strength of composite luting agent to lithium disilicate ceramics material. Int. Chin. J. Dent. 2004, 4, 100–106. [Google Scholar]
- Zarone, F.; Sorrentino, R.; Vaccaro, F.; Traini, T.; Russo, S.; Ferrari, M. Acid etching surface treatment of feldspathic, alumina and zirconia ceramics: A micro-morphological SEM analysis. Int. Dent. S. Afr. 2006, 8, 1–5. [Google Scholar]
- Aboushelib, M.; Ghoniem, M.; Mirmohammadi, H.; Salameh, Z. General principles for achieving adequate bond to all-ceramic restorations. J. Dent. Oral. Hyg. 2009, 1, 36–41. [Google Scholar]
- Poorzamani, M.; Sanaye, V.M.; Alizadeh, S.E.; Kohkan, S. Effect of acidulated phosphate fluoride (APF) etching duration on the shear bond strength between a lithium disilicate-based glass ceramic and composite resin. J. Res. Dent. Sci. 2015, 12, 1–5. [Google Scholar]
- Chen, T.M.; Brauer, G.M. Solvent effects on bonding organo-silane to silica surfaces. J. Dent. Res. 1982, 61, 1439–1443. [Google Scholar] [CrossRef] [PubMed]
- Stangel, I.; Nathanson, D.; Hsu, C.S. Shear strength of the composite bond to etched porcelain. J. Dent. Res. 1987, 66, 1460–1465. [Google Scholar] [CrossRef] [PubMed]
- Calamia, J.; Vaidyanathan, J.; Vaidyanathan, T.K.; Hirsch, S.M. Shear bond strength of etched porcelains. J. Dent. Res. 1985, 64, 296. [Google Scholar]
- Della Bona, A.; van Noort, R. Shear vs. tensile bond strength of resin composite bonded to ceramic. J. Dent. Res. 1995, 74, 1591–1596. [Google Scholar] [CrossRef] [PubMed]
- Posritong, S.; Borges, A.L.S.; Chu, T.G.; Eckert, G.J.; Bottino, M.A.; Bottino, M.C. The impact of hydrofluoric acid etching followed by unfilled resin on the biaxial strength of a glass-ceramic. Dent. Mater. 2013, 29, e281–e290. [Google Scholar] [CrossRef] [PubMed]
- Prado Sato, T.; Cotes, C.; Yamamoto, L.T.; Rossi, N.R.; Macedo, V.C.; Kimpara, E.T. Flexural strength of a pressable lithium disilicate ceramic: influence of surface treatments. Appl. Adhesion Sci. 2013, 1, 1–5. [Google Scholar]
- Wolf, D.M.; Powers, J.M.; O′Keefe, K.L. Bond strength of composite to etched and sandblasted porcelain. Am. J. Dent. 1993, 6, 155–158. [Google Scholar] [PubMed]
- Hooshmand, T.; Parvizi, S.; Keshvad, A. Effect of surface acid etching on the biaxial flexural strength of two hot-pressed glass ceramics. J. Prosthodont. 2008, 17, 415–419. [Google Scholar] [CrossRef] [PubMed]
- Ramakrishnaiah, R.; Al kheraif, A.A.; Mohammed, A.; Darshan, D.D.; Kotha, S.B.; Celu, S.L.; Hashem, M.I.; Vallittu, P.K.; Rehman, I.U. Preliminary fabrication and characterization of electron beam melted Ti–6Al–4V customized dental implant. Saudi. J. Biol. Sci. 2016. [Google Scholar] [CrossRef]


| Materials | Mean Surface Roughness (Mean ± SD) | p-Value | ||||
|---|---|---|---|---|---|---|
| Control Group | 20 s | 40 s | 80 s | 160 s | ||
| Celtra | 0.08 ± 0.008 a | 0.14 ± 0.006 b | 0.22 ± 0.02 c | 0.28 ± 0.03 d | 0.33 ± 0.020 e | 0.001 * |
| e-max | 0.16 ± 0.030 a | 0.21 ± 0.030 b | 0.30 ± 0.02 c | 0.56 ± 0.05 d | 0.65 ± 0.016 e | 0.001 * |
| Mark II | 0.14 ± 0.016 a | 0.36 ± 0.020 b | 0.41 ± 0.01 c | 0.59 ± 0.01 d | 0.60 ± 0.010 d | 0.001 * |
| Suprinity | 0.09 ± 0.010 a | 0.46 ± 0.020 b | 0.55 ± 0.06 c | 0.56 ± 0.03 c | 0.64 ± 0.010 d | 0.001 * |
| Supri FC | 0.08 ± 0.009 a | 0.26 ± 0.010 b | 0.29 ± 0.03 c | 0.35 ± 0.03 d | 0.53 ± 0.030 e | 0.001 * |
| Material | Mean Contact Angle (Mean ± SD) | p-Value | ||||
|---|---|---|---|---|---|---|
| Control Group | 20 s | 40 s | 80 s | 160 s | ||
| Celtra | 90.33 ± 0.81 a | 54.94 ± 1.03 b | 46.06 ± 0.45 c | 24.86 ± 0.83 d | 06.86 ± 0.35 e | 0.001 * |
| e-max | 45.80 ± 0.56 a | 27.95 ± 0.52 b | 24.06 ± 0.25 c | 18.00 ± 0.37 d | 17.53 ± 0.51 d | 0.001 * |
| Mark II | 91.27 ± 1.43 a | 74.80 ± 0.56 b | 49.87 ± 0.83 c | 30.00 ± 1.73 d | 22.20 ± 0.41 e | 0.001 * |
| Suprinity | 62.13 ± 0.74 a | 39.13 ± 0.91 b | 33.27 ± 0.79 c | 27.07 ± 0.59 d | 20.93 ± 0.25 e | 0.001 * |
| Supri FC | 72.20 ± 0.41 a | 61.13 ± 0.18 b | 48.67 ± 0.81 c | 40.27 ± 1.33 d | 27.40 ± 0.50 e | 0.001 * |
| Product | Lot No. | Description | Manufacturer |
|---|---|---|---|
| Celtra | 18017131 | Zirconia-reinforced (10% by weight) lithium silicate ceramic | DeguDent, Hanau, Germany |
| e-max | T10332 | Lithium disilicate glass ceramic | Ivoclar Vivadent, Schaan, Liechtenstein |
| Mark II | 43660 | Feldspathic ceramic | VITA Zahnfabrik, Bad Sackingen, Germany |
| Suprinity | 45960 | Zirconia-reinforced (10% by weight) lithium silicate ceramic | VITA Zahnfabrik, Bad Sackingen, Germany |
| Suprinity FC | 47860 | Zirconia-reinforced (10% by weight) lithium silicate ceramic | VITA Zahnfabrik, Bad Sackingen, Germany |
© 2016 by the authors; licensee MDPI, Basel, Switzerland. This article is an open access article distributed under the terms and conditions of the Creative Commons Attribution (CC-BY) license (http://creativecommons.org/licenses/by/4.0/).
Share and Cite
Ramakrishnaiah, R.; Alkheraif, A.A.; Divakar, D.D.; Matinlinna, J.P.; Vallittu, P.K. The Effect of Hydrofluoric Acid Etching Duration on the Surface Micromorphology, Roughness, and Wettability of Dental Ceramics. Int. J. Mol. Sci. 2016, 17, 822. https://doi.org/10.3390/ijms17060822
Ramakrishnaiah R, Alkheraif AA, Divakar DD, Matinlinna JP, Vallittu PK. The Effect of Hydrofluoric Acid Etching Duration on the Surface Micromorphology, Roughness, and Wettability of Dental Ceramics. International Journal of Molecular Sciences. 2016; 17(6):822. https://doi.org/10.3390/ijms17060822
Chicago/Turabian StyleRamakrishnaiah, Ravikumar, Abdulaziz A. Alkheraif, Darshan Devang Divakar, Jukka P. Matinlinna, and Pekka K. Vallittu. 2016. "The Effect of Hydrofluoric Acid Etching Duration on the Surface Micromorphology, Roughness, and Wettability of Dental Ceramics" International Journal of Molecular Sciences 17, no. 6: 822. https://doi.org/10.3390/ijms17060822
APA StyleRamakrishnaiah, R., Alkheraif, A. A., Divakar, D. D., Matinlinna, J. P., & Vallittu, P. K. (2016). The Effect of Hydrofluoric Acid Etching Duration on the Surface Micromorphology, Roughness, and Wettability of Dental Ceramics. International Journal of Molecular Sciences, 17(6), 822. https://doi.org/10.3390/ijms17060822