Micellization Behavior of Long-Chain Substituted Alkylguanidinium Surfactants


Abstract
:
1. Introduction
2. Results and Discussion

| Compound | T (°C) Cr→LC ΔH (kJ·mol−1) | T (°C) LC→I ΔH (kJ·mol−1) |
|---|---|---|
| DCG | Heating: 54.1 °C; −28.3 kJ·mol−1 | – |
| DDGC | Heating: 65.2 °C; −34.7 kJ·mol−1 | Heating: 113.5 °C; −0.78 kJ·mol−1 Cooling: 112.3 °C; 0.79 kJ·mol−1 |
| TDGC | Heating: 72.2 °C; −22.9 kJ·mol−1 | Heating: 169.2 °C; −0.37 kJ·mol−1 Cooling: 160.5 °C; 0.36 kJ·mol−1 |
| CGC | Heating: 76.8 °C; −38.2 kJ·mol−1 | Heating: 189.9 °C; −0.62 kJ·mol−1 Cooling: 185.2 °C; 0.47 kJ·mol−1 |
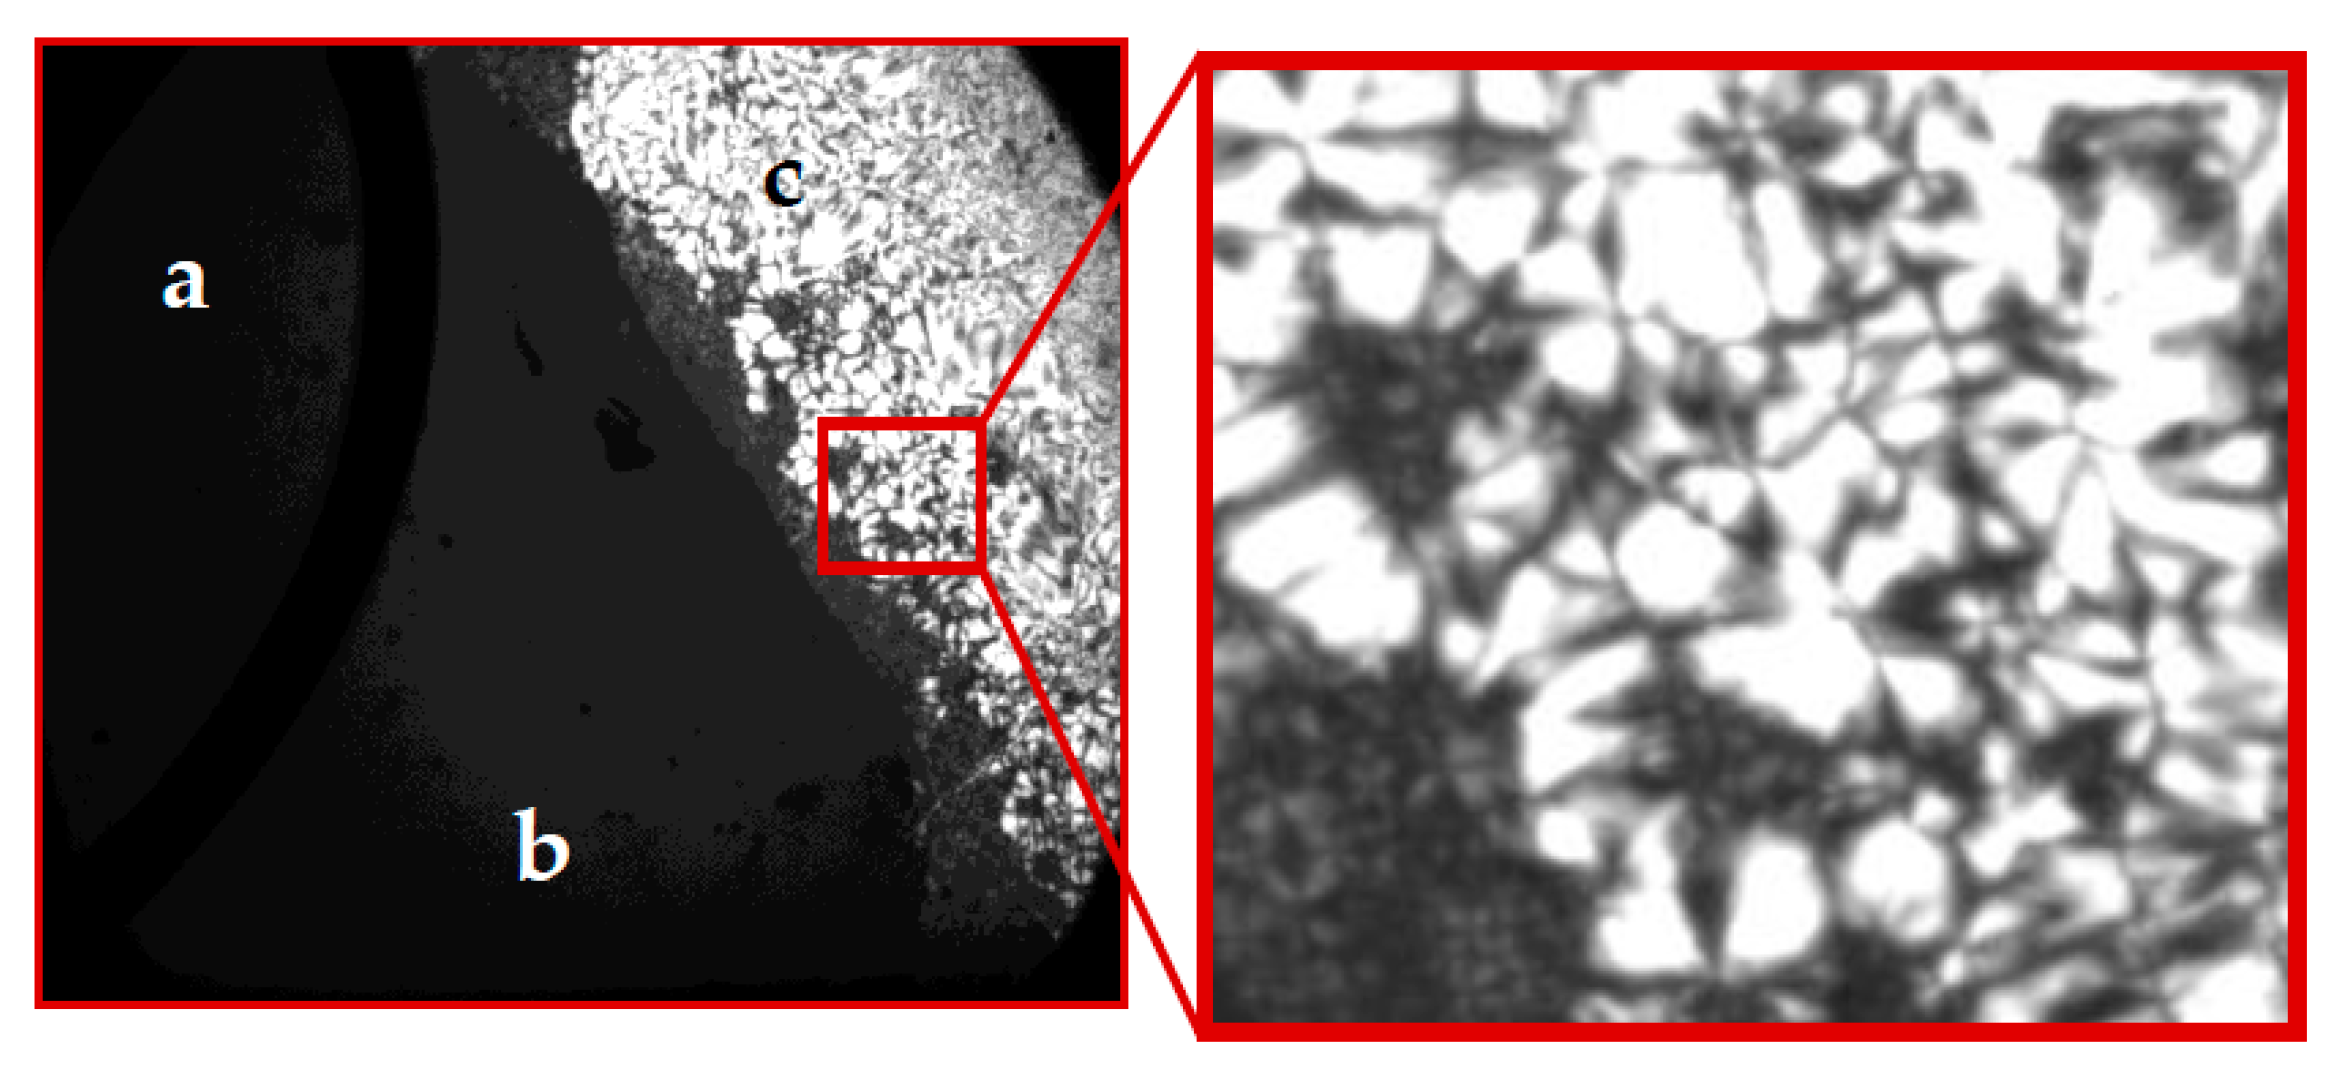
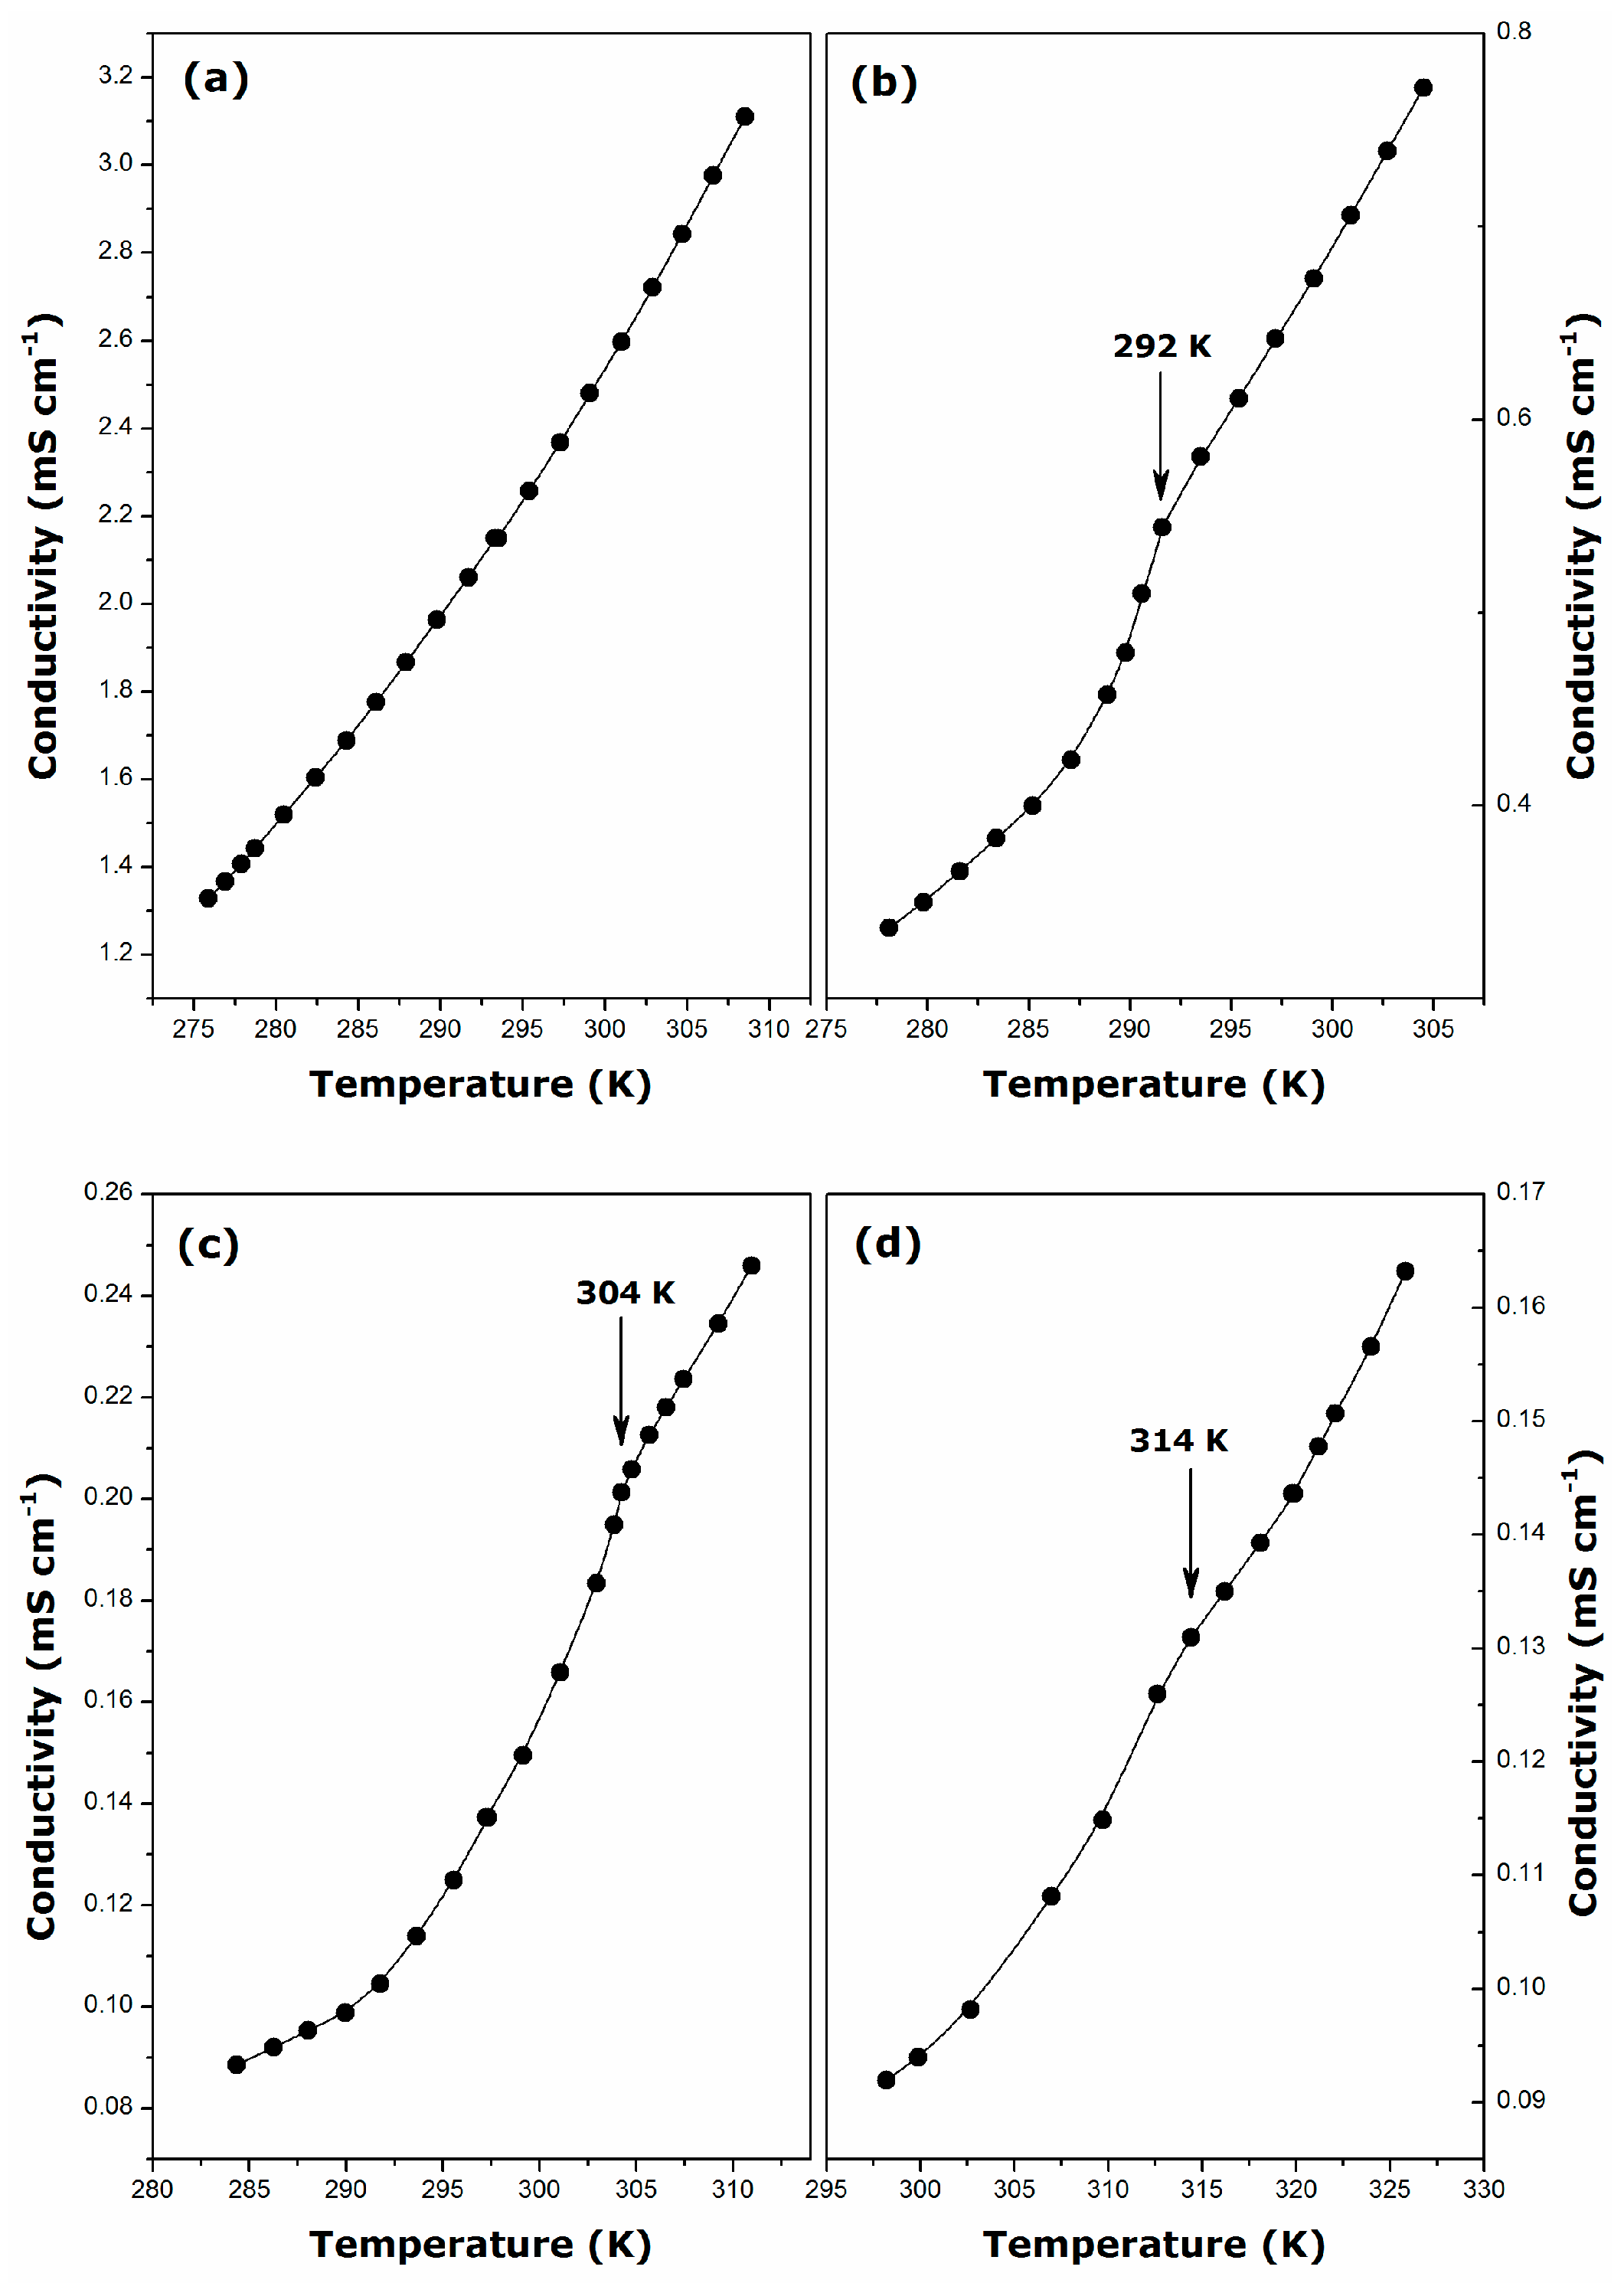
2.1. Krafft Temperature, Critical Micelle Concentration, and Micelle Dissociation
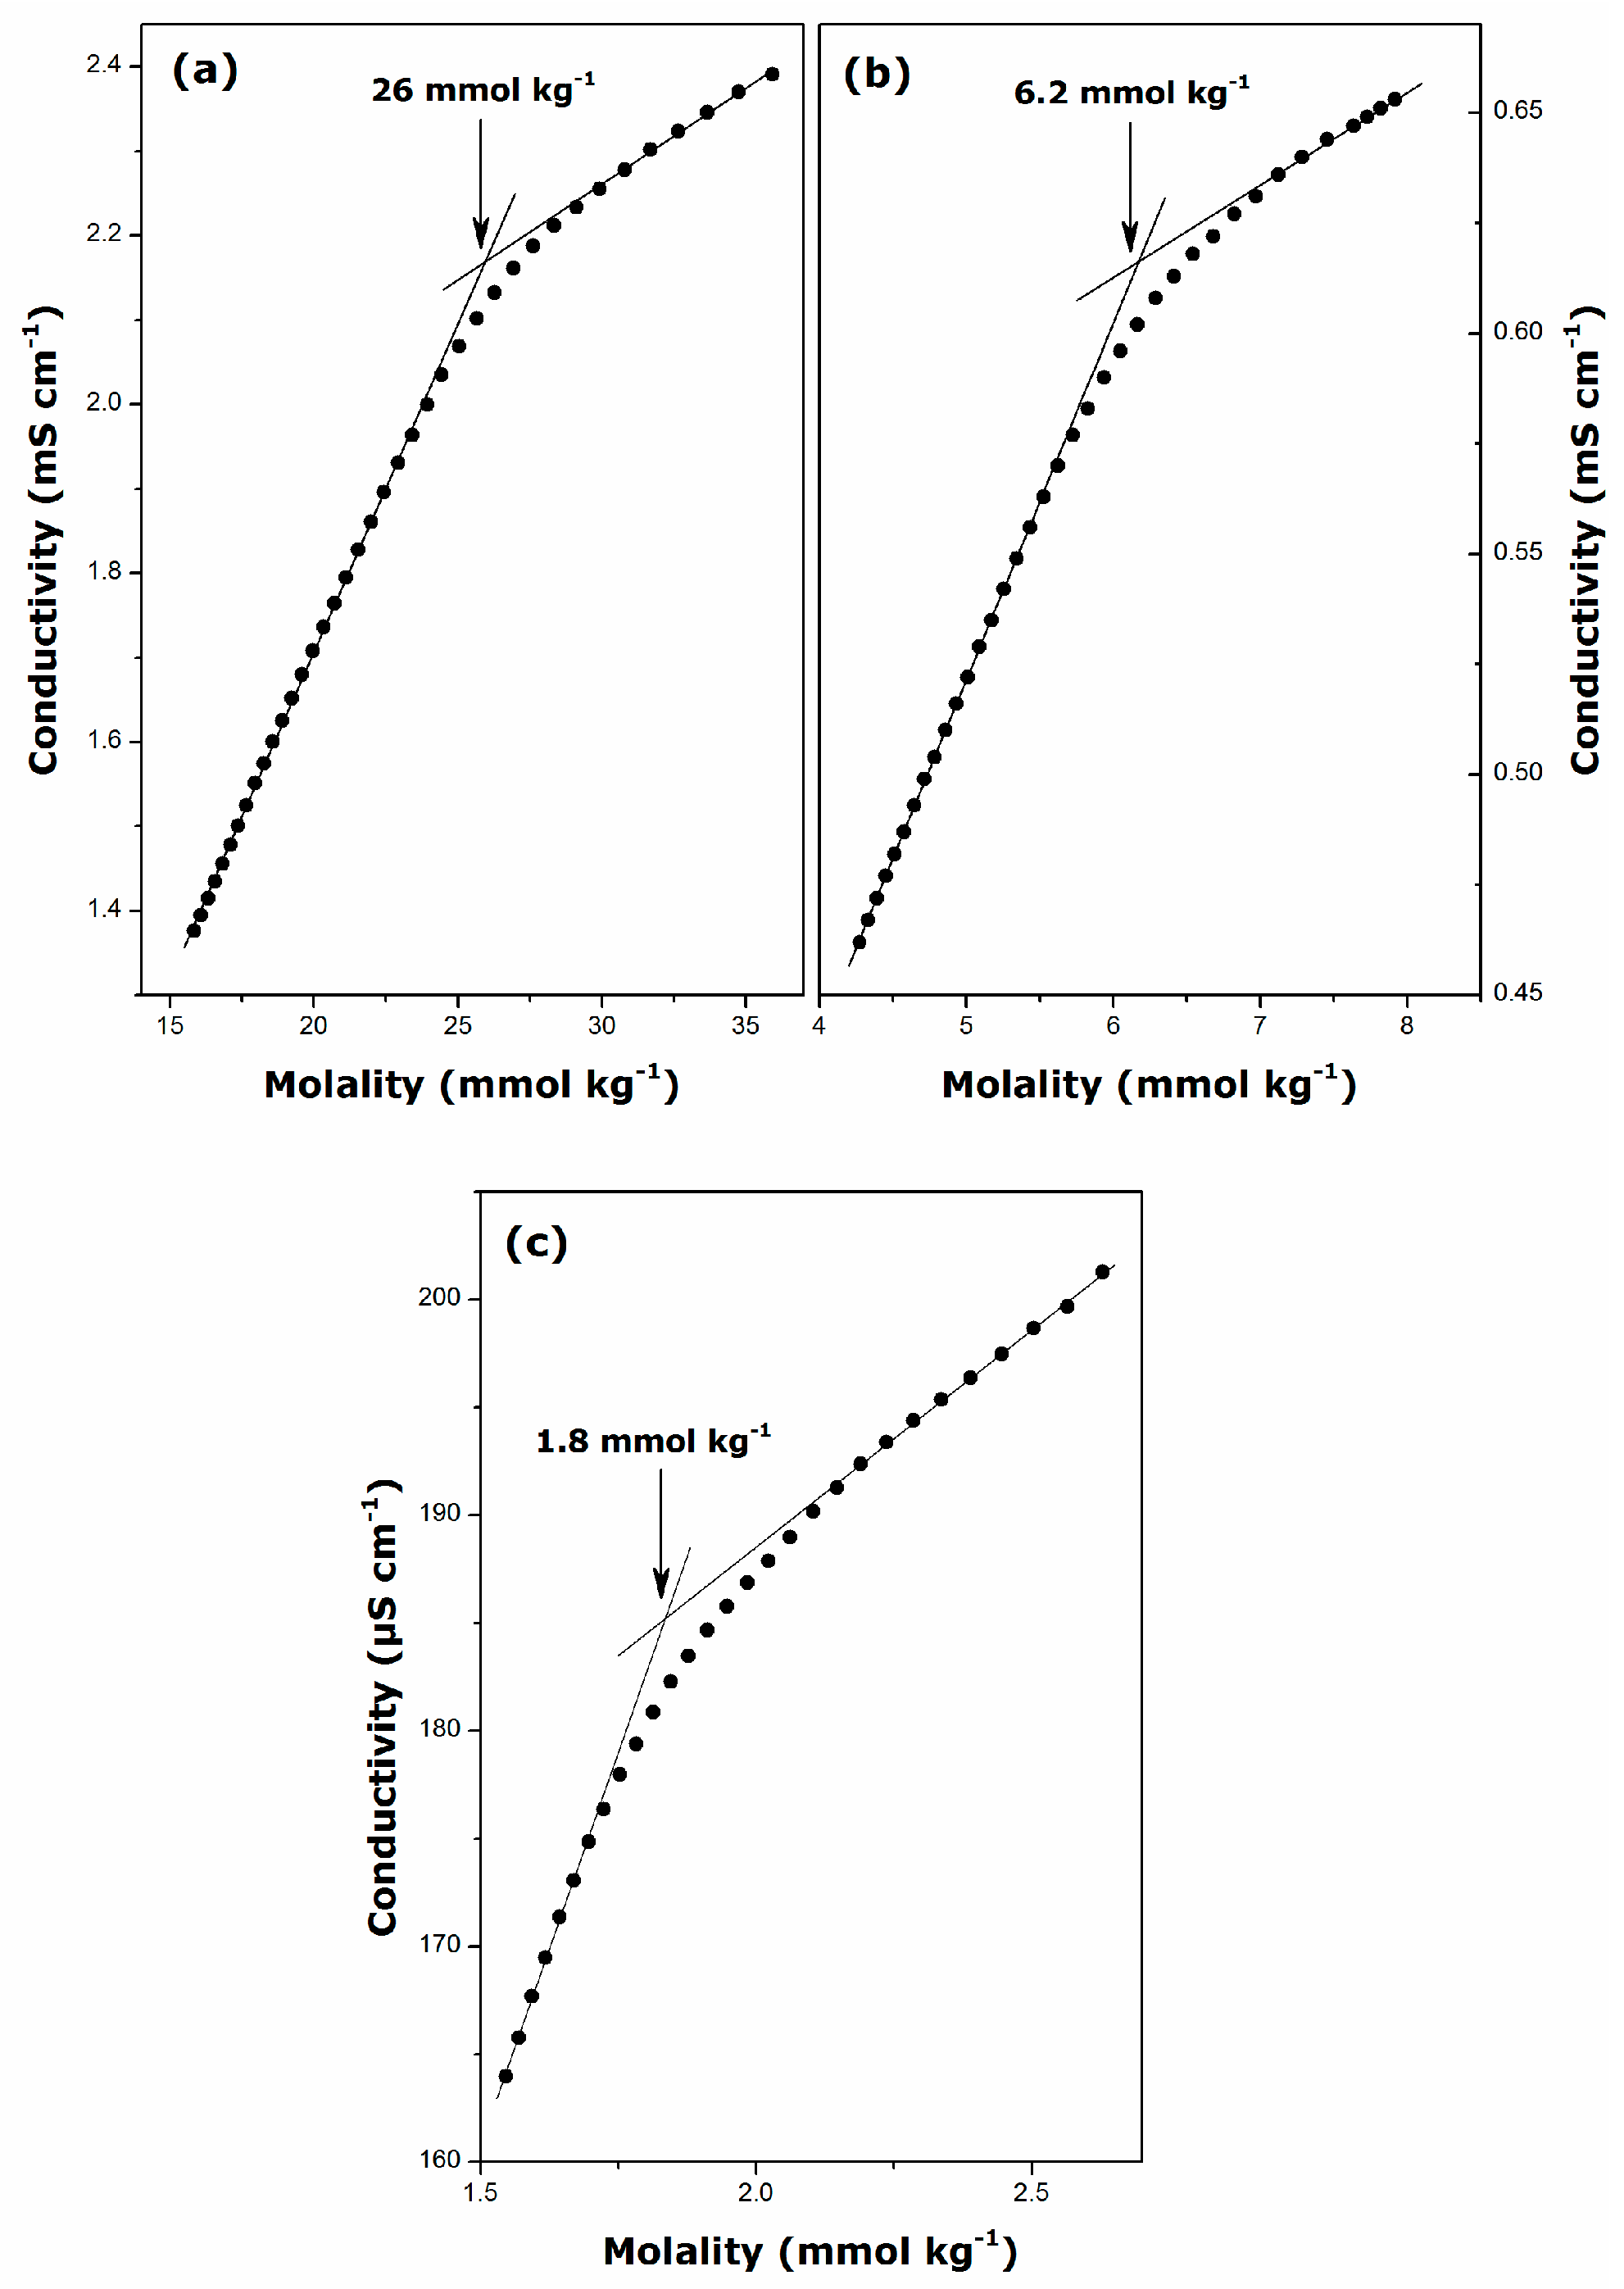
| Surfactant | Temperature (K) | CMC (mmol·kg−1) | β | ΔmicG° (kJ·mol−1) |
|---|---|---|---|---|
| DGC | 298 | 26 ± 1 | 0.71 ± 0.01 | −22.3 ± 0.6 |
| DDGC | 298 | 6.2 ± 0.3 | 0.74 ± 0.01 | −28.3 ± 0.9 |
| TDGC | 306 | 1.8 ± 0.1 | 0.72 ± 0.01 | −33.6 ± 0.9 |
2.2. Thermal Effects of Micelle Formation in Various Aqueous Media
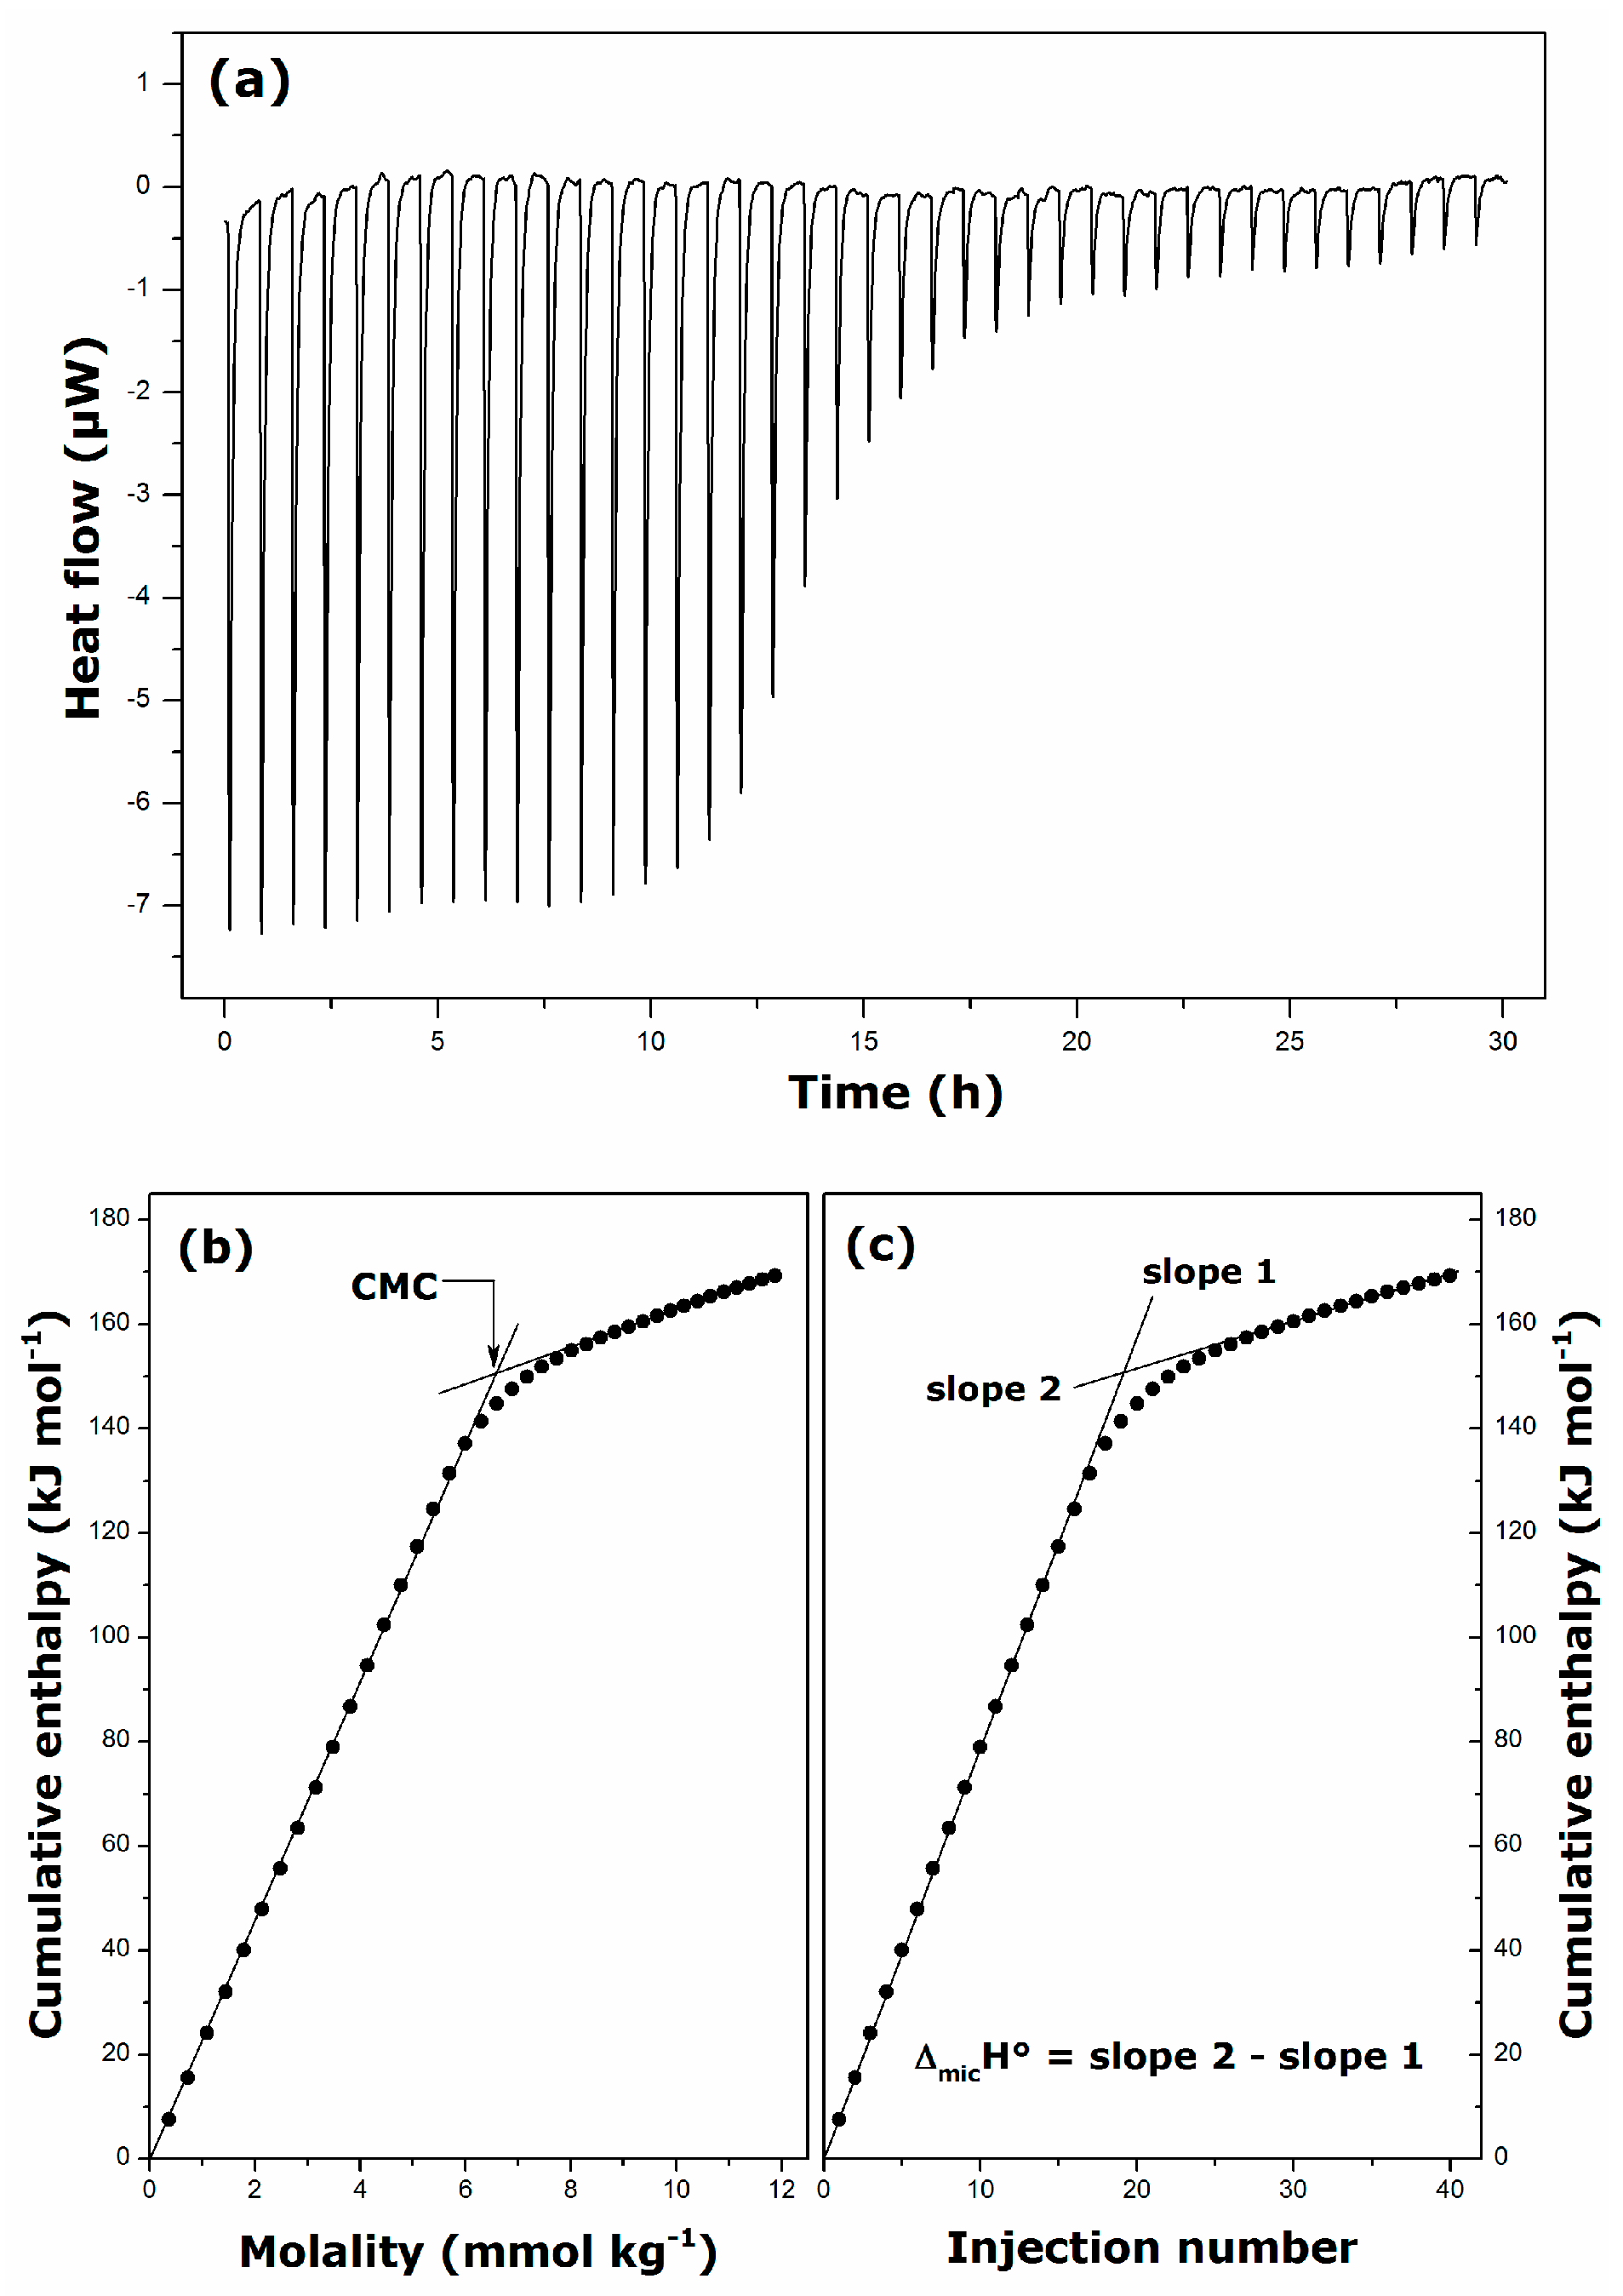
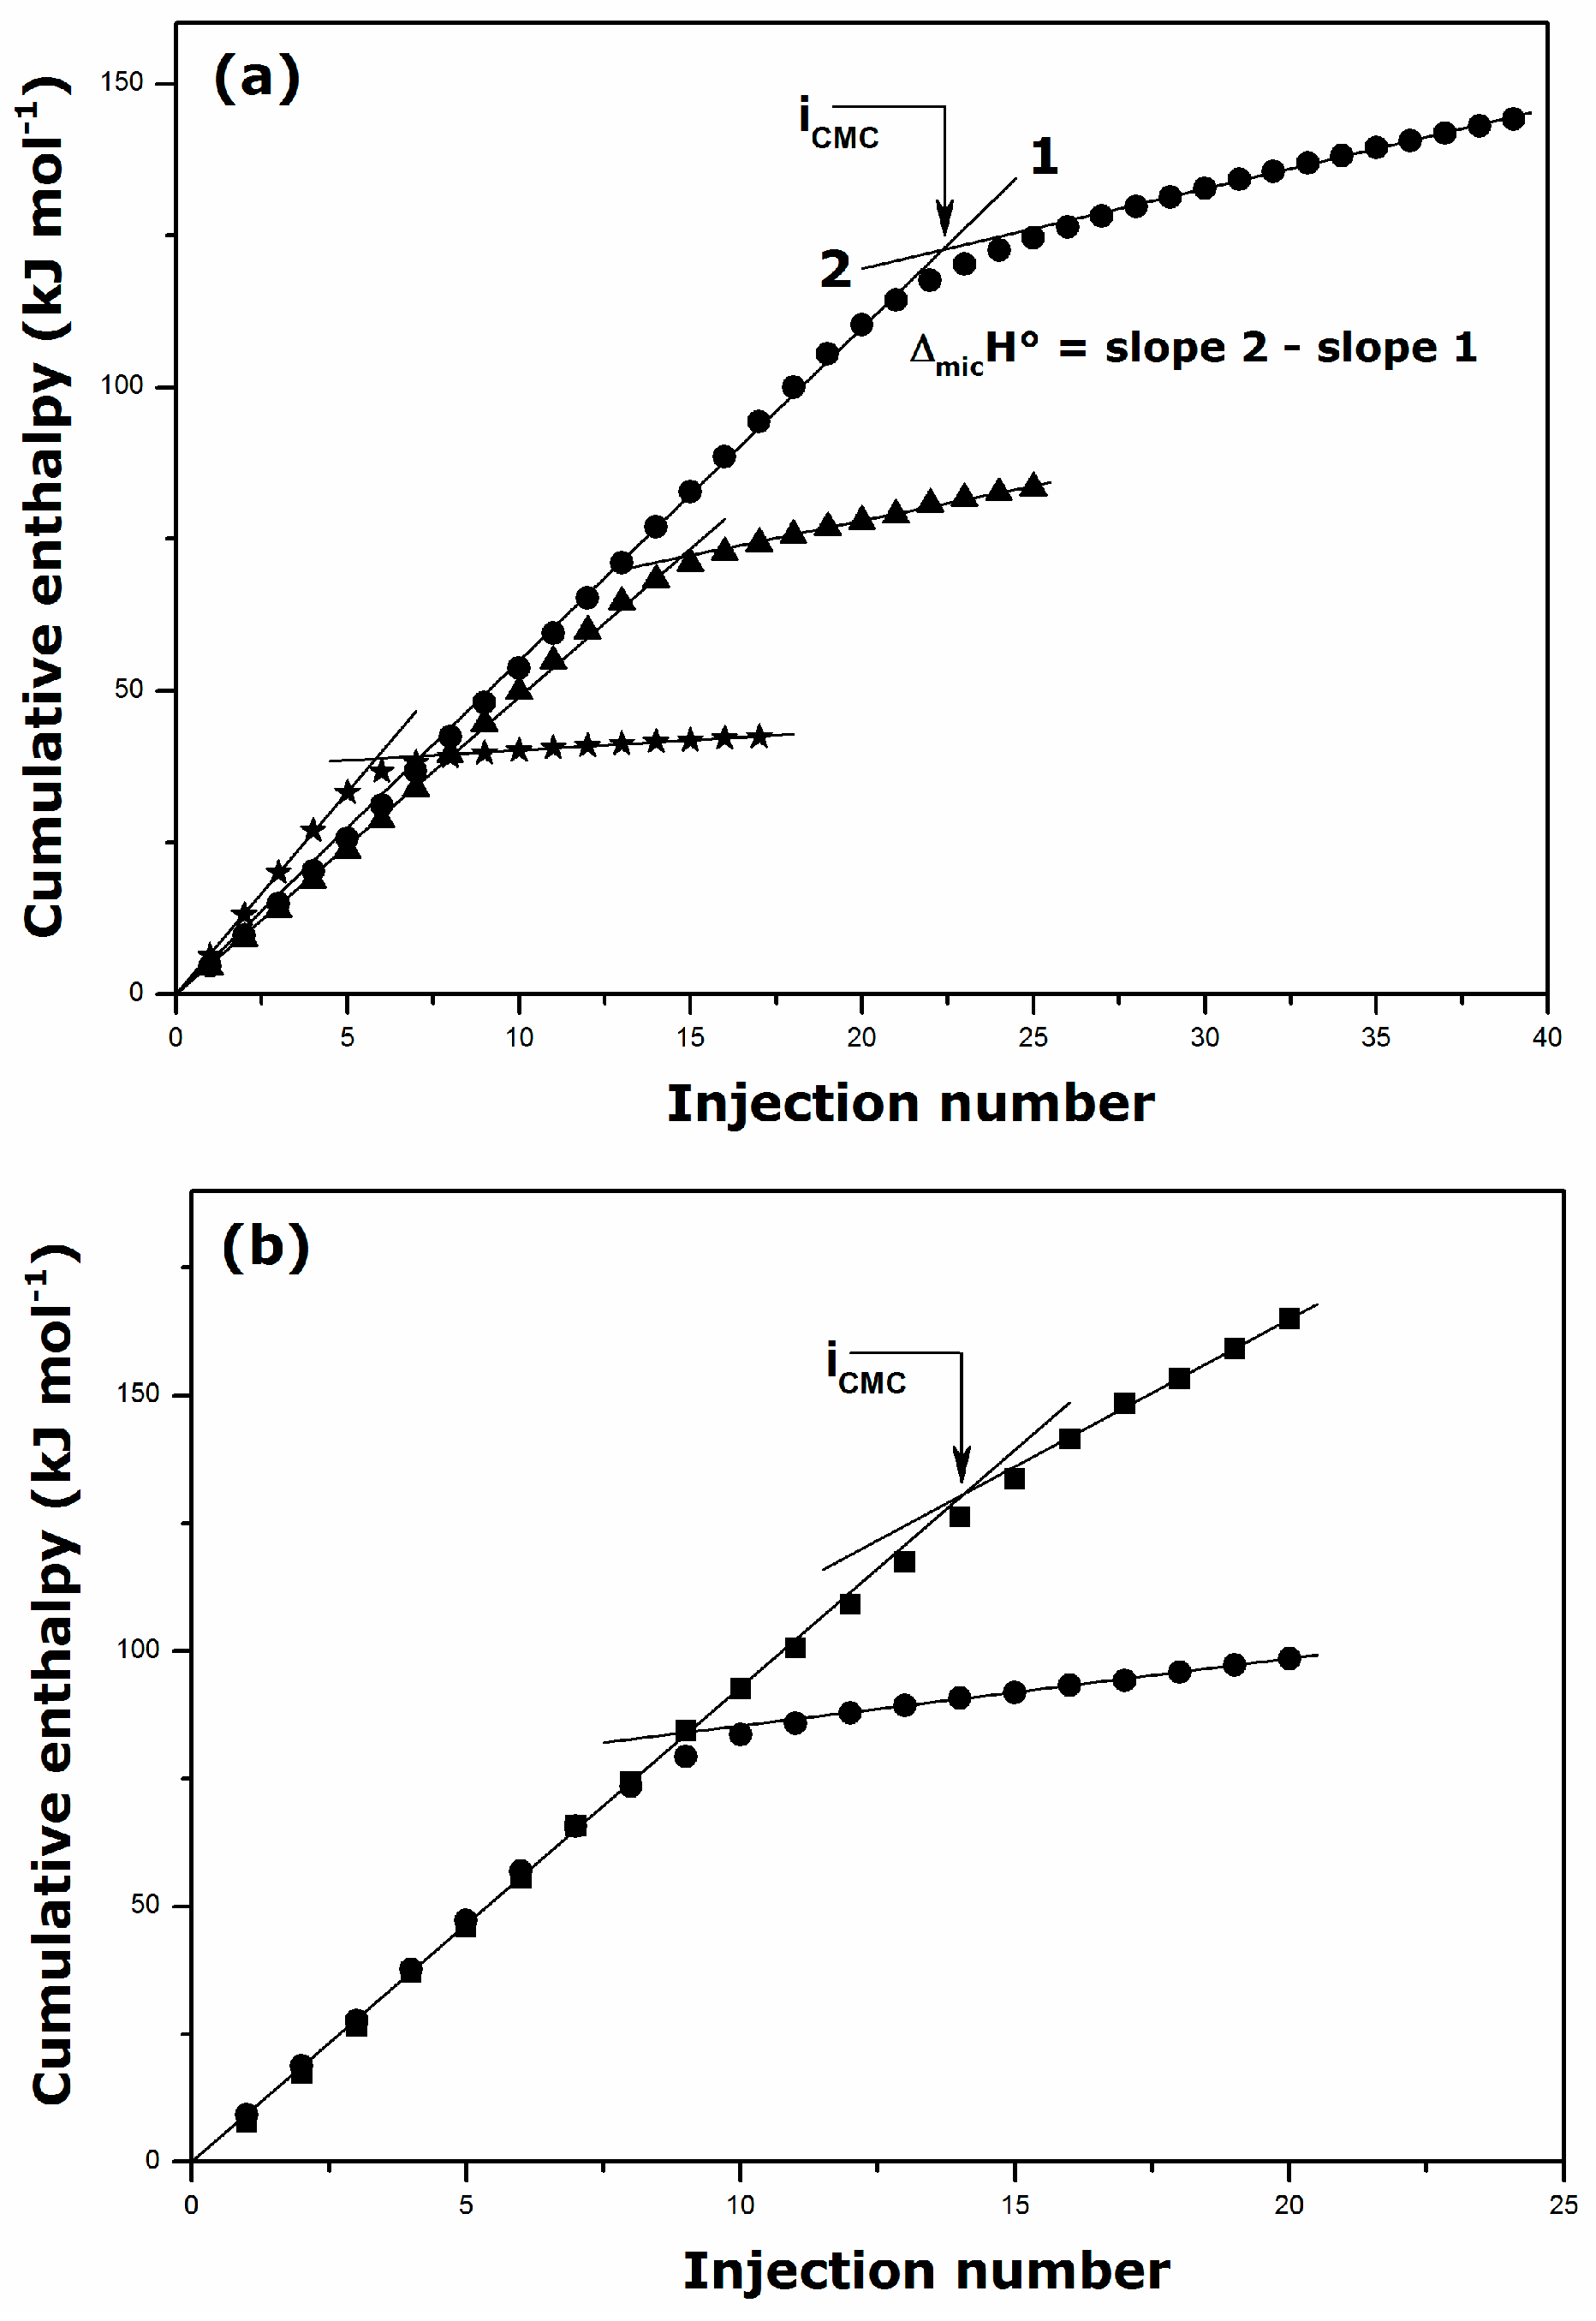
| Surfactant | Solvent | Temperature (K) | CMC (mmol·kg−1) | ΔmicH° (kJ·mol−1) |
|---|---|---|---|---|
| DTAC | H2O | 298 | 21.5 ± 0.1 | 5.1 ± 0.2 |
| DTAC | 0.01 M NaCl | 298 | 18.1 ± 0.1 | 4.2 ± 0.1 |
| DTAC | 0.1 M NaCl | 298 | 8.6 ± 0.1 | 3.6 ± 0.1 |
| TTAC | H2O | 298 | 5.0 ± 0.1 | 2.2 ± 0.2 |
| TTAC | 0.1 M NaCl | 298 | 3.3 ± 0.4 | 1.1 ± 0.2 |
| TTAC | H2O | 318 | 6.0 ± 0.4 | −8.9 ± 0.2 |
| DGC | H2O | 298 | 28.4 ± 0.1 | −4.5 ± 0.1 |
| DGC | 0.001 M NaCl | 298 | 25.5 ± 0.6 | −4.2 ± 0.3 |
| DGC | 0.01 M NaCl | 298 | 22.7 ± 0.2 | −4.0 ± 0.1 |
| DGC | 0.1 M NaCl | 298 | 9.6 ± 0.3 | −6.4 ± 0.1 |
| DDGC | H2O | 298 | 6.2 ± 0.2 | −7.8 ± 0.5 |
| DDGC | 0.001 M NaCl | 298 | 5.7 ± 0.2 | −9.0 ± 0.1 |
| DDGC | 0.01 M NaCl | 298 | 3.5 ± 0.1 | −9.5 ± 0.5 |
| DDGC | H2O | 306 | 6.6 ± 0.4 | −12.3 ± 0.9 |
| DDGC | H2O | 310 | 7.3 ± 0.4 | −13.0 ± 0.4 |
| TDGC | H2O | 306 | 1.5 ± 0.3 | −17.5 ± 0.3 |
3. Materials and Methods
3.1. Chemicals
3.2. Synthesis and Characterization of the Guanidinium Surfactants
3.2.1. Decylguanidinium chloride (DGC)
3.2.2. Dodecylguanidinium chloride (DDGC)
3.2.3. Tetradecylguanidinium chloride (TDGC)
3.2.4. Cetylguanidinium chloride (CGC)
| Surfactants | ||||
|---|---|---|---|---|
| DGC [C11H26N3]+ | DDGC [C13H30N3]+ | TDGC [C15H34N3]+ | CGC [C17H38N3]+ | |
| (ESI+, m/z) [M]+ calc. | 200.2121 | 228.2434 | 256.2747 | 284.3060 |
| (ESI+, m/z) [M]+ found | 200.2127 | 228.2434 | 256.2756 | 284.3061 |
3.3. Physical Measurements
3.3.1. Conductimetry
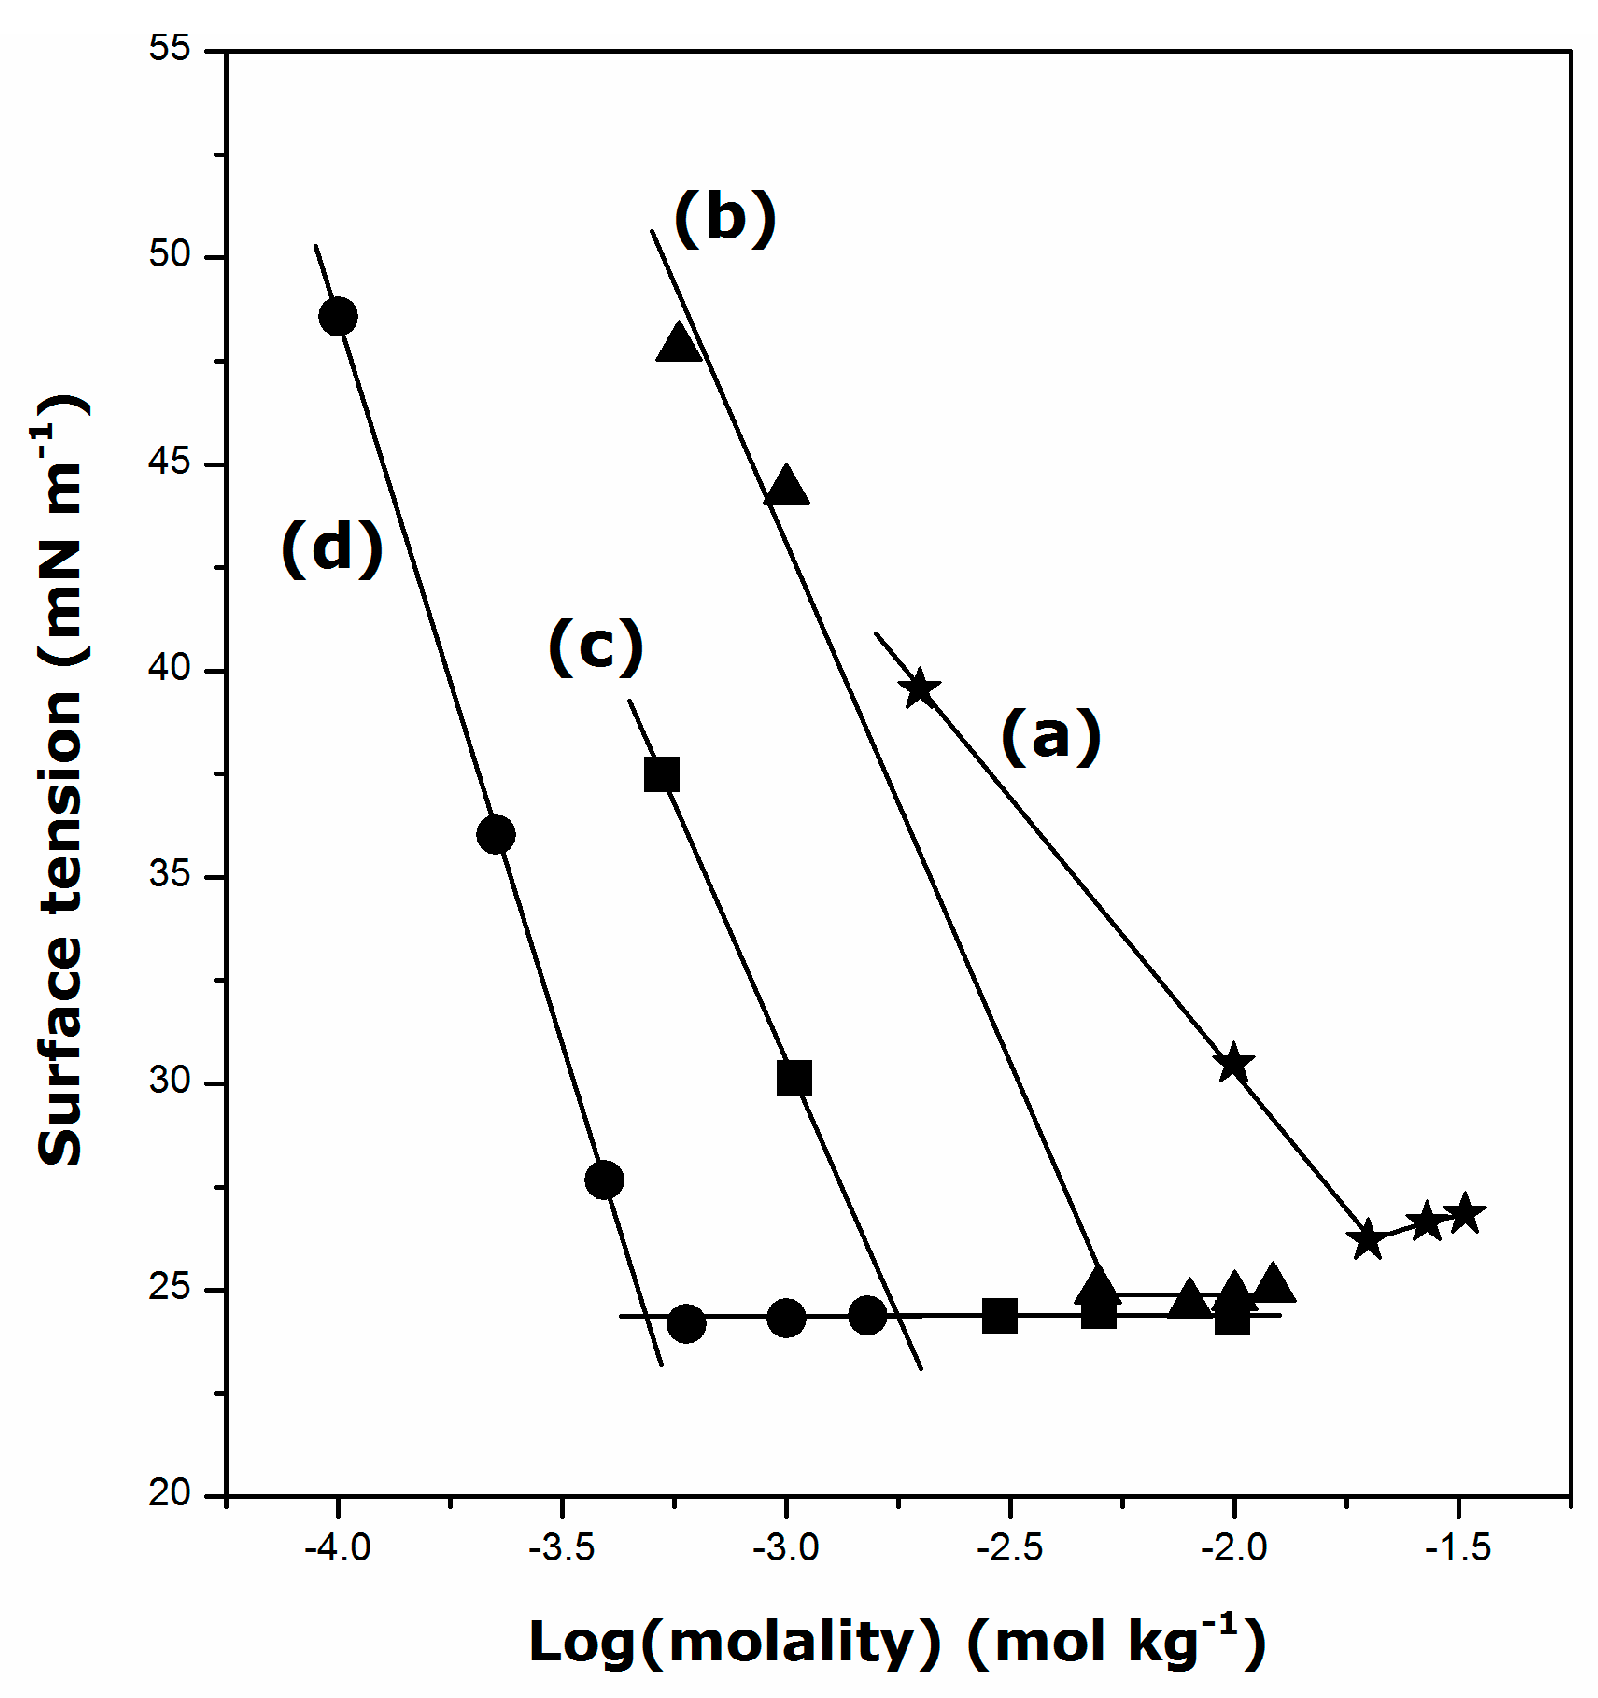
3.3.2. Surface Tension Measurements
3.3.3. Titration Calorimetry
4. Conclusions
- For DDGC, TDGC, CGC, the Krafft temperature ranges between 292 and 314 K, and it increases strongly with the addition of methylene units to the surfactant hydrophobic tail.
- The presence of DDGC, TDGC, and CGC units in the aqueous solution decreases its surface tension down to about 24 mN·m−1 above the CMC, irrespective of the surfactant structure and temperature.
- The binding of chloride counter-ions to the micelle is about 70%, similar to that in the micelles of alkyltrimethylammonium bromides and much greater than in the case of alkyltrimethylammonium chlorides; it appears hardly dependent on the tail length and temperature.
- Micellization of guanidinium cationics, especially those with long alkyl chains, may be described as both entropy and enthalpy-driven; the critical micelle concentration, CMC, decreases and the standard enthalpy of micellization per mole of surfactant, ΔmicH°, becomes more negative (the process is more exothermic) upon lengthening the hydrocarbon tail.
- The addition of the background NaCl electrolyte to the aqueous phase causes a steady decrease in the CMC and renders the micellization process more exothermic; depending on the tail length, the alkylguanidinium micelles may attain their optimum shape and size at a given NaCl content, and further salt addition may result in the formation of micelles likely differing in shape and size.
Acknowledgments
Author Contributions
Conflicts of Interest
References
- Ramanathan, M.; Shrestha, L.K.; Mori, T.; Ji, Q.; Hill, J.P.; Ariga, K. Amphiphile nanoarchitectonics: From basic physical chemistry to advanced applications. Phys. Chem. Chem. Phys. 2013, 15, 10580–10611. [Google Scholar] [CrossRef] [PubMed]
- Rosen, M.J. Surfactants and Interfacial Phenomena, 3rd ed.; John Wiley & Sons: New York, NY, USA, 2004. [Google Scholar]
- Tanford, C. The Hydrophobic Effect: Formation of Micelles and Biological Membranes; Wiley-Interscience: New York, NY, USA, 1973. [Google Scholar]
- Robb, I.D. Specialist Surfactants; Blackie Academic and Professional: London, UK, 1997. [Google Scholar]
- Zhang, G.; Han, F.; Zhang, G. New family of trisiloxane surfactants. Tenside Surfactants Deterg. 2006, 43, 146–150. [Google Scholar] [CrossRef]
- He, J.; Wang, X.; Morill, M.; Shamsi, S.A. Amino acid bound surfactants: A new synthetic family of polymeric monoliths opening up possibilities for chiral separations in capillary electrochromatography. Anal. Chem. 2012, 84, 5236–5242. [Google Scholar] [CrossRef] [PubMed]
- Miyake, M.; Yamada, K.; Oyama, N. Self-assembling of guanidine-type surfactant. Langmuir 2008, 24, 8527–8532. [Google Scholar] [CrossRef] [PubMed]
- Mingarro, I.; Lukovic, D.; Vilar, M.; Perez-Gil, J. Synthetic pulmonary surfactant preparations: New developments and future trends. Curr. Med. Chem. 2008, 15, 393–403. [Google Scholar] [CrossRef] [PubMed]
- Wu, S.-H.; Mou, C.-Y.; Lin, H.-P. Synthesis of mesoporous silica nanoparticles. Chem. Soc. Rev. 2013, 42, 3862–3875. [Google Scholar] [CrossRef] [PubMed]
- Soler-Illia, G.J.D.; Sanchez, C.; Lebeau, B.; Patarin, J. Chemical strategies to design textured materials: From microporous and mesoporous oxides to nanonetworks and hierarchical structures. Chem. Rev. 2002, 102, 4093–4138. [Google Scholar] [CrossRef] [PubMed]
- Alothman, Z.A. A review: Fundamental aspects of silicate mesoporous materials. Materials 2012, 5, 2874–2902. [Google Scholar] [CrossRef]
- El Hankari, S.; Hesemann, P. Guanidinium vs. Ammonium surfactants in soft-templating approaches: Nanostructured silica and zwitterionic-silica from complementary precursor–surfactant ion pairs. Eur. J. Inorg. Chem. 2012, 2012, 5288–5298. [Google Scholar] [CrossRef]
- Russell, V.A.; Ward, M.D. Molecular crystals with dimensionally controlled hydrogen-bonded nanostructures. Chem. Mater. 1996, 8, 1654–1666. [Google Scholar] [CrossRef]
- Ward, M.D. Directing the assembly of molecular crystals. MRS Bull. 2005, 30, 705–712. [Google Scholar] [CrossRef]
- Ward, M.D. Design of crystalline molecular networks with charge-assisted hydrogen bonds. Chem. Commun. 2005, 5838–5842. [Google Scholar] [CrossRef] [PubMed]
- El-Hankari, S.; Huo, J.; Ahmed, A.; Zhang, H.; Bradshaw, D. Surface etching of HKUST-1 promoted via supramolecular interactions for chromatography. J. Mater. Chem. A 2014, 2, 13479–13485. [Google Scholar] [CrossRef]
- Makhatadze, G.I.; Privalov, P.L. Protein interactions with urea and guanidinium chloride—A calorimetric study. J. Mol. Biol. 1992, 226, 491–505. [Google Scholar] [CrossRef]
- Arakawa, T.; Timasheff, S.N. Protein stabilization and destabilization by guanidinium salts. Biochemistry 1984, 23, 5924–5929. [Google Scholar] [CrossRef] [PubMed]
- Song, Y.; Li, Q.; Li, Y. Self-aggregation and antimicrobial activity of alkylguanidium salts. Colloid Surf. A 2012, 393, 11–16. [Google Scholar] [CrossRef]
- Katritzky, A.R.; Rogovoy, B.V. Recent developments in guanylating agents. Arkivoc 2005, 49–87. [Google Scholar] [CrossRef]
- Isobe, T.; Iskikawa, T. 2-chloro-1,3-dimethylimidazolinium chloride. 1. A powerful dehydrating equivalent to dcc. J. Org. Chem. 1999, 64, 6984–6988. [Google Scholar] [CrossRef]
- El Kadib, A.; Hesemann, P.; Molvinger, K.; Brandner, J.; Biolley, C.; Gaveau, P.; Moreau, J.J.E.; Brunel, D. Hybrid materials and periodic mesoporous organosilicas containing covalently bonded organic anion and cation featuring MCM-41 and SBA-15 structure. J. Am. Chem. Soc. 2009, 131, 2882–2892. [Google Scholar] [CrossRef] [PubMed]
- Dräger, G.; Solodenko, W.; Messinger, J.; Schön, U.; Kirschning, A. A new reagent and its polymer-supported variant for the amidination of amines. Tetrahedron Lett. 2002, 43, 1401–1403. [Google Scholar] [CrossRef]
- Scott, F.L.; Odonovan, D.G.; Reilly, J. Studies in the pyrazole series. 3. Substituted guanidines. J. Am. Chem. Soc. 1953, 75, 4053–4054. [Google Scholar] [CrossRef]
- Sasaki, D.Y.; Alam, T.M. Solid-state p-31 NMR study of phosphonate binding sites in guanidine-functionalized, molecular imprinted silica xerogels. Chem. Mater. 2000, 12, 1400–1407. [Google Scholar] [CrossRef]
- Bales, B.L.; Benrraou, M.; Zana, R. Krafft temperature and micelle ionization of aqueous solutions of cesium dodecyl sulfate. J. Phys. Chem. B 2002, 106, 9033–9035. [Google Scholar] [CrossRef]
- Manojlović, J.Ž. The Krafft temperature of surfactant solutions. Therm. Sci. 2012, 16, S631–S640. [Google Scholar] [CrossRef]
- Di Michele, A.; Brinchi, L.; di Profio, P.; Germani, R.; Savelli, G.; Onori, G. Effect of headgroup size, temperature and counterion specificity on cationic micelles. J. Colloid Interface Sci. 2011, 358, 160–166. [Google Scholar] [CrossRef] [PubMed]
- Ikeda, N.; Sanefuji, N.; Lu, K.K.; Aratono, M.; Motomura, K. Surface adsorption and micelle formation of the mixture of N-methylated dodecylammonium chloride and ammonium chloride. J. Colloid Interface Sci. 1994, 164, 439–443. [Google Scholar] [CrossRef]
- Kavanau, J.L. Water and Solute-Water Interactions; Holden-Day: San Francisco, CA, USA, 1964. [Google Scholar]
- Rosen, M.J.; Li, F.; Morrall, S.W.; Versteeg, D.J. The relationship between the interfacial properties of surfactants and their toxicity to aquatic organisms. Environ. Sci. Technol. 2001, 35, 954–959. [Google Scholar] [CrossRef] [PubMed]
- Oxton, I.A.; Knop, O.; Falk, M. Determination of the symmetry of the ammonium ion in crystals from the infrared spectra of the isotopically dilute ammonium-D1(1+) species. J. Phys. Chem. 1976, 80, 1212–1217. [Google Scholar] [CrossRef]
- Angell, C.L.; Sheppard, N.; Yamaguchi, A.; Shimanouchi, T.; Miyazawa, T.; Mizushima, S. The infra-red spectrum, structure, and normal vibrations of the guanidinium ion. Trans. Faraday Soc. 1957, 53, 589–600. [Google Scholar] [CrossRef]
- Ikeda, S. Stability of spherical and rod-like micelles of ionic surfactants, in relation to their counterion binding and modes of hydration. Colloid Polym. Sci. 1991, 269, 49–61. [Google Scholar] [CrossRef]
- Sarač, B.; Bešter-Rogač, M. Temperature and salt-induced micellization of dodecyltrimethylammonium chloride in aqueous solution: A thermodynamic study. J. Colloid Interface Sci. 2009, 338, 216–221. [Google Scholar] [CrossRef] [PubMed]
- Kroflič, A.; Sarač, B.; Bešter-Rogač, M. Influence of the alkyl chain length, temperature, and added salt on the thermodynamics of micellization: Alkyltrimethylammonium chlorides in NaCl aqueous solutions. J. Chem. Thermodyn. 2011, 43, 1557–1563. [Google Scholar] [CrossRef]
- Zana, R. Critical micellization concentration of surfactants in aqueous solution and free energy of micellization. Langmuir 1996, 12, 1208–1211. [Google Scholar] [CrossRef]
- Zajac, J.; Chorro, C.; Lindheimer, M.; Partyka, S. Thermodynamics of micellization and adsorption of zwitterionic surfactants in aqueous media. Langmuir 1997, 13, 1486–1495. [Google Scholar] [CrossRef]
- Chaghi, R.; de Ménorval, L.-C.; Charnay, C.; Derrien, G.; Zajac, J. Interactions of phenol with cationic micelles of hexadecyltrimethylammonium bromide studied by titration calorimetry, conductimetry, and 1H NMR in the range of low additive and surfactant concentrations. J. Colloid Interface Sci. 2008, 326, 227–234. [Google Scholar] [CrossRef] [PubMed]
- Chaghi, R.; de Ménorval, L.-C.; Charnay, C.; Derrien, G.; Zajac, J. Competitive solubilization of phenol by cationic surfactant micelles in the range of low additive and surfactant concentrations. Langmuir 2009, 25, 4868–4874. [Google Scholar] [CrossRef] [PubMed]
- Mysels, K.J.; Mujerjee, P. Reporting experimental data dealing with critical micelle concentrations (cmcs) of aqueous surfactant systems. Pure Appl. Chem. 1979, 51, 1083–1089. [Google Scholar]
- Aranow, R.H.; Witten, L. The environmental influence on the behavior of long chain molecules. J. Phys. Chem. 1960, 64, 1643–1648. [Google Scholar] [CrossRef]
- Aranow, R.H.; Witten, L. Additional comments on thermodynamics of environmental changes of methylene group. J. Chem. Phys. 1965, 43, 1436–1437. [Google Scholar] [CrossRef]
- Zajac, J. Calorimetry at the solid-liquid interface. In Calorimetry and Thermal Methods in Catalysis; Auroux, A., Ed.; Springer-Verlag: Berlin-Heidelberg, Germany, 2013; pp. 197–270. [Google Scholar]
© 2016 by the authors; licensee MDPI, Basel, Switzerland. This article is an open access article distributed under the terms and conditions of the Creative Commons by Attribution (CC-BY) license (http://creativecommons.org/licenses/by/4.0/).
Share and Cite
Bouchal, R.; Hamel, A.; Hesemann, P.; In, M.; Prelot, B.; Zajac, J. Micellization Behavior of Long-Chain Substituted Alkylguanidinium Surfactants. Int. J. Mol. Sci. 2016, 17, 223. https://doi.org/10.3390/ijms17020223
Bouchal R, Hamel A, Hesemann P, In M, Prelot B, Zajac J. Micellization Behavior of Long-Chain Substituted Alkylguanidinium Surfactants. International Journal of Molecular Sciences. 2016; 17(2):223. https://doi.org/10.3390/ijms17020223
Chicago/Turabian StyleBouchal, Roza, Abdellah Hamel, Peter Hesemann, Martin In, Bénédicte Prelot, and Jerzy Zajac. 2016. "Micellization Behavior of Long-Chain Substituted Alkylguanidinium Surfactants" International Journal of Molecular Sciences 17, no. 2: 223. https://doi.org/10.3390/ijms17020223
APA StyleBouchal, R., Hamel, A., Hesemann, P., In, M., Prelot, B., & Zajac, J. (2016). Micellization Behavior of Long-Chain Substituted Alkylguanidinium Surfactants. International Journal of Molecular Sciences, 17(2), 223. https://doi.org/10.3390/ijms17020223