
Use of Repetitive Sequences for Molecular and Cytogenetic Characterization of Avena Species from Portugal

 , , ,
, , , 
Abstract
:
1. Introduction
2. Results

| Accession | 45S ITS1 | 45S ITS2 | pSc200 | CCS1 | IRAP | REMAP |
|---|---|---|---|---|---|---|
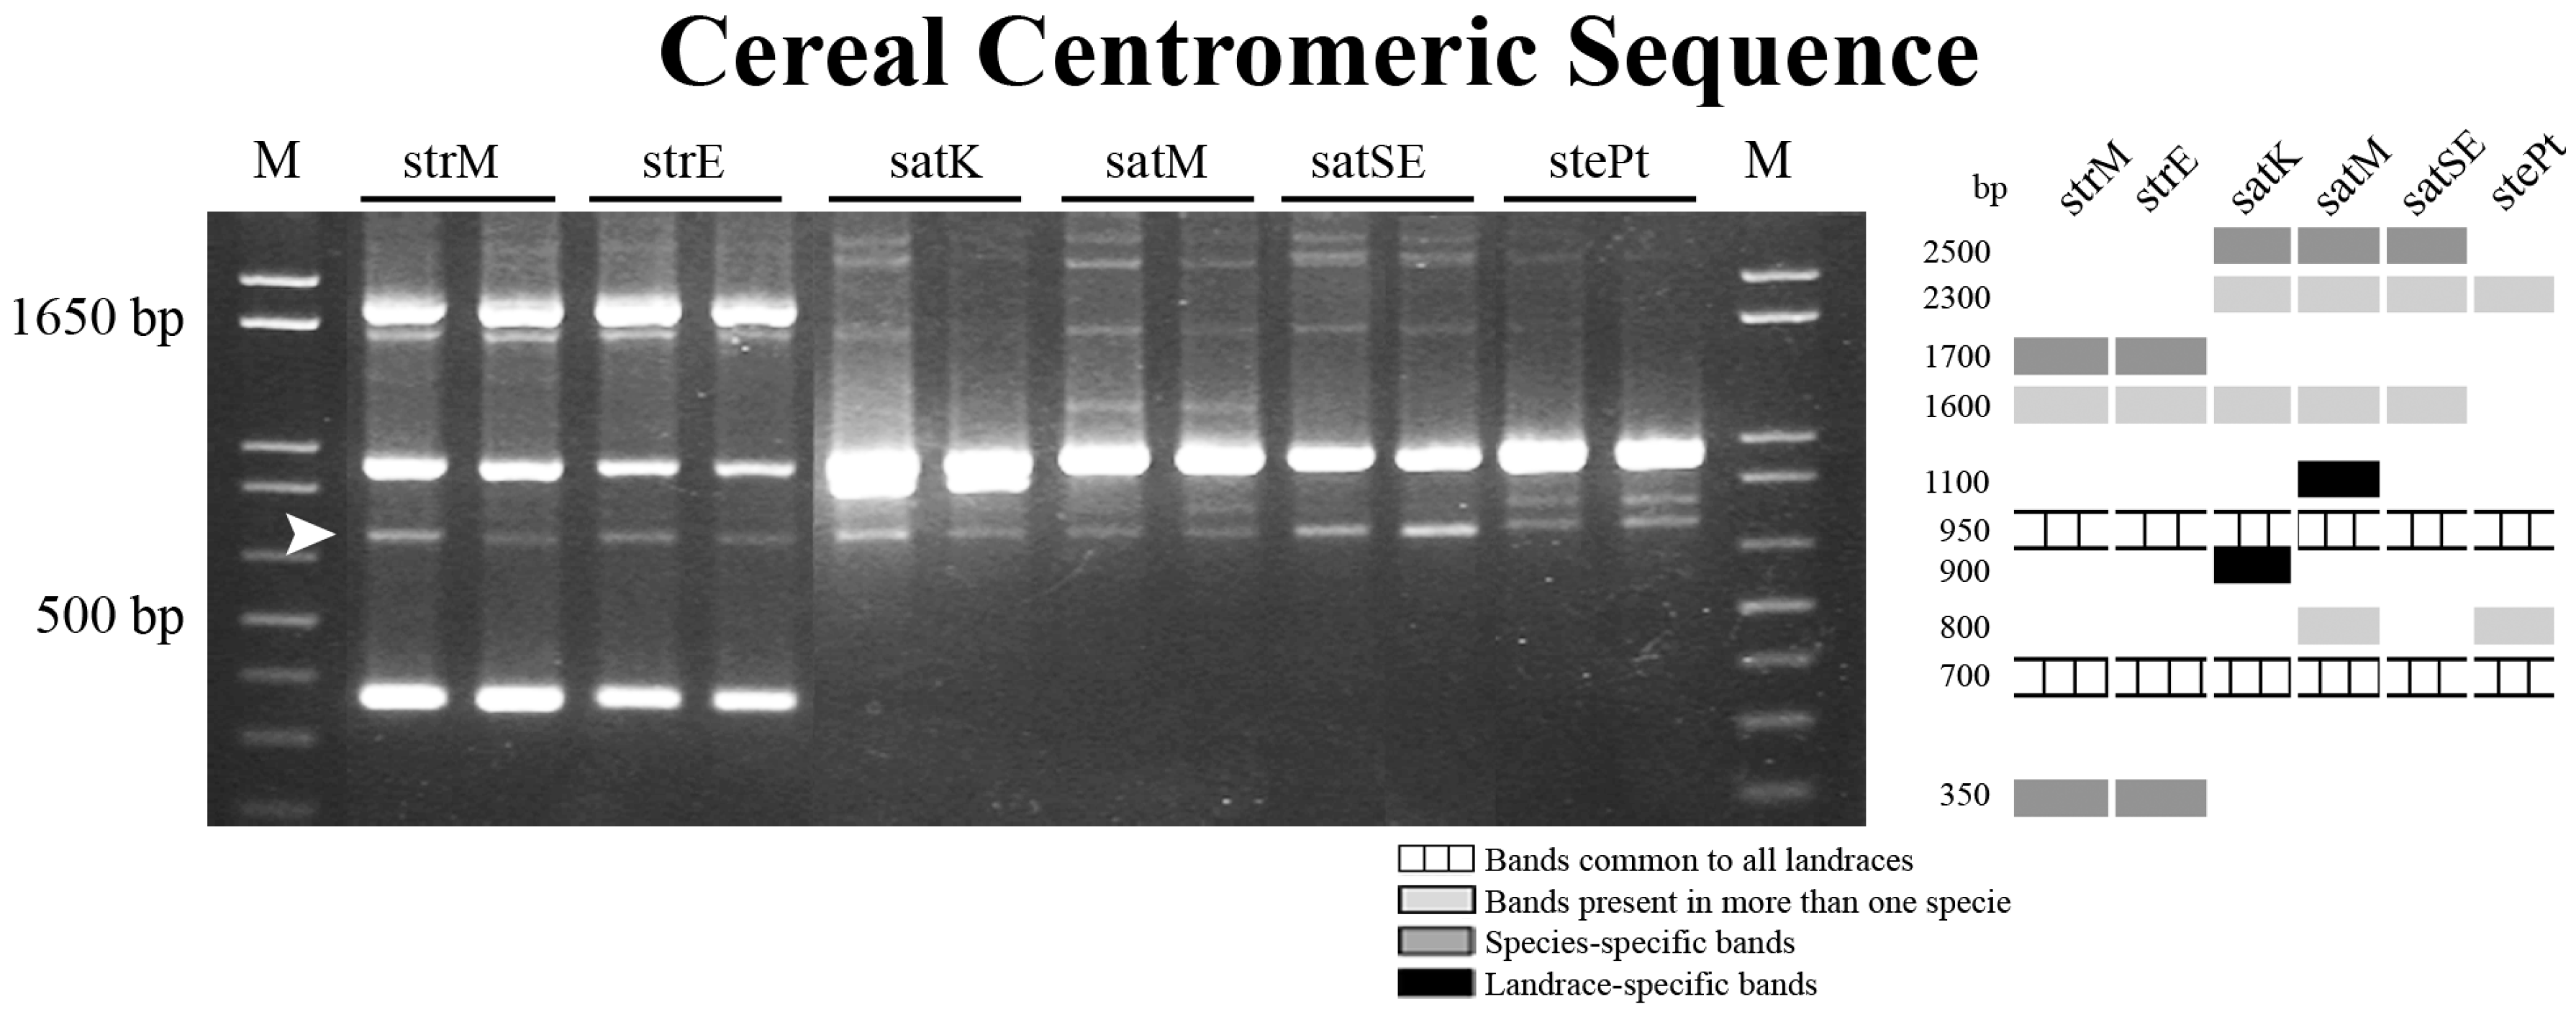
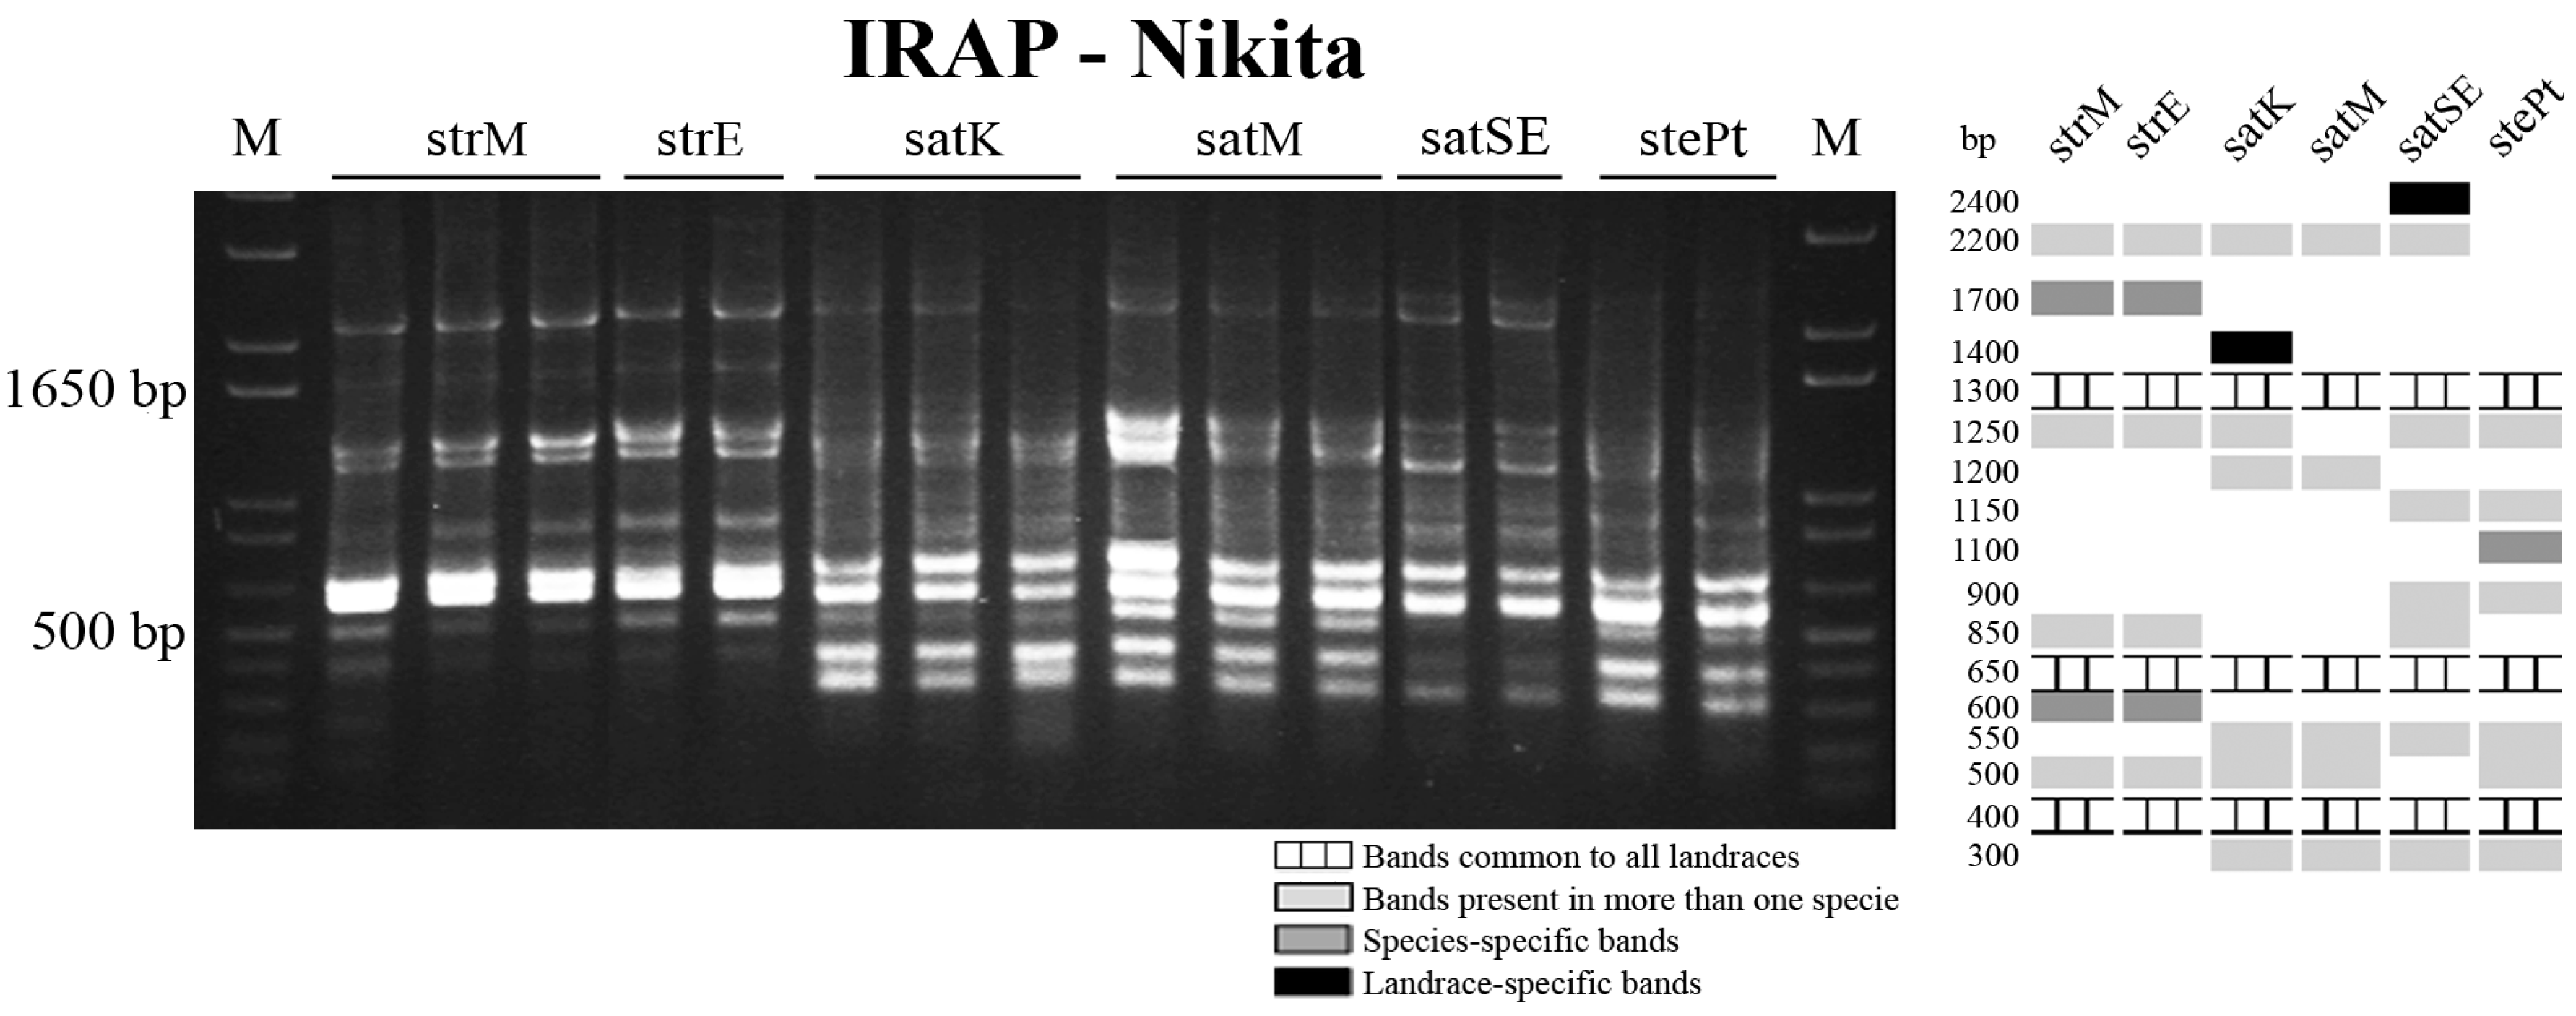
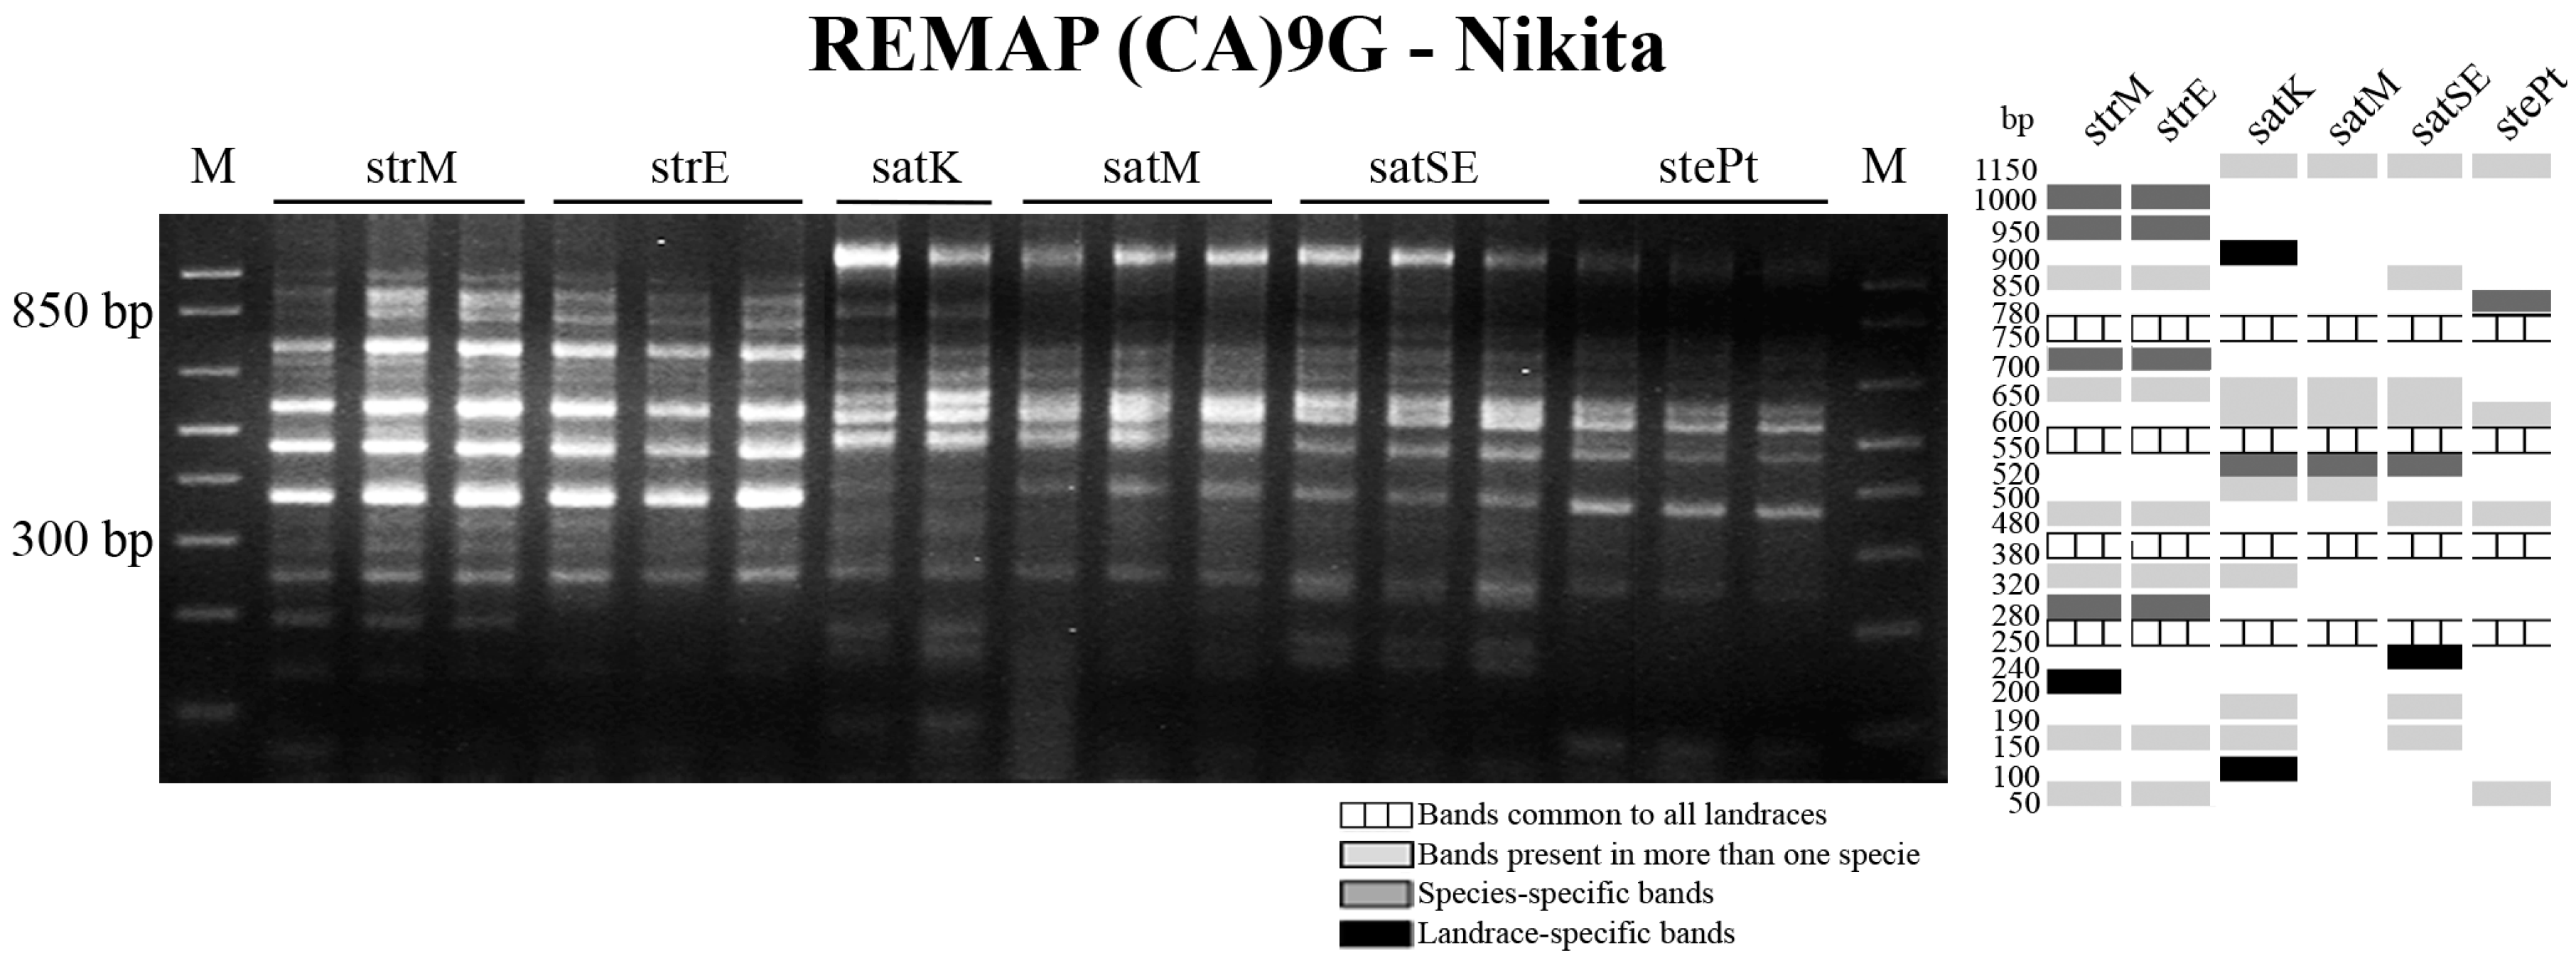
| A. strigosa “Madeira Island” | 1 | 1 | 1 | 5 | 9 | 15 |
| A. strigosa “Elvas” | 1 | 1 | 1 | 5 | 9 | 14 |
| A. sativa “Kyto” | 1 | 1 | 1 | 6 | 10 | 14 |
| A. sativa “Madeira Island” | 1 | 1 | 1 | 7 | 8 | 9 |
| A. sativa “S. Eulália” | 1 | 1 | 1 | 5 | 11 | 13 |
| A. sterilis | 1 | 1 | 1 | 4 | 10 | 9 |
2.1. 45S rDNA Internal Transcribed Sequences Similarity and Nor Loci Diversity

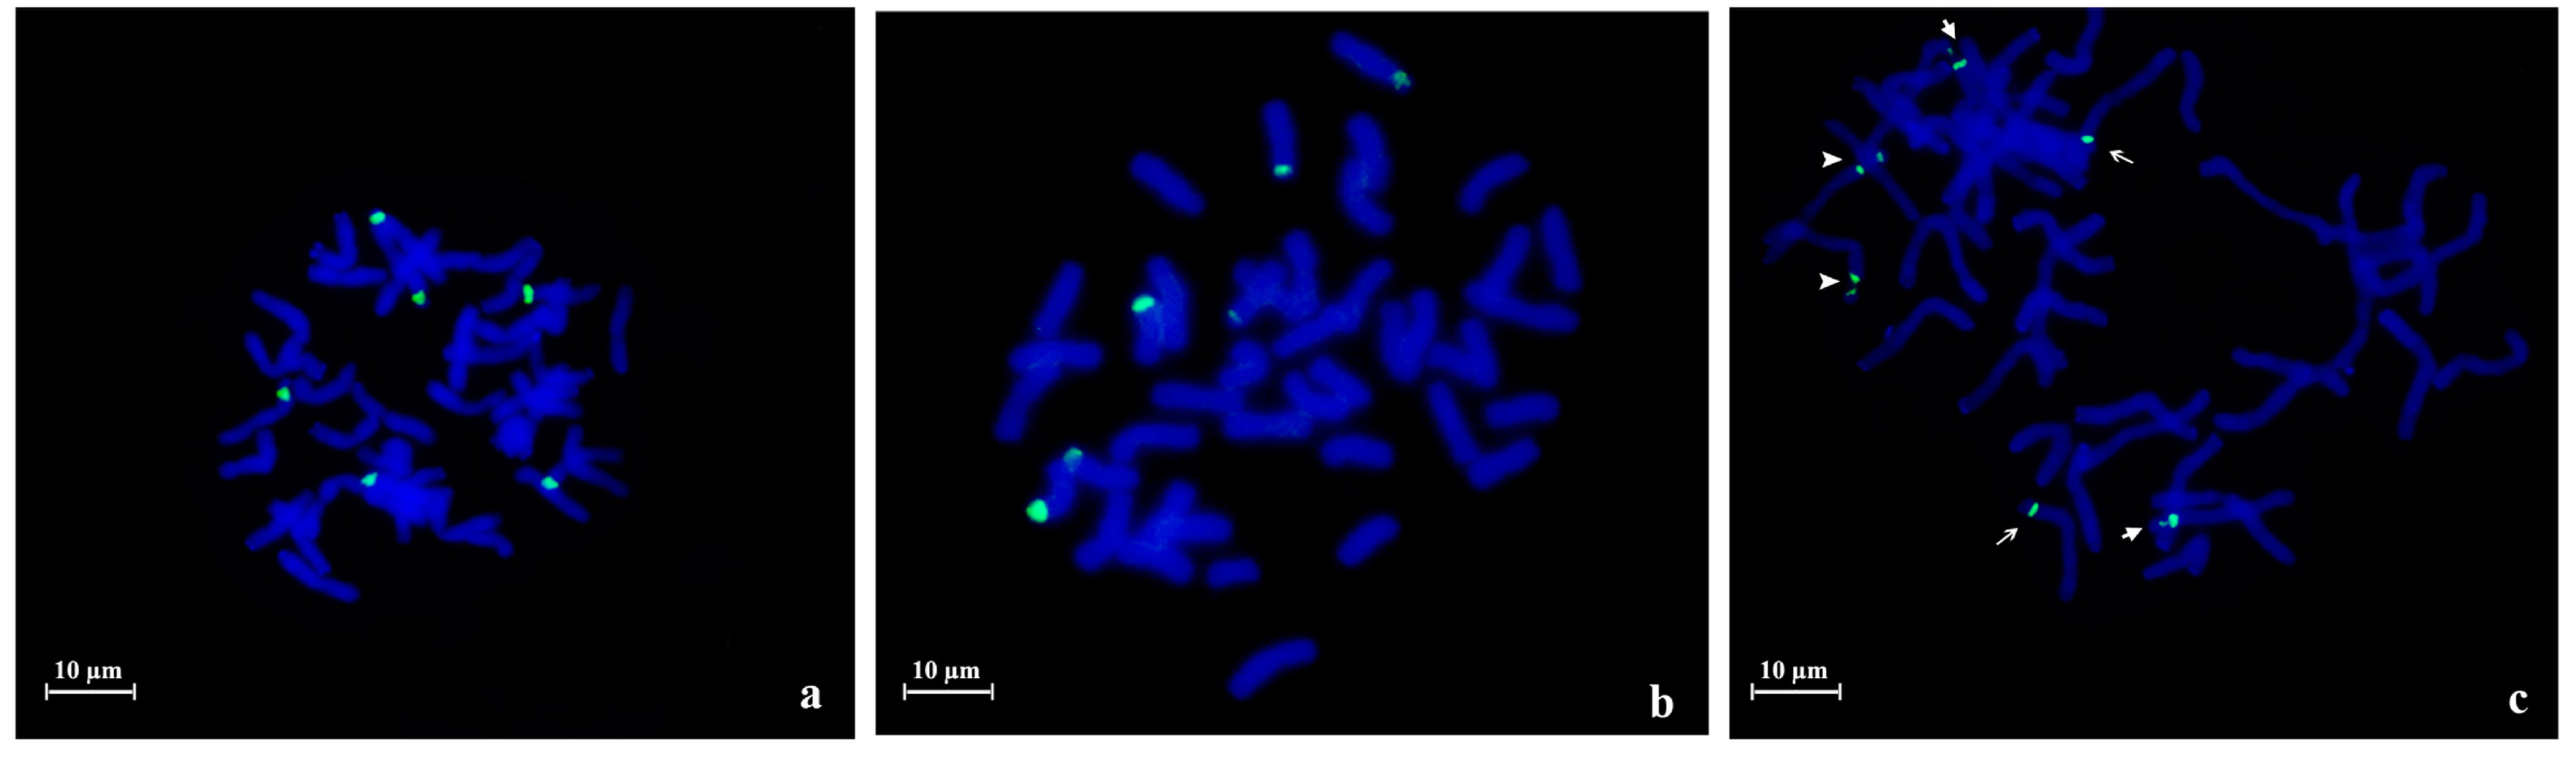
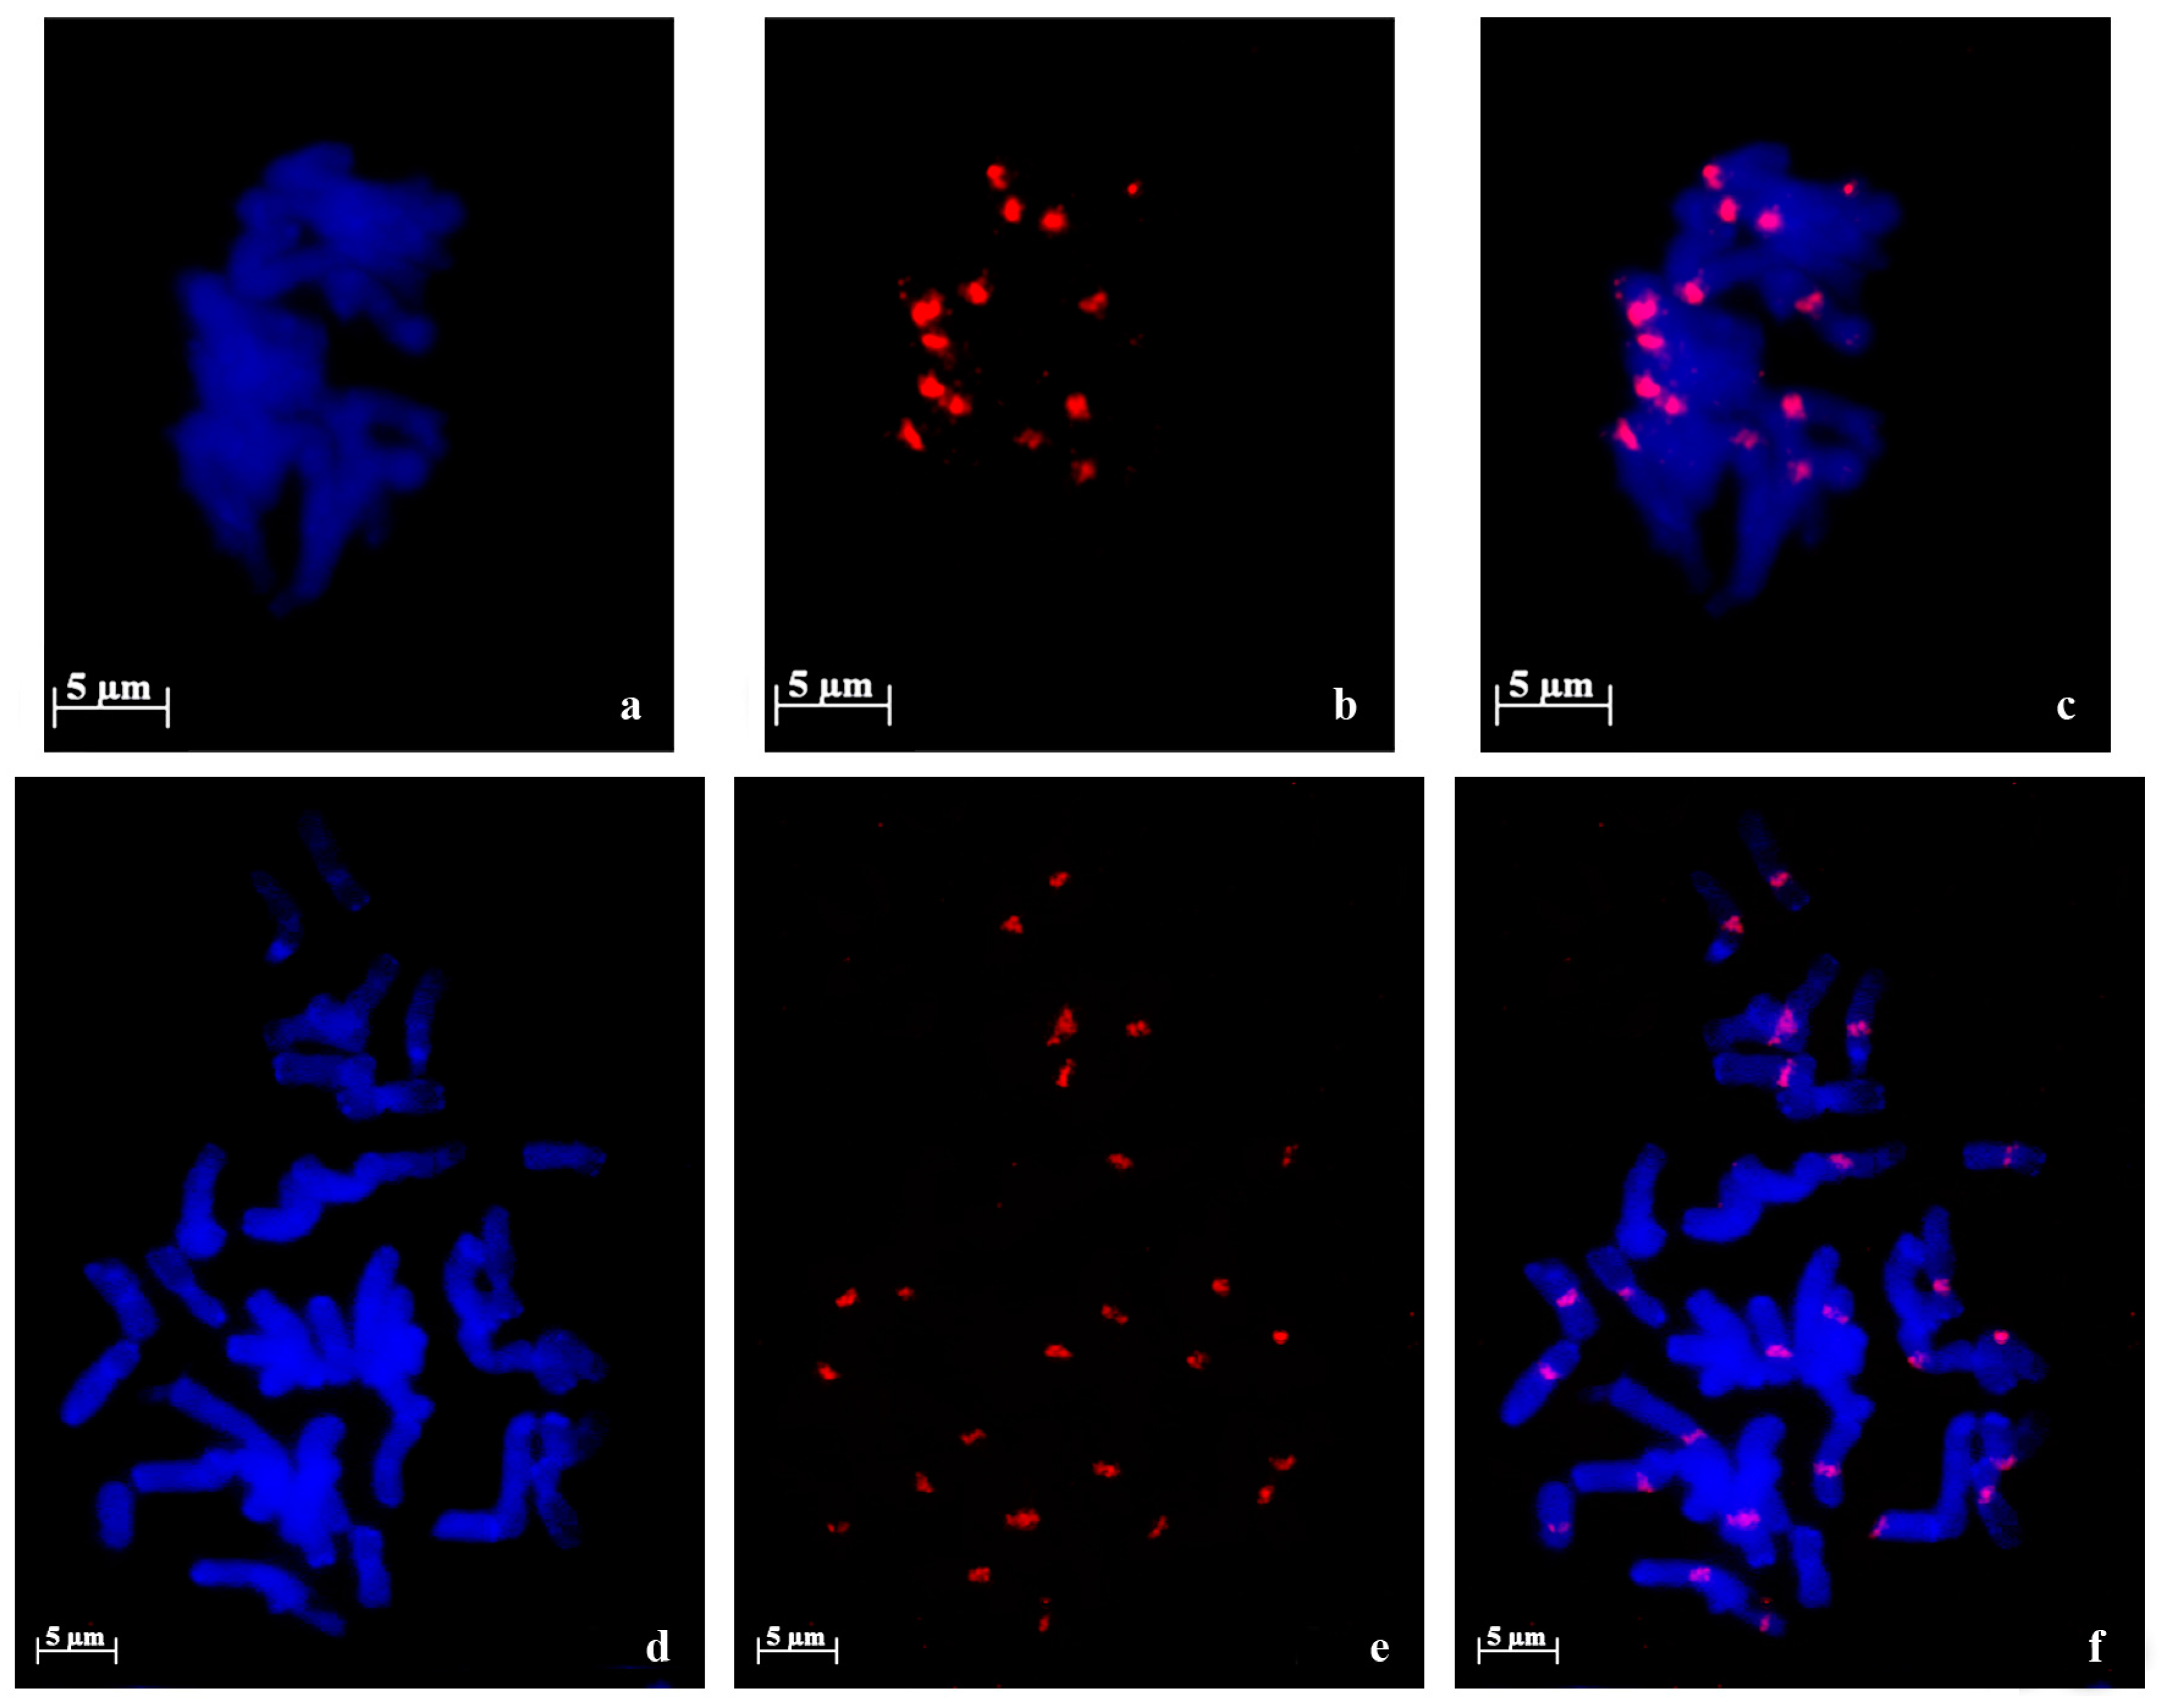
| Species | Accession | Number of NORs | Description |
|---|---|---|---|
| A. strigosa | “Madeira” | 4 | 1 large pair and 1 small pair |
| “Elvas” | 4 | 2 pairs with similar size | |
| A. sativa | “Madeira Island” | 6 | 1 large pair, 1 medium pair and 1 heteromorphic pair (1 medium and 1 small) |
| “S. Eulália” | 6 | 3 pairs with similar sizes | |
| A. sterilis | – | 6 | 1 pair with 1 signal, 1 pair with 2 signals with similar sizes and 1 pair with 2 signals with different sizes |
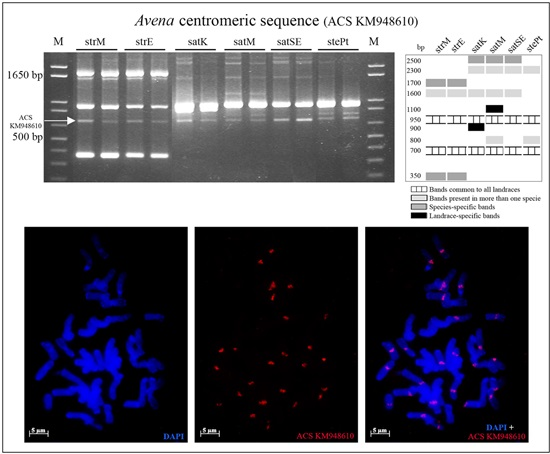
2.2. Novel Repetitive Sequences Were Identified Contributing for Avena Accessions Discrimination
2.3. Retrotransposon and Microsatellite Flanking Sequences Untangled Avena Accessions Discrimination
3. Discussion
4. Materials and Methods
4.1. Plant Material
| Species | Genomic Constitution | Accession | Origin |
|---|---|---|---|
| A. strigosa | AsAs 2n = 14 | 5284/PRT005 | Madeira Island, Portugal |
| BC2531/PRT083 | Elvas, Portugal | ||
| A. sativa | AACCDD 2n = 6x = 42 | “Kyto”, Clav8250/USDA | Finland |
| 2424/PRT005 | Madeira, Island Portugal | ||
| “S. Eulália”/PRT083 | Elvas, Portugal | ||
| A. sterilis | AACCDD 2n = 6x = 42 | PI267989/USDA | Portugal |
4.2. Genomic Analysis through PCR
| Sequence | Sequence Type | Primers | Reference |
|---|---|---|---|
| 45S ITS1 | rDNA | Fow 5′-TCCGTAGGTGAACCTGCGG Rev 5′-GCTGCGTTCTTCATCGATGC | [29] |
| 45S ITS2 | rDNA | Fow 5′-GCATCGATGAAGAACGCAGC Rev 5′-TCCTCCGCTTATTGATATGC | [29] |
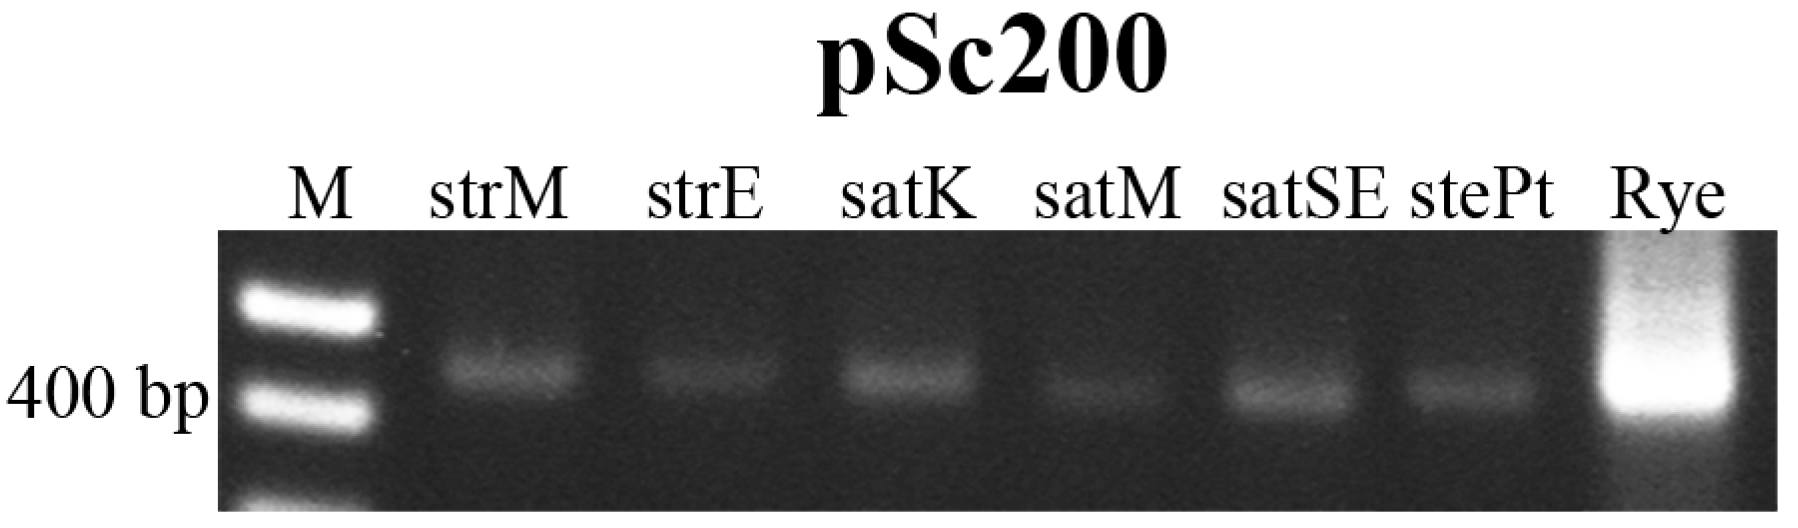
| pSc200 | Telomeric | Fow 5′-TCTTTGATCACCGTTTCTTCG Rev 5′-CCCCACCCATGTATGGATAA | [31] |
| CCS1 | Centromeric | 5′-GGTGCCCGATCTTTCGATGAGA | [28] |
| Nikita LTR | Retrotransposon | 5′-CGCTCCAGCGGTACTGCC | [53] |
| (CA)9G | Microsatellite | 5′-CACACACACACACACACAG | - |
4.3. Sequence Similarity Analysis
4.4. Cytogenetics Analysis through Fluorescent in Situ Hybridization (FISH)
5. Conclusions
Supplementary Materials
Acknowledgments
Author Contributions
Conflicts of Interest
References
- Loskutov, I.G. On evolutionary pathways of Avena species. Genet. Resour. Crop. Evol. 2008, 55, 211–220. [Google Scholar] [CrossRef]
- Baum, B.R. Oats: Wild and Cultivated: A Monograph of the Genus Avena L. (Poaceae); Biosystematics Research Institute, Canada Department of Agriculture, Research Branch: Ottawa, AB, Canada, 1977. [Google Scholar]
- Costa, J.C.; Balsinhas, A.; Cabral, F.; Moreira, I. Distribuição e diferenciação isoenzimática de táxones do género Avena L. Portugaliae Acta Biol. 2000, 19, 373–386. [Google Scholar]
- Loskutov, I.G. Interspecific crosses in the genus Avena L. Russ. J. Genet. 2001, 37, 467–475. [Google Scholar] [CrossRef]
- Loskutov, I.; Rines, H. Avena . In Wild Crop Relatives: Genomic and Breeding Resources; Kole, C., Ed.; Springer: Berlin/Heidelberg, Germany, 2011; pp. 109–183. [Google Scholar]
- Fu, Y.B.; Williams, D.J. AFLP variation in 25 Avena species. Theor. Appl. Genet. 2008, 117, 333–342. [Google Scholar] [CrossRef] [PubMed]
- Li, W.T.; Peng, Y.Y.; Wei, Y.M.; Baum, B.R.; Zheng, Y.L. Relationships among Avena species as revealed by consensus chloroplast simple sequence repeat (ccSSR) markers. Genet. Resour. Crop. Evol. 2009, 56, 465–480. [Google Scholar] [CrossRef]
- Rodionov, A.V.; Tyupa, N.B.; Kim, E.S.; Machs, E.M.; Loskutov, I.G. Genomic configuration of the autotetraploid oat species Avena macrostachya inferred from comparative analysis of ITS1 and ITS2 sequences: On the oat karyotype evolution during the early events of the Avena species divergence. Russ. J. Genet. 2005, 41, 518–528. [Google Scholar] [CrossRef]
- Nikoloudakis, N.; Katsiotis, A. The origin of the C-genome and cytoplasm of Avena polyploids. Theor. Appl. Genet. 2008, 117, 273–281. [Google Scholar] [CrossRef] [PubMed]
- Nikoloudakis, N.; Skaracis, G.; Katsiotis, A. Evolutionary insights inferred by molecular analysis of the ITS1-5.8S-ITS2 and IGS Avena sp sequences. Mol. Phylogenet. Evol. 2008, 46, 102–115. [Google Scholar] [CrossRef] [PubMed]
- Peng, Y.Y.; Baum, B.R.; Ren, C.Z.; Jiang, Q.T.; Chen, G.Y.; Zheng, Y.L.; Wei, Y.M. The evolution pattern of rDNA ITS in Avena and phylogenetic relationship of the Avena species (Poaceae: Aveneae). Hereditas 2010, 147, 183–204. [Google Scholar] [CrossRef] [PubMed]
- Da-Silva, P.R.; Milach, S.C.; Tisian, L.M. Transferability and utility of white oat (Avena sativa) microsatellite markers for genetic studies in black oat (Avena strigosa). Genet. Mol. Res. 2011, 10, 2916–2923. [Google Scholar] [CrossRef] [PubMed]
- Boczkowska, M.; Tarczyk, E. Genetic diversity among polish landraces of common oat (Avena sativa L.). Genet. Resour. Crop Evol. 2013, 60, 2157–2169. [Google Scholar] [CrossRef]
- Montilla-Bason, G.; Sanchez-Martin, J.; Rispail, N.; Rubiales, D.; Mur, L.; Langdon, T.; Griffiths, I.; Howarth, C.; Prats, E. Genetic diversity and population structure among oat cultivars and landraces. Plant Mol. Biol. Rep. 2013, 31, 1305–1314. [Google Scholar] [CrossRef]
- Fu, Y.B.; Chong, J.; Fetch, T.; Wang, M.L. Microsatellite variation in Avena sterilis oat germplasm. Theor. Appl. Genet. 2007, 114, 1029–1038. [Google Scholar] [CrossRef] [PubMed]
- Goffreda, J.C.; Burnquist, W.B.; Beer, S.C.; Tanksley, S.D.; Sorrells, M.E. Application of molecular markers to assess genetic-relationships among accessions of wild oat, Avena sterilis. Theor. Appl. Genet. 1992, 85, 146–151. [Google Scholar] [CrossRef] [PubMed]
- Kalendar, R.; Grob, T.; Regina, M.; Suoniemi, A.; Schulman, A. IRAP and REMAP: Two new retrotransposon-based DNA fingerprinting techniques. Theor. Appl. Genet. 1999, 98, 704–711. [Google Scholar] [CrossRef]
- Vitte, C.; Panaud, O. LTR retrotransposons and flowering plant genome size: Emergence of the increase/decrease model. Cytogenet. Genome Res. 2005, 110, 91–107. [Google Scholar] [CrossRef] [PubMed]
- Ramsay, L.; Macaulay, M.; Cardle, L.; Morgante, M.; degli Ivanissevich, S.; Maestri, E.; Powell, W.; Waugh, R. Intimate association of microsatellite repeats with retrotransposons and other dispersed repetitive elements in barley. Plant J. 1999, 17, 415–425. [Google Scholar] [CrossRef] [PubMed]
- Bento, M.; Gustafson, J.P.; Viegas, W.; Silva, M. Size matters in Triticeae polyploids: Larger genomes have higher remodeling. Genome 2011, 54, 175–183. [Google Scholar] [PubMed]
- Branco, C.J.; Vieira, E.A.; Malone, G.; Kopp, M.M.; Malone, E.; Bernardes, A.; Mistura, C.C.; Carvalho, F.I.; Oliveira, C.A. IRAP and REMAP assessments of genetic similarity in rice. J. Appl. Genet. 2007, 48, 107–113. [Google Scholar] [CrossRef] [PubMed]
- Kuhn, B.C.; Lopez-Ribera, I.; Machado, M.D.P.D.; Vicient, C.M. Genetic diversity of maize germplasm assessed by retrotransposon-based markers. Electrophoresis 2014, 35, 1921–1927. [Google Scholar] [CrossRef] [PubMed]
- Doungous, O.; Kalendar, R.; Adiobo, A.; Schulman, A. Retrotransposon molecular markers resolve cocoyam (Xanthosoma sagittifolium) and taro (Colocasia esculenta) by type and variety. Euphytica 2015, 206, 1–14. [Google Scholar] [CrossRef]
- Tanhuanpaa, P.; Kalendar, R.; Laurila, J.; Schulman, A.H.; Manninen, O.; Kiviharju, E. Generation of SNP markers for short straw in oat (Avena sativa L.). Genome 2006, 49, 282–287. [Google Scholar] [CrossRef] [PubMed]
- Paczos-Grzeda, E.; Bednarek, P.T. Comparative analysis of hexaploid Avena species using REMAP and ISSR methods. Turk. J. Bot. 2014, 38, 1103–1111. [Google Scholar] [CrossRef]
- Vershinin, A.V.; Alkhimova, E.G.; HeslopHarrison, J.S. Molecular diversification of tandemly organized DNA sequences and heterochromatic chromosome regions in some triticeae species. Chromosome Res. 1996, 4, 517–525. [Google Scholar] [CrossRef] [PubMed]
- Abbo, S.; Dunford, R.P.; Foote, T.N.; Reader, S.M.; Flavell, R.B.; Moore, G. Organization of retro-element and stem-loop repeat families in the genomes and nuclei of cereals. Chromosome Res. 1995, 3, 5–15. [Google Scholar] [CrossRef] [PubMed]
- Aragon-Alcaide, L.; Miller, T.; Schwarzacher, T.; Reader, S.; Moore, G. A cereal centromeric sequence. Chromosoma 1996, 105, 261–268. [Google Scholar] [CrossRef] [PubMed]
- White, T.; Bruns, T.; Lee, S.; Taylor, J. Amplification and direct sequencing of fungal ribosomal RNA genes for phylogenetics. In PCR Protocols: A Guide to Methods and Applications; Innis, M., Gelfand, D., Shinsky, J., White, T., Eds.; Academic Press: New York, NY, USA, 1990; pp. 315–322. [Google Scholar]
- Larkin, M.A.; Blackshields, G.; Brown, N.P.; Chenna, R.; McGettigan, P.A.; McWilliam, H.; Valentin, F.; Wallace, I.M.; Wilm, A.; Lopez, R.; et al. Clustal W and clustal X version 2.0. Bioinformatics 2007, 23, 2947–2948. [Google Scholar] [CrossRef] [PubMed]
- Bento, M.; Gustafson, P.; Viegas, W.; Silva, M. Genome merger: From sequence rearrangements in triticale to their elimination in wheat-rye addition lines. Theor. Appl. Genet. 2010, 121, 489–497. [Google Scholar] [CrossRef] [PubMed]
- Vershinin, A.V.; Schwarzacher, T.; Heslopharrison, J.S. The large-scale genomic organization of repetitive DNA families at the telomeres of rye chromosomes. Plant Cell 1995, 7, 1823–1833. [Google Scholar] [CrossRef] [PubMed]
- Li, B.C.; Choulet, F.; Heng, Y.F.; Hao, W.W.; Paux, E.; Liu, Z.; Yue, W.; Jin, W.W.; Feuillet, C.; Zhang, X.Y. Wheat centromeric retrotransposons: The new ones take a major role in centromeric structure. Plant J. 2013, 73, 952–965. [Google Scholar] [CrossRef] [PubMed]
- Banaei-Moghaddam, A.M.; Schubert, V.; Kumke, K.; Weiss, O.; Klemme, S.; Nagaki, K.; Macas, J.; Gonzalez-Sanchez, M.; Heredia, V.; Gomez-Revilla, D.; et al. Nondisjunction in favor of a chromosome: The mechanism of rye B chromosome drive during pollen mitosis. Plant Cell 2012, 24, 4124–4134. [Google Scholar] [CrossRef] [PubMed]
- Hudakova, S.; Michalek, W.; Presting, G.G.; ten Hoopen, R.; dos Santos, K.; Jasencakova, Z.; Schubert, I. Sequence organization of barley centromeres. Nucleic Acids Res. 2001, 29, 5029–5035. [Google Scholar] [CrossRef] [PubMed]
- Dice, L.R. Measures of the amount of ecologic association between species. Ecology 1945, 26, 297–302. [Google Scholar] [CrossRef]
- Linares, C.; Gonzalez, J.; Ferrer, E.; Fominaya, A. The use of double fluorescence in situ hybridization to physically map the positions of 5S rDNA genes in relation to the chromosomal location of 18S-5.8S-26S rDNA and a C genome specific DNA sequence in the genus Avena. Genome 1996, 39, 535–542. [Google Scholar] [CrossRef] [PubMed]
- Badaeva, E.D.; Shelukhina, O.Y.; Goryunova, S.V.; Loskutov, I.G.; Pukhalskiy, V.A. Phylogenetic relationships of tetraploid AB-genome Avena species evaluated by means of cytogenetic (C-banding and FISH) and RADP analyses. J. Bot. 2010, 2010. [Google Scholar] [CrossRef]
- Badaeva, E.D.; Shelukhina, O.Y.; Dedkova, O.S.; Loskutov, I.G.; Pukhalskyi, V.A. Comparative cytogenetic analysis of hexaploid Avena L. Species. Russ. J. Genet. 2011, 47, 691–702. [Google Scholar] [CrossRef]
- Fominaya, A.; Hueros, G.; Loarce, Y.; Ferrer, E. Chromosomal distribution of a repeated DNA sequence from C-genome heterochromatin and the identification of a new ribosomal DNA locus in the Avena genus. Genome 1995, 38, 548–557. [Google Scholar] [CrossRef] [PubMed]
- Jellen, E.N.; Phillips, R.L.; Rines, H.W. C-banded karyotypes and polymorphisms in hexaploid oat accessions (Avena spp.) using Wright’s stain. Genome 1993, 36, 1129–1137. [Google Scholar] [CrossRef] [PubMed]
- Linares, C.; Vega, C.; Ferrer, E.; Fominaya, A. Identification of C-banded chromosomes in meiosis and the analysis of nucleolar activity in Avena byzantina C. Koch cv “Kanota”. TAG. Theor. Appl. Genet. 1992, 83, 650–654. [Google Scholar] [CrossRef] [PubMed]
- Irigoyen, M.L.; Linares, C.; Ferrer, E.; Fominaya, A. Fluorescence in situ hybridization mapping of Avena sativa L. cv. Sunii and its monosomic lines using cloned repetitive DNA sequences. Genome 2002, 45, 1230–1237. [Google Scholar] [CrossRef] [PubMed]
- Linares, C.; Ferrer, E.; Fominaya, A. Discrimination of the closely related a and d genomes of the hexaploid oat Avena sativa L. Proc. Natl. Acad. Sci. USA 1998, 95, 12450–12455. [Google Scholar] [CrossRef] [PubMed]
- Tomas, D.; Brazao, J.; Viegas, W.; Silva, M. Differential effects of high-temperature stress on nuclear topology and transcription of repetitive noncoding and coding rye sequences. Cytogenet. Genome Res. 2013, 139, 119–127. [Google Scholar] [CrossRef] [PubMed]
- Langdon, T.; Seago, C.; Mende, M.; Leggett, M.; Thomas, H.; Foster, J.W.; Thomas, H.; Jones, R.N.; Jenkins, G. Retrotransposon evolution in diverse plant genomes. Genetics 2000, 156, 313–325. [Google Scholar] [PubMed]
- Presting, G.G.; Malysheva, L.; Fuchs, J.; Schubert, I. A TY3/GYPSY retrotransposon-like sequence localizes to the centromeric regions of cereal chromosomes. Plant J. 1998, 16, 721–728. [Google Scholar] [CrossRef] [PubMed]
- Fujigaki, J.; Tsuchiya, T. Karyotype analysis in a haploid plant of an inbred rye, Secale cereale l, by acetocarmine-giemsa staining technique. Z. Pflanzenzucht 1985, 94, 234–243. [Google Scholar]
- Tanhuanpaa, P.; Kalendar, R.; Schulman, A.H.; Kiviharju, E. A major gene for grain cadmium accumulation in oat (Avena sativa L.). Genome 2007, 50, 588–594. [Google Scholar] [PubMed]
- Kalendar, R.; Schulman, A. Transposon-based tagging: IRAP, REMAP, and IPBS. In Molecular Plant Taxonomy; Besse, P., Ed.; Humana Press: Totowa, NJ, USA, 2014; Volume 1115, pp. 233–255. [Google Scholar]
- Doyle, J.J.; Doyle, J.L. A rapid DNA isolation procedure for small quantities of fresh leaf tissue. Phytochem. Bull. 1987, 19, 11–15. [Google Scholar]
- Gerlach, W.L.; Bedbrook, J.R. Cloning and characterization of ribosomal-RNA genes from wheat and barley. Nucleic Acids Res. 1979, 7, 1869–1885. [Google Scholar] [CrossRef] [PubMed]
- Baumel, A.; Ainouche, M.; Kalendar, R.; Schulman, A.H. Retrotransposons and genomic stability in populations of the young allopolyploid species Spartina anglica C.E. Hubbard (Poaceae). Mol. Biol. Evol. 2002, 19, 1218–1227. [Google Scholar] [CrossRef] [PubMed]
- Hall, T.A. Bioedit: A user-friendly biological sequence alignment editor and analysis program for windows 95/98/nt. Nucleic Acids Symp. Ser. 1999, 41, 95–98. [Google Scholar]
- Rohlf, F.J. NTSYS-pc: Numerical Taxonomy and Multivariate Analysis System, Version 2.1; Applied Biostatistics Inc.: New York, NY, USA, 2000. [Google Scholar]
- Pina-Martins, F.; Paulo, O.S. Concatenator: Sequence data matrices handling made easy. Mol. Ecol. Resour. 2008, 8, 1254–1255. [Google Scholar] [CrossRef] [PubMed]
© 2016 by the authors; licensee MDPI, Basel, Switzerland. This article is an open access article distributed under the terms and conditions of the Creative Commons by Attribution (CC-BY) license (http://creativecommons.org/licenses/by/4.0/).
Share and Cite
Tomás, D.; Rodrigues, J.; Varela, A.; Veloso, M.M.; Viegas, W.; Silva, M. Use of Repetitive Sequences for Molecular and Cytogenetic Characterization of Avena Species from Portugal. Int. J. Mol. Sci. 2016, 17, 203. https://doi.org/10.3390/ijms17020203
Tomás D, Rodrigues J, Varela A, Veloso MM, Viegas W, Silva M. Use of Repetitive Sequences for Molecular and Cytogenetic Characterization of Avena Species from Portugal. International Journal of Molecular Sciences. 2016; 17(2):203. https://doi.org/10.3390/ijms17020203
Chicago/Turabian StyleTomás, Diana, Joana Rodrigues, Ana Varela, Maria Manuela Veloso, Wanda Viegas, and Manuela Silva. 2016. "Use of Repetitive Sequences for Molecular and Cytogenetic Characterization of Avena Species from Portugal" International Journal of Molecular Sciences 17, no. 2: 203. https://doi.org/10.3390/ijms17020203
APA StyleTomás, D., Rodrigues, J., Varela, A., Veloso, M. M., Viegas, W., & Silva, M. (2016). Use of Repetitive Sequences for Molecular and Cytogenetic Characterization of Avena Species from Portugal. International Journal of Molecular Sciences, 17(2), 203. https://doi.org/10.3390/ijms17020203