Article

How Common Is Disorder? Occurrence of Disordered Residues in Four Domains of Life

by
Mikhail Yu. Lobanov
and
Oxana V. Galzitskaya
*
Institute of Protein Research, Russian Academy of Sciences, Pushchino 142290, Moscow Region, Russia
*
Author to whom correspondence should be addressed.
Int. J. Mol. Sci. 2015, 16(8), 19490-19507; https://doi.org/10.3390/ijms160819490
Submission received: 2 July 2015 / Revised: 2 August 2015 / Accepted: 3 August 2015 / Published: 18 August 2015

Abstract

:
Disordered regions play important roles in protein adaptation to challenging environmental conditions. Flexible and disordered residues have the highest propensities to alter the protein packing. Therefore, identification of disordered/flexible regions is important for structural and functional analysis of proteins. We used the IsUnstruct program to predict the ordered or disordered status of residues in 122 proteomes, including 97 eukaryotic and 25 large bacterial proteomes larger than 2,500,000 residues. We found that bacterial and eukaryotic proteomes contain comparable fraction of disordered residues, which was 0.31 in the bacterial and 0.38 in the eukaryotic proteomes. Additional analysis of the total of 1540 bacterial proteomes of various sizes yielded a smaller fraction of disordered residues, which was only 0.26. Together, the results showed that the larger is the size of the proteome, the larger is the fraction of the disordered residues. A continuous dependence of the fraction of disordered residues on the size of the proteome is observed for four domains of life: Eukaryota, Bacteria, Archaea, and Viruses. Furthermore, our analysis of 122 proteomes showed that the fraction of disordered residues increased with increasing the length of homo-repeats for polar, charged, and small residues, and decreased for hydrophobic residues. The maximal fraction of disordered residues was obtained for proteins containing lysine and arginine homo-repeats. The minimal fraction was found in valine and leucine homo-repeats. For 15-residue long homo-repeats these values were 0.2 (for Val and Leu) and 0.7 (for Lys and Arg).

Graphical Abstract

1. Introduction

Prediction of 3D protein structure and function is a general direction of structural genomics. Of special interest is the search for important functional regions and motifs in a polypeptide chain. To this end, several databases are currently available: PROSITE, InterPro, Pfam, and ModiDP [1,2,3,4]. Protein regions without a fixed structure, a.k.a. disordered regions, often play important functional roles, yet such regions cannot be resolved by X-ray crystallography. Therefore, prediction of disordered regions for various proteomes is necessary to identify fragments of globular proteins amenable to crystallization, as well as to understand protein functions and their environmental adaptability.
Protein adaptation to extreme conditions is achieved via the major functional simplification apparent at the level of both the genome and the individual genes and proteins [5,6]. The adaptation of the catalytic, structural and regulatory functions of proteins to extreme conditions (high or low temperatures, salinity, etc.) is of particular interest. To understand the molecular mechanism of the protein adaptation, one should either rely on the experimentally determined 3D structures of the proteins and/or analyze their sequences. Here we carried out sequence analyses of 122 eukaryotic and bacterial proteomes to predict their disordered regions.
We created the first library of disordered regions based on the known protein structures from the clustered protein data bank [7,8]. The library currently contains 171 disordered patterns. Most of such patterns comprise amino acid motifs with low complexity, including homo-repeats that are known to be disordered [8,9]. One example is poly-His repeats that may play important functional roles. For example, six consecutive histidines facilitate efficient purification of a recombinant protein on a nickel column [10]. Moreover, functional histidine repeats frequently occur in the human proteome [7]. The minimal length of the homo-repeats that can influence the protein structure and function is thought to be 5–7 residues [7,10,11]. Increasing the length of homo-repeats can lead to enhanced protein aggregation and amyloid fibril formation [12]. Therefore, the presence of long repeats in proteins is often linked to amyloid diseases. For example, Huntington’s disease [13] involves long poly-glutamine repeats in protein huntingtin, whereas ocular muscular dystrophy involves poly-alanine repeats in polyadenine-binding protein 2 [14,15].
Recently we analyzed the occurrence of the disordered patterns in 122 eukaryotic and bacterial proteomes to create the HRaP database [16]. Furthermore, we proposed a new phyloproteomic criterion based on the occurrence of simple motifs that can be imprints of evolutionary history. We studied the occurrences of 11,780 six-residue-long motifs consisting of two randomly located amino acids in 97 eukaryotic and 25 bacterial proteomes [17]. Here we address two questions. First, how many disordered residues are there in 122 eukaryotic and bacterial proteomes? Second, is it possible to change the dependence of the fraction of the disordered residues on the length of the protein homo-repeat?

2. Results and Discussion

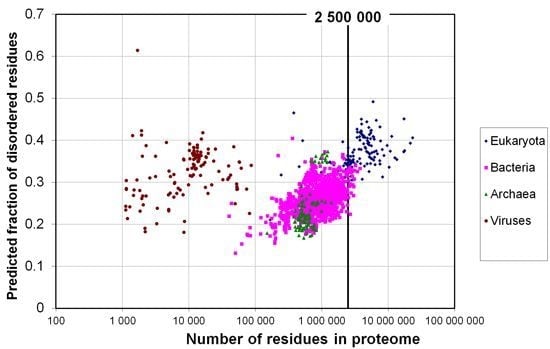
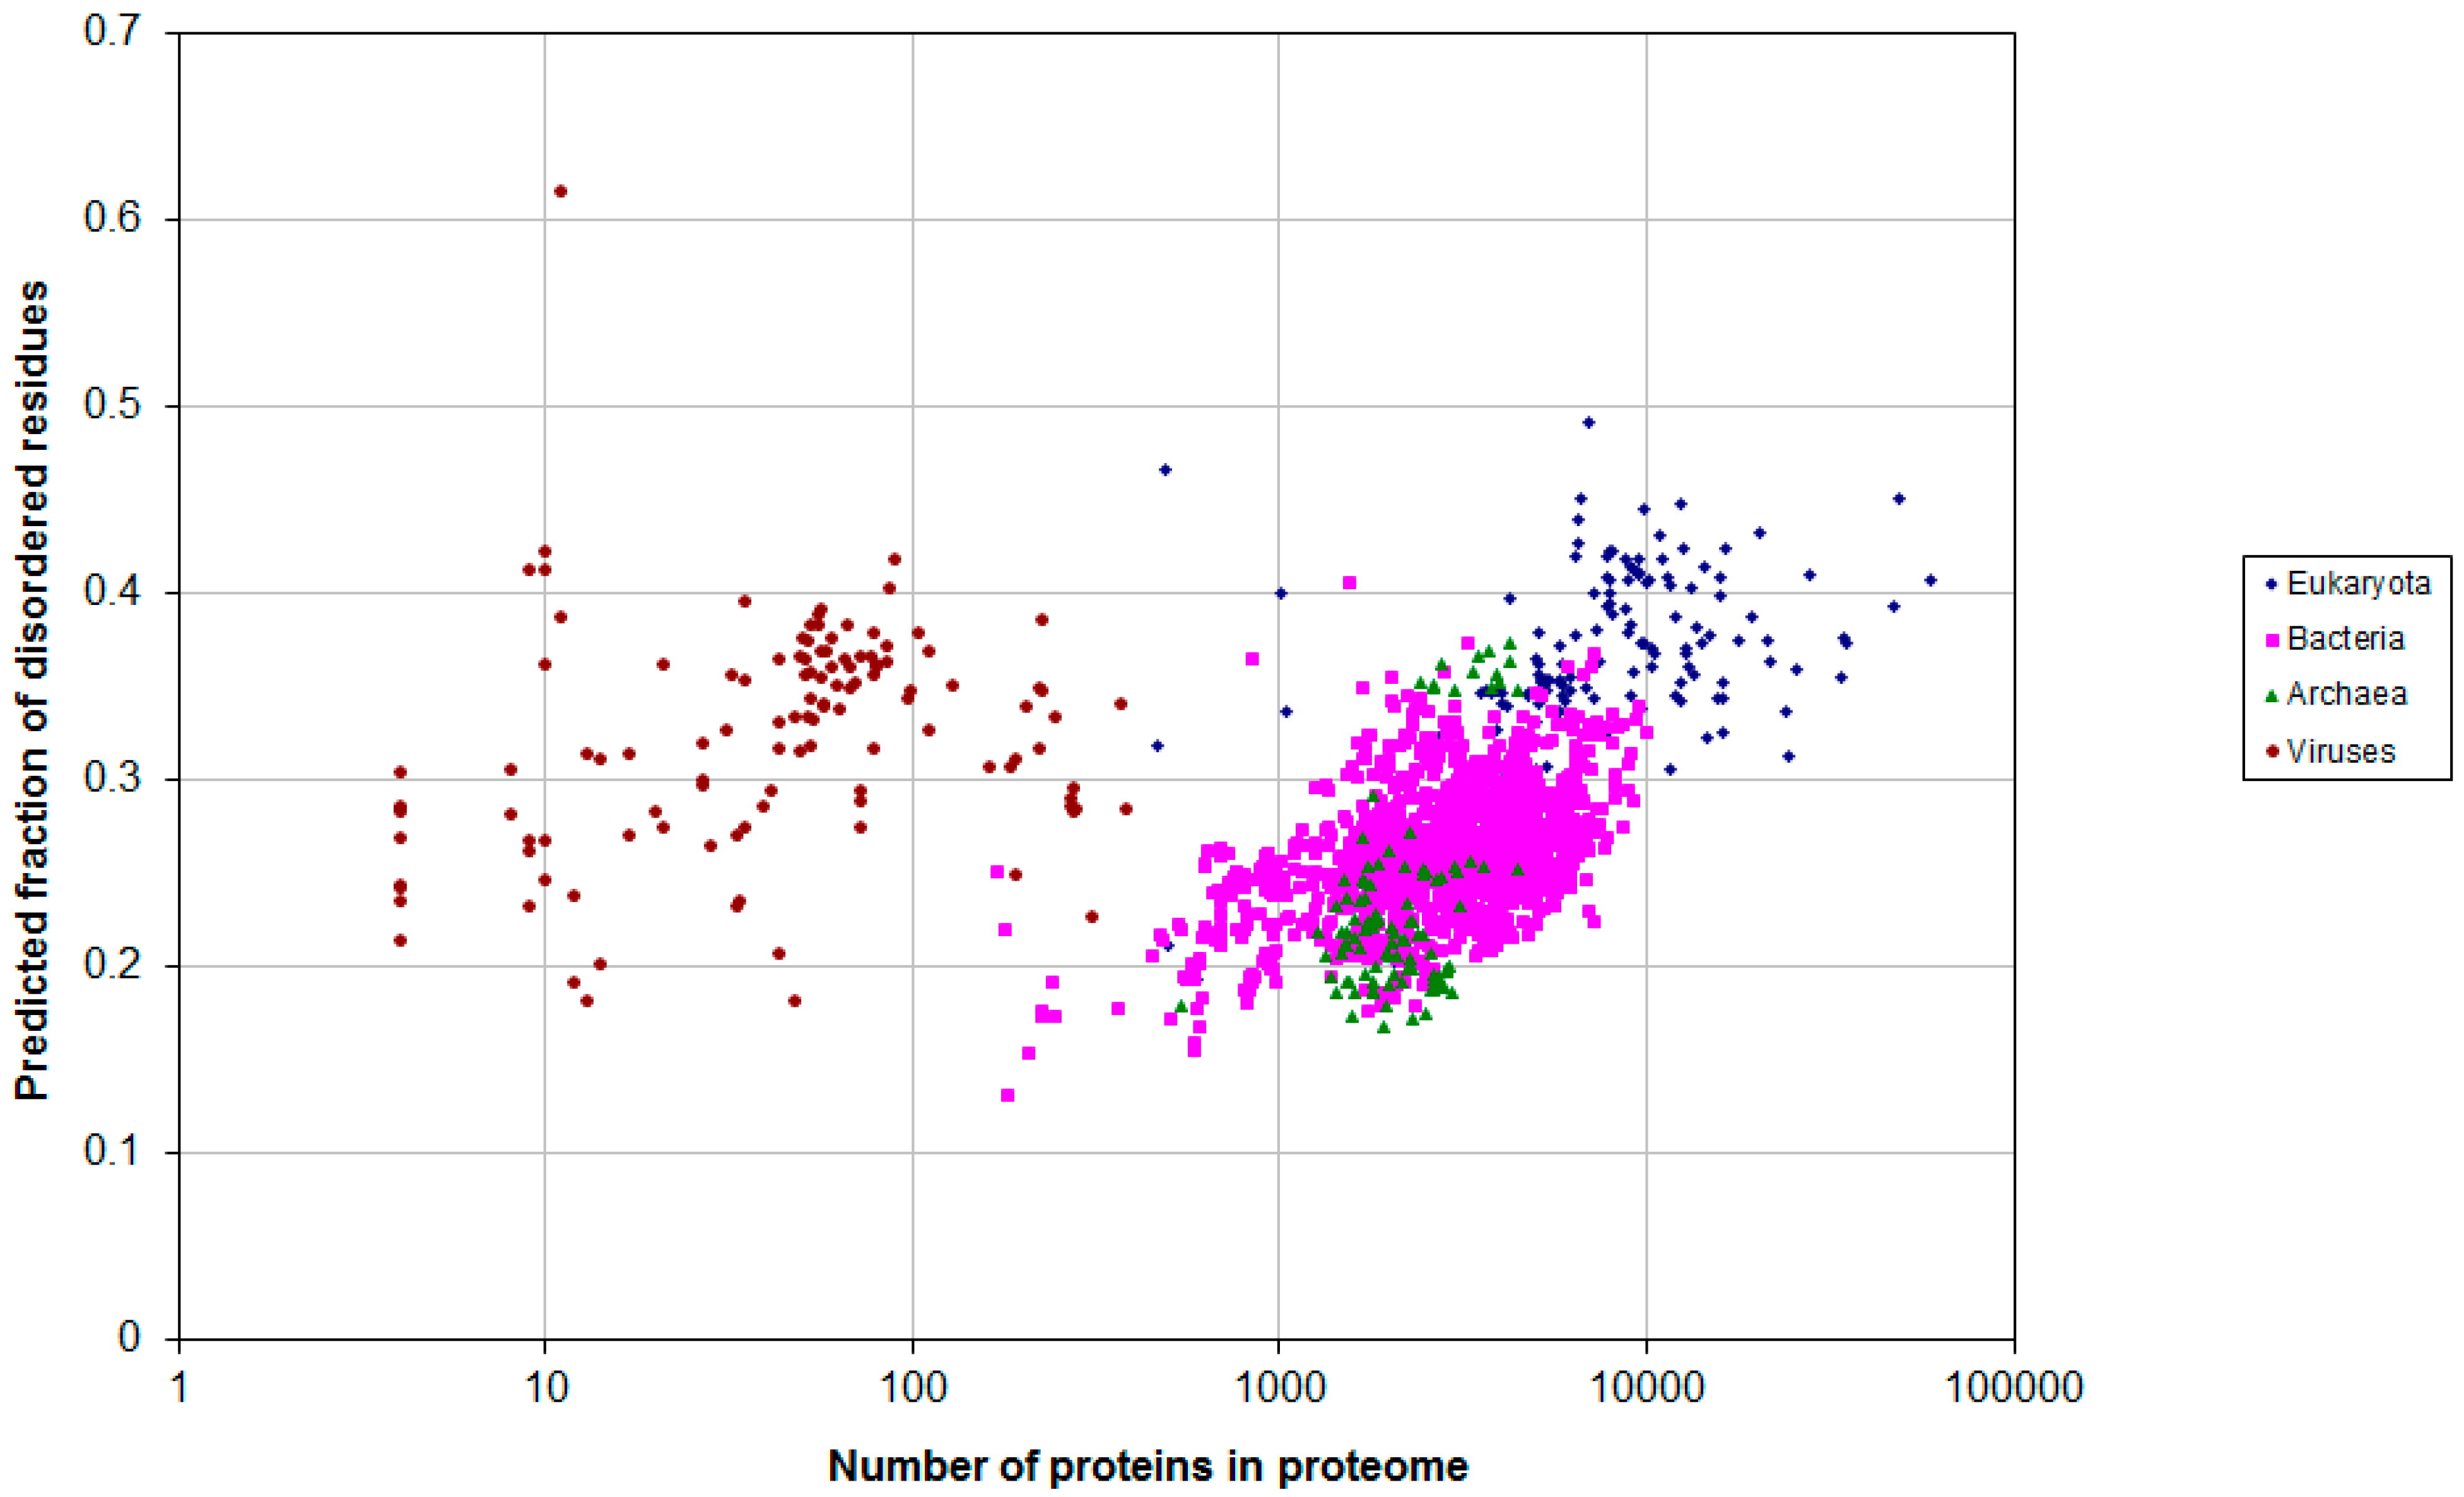
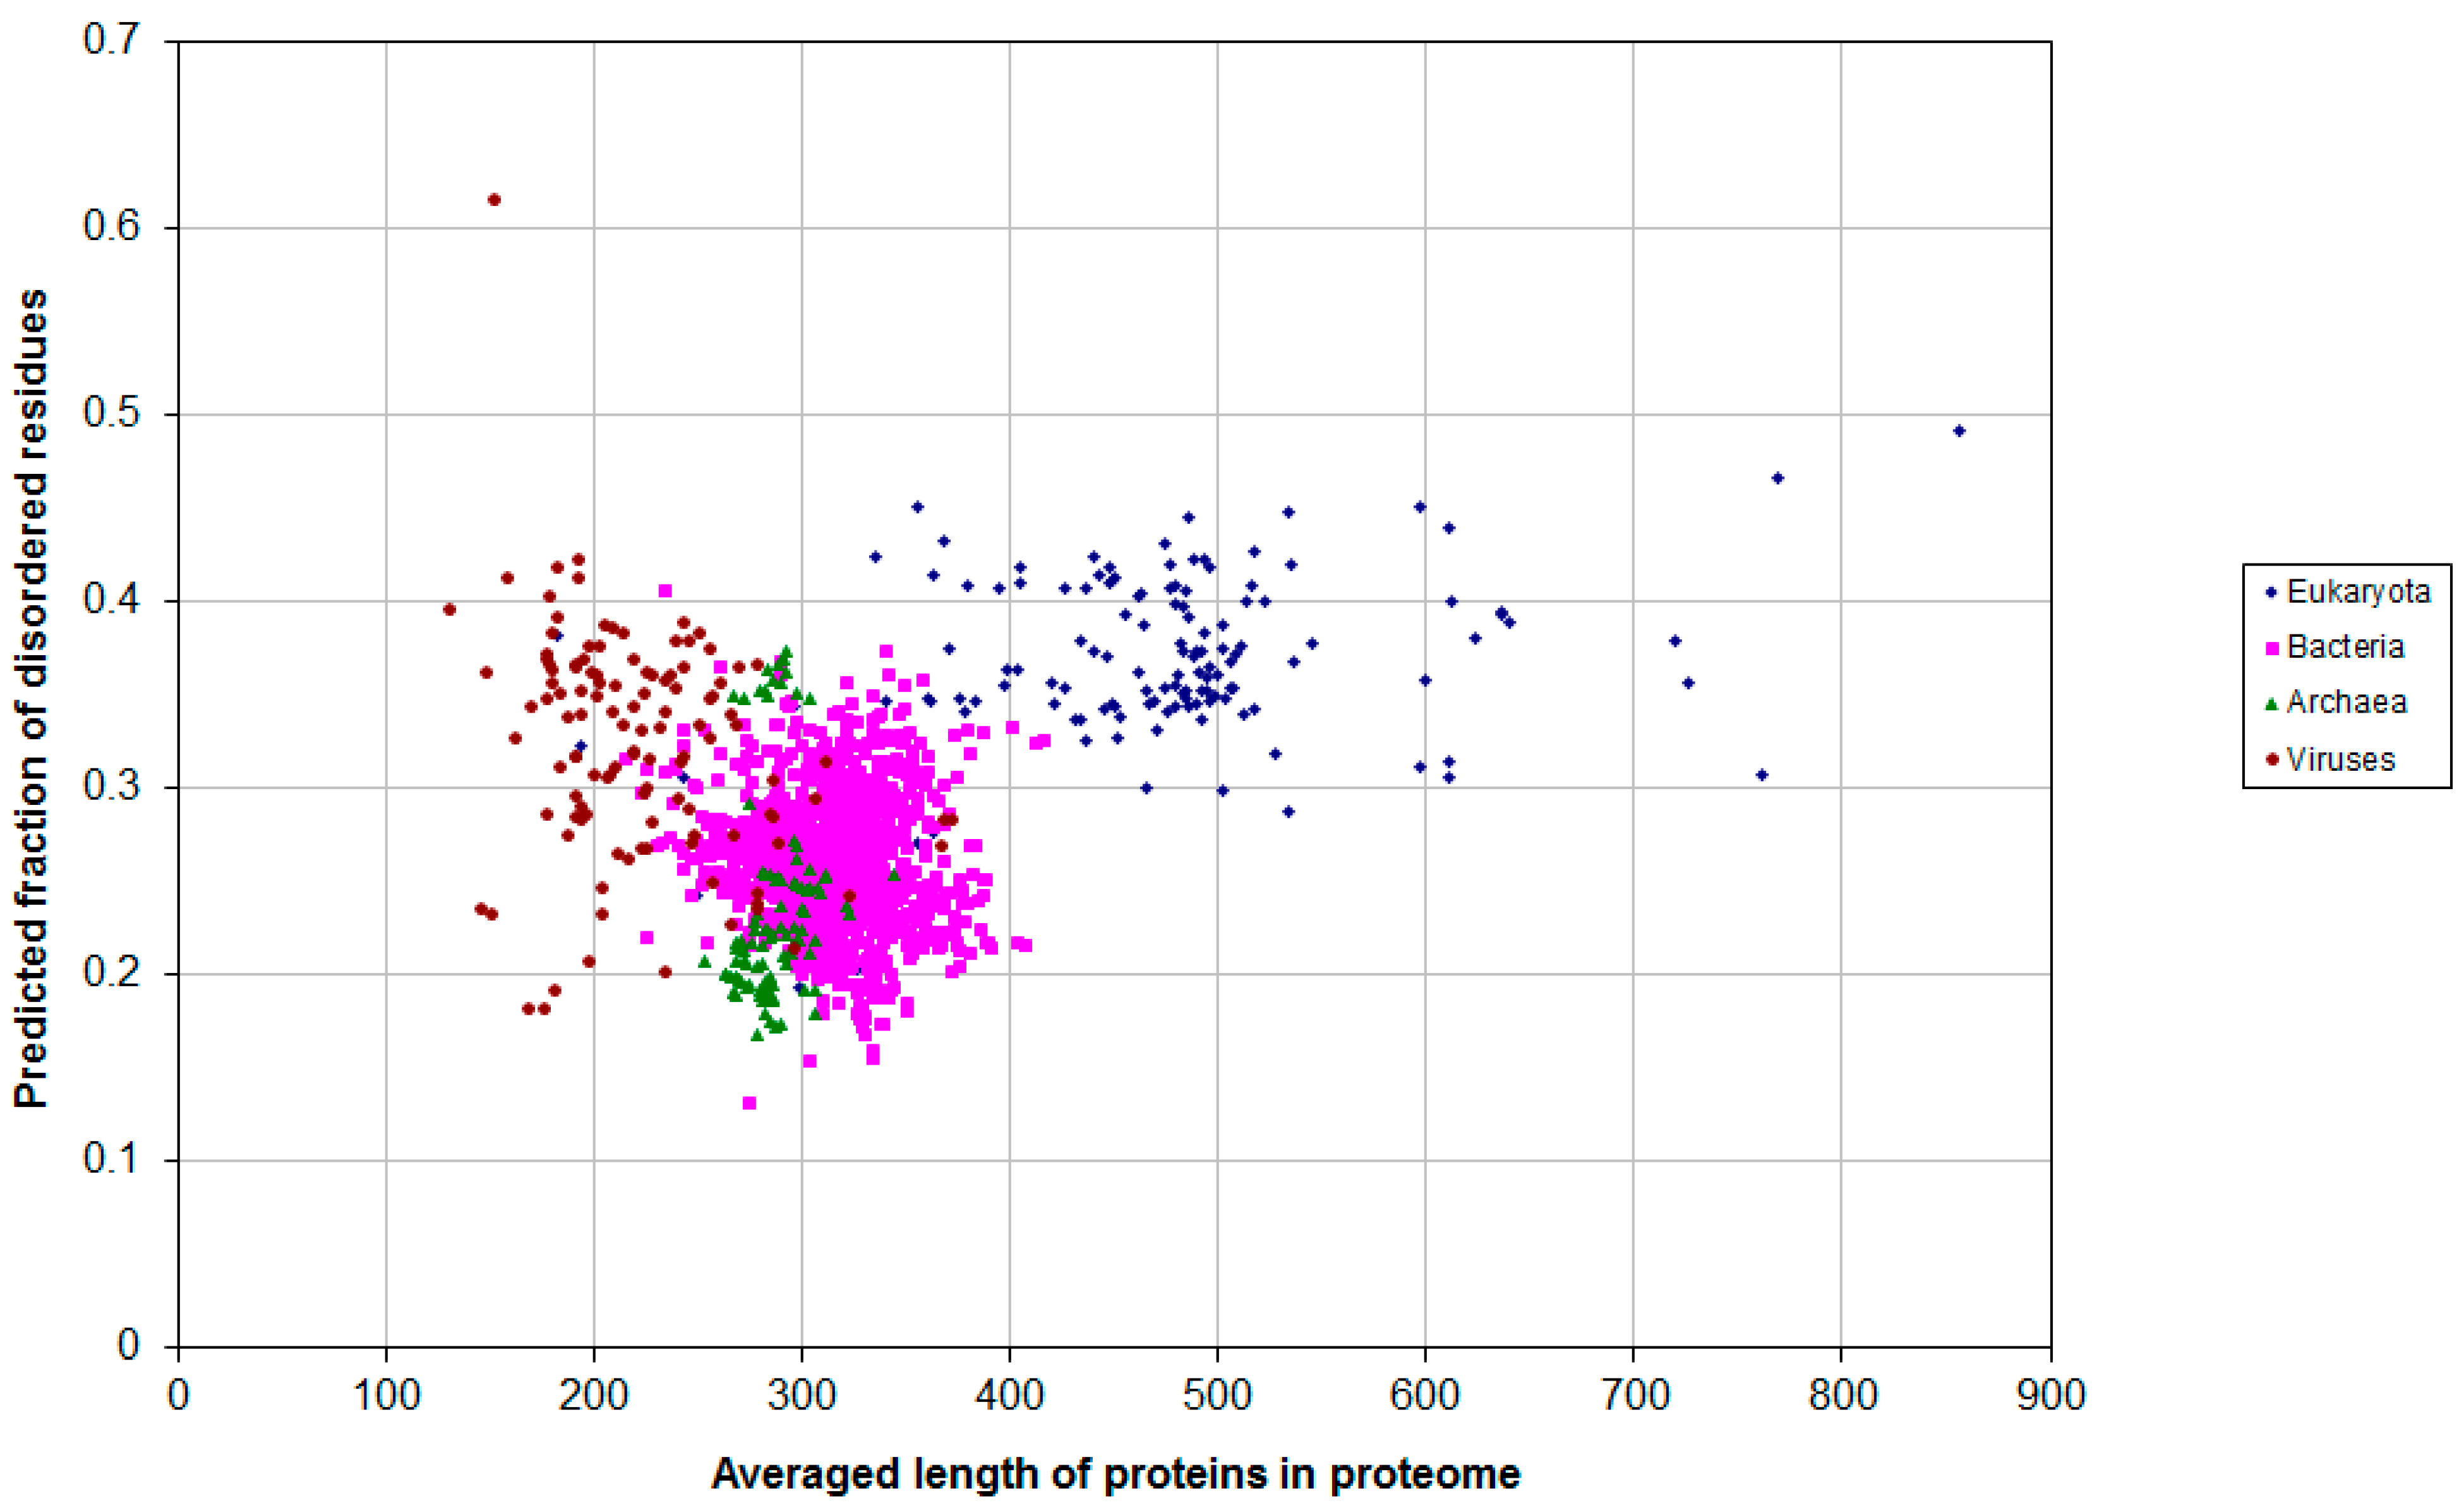
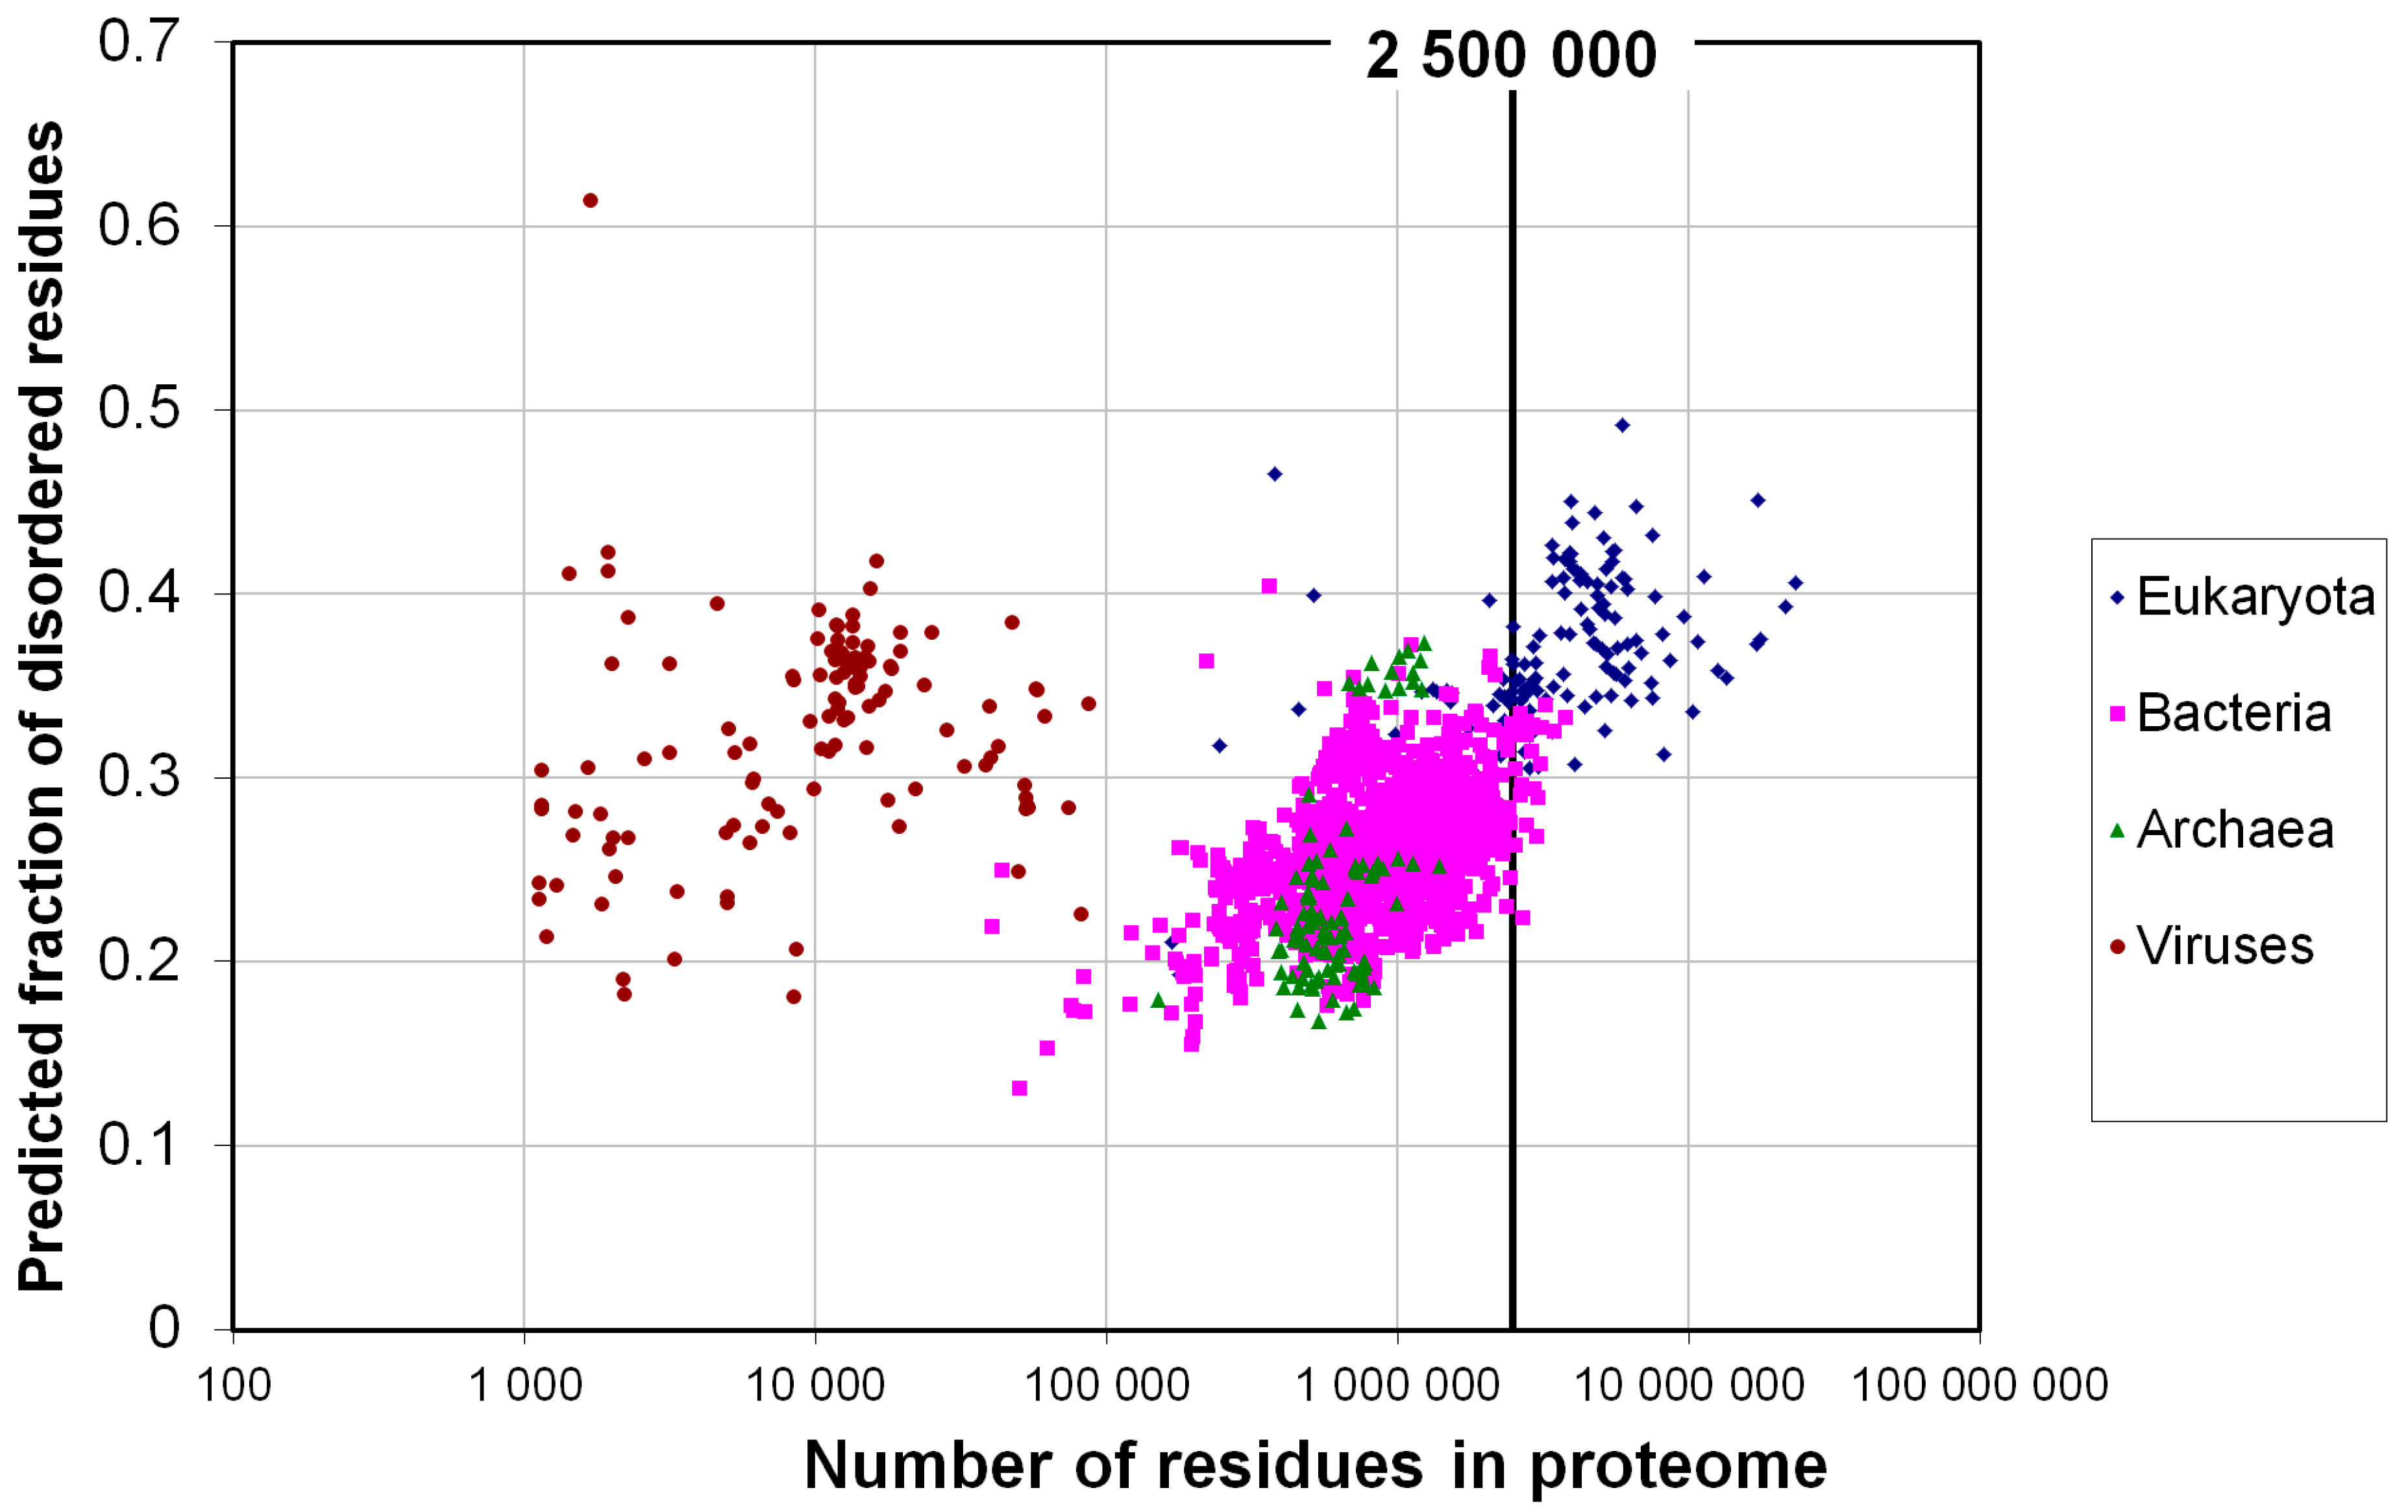
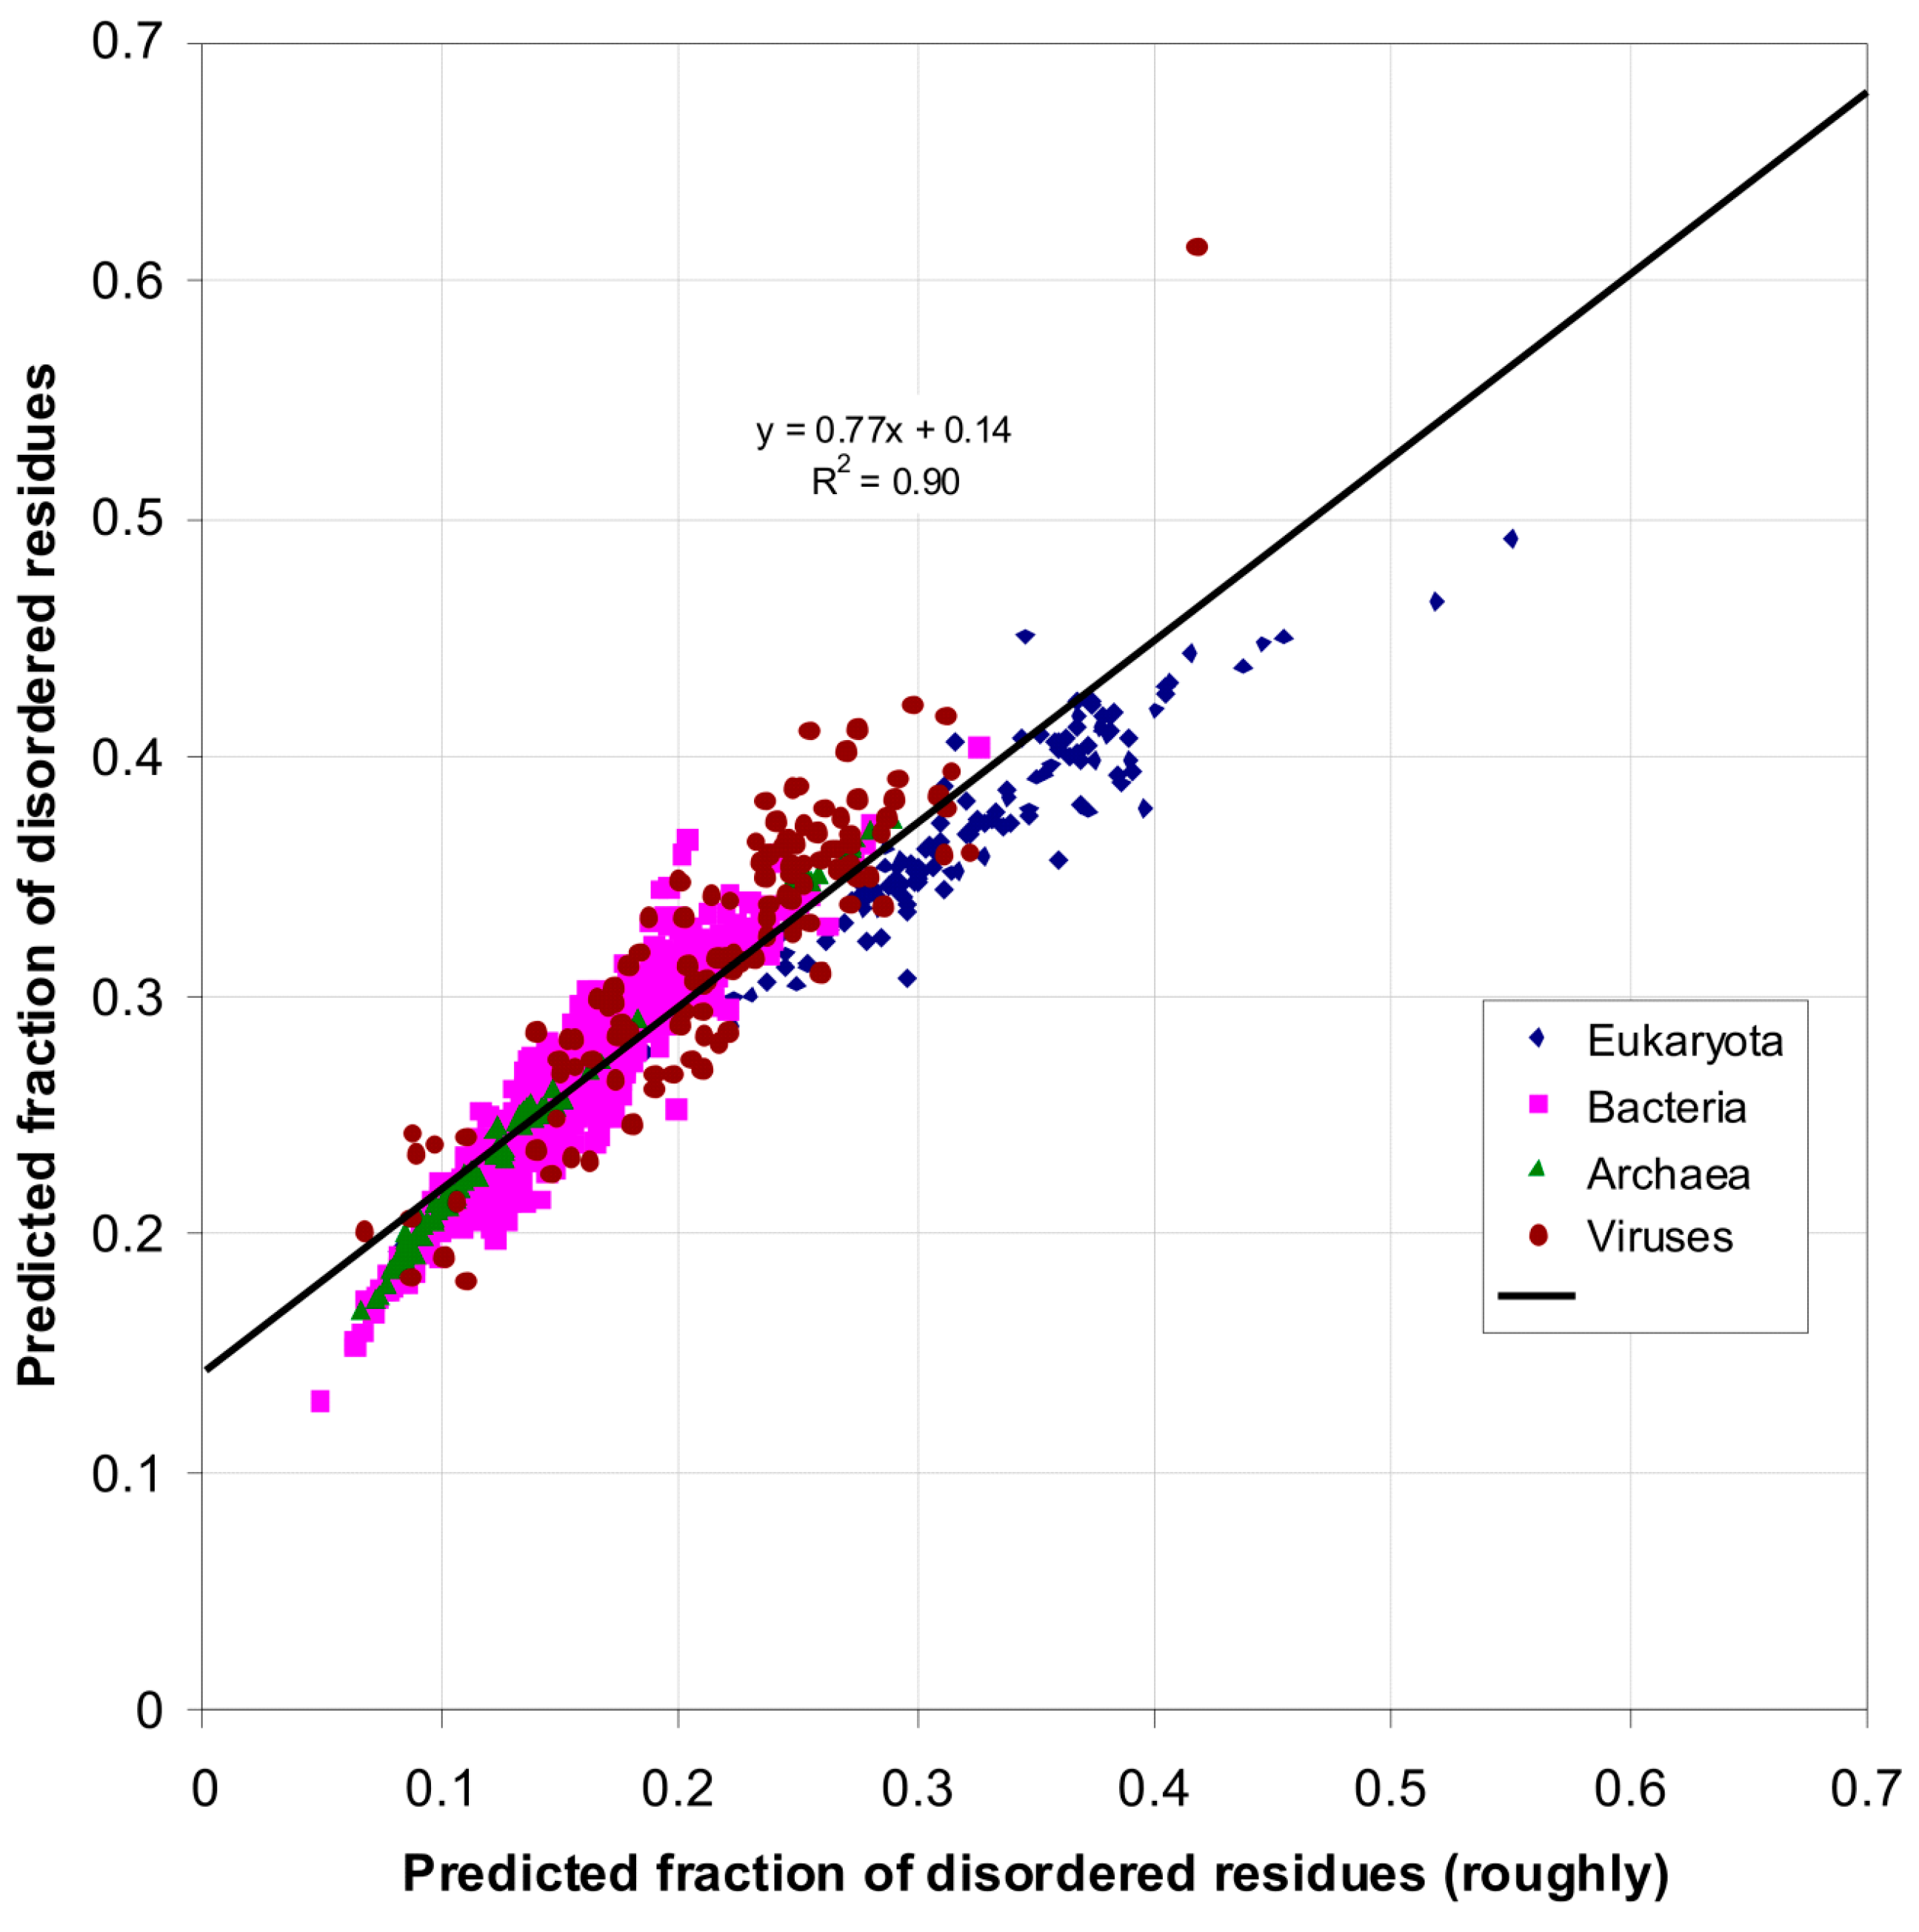
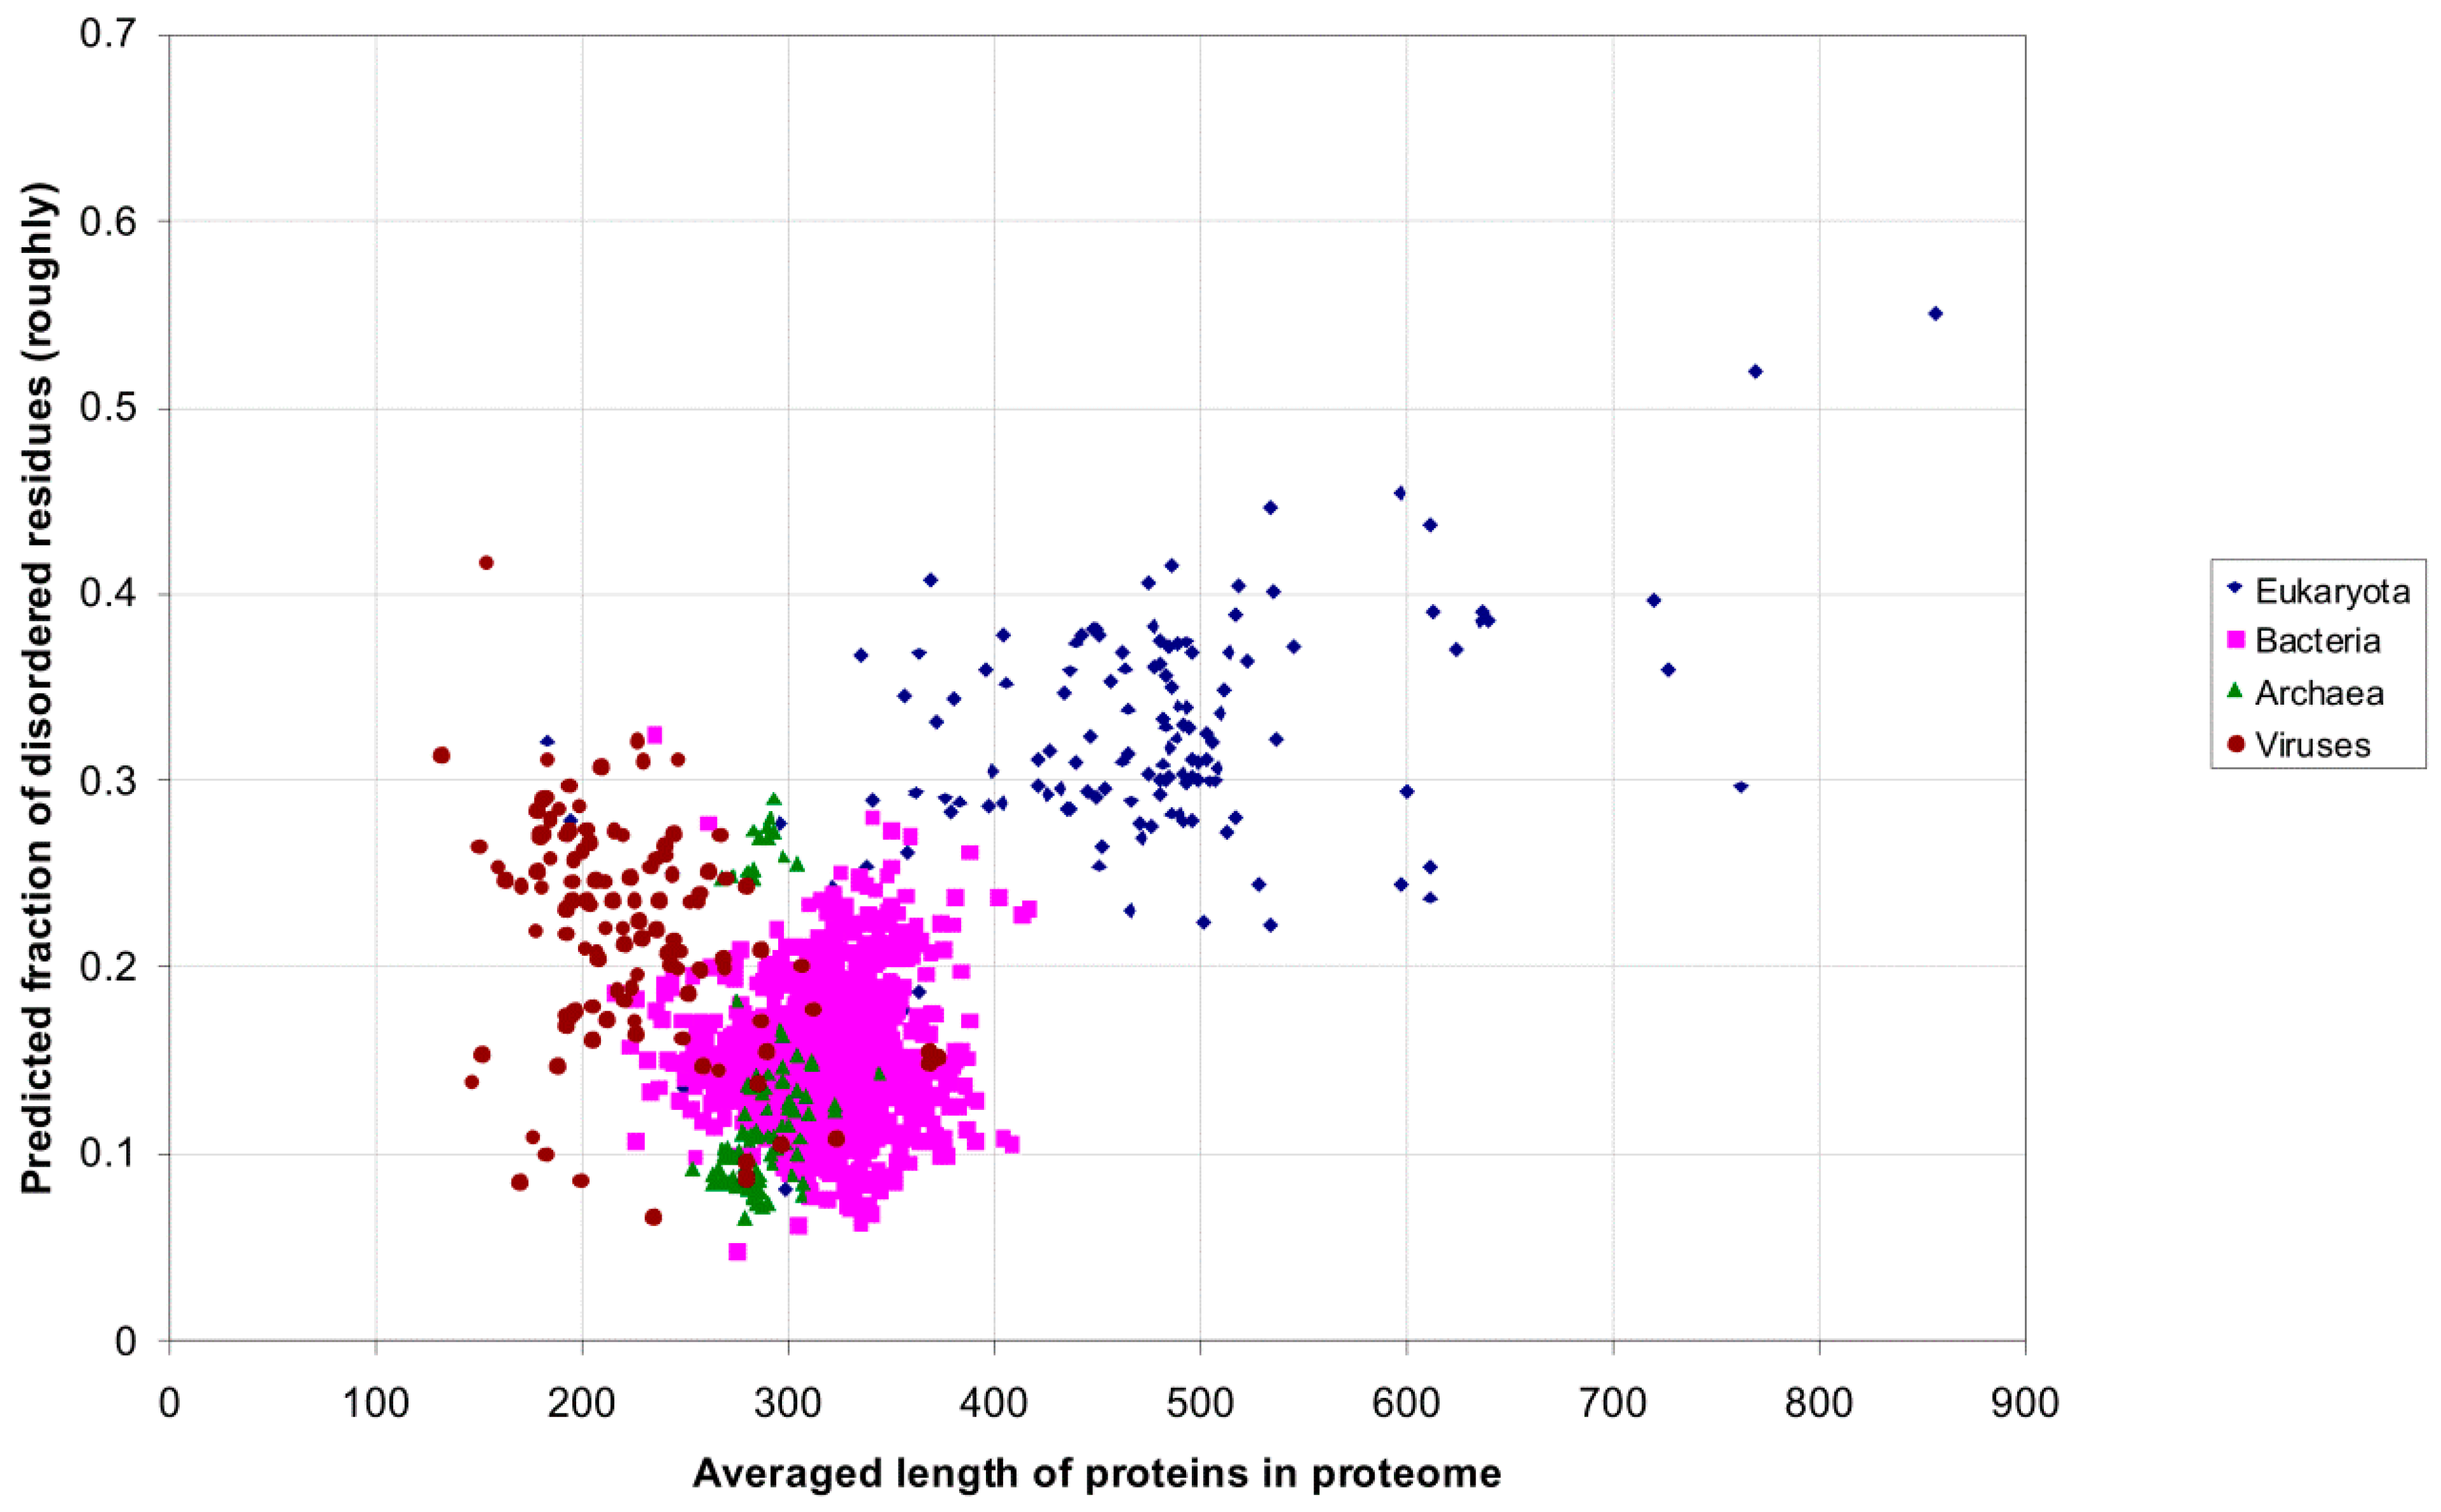
2.1. How Common Is Disorder? Prediction of Disordered Residues in 122 Proteomes

Previously, we analyzed the occurrence of 171 various disordered patterns in 122 eukaryotic and bacterial proteomes. Among those, 23 are found only in the PDB but not in the actual proteomes, indicating that these patterns have been artificially added: WSHPQFEK, GMDELYK, SAWSHPQF, ASMTGGQQMGR, HHHHHHSQDP, HHHHHMA, TSLYKKAG, GGLNDIFEAQKIEWH, HHHHHHHHHSSGHIDDDDKHM, ENLYFQGS, EQKLISEEDLN, ENLYFQGHM, SHMAS, AMADIGS, GSHMLEDP, GEKHHHHH, HIEGRH, HHHHHHSSGLEVLFQGP, PTTENLYFQGAM, EGGHHHHH, HHHHHGGS, DCGCKPCI, and IKSHHNVGGLP. The patterns with the most frequent occurrence in the eukaryotic proteomes have low complexity: PPPPP, GGGGG, EEEED, HHHH, KKKKK, SSTSS, and QQQQQP.
We calculated the occurrence of homo-repeats of 6 residues or longer for 20 different amino acids. The results in Figure 1 reveal that such occurrence is more frequent in the eukaryotic than in the bacterial proteomes, and show a well-defined boundary between these proteomes.
Figure 1. Number of proteins with at least one occurrence of homo-repeat of 6 residues long for 1902 proteomes from eukaryotes (137), bacteria (1540), archaea (105) and viruses (120).
Ijms 16 19490 g001
We also analyzed such occurrences in different kingdoms (see Figure 2).
The leaders among the nine eukaryotic kingdoms and five bacterial taxonomic groups are amoebozoa and alveolata proteomes (Figure 2 and Figure 3). In amoebozoa proteomes, nearly one half of all proteins include homo-repeats of 6 residues or longer. In alveolata proteomes, one third of all proteins contain such homo-repeats.
Figure 2. Percent of proteins including homo-repeats for 122 proteomes.
Ijms 16 19490 g002
Figure 3. Occurrence of homo-repeats of 6 residues long for 20 amino acids in 122 proteomes. Numbers of proteomes are indicated in the parentheses. Error bars are standard deviations.
Ijms 16 19490 g003
We predicted the disordered residues for 122 proteomes using the IsUnstruct program [18,19]. For each residue the probability to be unfolded was calculated. The sum of these probabilities normalized to the protein length gives the fraction of the disordered residues in a protein. Surprisingly, for the 25 bacterial proteomes analyzed, the fraction of disordered residues is also high, 0.31 on average (Figure 4). Perhaps such a large fraction of disordered residues is typical for large bacterial proteomes such as those analyzed in our work, with the total number of residues exceeding 2,500,000.
Figure 4. Predicted fraction of disordered residues for 122 proteomes. Error bars are standard deviations.
Ijms 16 19490 g004
When the predictions were made by using the modified potentials which consider the effect of overprediction of disordered residues in the terminal regions, then similar results are obtained for all 122 proteomes. Only for bacterial proteomes fraction of disordered residues increased from 0.31 to 0.36. Therefore, such a large fraction of disordered residues identified in the bacterial proteomes is not a result of overprediction for the protein termini.
In the previous study we predicted the percent of proteins with disordered regions larger than 41 residues using the FoldUnfold program [20]. Based on our estimates, 12%, 3% and 2% of the proteins in eukaryotic, bacterial and archaean proteomes, respectively, are totally disordered. Long (over 41 residues) disordered segments were found in 16% of arhaean, 20% of bacterial, and 43% of eukaryotic proteins when using 19 archaean, 159 bacterial and 17 eukaryotic proteomes [21].
Next, we considered all proteomes available at the UniProt database. Upon increasing the number of bacterial proteomes from 25 to 1540, fraction of disordered residues decreased from 0.31 to 0.26. Moreover, upon increasing the number of eukaryotic proteomes from 97 to 137, this fraction also decreased from 0.38 to 0.36. This suggests that large bacterial proteomes have a fraction of disordered residues comparable to that in the eukaryotic proteomes (see Figure 5). For 105 archaean proteomes this fraction was 0.24, and for 120 viral proteomes it was 0.28. Notably, eukaryotic proteomes have large-scale variations in their proteome sizes, from 463 to 59,053 proteins, whereas the size of bacterial proteomes ranges from 182 to 10,019 proteins.
Figure 5. Predicted average fraction of disordered residues for 1902 species from eukaryotes (137), bacteria (1540), archaea (105) and viruses (120) versus the proteome size.
Ijms 16 19490 g005
Similar analysis by using the PONDR-VSL2B program was reported in [22] where 3484 proteomes were considered. Eukaryotes were reported to have 32% disordered residues, whereas prokaryotes had 27%, suggesting that the boundary between the prokaryotic and eukaryotic proteomes was approximately at 30%. In our case, by using the IsUnstruct program to analyze 137 eukaryotic and 1540 bacterial proteomes, the predicted fraction of disordered residues was 0.36 and 0.26, respectively, suggesting a good agreement between [22] and our studies for the proteomes considered. However, for very large bacterial proteomes (>2,500,000 residues), the fraction of disordered residues was 0.31, comparable to that in eukaryotic proteomes reported in [22].
Figure 6 shows the predicted average fraction of disordered residues plotted as a function of the average protein length in the proteome. The distributions for the eukaryotic, bacterial, archaean and viral proteomes overlap at about 0.3–0.4 fraction disordered, even though the average protein length is longer for eukaryotic proteomes (Figure 6).
Figure 5, Figure 6 and Figure 7 show that archebacteria are divided into two groups: halobacteria and others. Halobacterial proteomes have high fraction of disordered residues, which may reflect the adaptation to environmental conditions [23].
In contrast to a recent study [22], we did not observe a sharp increase in the fraction of disordered residues upon transition from prokaryotic to eukaryotic proteomes. Instead, Figure 7 shows continuous dependence of the fraction of disordered residues on the size of the proteome.
Figure 6. Predicted average fraction of disordered residues for 1902 species from eukaryotes (137), bacteria (1540), archaea (105) and viruses (120) versus the average protein length in the proteome.
Ijms 16 19490 g006
Figure 7. Predicted average fraction of disordered residues for 1902 species from eukaryotes (137), bacteria (1540), archaea (105) and viruses (120) versus the average protein length in the proteome.
Ijms 16 19490 g007

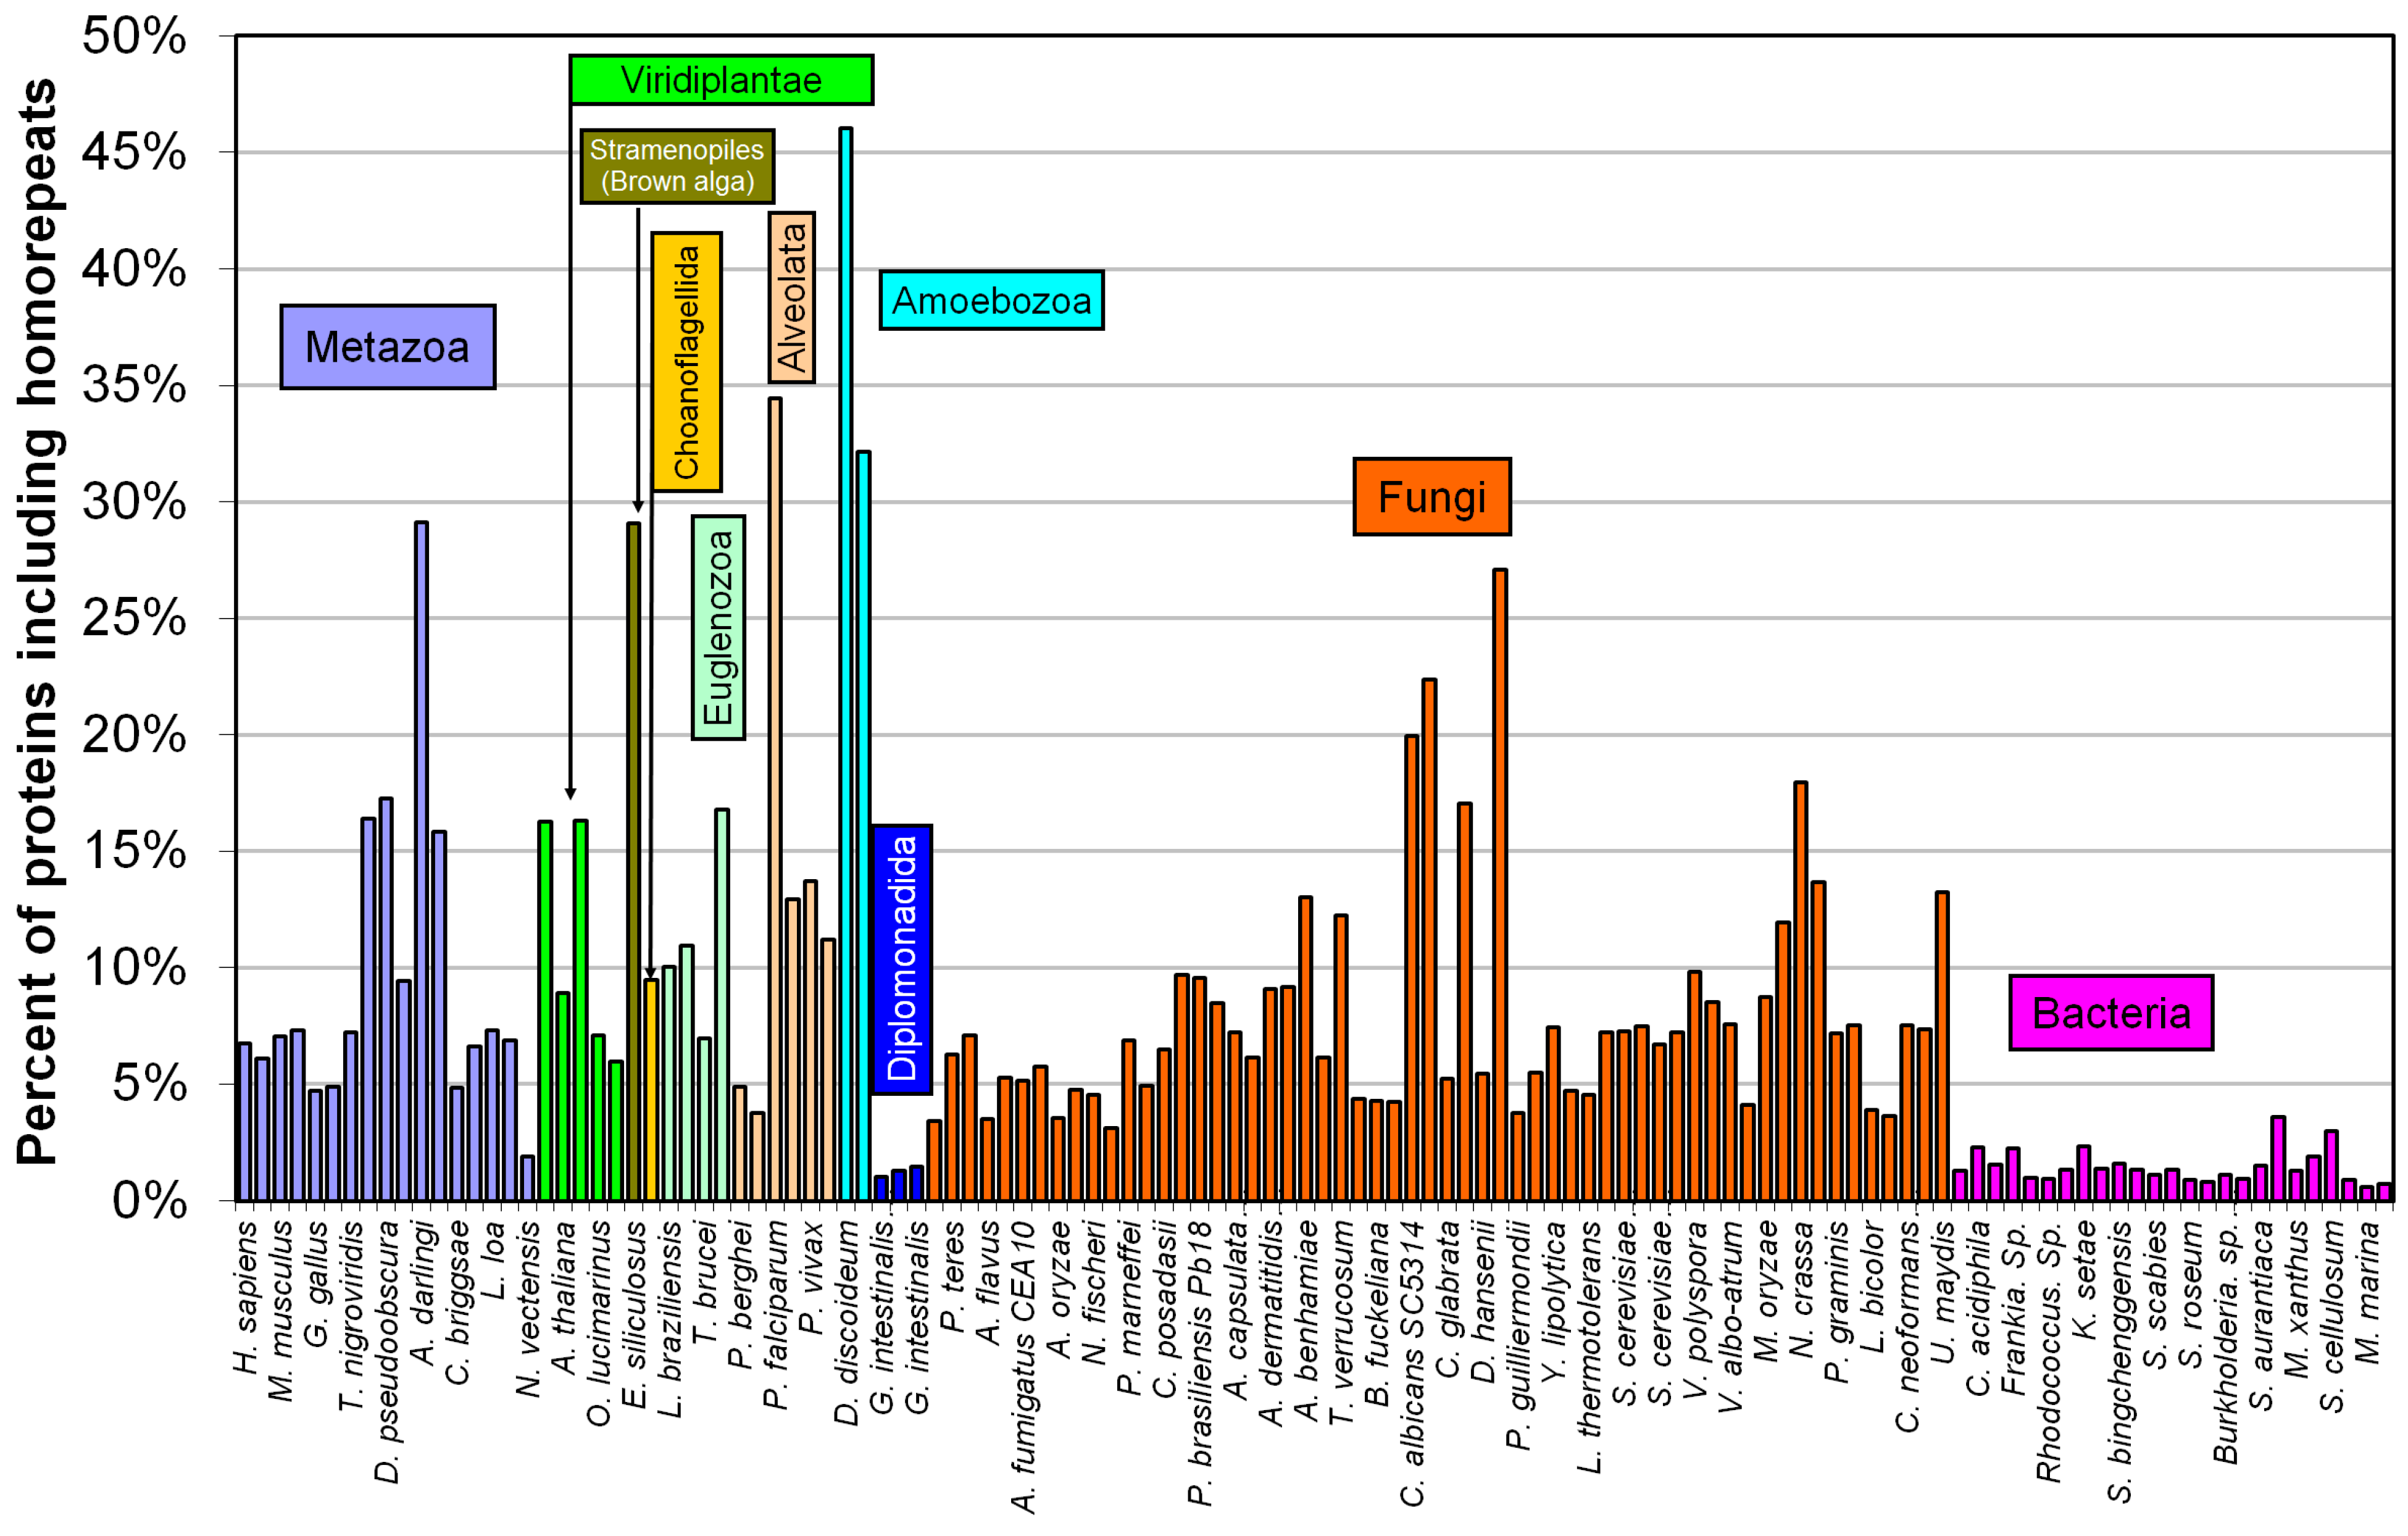
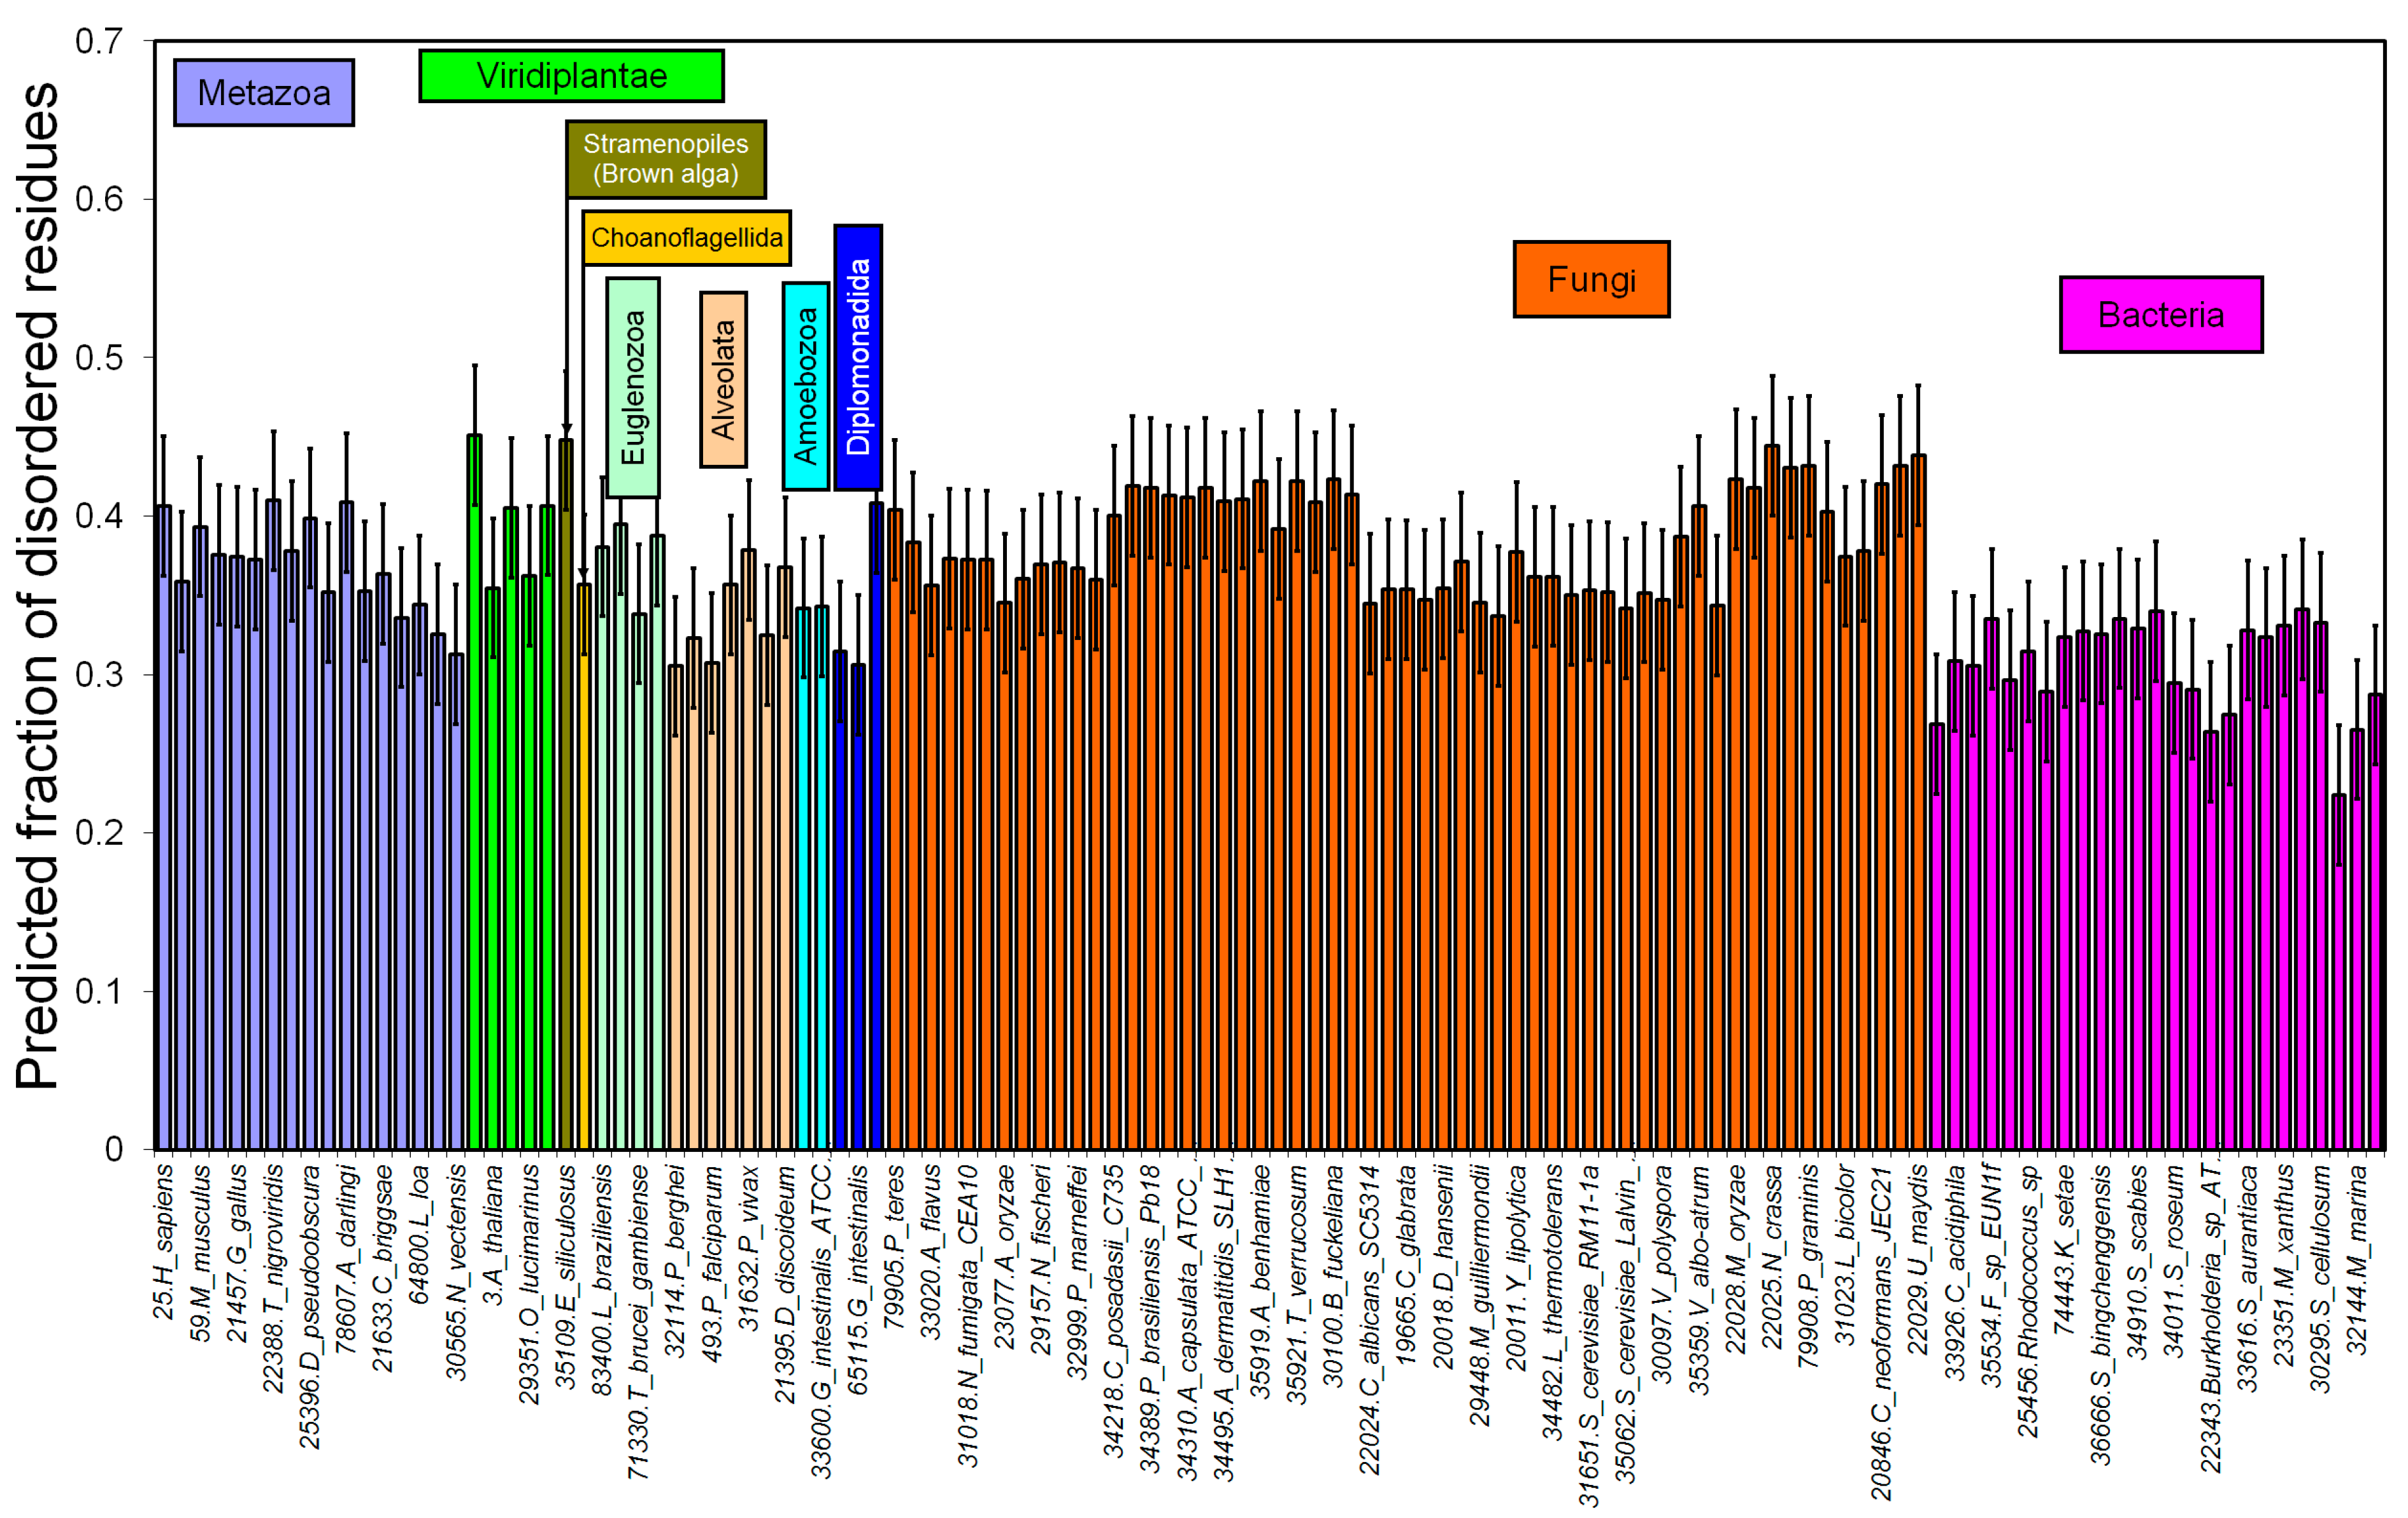
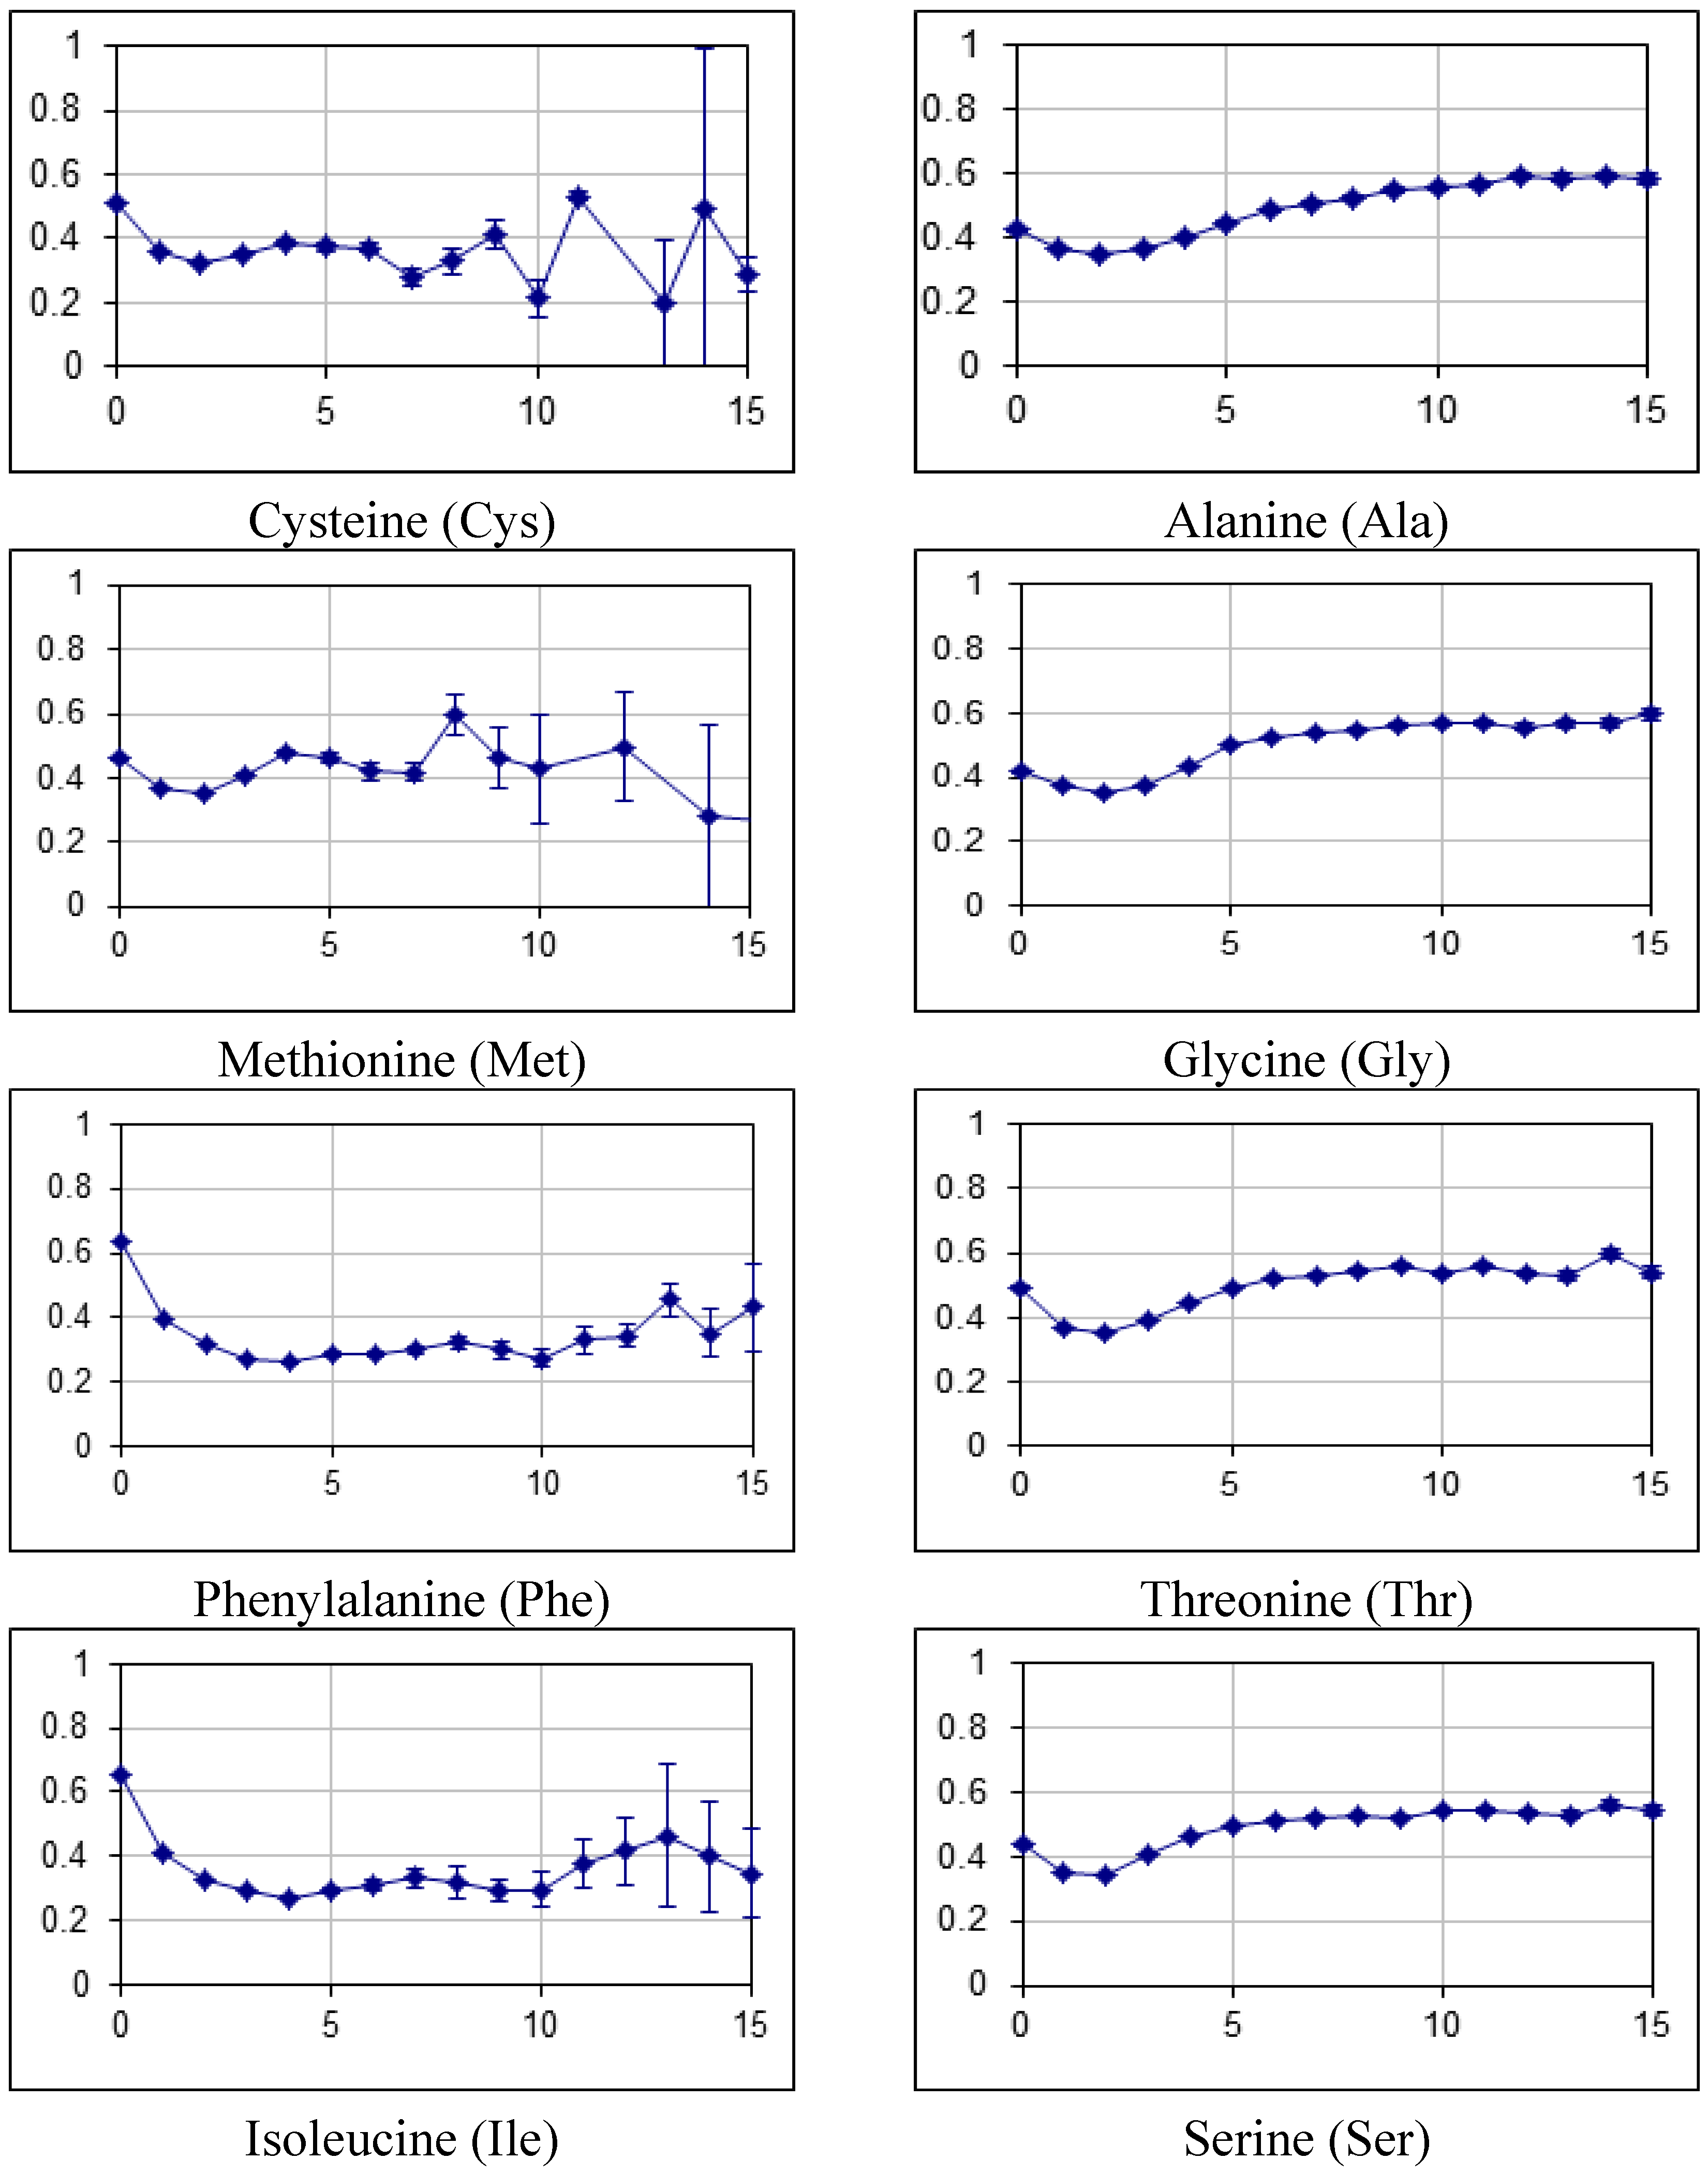
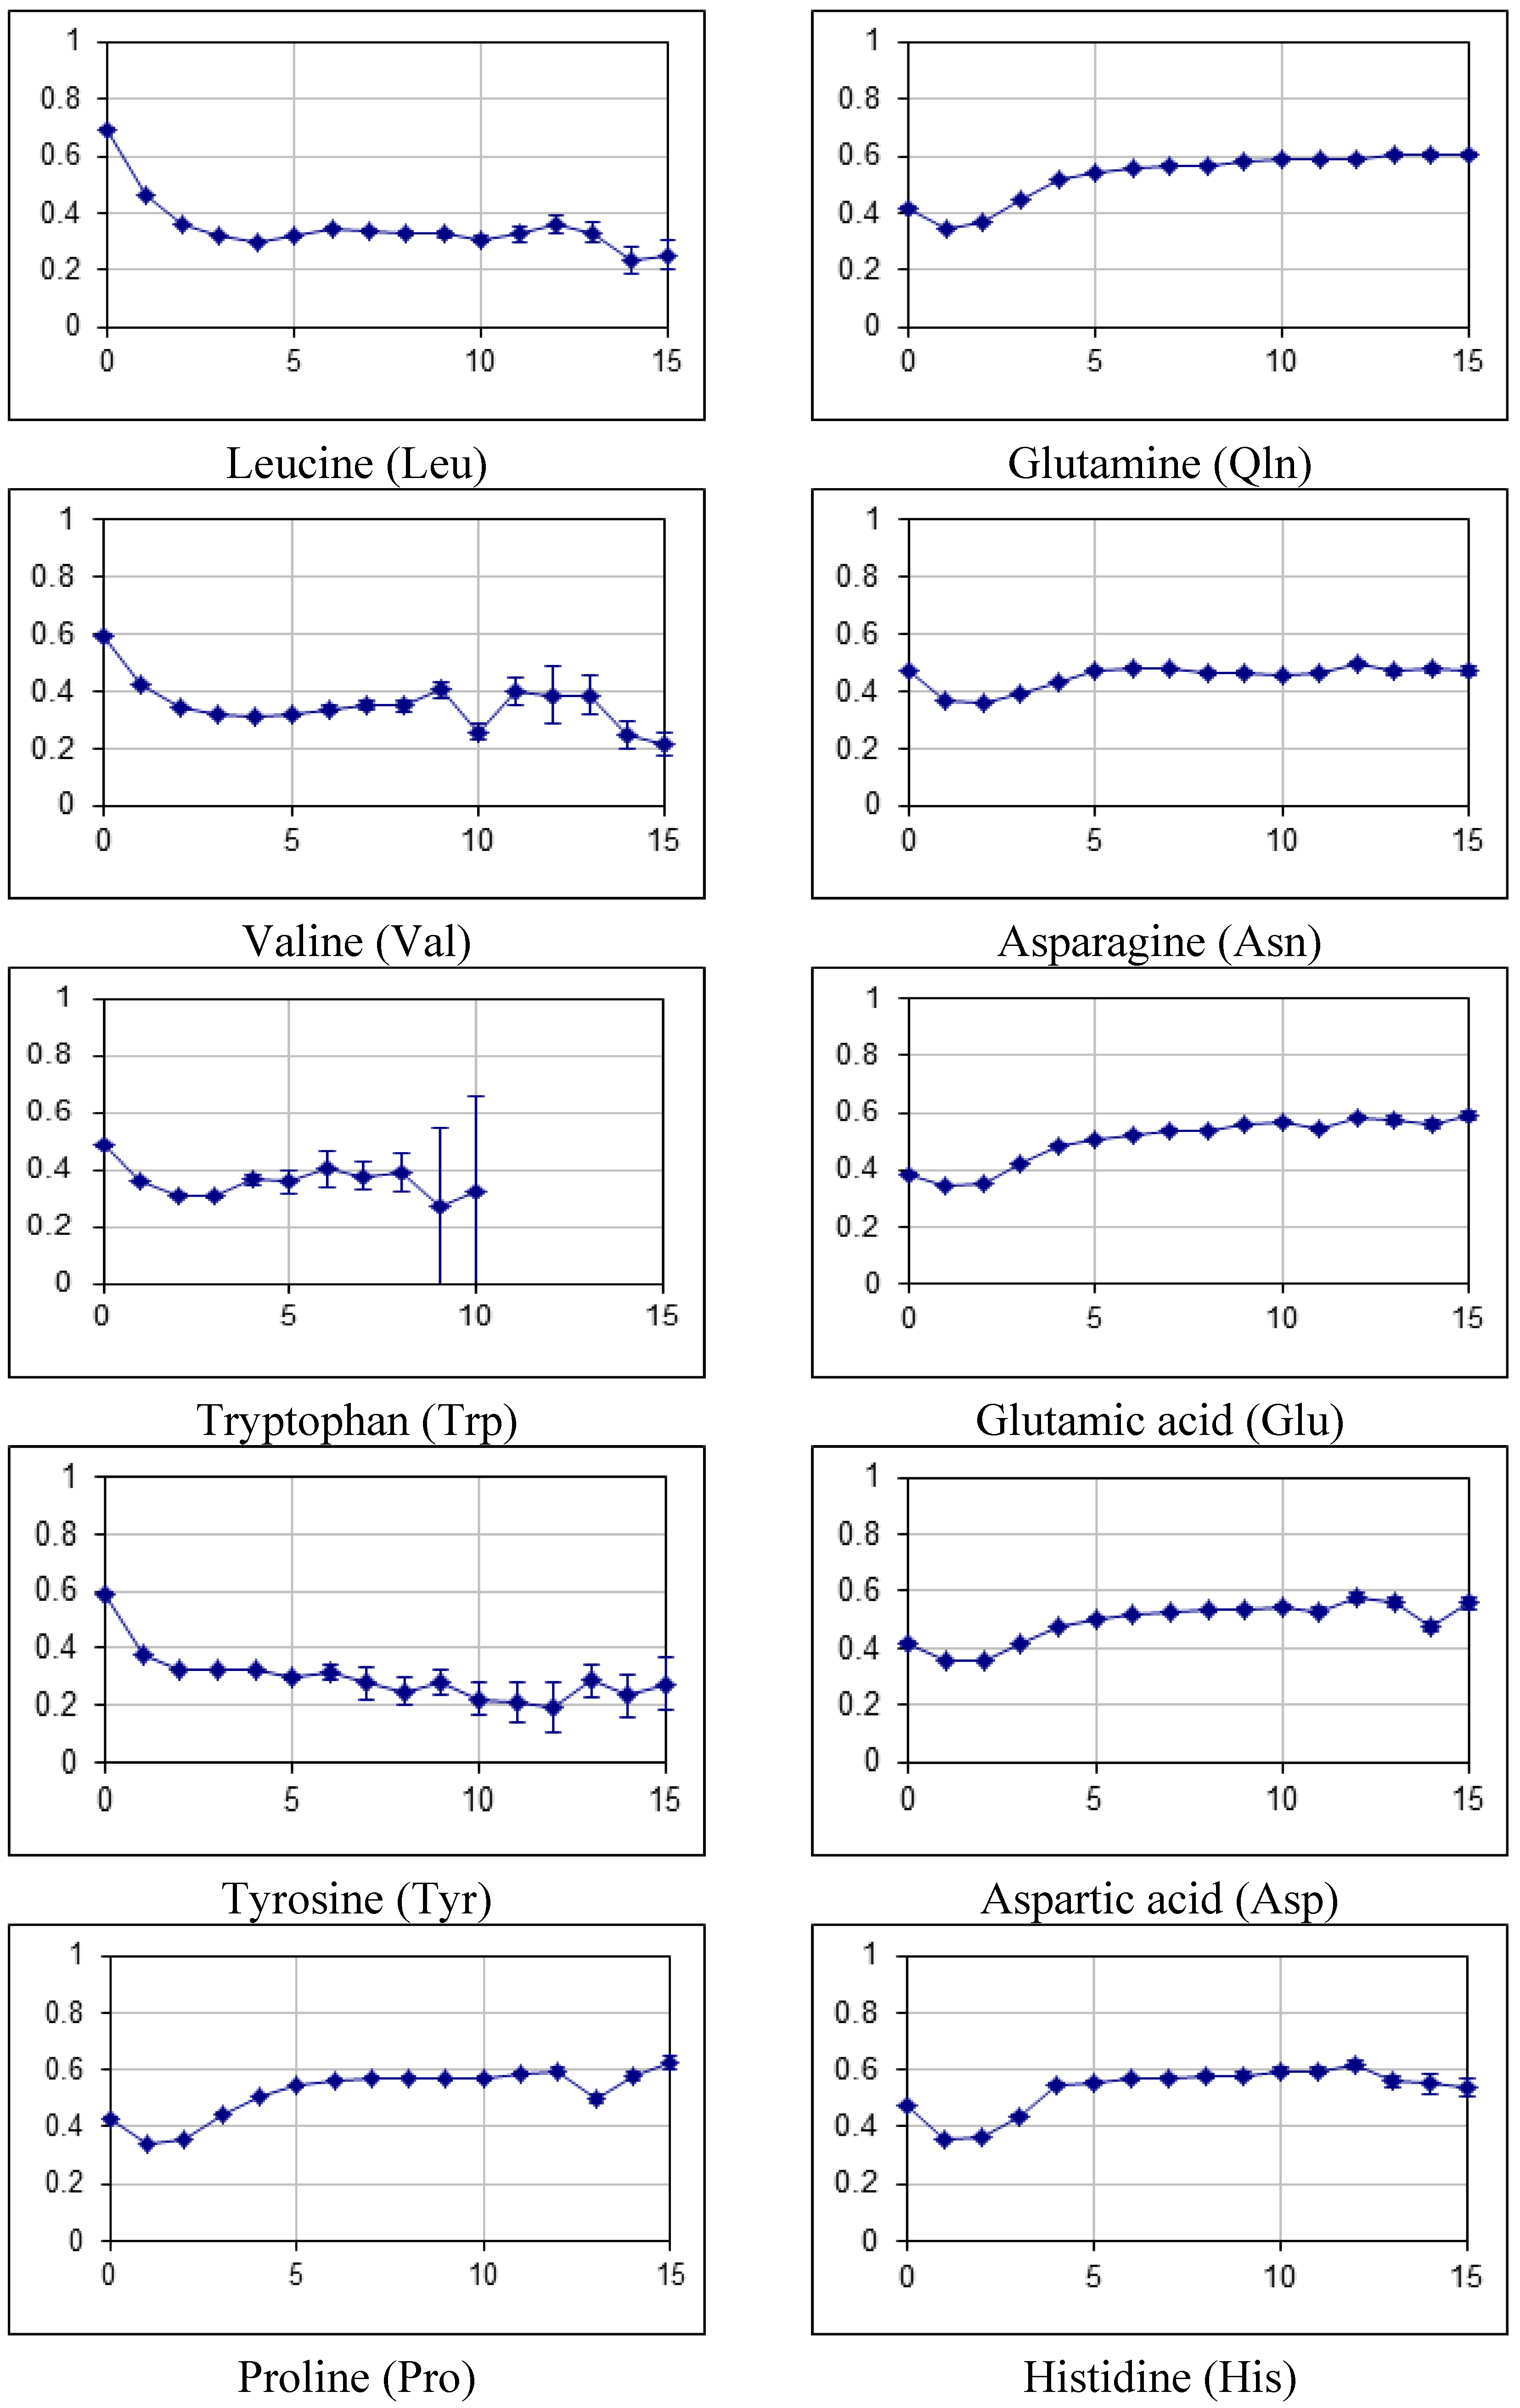
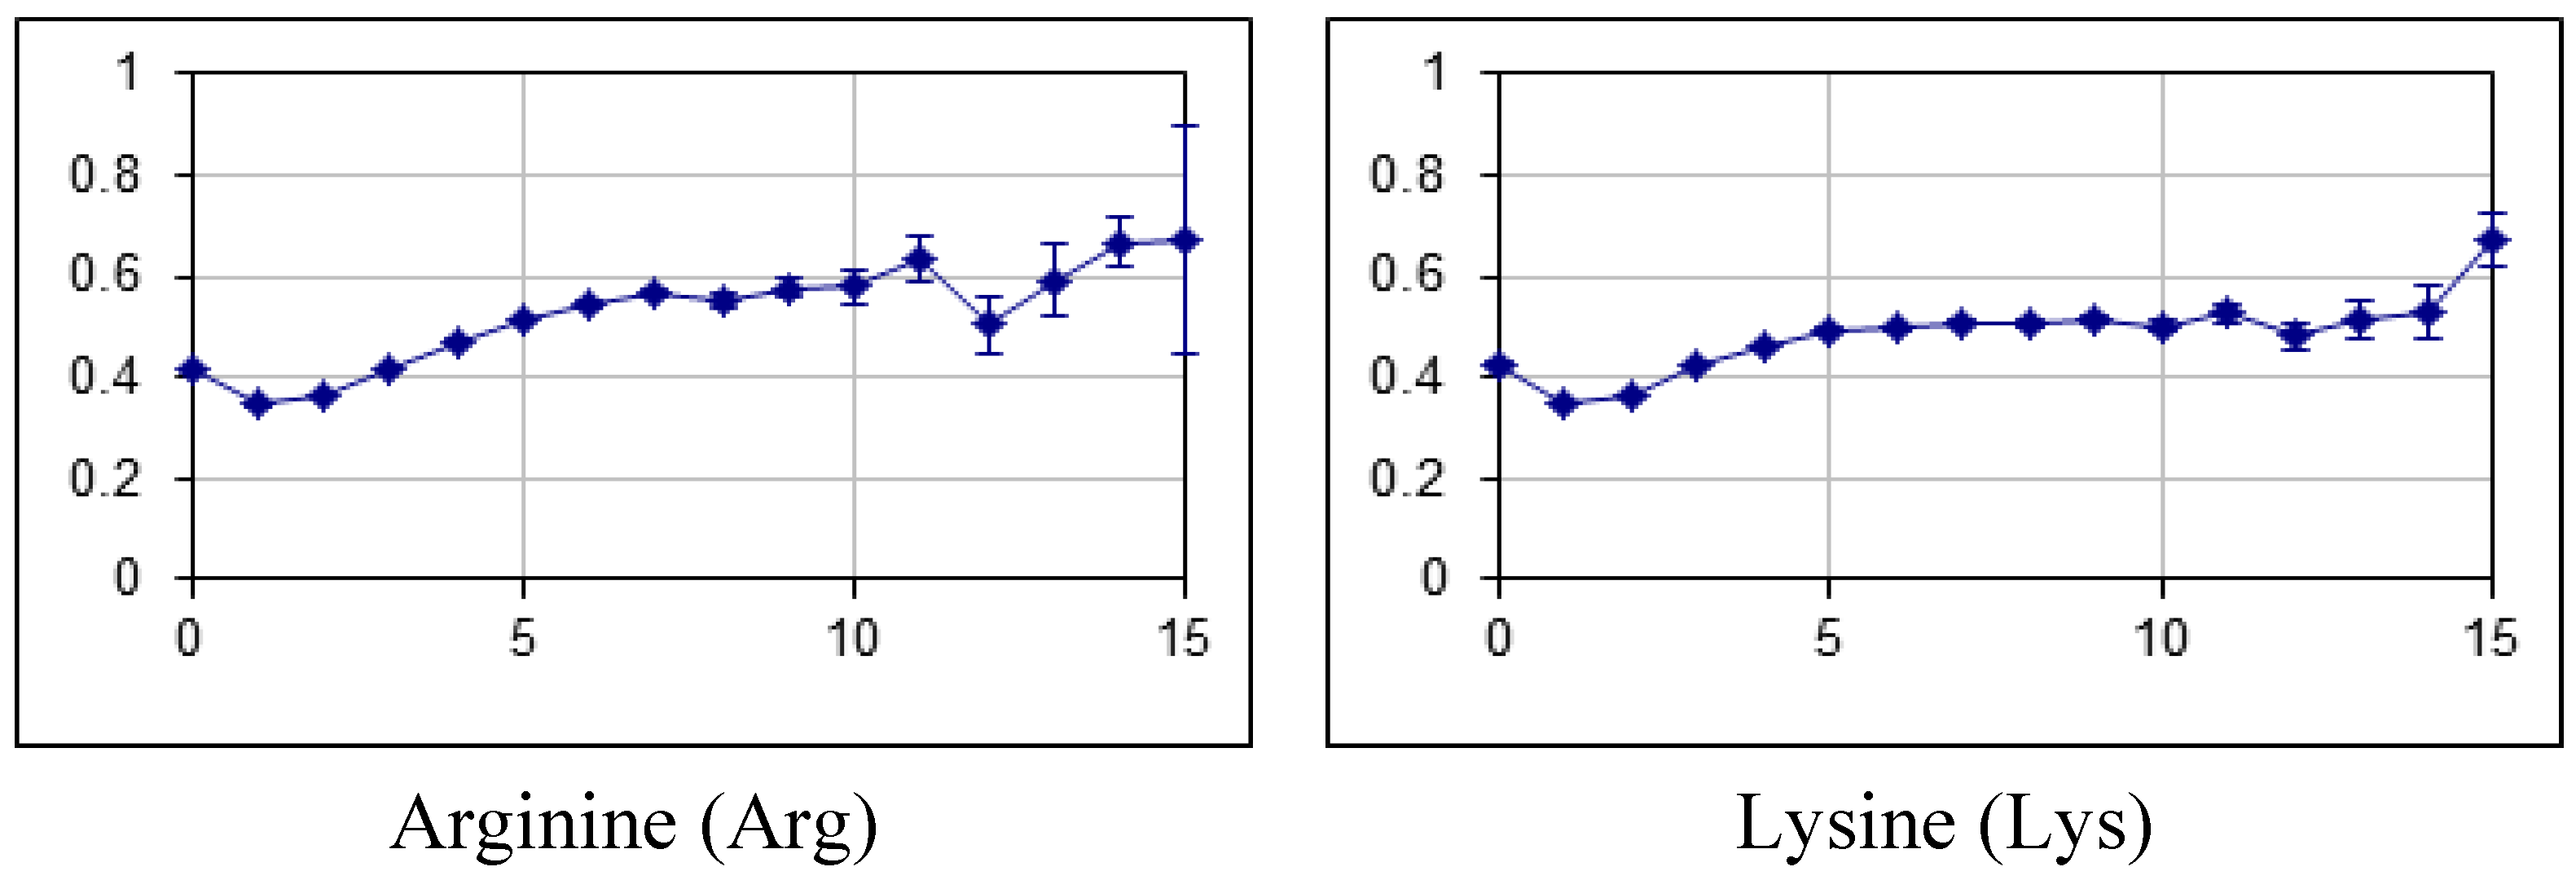
2.2. Fraction of Disordered Residues in Proteins Containing Homo-Repeats of Different Length

Figure 8 shows fraction of disordered residues versus the length of homo-repeats for all 122 proteomes. For hydrophobic amino acids a decreasing fraction of disordered residues, at the same time this value for charge, polar and small amino acid residues was increasing. The maximum fraction of disordered residues was obtained for proteins with lysine and arginine homo-repeats. These values correspond to 0.7. The minimum value corresponds to valine and leucine homo-repeats, these values are about 0.2.
Figure 8. Fraction of disordered residues for proteins containing homo-repeats tabulated for all 20 amino acids. Average fraction of disordered residues versus the length of the homo-repeat is plotted for hydrophobic, small, polar and charged amino acids as indicated.
Ijms 16 19490 g008aIjms 16 19490 g008bIjms 16 19490 g008c
Table 1 shows a big difference between the occurrences of different homo-repeats in the bacterial (B_japonicum) and eukaryotic (H_sapiens) proteomes. The information about the proteins used in this analysis can be found in the HRaP database. These bacterial proteomes show frequent occurrences of homo-repeats containing small amino acids (alanine, glycine, serine, threonine, and proline), whereas human proteome contains many proteins with homo-repeats containing small, charged and polar amino acids.
Table 1. Number of proteins with occurrence of homo-repeats of different lengths (up to 15 residues) for bacterial (B_japonicum) and eukaryotic (H_sapiens) proteomes.
B_japonicum
Amino AcidHomo-Repeat Length
0123456789101112131415>15
C1453676836411
M82401501484
F103814024771196
I22822935071937
L5824766201481213231
V982395807101010321
W9307312496181
Y38678481247422
A825374673151586891921
G88242590412021492110421
T20822941494324142
S9824144915256252121
Q10781382265203121
N195804315635821
E40820637852721011
D328214415736824212
H3247911121587921
R1682185771968102173
K11181322401157103
P368216381047376198511
B_japonicum
Amino AcidHomo-Repeat Length
0123456789101112131415>15
C418354,70610,64553982201611
M59058,38992873201712
F201156,92120,4661535146301210211
I188657,05324,782221811821211
L29658,70447,07815,20426979181851315739171311
V68158,30617,5874911458409
W749251,379429310831
Y395954,97514,4168545352
A59058,37039,71210,3622011671311180828143281821179
G60358,38335,065707514604612091386627302312767
T71858,22028,3593512416130431453211
S30358,69242,71213,04629256992591226952252416510
Q119757,77325,784367556721613163531946151141317
N241456,52818,2821446922121
E89858,03738,36110,830246185238126114486421817301014
D151157,46524,6951769405144471729211251
H323055,66913,6498421164126261429985212
R78558,17218,597668610802124863311
K142357,51432,50164241083263102476466182311
P89158,07617,65387992173774357219114695526161826

3. Experimental Section

3.1. Proteomes

Table 2 lists 122 proteomes used in the current study. These proteomes were also analyzed in our other recent study [16].
Table 2. Names of 97 eukaryotic and 25 bacterial proteomes.
EukaryotaEukaryota (Fungi)Bacteria ***
Metazoa25.H_sapiens;
22974.B_taurus;
59.M_musculus;
122.R_norvegicus;
21457.G_gallus;
20721.D_rerio;
22388.T_nigroviridis;
17.D_melanogaster;
25396.D_pseudoobscura;
31436.A_aegypti;
78607.A_darlingi;
22426.A_gambiae;
21633.C_briggsae;
9.C_elegans;
64800.L_loa;
79720.T_spiralis;
30565.N_vectensis
34310.A_capsulata_ATCC_26029;
34967.A_capsulata_H143;
34495.A_dermatitidis_SLH14081;
34498.A_dermatitidis_ER-3;
35919.A_benhamiae;
29154.A_clavatus;
33020.A_flavus;
22118.A_fumigatus_FGSC_A1100;
31018.A_fumigatus_CEA10;
29130.A_niger;
23077.A_oryzae;
28239.A_terreus;
30100.B_fuckeliana;
22024.C_albicans_SC5314;
32738.C_dubliniensis;
19665.C_glabrata;
34491.C_tropicalis;
25585.C_globosum_IFO_6347;
34493.C_lusitaniae;
34218.C_posadasii;
79902.C_graminicola;
20018.D_hansenii;
34482.L_thermotolerans;
29447.L_elongisporus;
22028.M_oryzae;
Acidobacteria25797.S_usitatus
37022.A_mediterranei;
33926.C_acidiphila;
35278.Frankia_sp_EuI1c;
35534.F_sp;
74443.K_setae;
33113.R_opacus;
25456.Rhodococcus_sp;
131.S_avermitilis;
36666.S_bingchenggensis;
84.S_coelicolor;
34910.S_scabies;
58962.S_violaceusniger;
34011.S_roseum
Viridiplantae23214.O_sativa;
3.A_thaliana;
33157.Micromonas_sp;
29351.O_lucimarinus;
25972.O_tauri
34471.N_otae;
34970.N_haematococca;
29157.N_fischeri;
22025.N_crassa;
34307.P_brasiliensis_Pb03;
34389.P_brasiliensis_Pb18;
34392.P_brasiliensis_ATCC_MYA‑826;
31898.P_chrysogenum;
Proteobacteria112.B_japonicum;
22343.Burkholderia_sp_ATCC_17760;
25388.B_xenovorans;
33223.H_ochraceum;
23351.M_xanthus;
32044.P_pacifica;
30295.S_cellulosum;
33616.S_aurantiaca
Stramenopiles *35109.E_siliculosus32999.P_marneffei 25591.P_nodorum;
29448.P_guilliermondii;
Bacteroidetes33930.C_pinensis;
32144.M_marina
Choanoflagellida **30562.M_brevicollis28727.P_stipitis;
79908.P_graminis;
Chloroflexi36622.K_racemifer
Amoebozoa *21395.D_discoideum;
35301.P_pallidum
30091.S_cerevisiae_YJM789;
31651.S_cerevisiae_RM11-1a;
34506.S_cerevisiae_JAY291;
35062.S_cerevisiae_Lalvin_EC1118;
71242.S_cerevisiae;
30103.S_sclerotiorum;
35280.S_macrospora;
33056.T_stipitatus;
35921.T_verrucosum;
34386.U_reesii;
30097.V_polyspora;
35359.V_albo-atrum;
20011.Y_lipolytica;
31020.C_cinerea;
20846.C_neoformans_JEC21;
21380.C_neoformans_B-3501A;
31023.L_bicolor;
33031.P_placenta;
22029.U_maydis
* Category without rank is given; ** The name of order is given because the highest ranks are missing in the taxonomic description; *** The super-kingdom of bacteria is divided in phyla rather than kingdoms.

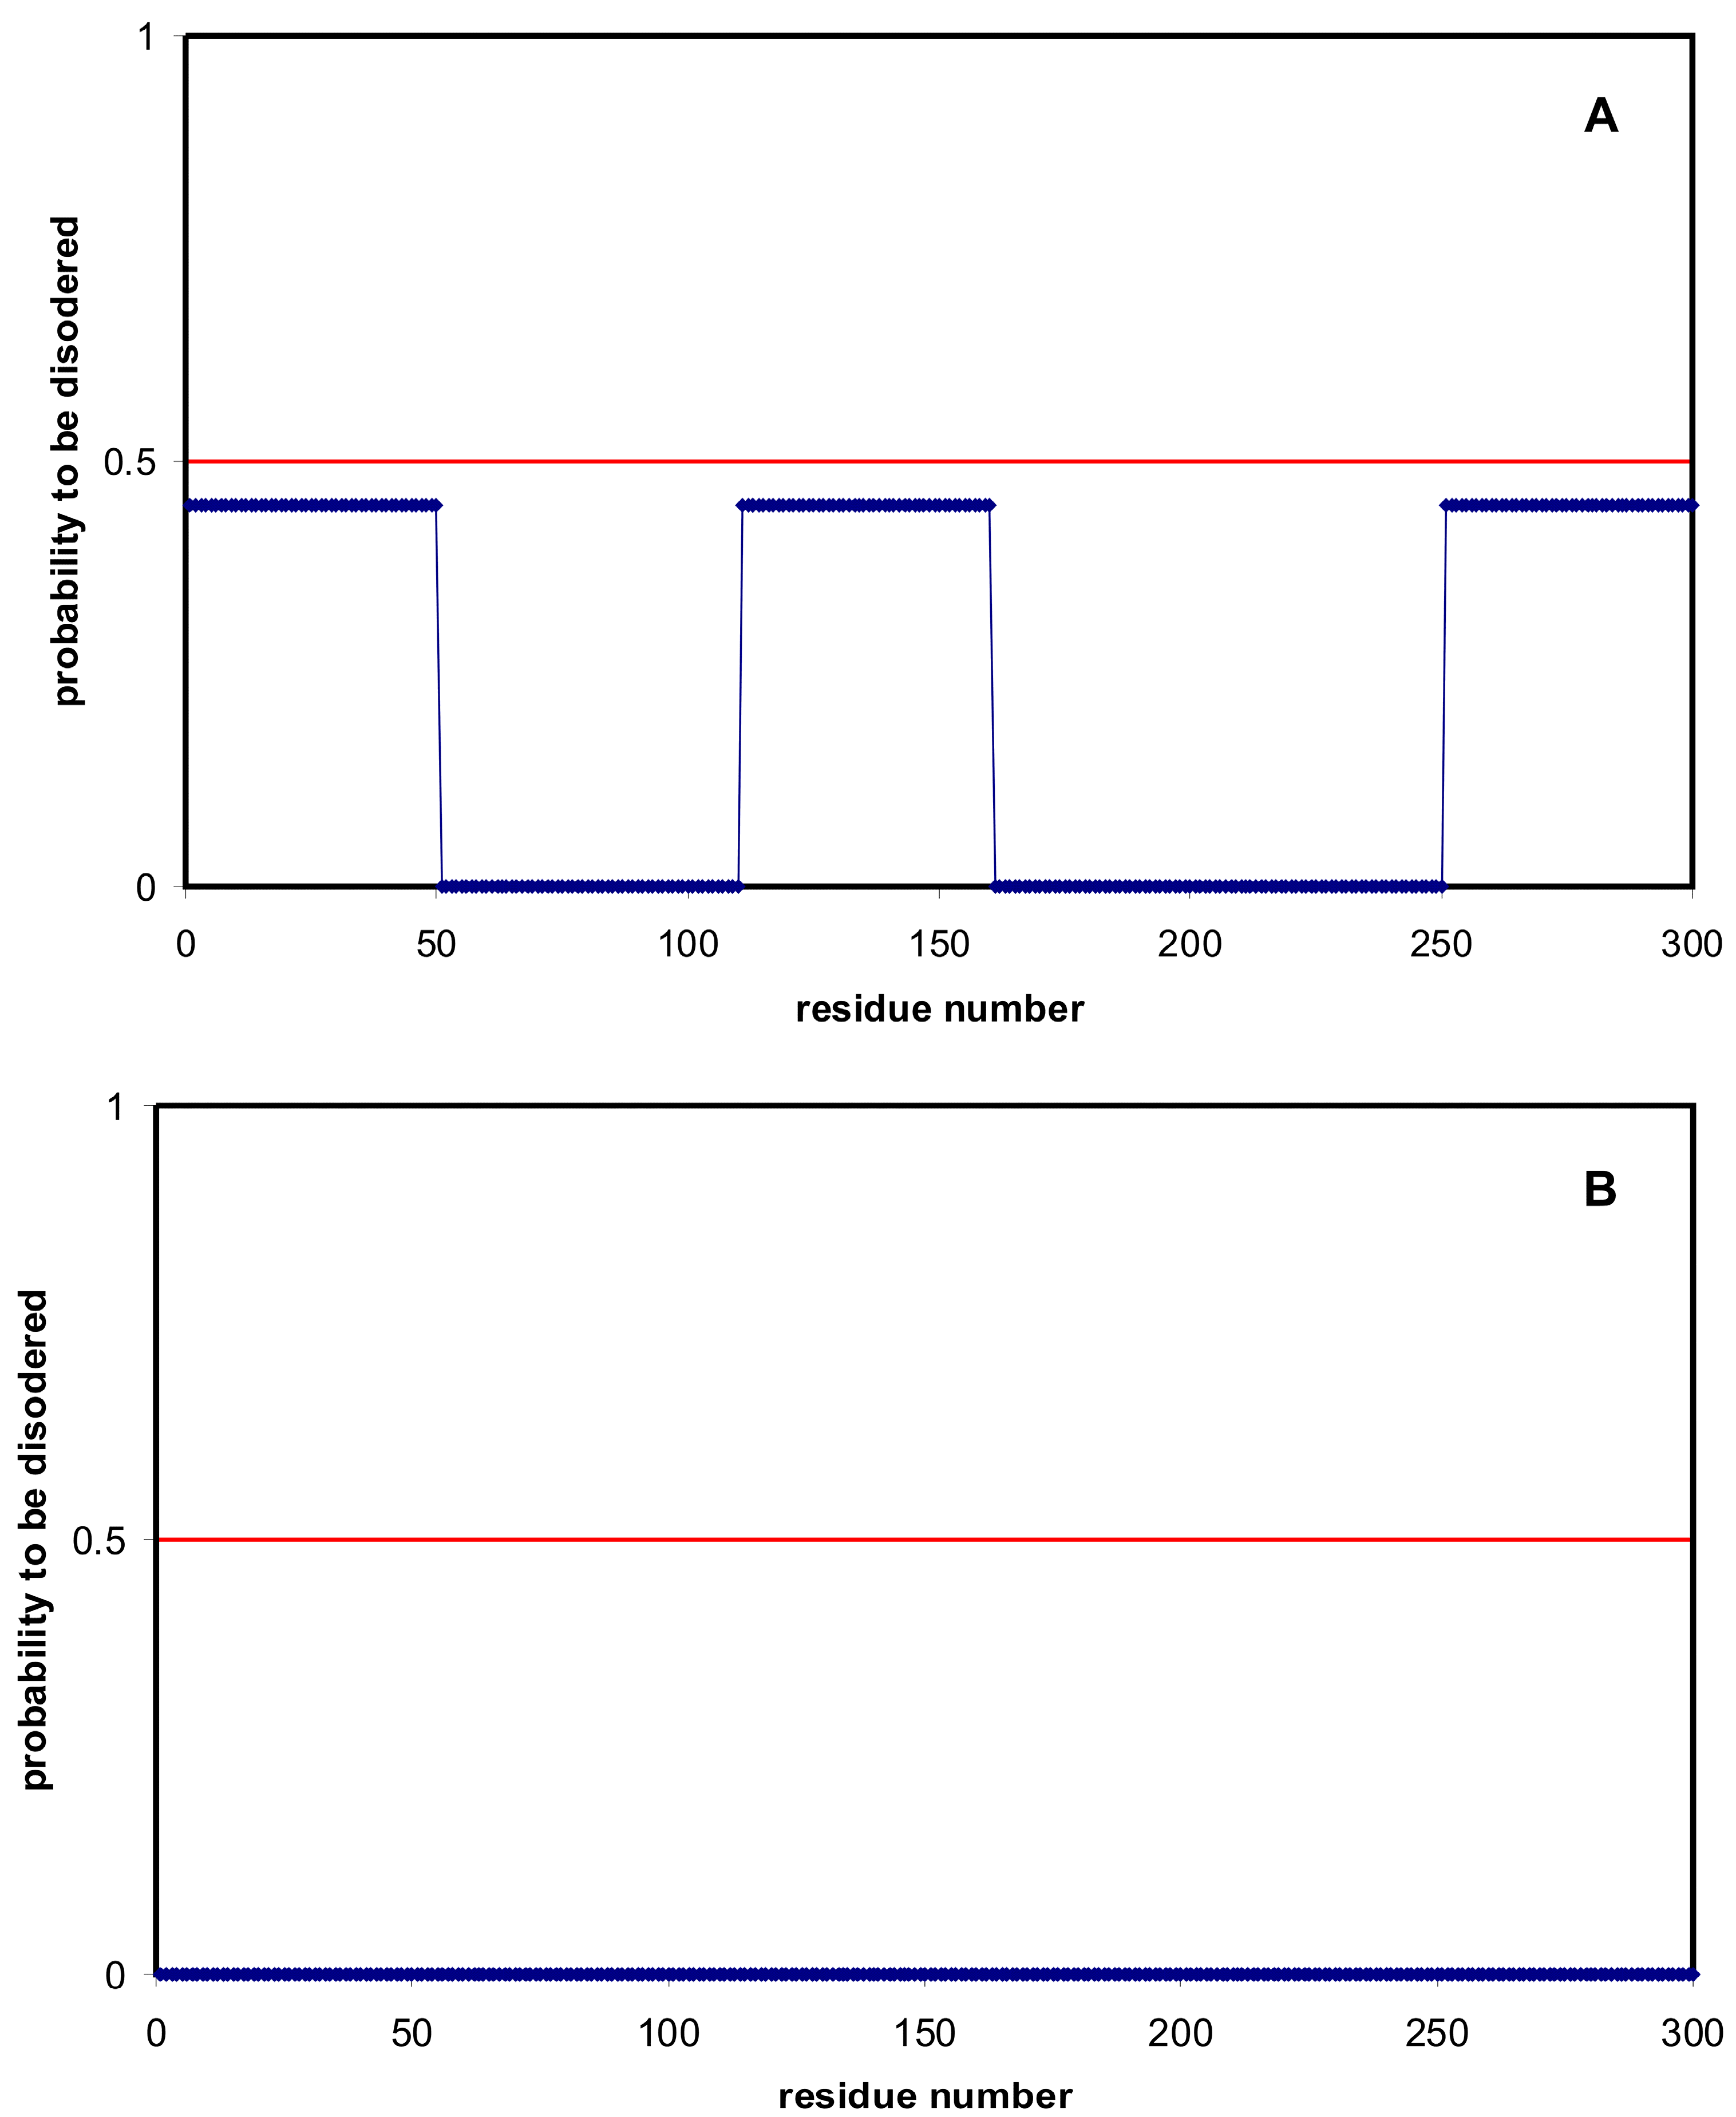
3.2. Prediction of Disordered Residues

Disordered residues were predicted using the IsUnstruct program, which is based on the Ising model [19]. The parameters of the program were determined and optimized on the basis of protein structural statistics. The tests demonstrated that the program yields reliable predictions [18]. The program is available at our site [18]. It is important that the results of our method (IsUnstruct) are better than the results of the meta-predictor PONDR-FIT [24] and are comparable to the results of the neural-network-based technique CSpritz [25] (see Table 3). Our program works as well as the meta-server programs. This fact is presented in Table 5 from paper [18].
Table 3. Performance of disorder prediction methods on DisProt database version 3.7. Predictors are ranked according to AUC.
MethodSwAUC
CSpritz [25] (Walsh et al., 2011)0.5710.877
IsUnstruct [18] version 2.02 (Lobanov et al., 2013)0.5670.856
IUPred (long) [26] (Dosztanyi et al., 2005)0.4260.818
PONDR-FIT [24] (Xue et al., 2010)0.5150.817
FoldUnfold [20] (Galzitskaya et al., 2006)0.4460.813
DISOPRED [27] (Ward et al., 2004)0.4620.806
We have done additional calculations to demonstrate the definition of the fraction of disordered residues in protein. For artificial protein A there are three predicted disordered regions with the length of 50 residues (Figure 9). The probability to be disordered for each residue from these regions is 0.45. The other residues are predicted as ordered. Protein B is an ordered one by the prediction.
If to use the definition of the fraction of disordered residues as the number of disordered residues divided by the total number of residues [22,28], then both proteins are ordered proteins. If to use our definition of the disordered content as summation of probabilities, then we receive 0.45 × 150/300 = 0.225. What score reflects the reality better? To simplify the situation, let us consider whether the fragments can be entirely disordered or ordered. In addition, we assume that the fragments fold independently. Both assumptions are quite natural for real proteins if the fragments are separated in the space. Then the probability that all of the regions are folded is p = (1 − 0.45)3 = 0.17. This is the probability that the whole protein is ordered. As you can see, it is very low. The probability that there will be only one fragment disordered is 0.41, [3!/(2! × 1!) × 0.45 × (1 − 0.45)2 = 0.408375], 0.33 for 2 fragments [3!/(2! × 1!) × 0.452 × (1 − 0.45) = 0.334125], and all 3 fragments will be disordered with the probability of 0.09 [3!/(3! × 0!) × 0.453 × (1 − 0.45)0]. If we make an exhaustive search over all possible states of the protein, calculate the fraction of disordered residues in each state and take into account the probability of states, then we obtain our assessment: the average fraction of disordered residues of protein is 0.225. However, the probability to be completely ordered is very low (0.17 = 3!/(0! × 3!) × 0.450 × (1 − 0.45)3).
Figure 9. Prediction of disordered residues for artificial proteins (A) and (B) (blue curves). Red line corresponds the border between disordered and ordered residues, below 0.5 generally indicating ordered residues and above 0.5 intrinsically disordered residues.
Ijms 16 19490 g009
In the case of real protein, we make an exhaustive search over all possible variants of the partially ordered/disordered proteins using the Ising model. In addition, in this case, the average fraction of disordered residues of protein exactly corresponds to the summation of probabilities normalized by the length of the protein. Or for the proteome, summation of the probabilities for all residues in the database is normalized to the total number of residues in the proteome.
In real proteins there are many cases when the predicted probability of being disordered is close to 0.5. If we use the rough definition of the fraction of disordered residues (i.e., the number of disordered residues divided by the total number of residues), we obtain understated estimates, as one can see from the presented Figure 10 and Figure 11 and Table 4 below.
Figure 10. Predicted fraction of disordered residues by using the two definitions.
Ijms 16 19490 g010
Figure 11. Predicted average fraction of disordered residues for 1902 species from eukaryotes (137), bacteria (1540), archaea (105) and viruses (120) versus the average protein length in the proteome using the rough definition.
Ijms 16 19490 g011
Table 4. Average contents of disorder for 4 domains of life.
DomainNumberOur DefinitionRough DefinitionDifference
Eukaryota1370.3660.3190.047
Bacteria15400.2600.1510.109
Archaea1050.2360.1280.108
Viruses1200.2820.1760.106
Figure 10 demonstrates the correlation between the two definitions. If to use the rough definition of the fraction of disordered residues, our result is not changed (see Figure 11). One can see the intersection of the fraction of disordered residues between eukaryotic and bacterial species, only we obtained all understated results.

4. Conclusions

The accepted notion in the field is that bacterial proteomes do not contain large numbers of disordered residues. Surprisingly, our analysis of large bacterial proteomes (with the number of residues exceeding 2,500,000) suggests that the fraction of disordered residues is comparable to that in eukaryotic proteomes. A continuous dependence of the fraction of disordered residues on the size of the proteome is observed for four domains of life: Eukaryota, Bacteria, Archaea, and Viruses. Moreover, the fraction of disordered residues increases for proteins with homo-repeats comprised of small, charged, and polar residues, and decreases for hydrophobic residues. We also demonstrate that using the definition of the fraction of disordered residues in proteins as the ratio of disordered residues to the total number of residues, the results are understated as compared to our definition as summation of probabilities for residues to be disordered normalized by the protein length.

Acknowledgments

I thank Olga Gursky for editorial help. This work was supported by the Russian Science Foundation (grant number 14-14-00536) for Oxana V. Galzitskaya and the programs “Molecular and Cellular Biology” (01201353567) for Mikhail Yu. Lobanov.

Author Contributions

Conceived and designed the experiments: Oxana V. Galzitskaya and Mikhail Yu. Lobanov. Performed the experiments: Mikhail Yu. Lobanov. Analyzed the data: Oxana V. Galzitskaya and Mikhail Yu. Lobanov. Wrote the paper: Oxana V. Galzitskaya.

Conflicts of Interest

The authors declare no conflict of interest.

References

  1. Sigrist, C.J.A.; Cerutti, L.; de Castro, E.; Langendijk-Genevaux, P.S.; Bulliard, V.; Bairoch, A.; Hulo, N. PROSITE, a protein domain database for functional characterization and annotation. Nucleic Acids Res. 2010, 38, D161–D166. [Google Scholar] [CrossRef] [PubMed]
  2. Hunter, S.; Apweiler, R.; Attwood, T.K.; Bairoch, A.; Bateman, A.; Binns, D.; Bork, P.; Das, U.; Daugherty, L.; Duquenne, L.; et al. InterPro: The integrative protein signature database. Nucleic Acids Res. 2009, 37, D211–D215. [Google Scholar] [CrossRef] [PubMed]
  3. Finn, R.D.; Mistry, J.; Tate, J.; Coggill, P.; Heger, A.; Pollington, J.E.; Gavin, O.L.; Gunasekaran, P.; Ceric, G.; Forslund, K.; et al. The Pfam protein families database. Nucleic Acids Res. 2010, 38, D211–D222. [Google Scholar] [CrossRef] [PubMed]
  4. Potenza, E.; di Domenico, T.; Walsh, I.; Tosatto, S.C.E. MobiDB 2.0: An improved database of intrinsically disordered and mobile proteins. Nucleic Acids Res. 2015, 43, D315–D320. [Google Scholar] [CrossRef] [PubMed]
  5. Pietrosemoli, N.; García-Martín, J.A.; Solano, R.; Pazos, F. Genome-wide analysis of protein disorder in Arabidopsis thaliana: Implications for plant environmental adaptation. PLoS ONE 2013, 8, e55524. [Google Scholar] [CrossRef] [PubMed]
  6. Nilsson, J.; Grahn, M.; Wright, A.P.H. Proteome-wide evidence for enhanced positive Darwinian selection within intrinsically disordered regions in proteins. Genome Biol. 2011, 12, R65. [Google Scholar] [CrossRef] [PubMed]
  7. Lobanov, M.Y.; Furletova, E.I.; Bogatyreva, N.S.; Roytberg, M.A.; Galzitskaya, O.V. Library of disordered patterns in 3D protein structures. PLoS Comput. Biol. 2010, 6, e1000958. [Google Scholar] [CrossRef] [PubMed]
  8. Lobanov, M.Y.; Galzitskaya, O.V. Disordered patterns in clustered Protein Data Bank and in eukaryotic and bacterial proteomes. PLoS ONE 2011, 6, e27142. [Google Scholar] [CrossRef] [PubMed]
  9. Jorda, J.; Xue, B.; Uversky, V.N.; Kajava, A.V. Protein tandem repeats—The more perfect, the less structured. FEBS J. 2010, 277, 2673–2682. [Google Scholar] [CrossRef] [PubMed]
  10. Hengen, P. Purification of His-Tag fusion proteins from Escherichia coli. Trends Biochem. Sci. 1995, 20, 285–286. [Google Scholar] [CrossRef]
  11. Serdiuk, I.N.; Galzitskaia, O.V. Unstructured regions in elongation factors EF1A from three overkingdom of the living world. Mol. Biol. 2007, 41, 1042–1055. [Google Scholar]
  12. Karlin, S. Statistical significance of sequence patterns in proteins. Curr. Opin. Struct. Biol. 1995, 5, 360–371. [Google Scholar] [CrossRef]
  13. Lagier-Tourenne, C.; Cleveland, D.W. Neurodegeneration: An expansion in ALS genetics. Nature 2010, 466, 1052–1053. [Google Scholar] [CrossRef] [PubMed]
  14. Fan, X.; Dion, P.; Laganiere, J.; Brais, B.; Rouleau, G.A. Oligomerization of polyalanine expanded PABPN1 facilitates nuclear protein aggregation that is associated with cell death. Hum. Mol. Genet. 2001, 10, 2341–2351. [Google Scholar] [CrossRef] [PubMed]
  15. Sackewitz, M.; Scheidt, H.A.; Lodderstedt, G.; Schierhorn, A.; Schwarz, E.; Huster, D. Structural and dynamical characterization of fibrils from a disease-associated alanine expansion domain using proteolysis and solid-state NMR spectroscopy. J. Am. Chem. Soc. 2008, 130, 7172–7173. [Google Scholar] [CrossRef] [PubMed]
  16. Lobanov, M.Y.; Sokolovskiy, I.V.; Galzitskaya, O.V. HRaP: Database of occurrence of HomoRepeats and patterns in proteomes. Nucleic Acids Res. 2014, 42, D273–D278. [Google Scholar] [CrossRef] [PubMed]
  17. Galzitskaya, O.V.; Lobanov, M.Y. Phyloproteomic analysis of 11,780 six-residue-long motifs occurrences. Biomed. Res. Int. 2015, 2015, 208346. [Google Scholar] [CrossRef] [PubMed]
  18. Lobanov, M.Y.; Sokolovskiy, I.V.; Galzitskaya, O.V. IsUnstruct: Prediction of the residue status to be ordered or disordered in the protein chain by a method based on the Ising model. J. Biomol. Struct. Dyn. 2013, 31, 1034–1043. [Google Scholar] [CrossRef] [PubMed]
  19. Lobanov, M.Y.; Galzitskaya, O.V. The Ising model for prediction of disordered residues from protein sequence alone. Phys. Biol. 2011, 8, 035004. [Google Scholar] [CrossRef] [PubMed]
  20. Galzitskaya, O.V.; Garbuzynskiy, S.O.; Lobanov, M.Y. FoldUnfold: Web server for the prediction of disordered regions in protein chain. Bioinform. Oxf. Engl. 2006, 22, 2948–2949. [Google Scholar] [CrossRef] [PubMed]
  21. Bogatyreva, N.S.; Finkelstein, A.V.; Galzitskaya, O.V. Trend of amino acid composition of proteins of different taxa. J. Bioinform. Comput. Biol. 2006, 4, 597–608. [Google Scholar] [CrossRef] [PubMed]
  22. Xue, B.; Dunker, A.K.; Uversky, V.N. Orderly order in protein intrinsic disorder distribution: Disorder in 3500 proteomes from viruses and the three domains of life. J. Biomol. Struct. Dyn. 2012, 30, 137–149. [Google Scholar] [CrossRef] [PubMed]
  23. Syutkin, A.S.; Pyatibratov, M.G.; Galzitskaya, O.V.; Rodríguez-Valera, F.; Fedorov, O.V. Haloarcula marismortui archaellin genes as ecoparalogs. Extrem Life Extreme Cond. 2014, 18, 341–349. [Google Scholar] [CrossRef] [PubMed]
  24. Xue, B.; Dunbrack, R.L.; Williams, R.W.; Dunker, A.K.; Uversky, V.N. PONDR-FIT: A meta-predictor of intrinsically disordered amino acids. Biochim. Biophys. Acta 2010, 1804, 996–1010. [Google Scholar] [CrossRef] [PubMed]
  25. Walsh, I.; Martin, A.J.M.; di Domenico, T.; Vullo, A.; Pollastri, G.; Tosatto, S.C.E. CSpritz: Accurate prediction of protein disorder segments with annotation for homology, secondary structure and linear motifs. Nucleic Acids Res. 2011, 39, W190–W196. [Google Scholar] [CrossRef] [PubMed]
  26. Dosztányi, Z.; Csizmok, V.; Tompa, P.; Simon, I. IUPred: Web server for the prediction of intrinsically unstructured regions of proteins based on estimated energy content. Bioinformatics 2005, 21, 3433–3434. [Google Scholar] [CrossRef] [PubMed]
  27. Ward, J.J.; McGuffin, L.J.; Bryson, K.; Buxton, B.F.; Jones, D.T. The DISOPRED server for the prediction of protein disorder. Bioinformatics 2004, 20, 2138–2139. [Google Scholar] [CrossRef] [PubMed]
  28. Peng, Z.; Yan, J.; Fan, X.; Mizianty, M.J.; Xue, B.; Wang, K.; Hu, G.; Uversky, V.N.; Kurgan, L. Exceptionally abundant exceptions: Comprehensive characterization of intrinsic disorder in all domains of life. Cell. Mol. Life Sci. 2015, 72, 137–151. [Google Scholar] [CrossRef] [PubMed]

