Abstract
Gentiana rigescens is an important medicinal herb in China. The main validated medicinal component gentiopicroside is synthesized in shoots, but is mainly found in the plant’s roots. The gentiopicroside biosynthetic pathway and its regulatory control remain to be elucidated. Genome resources of gentian are limited. Next-generation sequencing (NGS) technologies can aid in supplying global gene expression profiles. In this study we present sequence and transcript abundance data for the root and leaf transcriptome of G. rigescens, obtained using the Illumina Hiseq2000. Over fifty million clean reads were obtained from leaf and root libraries. This yields 76,717 unigenes with an average length of 753 bp. Among these, 33,855 unigenes were identified as putative homologs of annotated sequences in public protein and nucleotide databases. Digital abundance analysis identified 3306 unigenes differentially enriched between leaf and root. Unigenes found in both tissues were categorized according to their putative functional categories. Of the differentially expressed genes, over 130 were annotated as related to terpenoid biosynthesis. This work is the first study of global transcriptome analyses in gentian. These sequences and putative functional data comprise a resource for future investigation of terpenoid biosynthesis in Gentianaceae species and annotation of the gentiopicroside biosynthetic pathway and its regulatory mechanisms.
1. Introduction
Gentiana rigescens, also named Caine gentian, belongs to Gentiana, a member of the Gentianaceae family. It is a geoherb of great importance to China’s Yunnan province. G. rigescens is a perennial, growing amongst hillside grasses, bushes, and trees, at relatively high altitudes. It is usually harvested in late October, with the roots being used as bulk herbs [1] and raw materials for more than 180 different Chinese traditional medicines [2]. Recent research has shown that it possesses potential functions in liver protection and immune promotion [3,4]. The main effective component of G. rigescens is gentiopicroside [3], which is mainly found in the vacuoles of root cells, although it is synthesized in shoots [5,6]. The content of gentiopicroside in roots was far higher than that in shoots at the flower stage [7]. In addition, there are other active components including swertiamarin, sweroside, erythricine, ursolic acid, oleanolic acid, loganic acid, gentianidine, and gentiana aldin [5,8].
In recent years, the wild resources of G. rigescens have declined sharply, with shortages of gentian, as demand for its use in clinical, pharmaceutical, and veterinary areas increases [1]. It has now been classified as a protected plant in China [1]. Similarly, many other Gentiana species have become endangered species [9]. Studies have suggested that the chromosome number of Gentiana triflora, Gentiana scabra, Gentiana manshurica, and other herbs containing gentiopicroside, is 2n = 26, while that of Gentiana lutea and Gentiana punctata is 2n = 40 [10]. The former three share a similar genome size (5 × 10⁹ bp/1C), approximately 33 times that of Arabidopsis thaliana [10,11]. Gentian genome resources are very scarce due to its large genome, genomic heterozygosity brought by distal hybridization, long growth cycle, and the lack of genetic information [10]. The Japanese gentian’s genetic linkage map was the first map of the Gentianaceae to be published, although its coverage is still low (about 1/3 genome coverage) and the phenomena of separation distortion (whereby there is unequal segregation of pairs of alleles) emerged in 30% of the molecular markers tested in progeny [10]. Therefore, the development of batches of EST-SSR (Expression Sequence Tag-Simple Sequence Repeat) molecular makers by RNA-Seq would be an improvement. In Japan, G. scabra and G. triflora are important cut and potted flowers, so research has focused on the anthocyanin biosynthesis pathway and its regulation [12,13,14]. Other studies have been on seed germination [4,15], elemental analysis [16], and active ingredient content [17,18]. However, there has been little research on the gentiopicroside biosynthesis pathway and its regulation. Recently, a seven-year breeding project of G. rigescens, whose goals are high yield, high gentiopicroside content, disease resistance, mechanized production, and wider planting, has been launched in Yunnan province [2].
To protect wild gentian resources as a source of plant material, a better understanding of the plant’s biology and growth is required. Transcriptome research provides a method of fast, high-throughput, comprehensive interpretation of the plant’s genome information, including new gene function information, the biosynthesis of the active ingredients and their regulation, and germplasm evaluation and expansion [19].
The objective of this research was to compare the transcriptomes of the leaf and root of G. rigescens, using Illumina Hiseq2000. To determine genes involved in the gentiopicroside biosynthesis pathway and its regulatory mechanism, transcripts from leaves and roots of gentian were isolated, quantified, sequenced, and annotated. The results described here will aid further functional genomic studies in gentian.
2. Results and Discussion
2.1. Sequencing and Assembly
To determine the transcriptomes of the leaves and roots of G. rigescens, two sequencing libraries were prepared and sequenced with the Illumina paired-end technique. As a result, over 50 million clean reads per library were obtained after cleaning and quality checks were performed. The sequencing data quality assessments are shown in Table 1. The error rate of both root and leaf is 0.03% (Q20 and Q30 are over 96% and 90%, separately), indicating a high quality of sequence. The sequencing raw data has been deposited into the Short Reads Archive (SRA) database under the accession number SRP027253.

Table 1.
The quality assessment of the sequencing data.
| Item | Sample | Raw Reads | Clean Reads | Clean Bases (G) | Error (%) | Q20 (%) | Q30 (%) | GC (%) |
|---|---|---|---|---|---|---|---|---|
| Leaf | Leaf_1 | 57,802,913 | 56,289,486 | 5.63 | 0.03 | 97.97 | 93.09 | 43.00 |
| Leaf_2 | 57,802,913 | 56,289,486 | 5.63 | 0.03 | 97.48 | 92.61 | 43.04 | |
| Root | Root_1 | 53,933,882 | 50,596,096 | 5.06 | 0.03 | 97.02 | 90.79 | 43.23 |
| Root_2 | 53,933,882 | 50,596,096 | 5.06 | 0.03 | 96.59 | 90.34 | 43.31 |
Leaf_1, Root_1, Leaf_2, Root_2: The left and the right reads, separately; Raw reads: Statistical raw sequence data with four lines as a unit, to sum the sequence number of each file; The Clean Reads of the Leaf or Root were the sum of the left and right reads. Error rate: Bases error rate; Q20 and Q30: The percentages of the bases whose Phred values were more than 20 and 30, separately.
The clean reads were combined and assembled by using the Trinity program, which has been shown to be an excellent assembler for de novo transcriptome assembly from short-read RNA-Seq data [20]. Assembled sequences were subjected to cluster using the Trinity algorithm. As a result, 191,541 contigs clustered into 78,433 Trinity components (mean size = 743 bp, N50 = 1365 bp). Each Trinity component defines a collection of transcripts that are most likely to be derived from the same locus (except a portion from very closely related paralogs) [20,21]. This component was defined as a unigene and the longest transcript in each component was used to represent the corresponding unigene in this study. After removal of 1716 (2.2% of total) contaminant unigene sequences from non-plant species (see Materials and Methods), a transcriptome of 76,717 unigenes with a total size ~57.7 Mb was established for G. rigescens. The sequences of the unigenes (longer than 200 bp) were deposited in the NCBI (National Center for Biotechnology Information) Transcriptome Shotgun Assembly Sequence Database (TSA) according to its standard criteria (downloaded from the BioProject: PRJNA211794, Accession Number: GDAB00000000). The full list of transcript sequences is also available upon request.
2.2. Assembly Assessment
By comparing our results to Gentiana sequences downloaded from the NCBI (Available online: http://www.ncbi.nlm.nih.gov), we demonstrated that the assembly succeeded in constructing a large amount of transcripts with desirable length. Of 43,611 Gentiana sequences, 33,773 (77.4%) sequences were represented in our assembly (Megablast, E-value was 10−9), among which 23,908 (70.8%) sequences were matched with more than 80% identity and 80% coverage. RNA-Seq reads were mapped back to the assembly to calculate the proportion of reads assembled, indicating a statistic report comparable to other de novo assemblies. The total alignment rate was 92.72% (Table 2), and 78.3% of the mapped paired-reads aligned concordantly, which showed good physical evidence of sequence contiguity. Transcript length (such as N50, average length) is another broadly used parameter to overview the quality of the transcriptome assembly. As shown in Figure 1, the unigenes ranged from 201 to 16,728 bp, with a mean length of 753 bp and an N50 length of 1384 bp, which is comparable to similar RNAseq reports. Thus, we have successfully constructed a desirable assembly from Illumina paired-end sequencing.

Table 2.
Summary of the transcriptome assembly of G. rigescens.
| Item | Contigs | Unigenes |
|---|---|---|
| Total number | 189,576 | 76,717 |
| Total length (bp) | 228,624,912 | 57,734,637 |
| Mean length (bp) | 1206 | 753 |
| N50 (bp) | 1996 | 1384 |
| GC content (%) | 39.7 | 39.5 |
| Number of length ≥ 500 bp | 120,525 | 29,795 |
| Number of length ≥ 1000 bp | 81,919 | 16,332 |
| Reads mapping rate (%) | 92.72 | - |
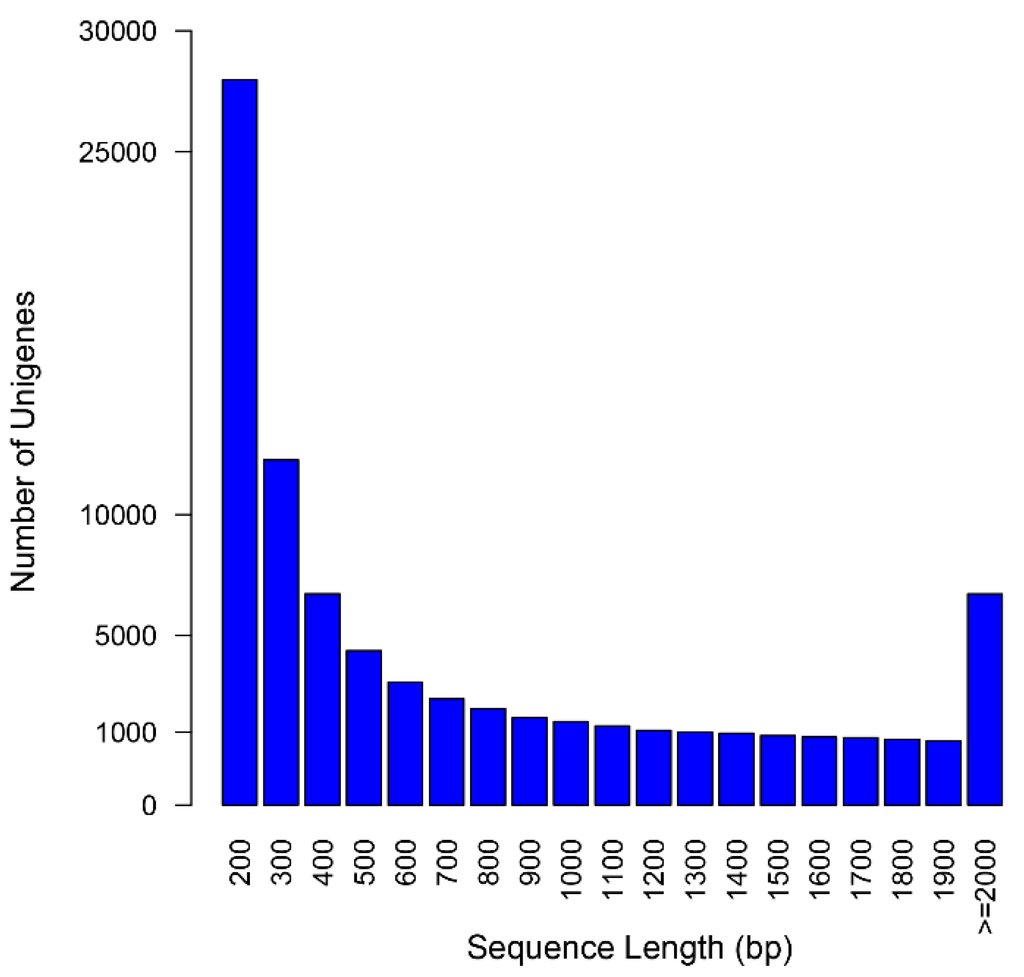
Figure 1.
Length distribution frequency of the unigenes in G. rigescens.
2.3. Gene Function Annotation and Classification
All the 76,717 assembled putative unigenes were aligned using the BLAST program against the NR, NT, Swiss-Prot and COG databases with the E-value cutoff of 10−5. A total of 33,855 unigenes were annotated, accounting for 44.13% (Table 3). Among them, 26,686 unigenes (34.78%) showed high homology, with sequences in the NR database, 24,371 unigenes (31.77%) matched to protein sequences in TAIR10, and 18,627 unigenes (24.28%) showed homology with known genes in SwissProt. The detailed results are shown in Table 3 and Table S1–S3. Based on the top-hit species distribution of the homology result against NR databases, 26,361 unigenes (92.08%) showed high homology with sequences from land plants, among which the highest matches were to genes from Coffea canephora (36.08%), followed by Vitis vinifera (8.57%), and Sesamum indicum (7.36%) (Figure 2).

Table 3.
Statistics result of gene annotation.
| Item | Number of Unigenes (n) | Percentage (%) |
|---|---|---|
| Annotated in NR | 26,686 | 34.78 |
| Annotated in NT | 8158 | 10.64 |
| Annotated in TAIR10 | 24,371 | 31.77 |
| Annotated in KEGG | 7998 | 10.43 |
| Annotated in SwissProt | 18,627 | 24.28 |
| Annotated in PFAM | 23,287 | 30.35 |
| Annotated in GO | 26,494 | 34.53 |
| Annotated in KOG/COG | 10,524 | 13.72 |
| Annotated in all Databases | 3019 | 3.94 |
| Annotated in at least one Database | 33,855 | 44.13 |
| Total queries/unigenes | 76,717 | 100 |
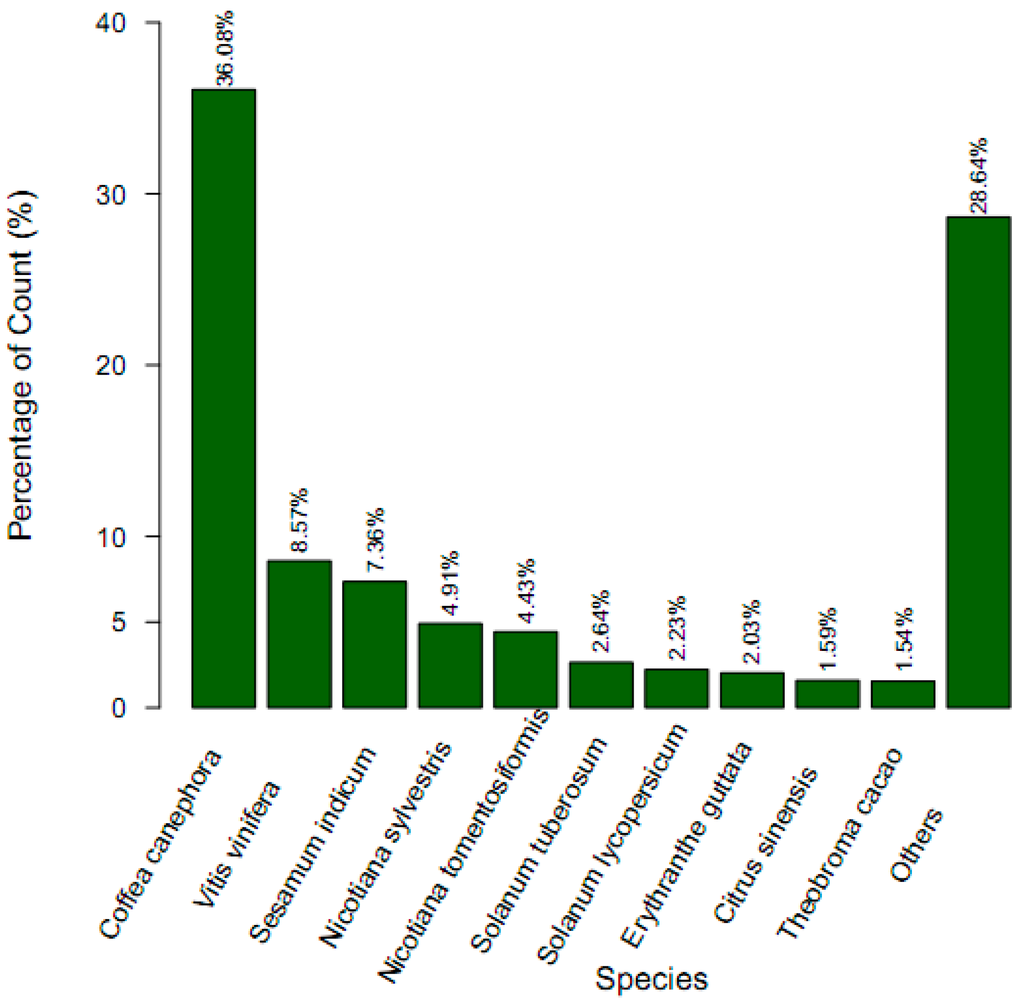
Figure 2.
Species distribution of the top BLAST (Basic Local Alignment Search Tool) hits for each unigene against NR (Non-redundant) database.
Putative protein sequences were obtained by translating using a standard codon table. The CDSs of unigenes that did not match the above databases were predicted with the ESTSCAN software. The gene length distribution is shown in Figure 3. The length of peptides predicted by BLASTp ranges from 60–810, while that of ESTSCAN are 30–240.
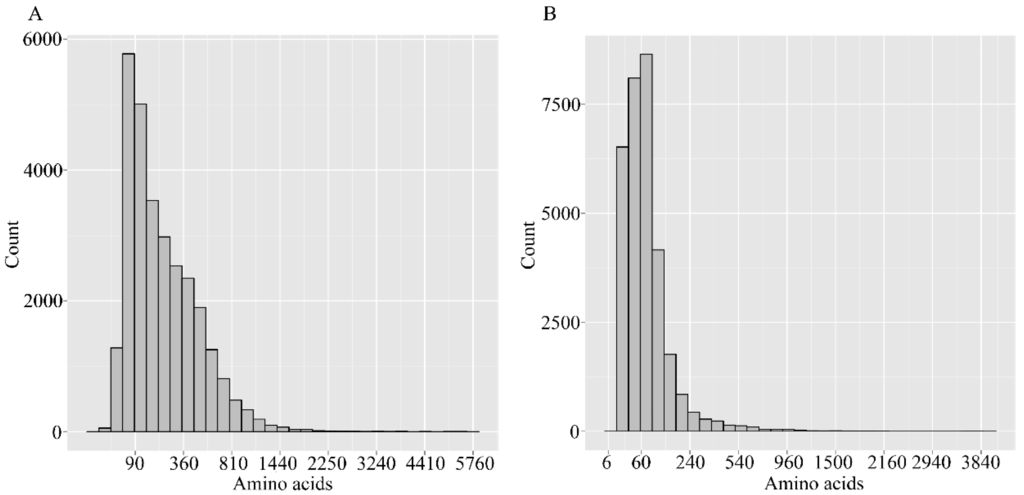
Figure 3.
Length distributions of predicated peptides. (A) Predicated by BLAST; (B) Predicated by ESTScan program (Available online: http://www.ch.embnet.org/software/ESTScan.html). The abscissa represents the peptide length, while the ordinate represents thce number of the corresponding number.
In this study, all unigenes were searched against the GO database. Out of 76,717 unigenes, 26,494 were successfully annotated and classified into three GO categories: biological process, cellular component, and molecular function, and assigned to 56 functional groups (Figure 4). As shown in Figure 4, assignments which fell under cellular component ranked the highest, followed by biological process, and molecular function. In the biological process category, “cellular process” (16,075, 60.67%) and “metabolic process” (15,223, 57.46%) were the two most representative subcategories. In the cellular component category, unigenes related to “cell” (10,308, 38.91%) and “cell part” (10,282, 38.81%) were dominant, while in the molecular function category, the majority of unigenes were involved in “binding” (14,903, 56.25%) and “catalytic activity” (12,326, 46.52%). These results suggested that many kinds of enzyme pathways were active in gentian.
A total of 10,524 sequences were classified into 26 KOG/COG (Clusters of Orthologous Groups of proteins) groups (Figure 5), where “General function prediction only” category accounted for the most frequent group (1948, 18.51%), with the second largest group being “Post-translational modification, protein turnover, chaperon” (1319, 12.53%), followed by “Signal transduction” (932, 8.86%) and “Translation” (654, 6.21%). These results showed that in the flower stage of gentian, the protein translation and signal transduction are active.
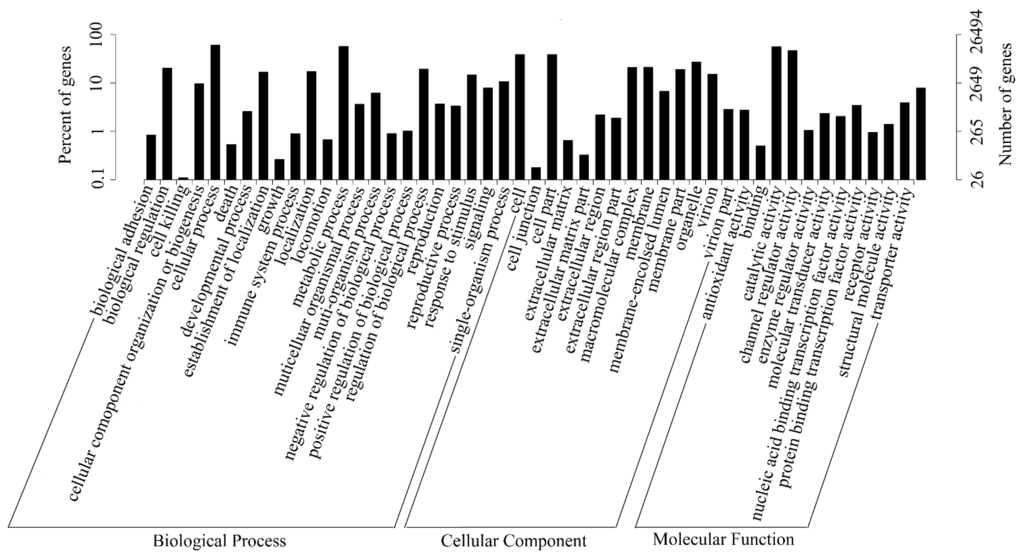
Figure 4.
GO classification map. The abscissa represents the next level GO term of the three GO categories, while the ordinate represents the number of genes annotated into the corresponding term, and its proportion of the total number of annotated genes.
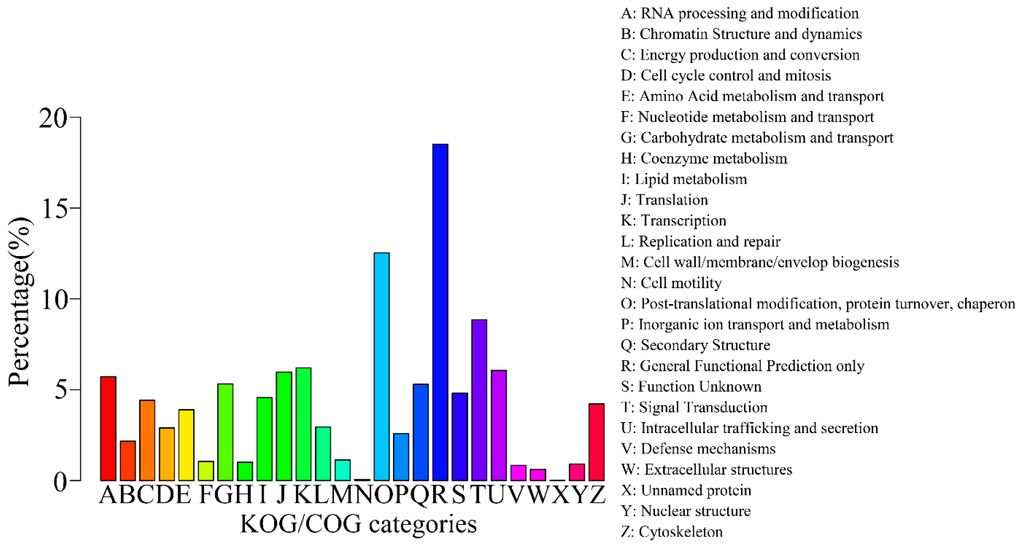
Figure 5.
KOG/COG classification map. The abscissa represents 26 group names of KOG/COG, while the vertical axis represents the number of genes annotated into the group and its proportion of total number of annotated genes.
The KEGG (Kyoto Encyclopedia of Genes and Genomes) metabolic system is a group of metabolic maps which represents current understanding of biomolecular interaction networks. In order to determine the active pathways in flowering gentian, KEGG assignments of all unigenes were performed. Referencing the 7998 unigenes of G. rigescens through the KEGG database predicted a total of five categories (level 1, cellular processes, environmental information processing, genetic information processing, and metabolism and organismal systems), 31 sub-categories (level 2, Figure 6) and 238 pathways (level 3). Unigenes identified as related to the “Translation” (861, 10.77%), “carbohydrate metabolism” (852, 10.65%), “Folding, sorting and degradation” (699, 8.74%) and “Signal transduction” (685, 8.56%) were the top four representative pathways (Figure 6). Unigenes counts for “Terpenoid backbone biosynthesis”, “Monoterpenoid biosynthesis”, “Diterpenoid biosynthesis”, “Sesquiterpenoid and triterpenoid biosynthesis”, and “Ubiquinone and other terpenoid-quinone biosynthesis” were 55, 5, 22, 21, and 31, separately. These results indicated that the terpenoid pathways were active in flowering gentian, and the corresponding genes would be candidate genes for gentiopicroside biosynthesis.
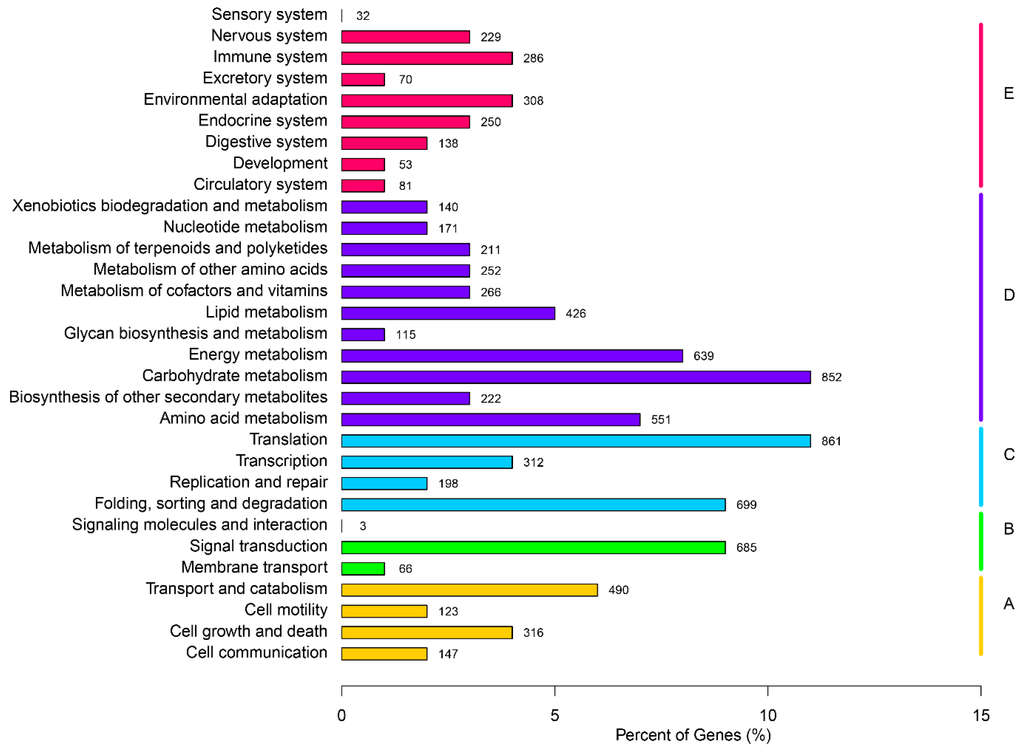
Figure 6.
KEGG classification map. The ordinate is the name of the pathway, while the abscissa is the proportion of genes belonging to this pathway. These genes were divided into five branches: (A, Cellular Processes; B, Environmental Information Processing; C, Genetic Information Processing; D, Metabolism; E, Organismal Systems.) according to the metabolic pathway they participated in.
Gene expression was calculated using the RPKM method, which takes into account both sequencing depth and gene length effects on read count [22]. On the basis of the applied criteria q-value <0.005 and log2(foldchange) >1, 3306 genes (4.31% of all genes) were identified as significantly differentially expressed genes (DEGs) between these two tissues, which comprised 2204 up-regulated genes (accounting for 67%) and 1102 down-regulated genes (33%) in leaves (Figure 7, Table S4). The log2(fold changes) ranged from one to 15. Not surprisingly, among these DEGs, most were related to photosynthesis, for example, ribulose-1,5-bisphosphate carboxylase/oxygenase (RuBisCO)-a, a key enzyme of the Calvin-Benson cycle of autotrophic CO2 assimilation [23], chloroplast chlorophyll a/b-binding protein, photosystem II 22 kDa protein gene, and chloroplastic ferredoxin genes, were all up-regulated over 10-fold in leaves compared to roots. The terpenoid biosynthesis related genes, such as geranyl diphosphate synthase (GPPS), geraniol synthase (GES), geraniol 10-hydroxylase (G10H), and iridoid oxidase (IO), four key enzymes involving monoterpene biosynthesis, were all up-regulated over 10-fold in leaves compared to roots.
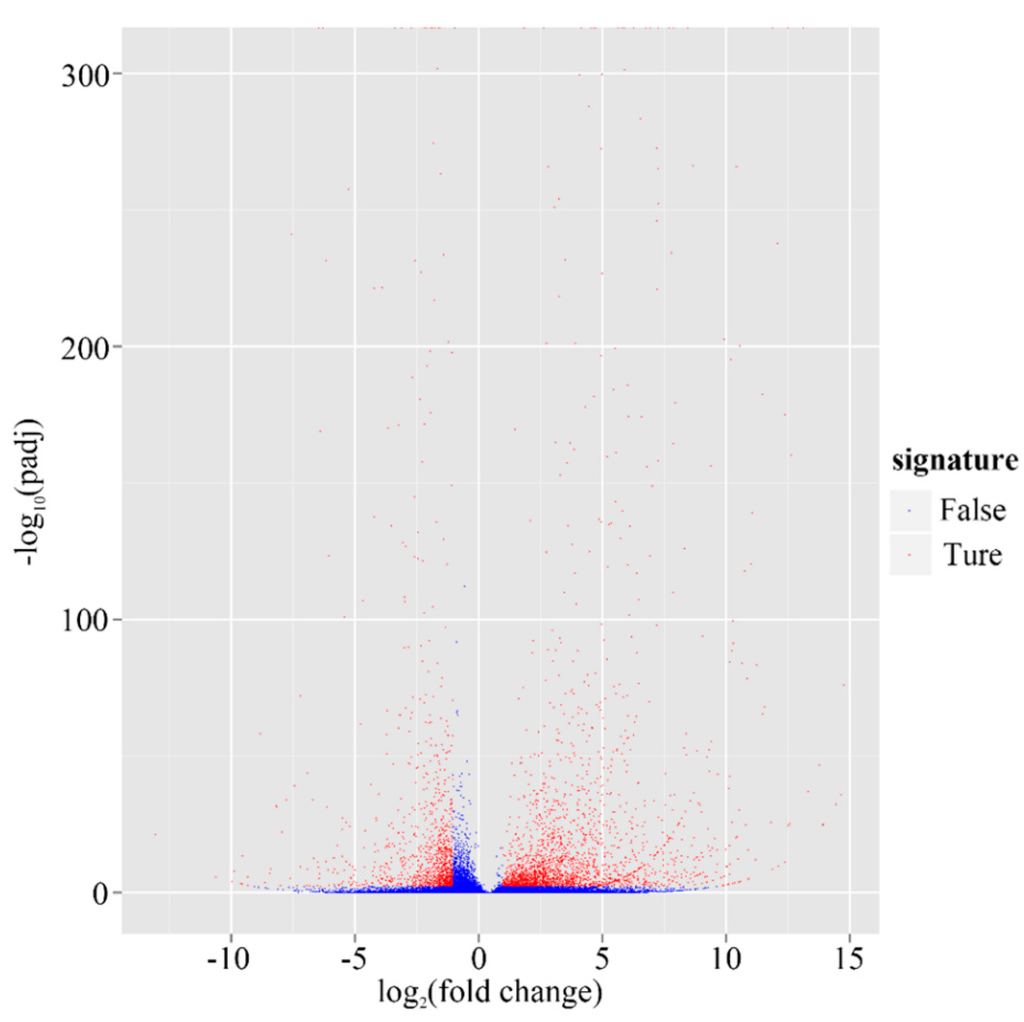
Figure 7.
Volcano plot of Leaf ves. Root in G. rigescens. The abscissa represents changes of gene expression (Leaf vs. Root). The ordinate represents the statistical significance of change of the amount of gene expression. The less p-value, the more −log10(p value), and the more significance. The scattering dots represent genes, while the blue dots show genes without significant differences and vice versa for red dots.
Of the down-regulated genes, a late embryogenesis abundant (LEA) protein, was 13-fold higher in roots than in leaves. Late Embryogenesis Abundant (LEA) proteins are a group of hydrophilic proteins with a high content of glycine, and are associated with stress tolerance in plants and animals through protecting enzymatic function and inhibition of aggregation in dehydration, heat, and salt stress [24,25]. In Arabidopsis thaliana, overexpression of LEA14 enhances salt stress tolerance [26]. Ectopic expression of ZmLEA5C in tobacco and yeast enhances their tolerance to osmotic and low temperature stresses [27]. A calcium-dependent protein kinase (CDPK) gene involved in plant defense responses [28] was nine-fold higher in roots than in leaves. Previous research suggests that CCaMK is an important component of the symbiosis signaling pathway [29,30,31,32,33,34]. In Zea mays, calcium/calmodulin-dependent protein kinase (ZmCCaMK) is required for abscisic acid (ABA)-induced antioxidant defense systems [35]. A high affinity nitrate transporter [36] was eight-fold higher in roots than in leaves. In higher plants, there are two nitrate uptake systems, the high and low affinity transporter systems, and the high affinity nitrate transporter functions when the nitrate concentration is low [37,38].
2.4. Putative Genes Involved in the Terpenoid Backbone Biosynthesis and Gentiopicroside Biosynthetic Pathways
Terepenoids, including monoterpenoids, diterpenoids, chlorophyls, carotenoids, abscisic acid, cytokinin gibberellins, sterols, sesquiterpenoids, and ubiquinones, are all closely related with the terpenoid backbone biosynthesis [39,40]. The terpenoid backbone is derived from the universal precursor, isopentenyl diphosphate (IPP), and its allylic isomer, dimethylallyldiphosphate (DMAPP), which are derived from the mevalonate (MVA) and/or the methylerythritol phosphate (MEP) pathways [41] (Figure S1). Transcripts encoding the enzymes involved in the MVA and MEP pathways were searched against the unigenes and transcripts present in our database (Table 4). In general, transcripts of MVA and MEP pathway genes were more abundant in leaves, as revealed by much higher numbers of reads of 3-hydroxy-3-methylglutaryl-CoA reductase (GrHMGR), 5-diphosphomevalonate decarboxylase (GrMVD), Isopentenyl diphosphate isomerase (GrIDI), 1-deoxy-Dxylulose 5-phosphate synthase (GrDXS), 1-deoxy-d-xylulose-5-phosphate reductoisomerase (GrDXR), 2-C-methyl-d-erythritol 2,4-cyclodiphosphate synthase (GrMCS), and 4-hydroxy-3-methylbut-2-enyl diphosphate synthase (GrHDS) genes in leaves than in roots (Table 5, (Figure S2). qRT-PCR (quantitative Reverse Transcription-Polymerase Chain Reaction) results showed that the selected genes GrDXS1, GrHDS, and GrIDI1 were more abundant in leaves (Figure 8). These results support the observation that gentiopicroside is synthesized in shoots and allocated to the roots [6].

Table 4.
Expression of putative genes in MVA and MEP biosynthesis pathways.
| Pathway | Gene Name | Unigene | RPKM in Leaf | RPKM in Root |
|---|---|---|---|---|
| MVA | AACT1 | comp81670_c0 | 50.65 | 52.76 |
| AACT2 | comp86403_c0 | 13.16 | 38.43 | |
| HMGS | comp1196622_c0 | 0.00 | 0.49 | |
| HMGR1 | comp87249_c0 | 27.14 | 3.53 | |
| HMGR2 | comp92954_c0 | 35.56 | 17.08 | |
| HMGR3 | comp4296_c0 | 0.25 | 0.57 | |
| HMGR4 | comp25979_c0 | 0.57 | 0.04 | |
| HMGR5 | comp114241_c0 | 5.72 | 0.00 | |
| MK | comp83300_c0 | 20.74 | 16.19 | |
| PMK1 | comp371052_c0 | 0.55 | 0.48 | |
| PMK2 | comp82309_c1 | 2.21 | 1.23 | |
| PMK3 | comp82309_c0 | 3.94 | 2.21 | |
| PMK4 | comp92698_c0 | 8.08 | 11.20 | |
| MVD1 | comp86107_c0 | 51.01 | 39.76 | |
| MVD2 | comp73189_c0 | 0.55 | 0.58 | |
| IDI1 | comp81822_c0 | 114.79 | 89.95 | |
| IDI2 | comp67360_c0 | 37.65 | 31.50 | |
| IDI3 | comp92050_c0 | 49.18 | 2.79 | |
| MEP | DXS1 * | comp87916_c0 | 45.34 | 1.45 |
| DXS2 | comp89290_c0 | 10.85 | 3.64 | |
| DXS3 | comp93517_c0 | 48.69 | 35.56 | |
| DXR | comp92087_c3 | 123.96 | 107.04 | |
| MCT | comp67067_c0 | 36.76 | 8.28 | |
| MCS | comp91375_c0 | 56.61 | 36.13 | |
| HDS * | comp94424_c0 | 151.28 | 77.99 | |
| HDR1 | comp87777_c0 | 114.07 | 97.97 | |
| HDR2 | comp509208_c0 | 0.00 | 0.91 | |
| HDR3 | comp1116482_c0 | 0.00 | 0.36 |
* These genes were selected for qRT-PCR.

Table 5.
Expression of putative genes in secoiridoid biosynthesis pathways.
| Gene Name | Unigene | RPKMs in Leaf | RPKMs in Root |
|---|---|---|---|
| GPPS1 * | comp57663_c0 | 47.61 | 0.04 |
| GPPS2 | comp79818_c0 | 53.25 | 8.76 |
| GES * | comp45416_c0 | 66.71 | 0.06 |
| G10H | comp95013_c1 | 304.45 | 1075.00 |
| G10H * | comp59018_c0 | 128.37 | 0.15 |
| G10H | comp67411_c0 | 6.01 | 10.68 |
| G10H | comp84881_c0 | 41.33 | 89.38 |
| G10H | comp74631_c0 | 31.33 | 70.85 |
| G10H | comp64598_c0 | 15.04 | 42.75 |
| G10H | comp42518_c0 | 3.07 | 13.76 |
| G10H | comp89824_c0 | 14.26 | 28.73 |
| G10H | comp67522_c0 | 11.48 | 15.46 |
| G10H | comp92644_c0 | 164.26 | 389.80 |
| G10H | comp67745_c0 | 13.73 | 25.95 |
| G10H | comp77398_c0 | 4.41 | 7.13 |
| G10H | comp51247_c0 | 0.00 | 2.77 |
| G10H | comp67165_c0 | 16.78 | 27.36 |
| G10H | comp67799_c0 | 0.00 | 0.90 |
| G10H | comp63189_c0 | 0.10 | 1.55 |
| G10H | comp76700_c0 | 1.03 | 2.28 |
| G10H | comp42518_c0 | 3.07 | 13.76 |
| 8HGO | comp93669_c0 | 161.97 | 2.80 |
| 8HGO | comp53753_c1 | 81.29 | 1.37 |
| 8HGO | comp53753_c2 | 121.86 | 0.92 |
| 8HGO | comp76718_c0 | 65.89 | 77.05 |
| 8HGO | comp90961_c0 | 5.52 | 2.34 |
| 8HGO | comp92998_c0 | 219.14 | 245.73 |
| SLS | comp94595_c0 | 504.62 | 20.96 |
| SLS | comp94064_c5 | 368.11 | 50.11 |
| SLS | comp84511_c0 | 27.90 | 35.43 |
| SLS | comp81016_c0 | 0.59 | 0.46 |
| SLS | comp85876_c0 | 318.25 | 345.13 |
| SLS | comp67629_c0 | 2.53 | 3.00 |
| SLS | comp54852_c0 | 0.08 | 1.74 |
| SLS | comp55055_c0 | 0.56 | 2.47 |
| SLS | comp61732_c0 | 0.75 | 2.06 |
| SLS | comp93282_c0 | 143.24 | 185.59 |
| SLS | comp281520_c0 | 0.49 | 0.75 |
| SLS | comp87446_c0 | 22.83 | 39.78 |
| SLS | comp41718_c0 | 0.09 | 4.01 |
| SLS | comp167742_c0 | 0.43 | 1.74 |
| SLS | comp94107_c0 | 121.99 | 222.06 |
| SLS | comp49781_c0 | 0.00 | 0.70 |
| SLS | comp90874_c0 | 14.95 | 24.36 |
| SLS | comp212851_c0 | 1.23 | 0.83 |
| SLS | comp73409_c0 | 0.00 | 0.72 |
| SLS | comp87446_c0 | 22.83 | 39.78 |
| SLS | comp73685_c0 | 0.95 | 2.11 |
| SLS | comp76988_c0 | 4.19 | 4.57 |
| SLS | comp103080_c0 | 4.73 | 6.98 |
| SLS | comp81659_c0 | 3.97 | 6.59 |
| IS | comp85292_c0 | 64.52 | 0.00 |
| IO | comp84741_c0 | 361.42 | 0.00 |
| 7-DLGT | comp82018_c0 | 65.59 | 0.00 |
| 7-DLH * | comp94064_c5 | 368.11 | 50.11 |
| CYP1 | comp84741_c0 | 361.42 | 0.00 |
| CYP2 | comp89478_c0 | 33.35 | 2.23 |
| CYP3 | comp108293_c0 | 10.24 | 0.09 |
| CYP4 * | comp92783_c1 | 27.39 | 8.86 |
| CYP5 | comp80146_c0 | 17.02 | 3.45 |
| CYP6 | comp83496_c0 | 46.67 | 160.59 |
| CYP7 | comp94595_c0 | 504.62 | 20.96 |
| CYP8 * | comp97650_c0 | 29.44 | 2.77 |
| CYP9 | comp90225_c0 | 16.82 | 1.16 |
| CYP10 * | comp80525_c0 | 0.06 | 15.35 |
| CYP11 | comp92026_c0 | 60.41 | 4.19 |
| CYP12 | comp68870_c0 | 3.04 | 31.70 |
| CYP13 | comp85931_c0 | 59.63 | 6.58 |
| CYP14 | comp79921_c0 | 75.72 | 33.66 |
| CYP15 * | comp80492_c0 | 19.18 | 6.02 |
| CYP16 * | comp95479_c0 | 99.29 | 14.68 |
| CYP17 | comp90874_c0 | 14.95 | 24.36 |
* These genes were selected for qRT-PCR.
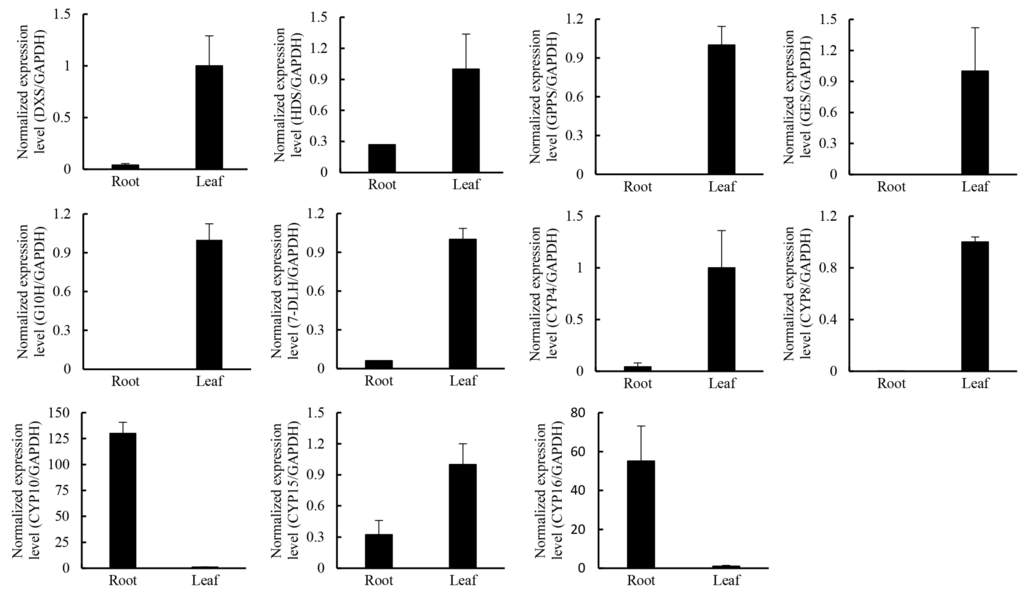
Figure 8.
The expression pattern of three selected MEP pathway genes and CYP genes in roots and leaves in G. rigescens. Means ± SE; each qRT-PCR was biologically repeated three times.
Monoterpenes are mainly synthesized in the plastid using geranyl diphosphate (GPP) as a precursor [41]. Following the formation of the acyclic terpenoid structural building blocks, terpene synthases act to generate the main terpene carbon skeleton, and the cytochrome P450 (CYP450) superfamily may catalyze these reactions [42]. However, CYP450enzymes form one of the largest gene families, with over 127 plant cytochrome P450-families being described [43]. The number of CYP450s involved in gentiopicroside biosynthesis remains unclear. Most terpenoid-related CYP450s are members of the CYP71clade, a large group that comprises CYP450s involved in the metabolism of specialized compounds [44]. In the G. rigescens transcriptome data, 169 putative CYP450s transcripts were identified that belong to 60 families as dictated by the standard CYP family categories (Table S5), and the majority are CYP716B2 family members (20 unigenes).
In the differential expression analysis, several CYP450 genes were screened out. Some which had Open Reading Frames (ORFs) with a BLASTX score of E-value <10−5, were then verified by RT-PCR and sequencing. Phylogenetic analysis of the deduced protein sequences with P450s from Arabidopsis thaliana revealed that five of them (GrCYP4, GrCYP5, GrCYP11, GrCYP16, and GrCYP17) belong to the CYP71 clan (Figure 9). qRT-PCR results showed that the selected genes GrCYP4, GrCYP8, and GrCYP15 were highly expressed in leaves, however, GrCYP10 and GrCYP16 genes were more abundant in roots (Figure 8).
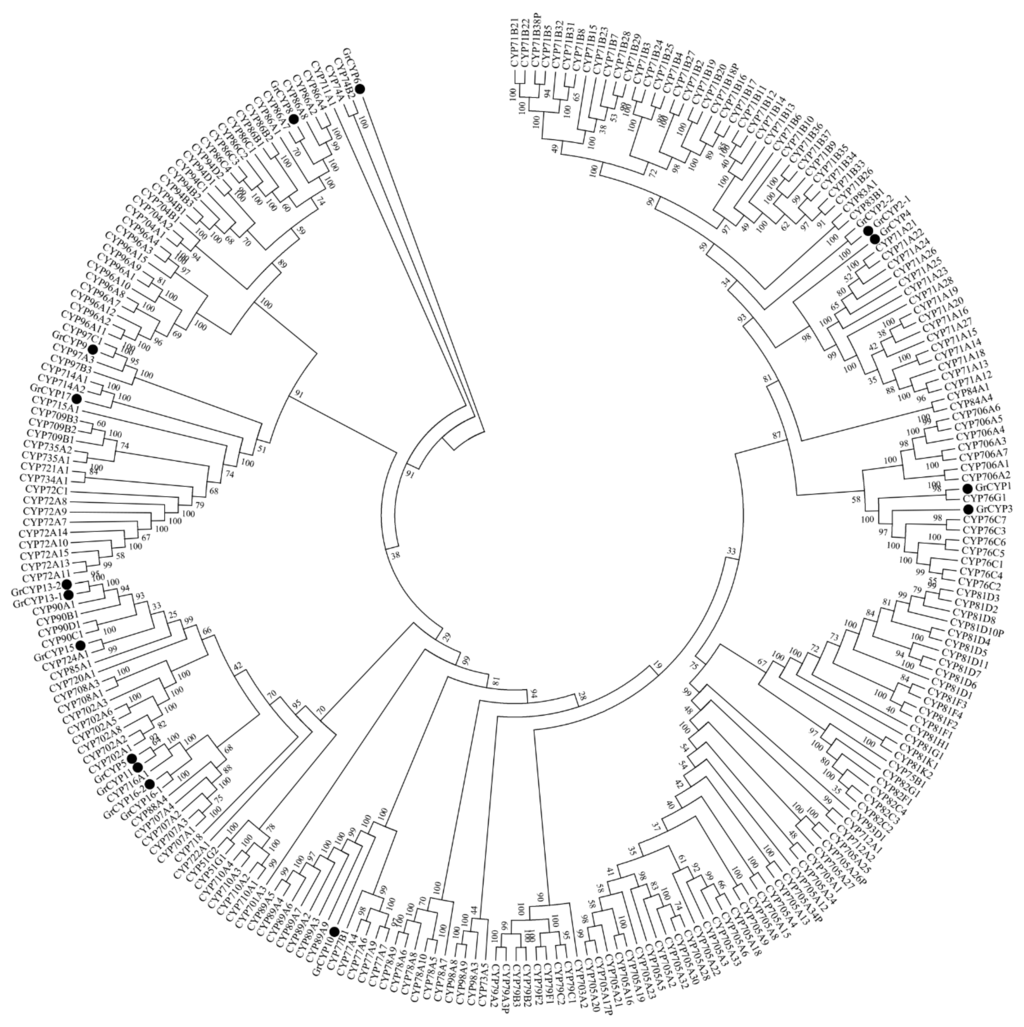
Figure 9.
Phylogenetic analysis of CYP450s from G. rigescens. Amino acid sequences were aligned using the CLUSTALX2 program, and evolutionary distances were calculated using MEGA6 software with the Neighbor-Joining statistical method and Poisson model. The bootstrap replications were set to 1000. The GenBank accession numbers of the sequences are GrCYP1 (KP218047), GrCYP2-1 (KP218048), GrCYP2-2 (KP218049), GrCYP3 (KP218050), GrCYP4 (KP218051), GrCYP5 (KP325125), GrCYP6 (KP218052), GrCYP8 (KP325126), GrCYP9 (KP218053), GrCYP450-10 (KJ829649), GrCYP11 (KP218054), GrCYP13-1 (KP218055), GrCYP13-2 (KP218056), GrCYP15 (KJ829650), GrCYP16-1 (KP218057), GrCYP16-2 (KP218058), and GrCYP17 (KF941188). The sequences of Arabidopsis thaliana come from TAIR (Available online: https://www.arabidopsis.org).
In the secoiridoid biosynthesis pathway, IPPs and DMAPPs are condensed into GPP by GPPS, which is then converted to geraniol by GES. Geraniol is catalyzed to 8-oxogeraniol by geraniol 8-oxidase (G8O, also named G10H) [42,45], and then to 8-oxogeranial by 8-hydroxygeraniol oxidoreductase (8HGO, also named 10HGO) [42,45]; 8-oxogeranial is sequentially catalyzed into loganin via several steps including iridoid synthase (IS), IO, 7-deoxyloganetic acid glucosyltransferase (7-DLGT), 7-deoxyloganic acid hydroxylase (DL7H), loganic acid O-methyltransferase (LAMT), and secologanin synthase (SLS) [45,46,47]. In Catharanthus roseus, G10H, SLS, and DL7H were three important enzymes of the monoterpenoid biosynthesis pathway [48,49,50]. In the G. rigescens transcriptome, there were annotated two GrGPPSs, one GrGES, 18 GrG10Hs, six Gr8HGOs, 24 GrSLSs, one Gr7DLH, one GrIO, one GrIS, and one Gr7-DLGT, but no sequence annotated as GrLAMT. Of interest was that GrIO, GrIS, Gr7-DLGT, and GrCYP1 were only expressed in leaves. Differential expression analysis identified five genes GrGPPS1, GrGES, GrG10H, Gr7DLH, and GrCYP1, which were upregulated 10 times more in leaves than in roots (Table 5). Meanwhile, there were three Gr8HGOs, one GrSLS, one GrIS, one Gr7-DLGT, one GrCYP3, and one GrCYP7, whose expression was five times higher in leaves than in roots (Table 5). However, the expression of one GrSLS and one GrCYP10 was downregulated more than five times in leaves compared to roots (Table 5). qRT-PCR results showed that GrGPPS1, GrGES, GrG10H, and Gr7DLH genes were more highly expressed in leaves than in roots (Figure 8), which suggested that secologanin was mainly synthesized in leaves. These results provide further evidence for gentiopicroside synthesis in shoots [6].
2.5. Candidate Transcription Factors Involved in Regulating the Terpenoid Biosynthetic Pathway
TFs play key roles in controlling gene expression [51], and the controlled transcription of biosynthetic genes is one major mechanism regulating secondary metabolite production in plant cells [52,53,54]. The floral terpenoids of snapdragon appear to be derived exclusively from the MEP pathway in plastids, and this pathway controls precursor levels for GPPS, which in turn is transcriptionally regulated [55]. In our G. rigescens unigene dataset, 7176 unigenes were annotated as transcription factors (Table S6), including bHLH (349), AP2-EREBP (172), WRKY (141), MYB (129), bZIP (115), and GRAS (94) family members. Among these, most were expressed in both root and leaf tissues, with 80 showing a significantly higher expression level in leaves than in roots (Table 6, Table S7).

Table 6.
Summary of transcription factor unigenes of G. rigescens.
| TF Family | Number of Genes Detected | Up-Regulated in Leaves (log2(Fold_Change) > 2) | Up-Regulated in Roots (log2(Fold_Change) > 2) |
|---|---|---|---|
| HLH | 349 | 26 | 5 |
| AP2-EREBP | 172 | 20 | 4 |
| WRKY | 141 | 17 | 1 |
| MYB | 129 | 7 | 2 |
| bZIP | 115 | 3 | 4 |
| GRAS | 94 | 7 | 1 |
| Total | 1000 | 80 | 17 |
Members of the WRKY transcription factor family have been shown to regulate secondary metabolism pathways [56]. In Gossypium arboreum, GaWRKY1 regulates sesquiterpene biosynthesis via activation of δ-cadinene synthase (CAD1-A) [57]. In Coptis japonica, the biosynthesis of berberine is controlled by CjWRKY1 [58]. In tomato trichomes, terpene synthase are controlled by SlMYC1 and SlWRKY73 [59]. In Catharanthus roseus, CrWRKY1, a regulator in biosynthesis of terpenoid indole alkaloids, interacts with transcription factors, including ORCA3, CrMYC, and ZCTs, to play a role in determining the root-specific accumulation of serpentine [60,61]. In Nicotiana attenuata, biosynthesis of diterpene glycosides are regulated by WRKY3 and WRKY6 [62]. In leaves of Artemisia annua, AaWRKY1 activated the expression of the majority of artemisinin biosynthetic genes, including AaADS and AaHMGR [63]. In the present analysis, 141 unigenes were annotated as WRKY family transcription factors, of which 17 were more highly expressed in leaves than in roots (Table 6). qRT-PCR results showed that GrWRKY7 genes were more highly expressed in leaves than in roots, while it was the opposite for GrWRKY5 and GrWRKY6 (Figure 10). Thus, GrWRKY7 is a good candidate to study in the regulation of the biosynthesis of gentiopicroside.

Figure 10.
The expression pattern of three selected WRKY genes in roots and leaves in G. rigescens. Means ± SE; each qRT-PCR was biologically repeated three times.
3. Experimental Section
3.1. Plant Materials and RNA Isolation
The cultivated variety of G. rigescens was grown in pots with humus soil and yellow soil mixed in a 1:1 ratio. The fresh roots and leaves were collected from 3-year-old flowering gentian plants in October 2012 (Figure 11). To reduce biological bias, material of three individual plants was pooled to give 1 g of roots and 1 g of leaf samples. All samples were immediately frozen in liquid nitrogen and stored at −80 °C.
Total RNA of each sample (three plants mixed) was isolated by Illumina TruSeq™ RNA Sample Preparation Kit (RS-122-2001). RNA degradation and contamination were monitored on 1% agarose gels. RNA purity was checked using the NanoPhotometer® spectrophotometer (IMPLEN, Westlake Village, CA, USA). RNA concentration was measured using Qubit® RNA Assay Kit in Qubit® 2.0 Flurometer (Life Technologies, Carlsbad, CA, USA). RNA integrity was assessed using the RNA Nano 6000 Assay Kit of the Bioanalyzer 2100 system (Agilent Technologies, Palo Alto, CA, USA).
3.2. Transcriptome Sample Preparation for Sequencingc
The construction of a cDNA library and the following sequencing procedures were as in Zhu et al. [64].
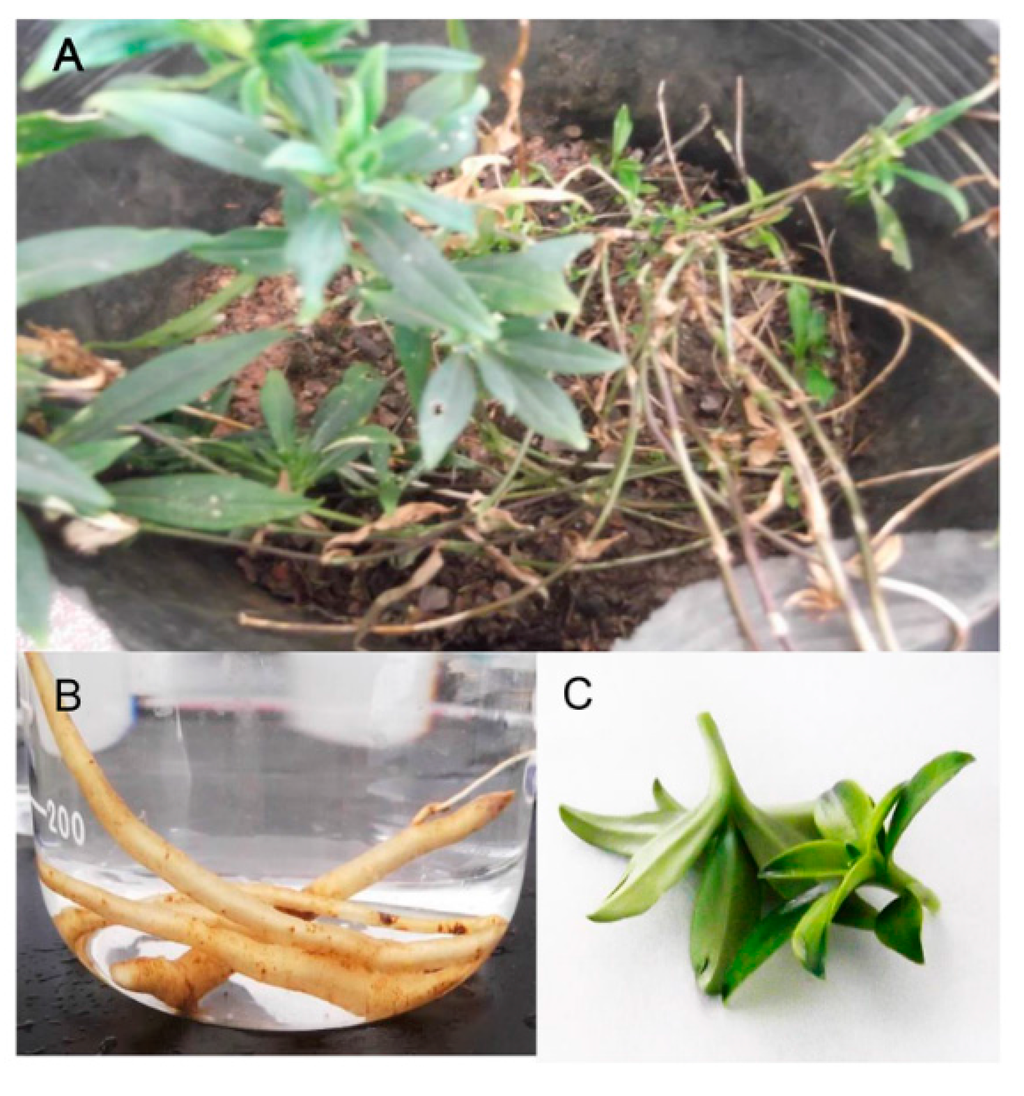
Figure 11.
Plant materials of G. rigescens. (A) G. rigescens used in this article; (B,C) are roots and leaves used in experiments for sequencing.
3.3. Data Filtering
Raw data (raw reads) of fastq format were firstly processed through in-house perl scripts (available upon request). In this step, clean reads were obtained by standard quality control criteria to remove all of the reads which meet any one of the following parameters: (1) The reads that aligned to adaptors with no more than two mismatches; (2) The reads with more than 10% unknown bases (N bases); (3) The reads with more than 50% of low-quality bases (quality value ≤ 5) in one read. At the same time, Q20, Q30, GC-content, and sequence duplication level of the clean data was calculated. All the downstream analyses were based on clean data with a high quality of sequencing.
3.4. Transcriptome Assembly and Contamination Sequences Filtering
As there are few reference sequences available for Gentianaceae, the reads for unigenes of both root and leaf were assembled together. The left files (read1 files) from all libraries/samples were pooled into one left.fq file, and right files (read2 files) into one right.fq file, both in FastQ format. Transcriptome assembly was accomplished based on the pooled paired-end reads files (left.fq and right.fq) using Trinity software (Version 2012-10-05) [20] with min_k-mer_cov set to 2 and all other parameters settings as default. The following processes are referred to Shu et al. [65].
Contaminant sequence level was investigated according to species distribution based on protein similarity searching against NR protein databases. Coding sequences from Non-land-plant species were identified and discarded using a previously described taxonomy-based method [66]. Contaminant sequence from major plant pathogens, and human and other microorganisms (including bacteria, virus, and fungi) was investigated using the stand-alone version of DeconSeq [67].
3.5. Gene Functional Annotation
To assign putative gene function, unigenes were searched against the NR (NCBI non-redundant protein sequences), NT (NCBI nucleotide sequences), TAIR10, PFAM (Protein family; Available online: http://pfam.sanger.ac.uk/), and Swiss-Prot (A manually annotated and reviewed protein sequence database; Available online: http://www.ebi.ac.uk/uniprot/) databases using BLAST software with an E-value cutoff of 10−5 [68]. Hmmerscan was adopted for PFAM annotation, and Blast2GO was used for GO annotation (Gene Ontology; Available online: http://www.geneontology.org/) [69] with the same E-value. To evaluate the completeness of the library and the efficacy of the annotation process, the annotated sequences were searched for the possible functions involved in KOG/COG (Available online: http://www.ncbi.nlm.nih.gov/COG/) classifications. To determine which pathways are active in leaves and roots, the annotated sequences were mapped to the reference pathways in KOG/COG, KO (KEGG Ortholog database; Available online: http://www.genome.jp/kegg/).
3.6. Differential Expression Analysis
The calculation of unigene expression used the RPKM method (Reads per kb per Million reads) [70]. Gene expression levels were estimated by RSEM [71] for each sample: (1) Clean data were mapped back onto the assembled transcriptome; (2) Readcount for each gene was obtained from the mapping results.
Differential expression analysis and GO enrichment analysis of leaves vs. roots was referred to Lv et al. [72]. To figure out the transcription factor families existing in leaves and roots, the transcript sequences were aligned against the Plant Transcription Factor Database with BLASTX and a cutoff of E-value < 10−6 [73].
3.7. KEGG Enrichment Analysis
KEGG pathway enrichment analysis of the DEGs was done using KOBAS [74].
3.8. Real-Time PCR Analysis
DNase I-treated total RNA of root and leaf was converted into first-strand cDNA by the use of PrimeScript RTase (Takara, Tokyo, Japan). qRT-PCRs were performed in an ABI7000 Fluorescence Quantitative PCR Instrument (Applied Biosystems, Foster City, CA, USA) using a SuperReal PreMix Plus Kit (Tiangen, China). The PCR condition was: 95 °C for 3 min; 95 °C for 15 s; 60 °C for 30 s. Each reaction was repeated three times. Glyceraldehyde-3-phosphate dehydrogenase (GAPDH) was chosen as the internal reference gene. The 2−ΔΔCt method was adopted for the relative gene expression. The primers used are listed in Table S8.
4. Conclusions
Next generation sequencing of RNA has now replaced microarrays as the preferred method for gene expression profiling. One key advantage of this method is that it enables examination of the transcriptome of non-model organisms [75]. Despite the Chinese traditional herb G. rigescens being used for thousands of years, the biosynthesis pathway and regulation of its main effective component, gentiopicroside, remains unknown. Few genetic or genomic studies have been performed. The results presented here addresses this by using the Illumina Hiseq2000 platform to identify sequences and transcript abundance levels of genes expressed in developing roots and leaves of G. rigescens. These sequences provide a starting point for further investigation of gentiopicroside biosynthesis, and include the 3306 unigenes from diverse pathways that were differentially expressed between root and leaf. The results represent a genetic resource for G. rigescens, and may serve as the foundation for further genomic research on G. rigescens and its relatives.
Supplementary Materials
Supplementary materials can be found at http://www.mdpi.com/1422-0067/16/05/11550/s1.
Acknowledgments
This study was supported by the National Natural Science Foundation of China (81260608), Key Project of Education Ministry of Yunnan Province (2013Z075) and National Key Technology R&D Program of China (2011BAI13B02-04). Thanks to the Beijing Novogene Bioinformatics Technology Company for carrying out the sequencing of the transcriptomes.
Author Contributions
Conception and design of experiments: Xiaodong Zhang and Andrew C. Allan. Performing the experiments: Xiaodong Zhang and Caixia Li. Analysis of data: Xiaodong Zhang, Caixia Li and Qiuyang Yao. Contribution of reagents/materials/analysis tools: Yuanzhong Wang. Preparing the manuscript: Xiaodong Zhang and Andrew C. Allan.
Conflicts of Interest
The authors declare no conflict of interest.
References
- Yang, Y.; Shao, A.; Jin, H.; Ou, X.; Chen, M.; Liu, D.; Huang, L. Variation of botanical morphologic characteristics between wild and cultivated populations of Gentiana rigescens in Yunnan-Guizhou Plateau. Chin. Tradit. Herb. Drugs 2012, 43, 1604–1610. [Google Scholar]
- Chinanews. Available online: http://www.chinanews.com/gn/2013/07-12/5037538.shtml (accessed on 13 July 2013).
- Zheng, P.; Zhang, K.; Wang, Z. Genetic diversity and gentiopicroside content of four Gentiana species in China revealed by ISSR and HPLC methods. Biochem. Syst. Ecol. 2011, 39, 704–710. [Google Scholar] [CrossRef]
- Zhang, J.; Wang, Y.; Yang, T.; Jin, H.; Zhang, J. Use of gibberellic acid to overcome the allelopathic effect of a range of species on the germination of seeds of Gentiana rigescens, a medicinal herb. Seed Sci. Technol. 2012, 40, 443–447. [Google Scholar] [CrossRef]
- Keller, F. Gentiopicroside is located in the vacuoles of root protoplasts of Gentiana lutea. J. Plant Physiol. 1986, 122, 473–476. [Google Scholar] [CrossRef]
- Zhu, H.; Zheng, C.; Zhao, P.; Li, Y.; Yang, C.; Zhang, Y. Contents analysis of gentiopicroside in wild and tissue culture seedlings of Gentiana rigescens. Nat. Prod. Res. Dev. 2011, 23, 482–485. [Google Scholar]
- Shen, T. Studies on Breeding Traits and Accumulation of Effective Components in Cultivation Conditions in Gentiana rigescens. Master Thesis, Yunnan University, Kunming, China, 2011. [Google Scholar]
- Yuan, T.; Wang, Y.; Zhao, Y.; Zhang, J.; Jin, H.; Zhang, J. The common and variation peak ratio dual index sequence analysis in UV fingerprint spectra of Gentiana Rigescens. Spectrosc. Spectr. Anal. 2011, 31, 2161–2165. [Google Scholar]
- Tasheva, K.; Kosturkova, G. Role of biotechnology for protection of endangered medicinal plants. In Environmental Biotechnology—New Approaches and Prospective Applications; Petre, M., Ed.; InTech: Rijeka, Croatia, 2013; pp. 235–238. [Google Scholar]
- Nakatsuka, T.; Yamada, E.; Saito, M.; Hikage, T.; Ushiku, Y.; Nishihara, M. Construction of the first genetic linkage map of Japanese gentian (Gentianaceae). BMC Genomics 2012, 13. [Google Scholar] [CrossRef] [PubMed]
- Sun, T.; Li, S.; Cong, W. Karyotype analysis of chromosomes in Gentiana manshurica. J. Qiqihar Norm. Univ.: Nat. Sci. Ed. 1996, 16, 61–62. [Google Scholar]
- Nakatsuka, T.; Saito, M.; Yamada, E.; Nishihara, M. Production of picotee-type flowers in Japanese gentian by CRES-T. Plant Biotechnol. Nar. 2011, 28, 173–180. [Google Scholar] [CrossRef]
- Nishihara, M.; Hikage, T.; Yamada, E.; Nakatsuka, T. A single-base substitution suppresses flower color mutation caused by a novel miniature inverted-repeat transposable element in gentian. Mol. Genet. Genomics 2011, 286, 371–382. [Google Scholar] [CrossRef] [PubMed]
- Nakatsuka, T.; Mishiba, K.; Kubota, A.; Abe, Y.; Yamamura, S.; Nakamura, N.; Tanaka, Y.; Nishihara, M. Genetic engineering of novel flower colour by suppression of anthocyanin modification genes in gentian. J. Plant Physiol. 2010, 167, 231–237. [Google Scholar] [CrossRef] [PubMed]
- Zhang, J.; Zhang, J.; Wang, Y.; Yang, S.; Yang, M.; Jin, H. Effects of tree species on seed germination and seedlings growth of Chinese medicinal herb Gentiana rigescens. Allelopath. J. 2012, 29, 325–332. [Google Scholar]
- Zhang, J.; Yuan, T.; Wang, Y.; Zhao, Y.; Zhang, J.; Jin, H. Determination of mineral elements in Gentiana rigescens from different zones of Yunnan, China. Biol. Trace Elem. Res. 2012, 147, 329–333. [Google Scholar] [CrossRef] [PubMed]
- Shen, T.; Yang, M.Q.; Zhao, Z.L.; Zhang, Z.H.; Wang, Y.Z.; Jin, H.; Zhang, J.Y.; Wang, Y.H. Dynamic changes in terpenoid contents in Gentiana rigescens. Bull. Bot. 2011, 46, 652–657. [Google Scholar] [CrossRef]
- Suyama, Y.; Kurimoto, S.; Kawazoe, K.; Murakami, K.; Sun, H.D.; Li, S.L.; Takaishi, Y.; Kashiwada, Y. Rigenolide A, a new secoiridoid glucoside with a cyclobutane skeleton, and three new acylated secoiridoid glucosides from Gentiana rigescens Franch. Fitoterapia 2013, 91, 166–172. [Google Scholar] [CrossRef] [PubMed]
- Wu, Q.; Sun, C.; Chen, S.; H., L.; Li, Y.; Sun, Y.; Niu, Y. Application of transcriptomics in the studies of medicinal plants. World Sci. Technol. Mod. Tradit. Chin. Med. 2010, 3, 457–462. [Google Scholar]
- Grabherr, M.G.; Haas, B.J.; Yassour, M.; Levin, J.Z.; Thompson, D.A.; Amit, I.; Adiconis, X.; Fan, L.; Raychowdhury, R.; Zeng, Q. Full-length transcriptome assembly from RNA-Seq data without a reference genome. Nat. Biotechnol. 2011, 29, 644–652. [Google Scholar] [CrossRef] [PubMed]
- Abdullayev, I.; Kirkham, M.; Björklund, Å.K.; Simon, A.; Sandberg, R. A reference transcriptome and inferred proteome for the salamander Notophthalmus viridescens. Exp. Cell Res. 2013, 319, 1187–1197. [Google Scholar] [CrossRef] [PubMed]
- Yang, Y.; Xu, M.; Luo, Q.; Wang, J.; Li, H. De novo transcriptome analysis of Liriodendron chinense petals and leaves by Illumina sequencing. Gene 2014, 534, 155–162. [Google Scholar] [CrossRef] [PubMed]
- Tourova, T.P.; Kovaleva, O.L.; Sorokin, D.Y.; Muyzer, G. Ribulose-1,5-bisphosphate carboxylase/oxygenase genes as a functional marker for chemolithoautotrophic halophilic sulfur-oxidizing bacteria in hypersaline habitats. Microbiology 2010, 156, 2016–2025. [Google Scholar] [CrossRef] [PubMed]
- Amara, I.; Zaidi, I.; Masmoudi, K.; Ludevid, M.D.; Pagès, M.; Goday, A.; Brini, F. Insights into Late Embryogenesis Abundant (LEA) Proteins in Plants: From Structure to the Functions. Am. J. Plant. Sci. 2014, 5, 3440–3455. [Google Scholar] [CrossRef]
- Zhao, P.; Liu, F.; Zheng, G.; Liu, H. Group 3 late embryogenesis abundant protein in Arabidopsis: Structure, regulation, and function. Acta Physiol. Plant 2011, 33, 1063–1073. [Google Scholar] [CrossRef]
- Jia, F.; Qi, S.; Li, H.; Liu, P.; Li, P.; Wu, C.; Zheng, C.; Huang, J. Overexpression of Late Embryogenesis Abundant 14 enhances Arabidopsis salt stress tolerance. Biochem. Biophys. Res. Commun. 2014, 454, 505–511. [Google Scholar] [CrossRef] [PubMed]
- Liu, Y.; Wang, L.; Jiang, S.; Pan, J.; Cai, G.; Li, D. Group 5 LEA protein, ZmLEA5C, enhance tolerance to osmotic and low temperature stresses in transgenic tobacco and yeast. Plant Physiol. Biochem. 2014, 84, 22–31. [Google Scholar] [CrossRef] [PubMed]
- Kiselev, K.V.; Turlenko, A.V.; Zhuravlev, Y.N. Structure and expression profiling of a novel calcium-dependent protein kinase gene PgCDPK1a in roots, leaves, and cell cultures of Panax ginseng. Plant Cell Tissue Organ 2010, 103, 197–204. [Google Scholar] [CrossRef]
- Kang, H.; Zhu, H.; Chu, X.; Yang, Z.; Yuan, S.; Yu, D.; Wang, C.; Hong, Z.; Zhang, Z. A novel interaction between CCaMK and a protein containing the Scythe_N ubiquitin-like domain in Lotus japonicus. Plant Physiol. 2011, 155, 1312–1324. [Google Scholar] [CrossRef] [PubMed]
- Hayashi, T.; Banba, M.; Shimoda, Y.; Kouchi, H.; Hayashi, M.; Imaizumi-Anraku, H. A dominant function of CCaMK in intracellular accommodation of bacterial and fungal endosymbionts. Plant J. 2010, 63, 141–154. [Google Scholar] [PubMed]
- Takeda, N.; Maekawa, T.; Hayashi, M. Nuclear-localized and deregulated calcium- and calmodulin-dependent protein kinase activates rhizobial and mycorrhizal responses in Lotus japonicus. Plant Cell 2012, 24, 810–822. [Google Scholar] [CrossRef] [PubMed]
- Miller, J.B.; Pratap, A.; Miyahara, A.; Zhou, L.; Bornemann, S.; Morris, R.J.; Oldroyd, G.E. Calcium/Calmodulin-dependent protein kinase is negatively and positively regulated by calcium, providing a mechanism for decoding calcium responses during symbiosis signaling. Plant Cell 2013, 25, 5053–5066. [Google Scholar] [CrossRef] [PubMed]
- Shimoda, Y.; Han, L.; Yamazaki, T.; Suzuki, R.; Hayashi, M.; Imaizumi-Anraku, H. Rhizobial and fungal symbioses show different requirements for calmodulin binding to calcium calmodulin-dependent protein kinase in Lotus japonicus. Plant Cell 2012, 24, 304–321. [Google Scholar] [CrossRef] [PubMed]
- Singh, S.; Parniske, M. Activation of calcium- and calmodulin-dependent protein kinase (CCaMK), the central regulator of plant root endosymbiosis. Curr. Opin. Plant Biol. 2012, 15, 444–453. [Google Scholar] [CrossRef] [PubMed]
- Ma, F.; Lu, R.; Liu, H.; Shi, B.; Zhang, J.; Tan, M.; Zhang, A.; Jiang, M. Nitric oxide-activated calcium/calmodulin-dependent protein kinase regulates the abscisic acid-induced antioxidant defence in maize. J. Exp. Bot. 2012, 63, 4835–4847. [Google Scholar] [CrossRef] [PubMed]
- Kiba, T.; Feria-Bourrellier, A.B.; Lafouge, F.; Lezhneva, L.; Boutet-Mercey, S.; Orsel, M.; Brehaut, V.; Miller, A.; Daniel-Vedele, F.; Sakakibara, H.; et al. The Arabidopsis nitrate transporter NRT2.4 plays a double role in roots and shoots of nitrogen-starved plants. Plant Cell 2012, 24, 245–258. [Google Scholar] [CrossRef] [PubMed]
- Bagchi, R.; Salehin, M.; Adeyemo, O.S.; Salazar, C.; Shulaev, V.; Sherrier, D.J.; Dickstein, R. Functional assessment of the Medicago truncatula NIP/LATD protein demonstrates that it is a high-affinity nitrate transporter. Plant Physiol. 2012, 160, 906–916. [Google Scholar] [CrossRef] [PubMed]
- Kotur, Z.; Glass, A.D. A 150 kDa plasma membrane complex of AtNRT2.5 and AtNAR2.1 is the major contributor to constitutive high-affinity nitrate influx in Arabidopsis thaliana. Plant Cell Environ. 2014. [Google Scholar] [CrossRef]
- Sun, P.; Song, S.; Zhou, L.; Zhang, B.; Qi, J.; Li, X. Transcriptome analysis reveals putative genes involved in iridoid biosynthesis in Rehmannia glutinosa. Int. J. Mol. Sci. 2012, 13, 13748–13763. [Google Scholar] [CrossRef] [PubMed]
- Zheng, X.; Xu, H.; Ma, X.; Zhan, R.; Chen, W. Triterpenoid saponin biosynthetic pathway profiling and candidate gene mining of the Ilex asprella root using RNA-Seq. Int. J. Mol. Sci. 2014, 15, 5970–5987. [Google Scholar] [CrossRef] [PubMed]
- Yang, L.; Ding, G.; Lin, H.; Cheng, H.; Kong, Y.; Wei, Y.; Fang, X.; Liu, R.; Wang, L.; Chen, X.; et al. Transcriptome analysis of medicinal plant Salvia miltiorrhiza and identification of genes related to tanshinone biosynthesis. PLoS ONE 2013, 8, e80464. [Google Scholar] [CrossRef] [PubMed]
- Guo, X.; Li, Y.; Li, C.; Luo, H.; Wang, L.; Qian, J.; Luo, X.; Xiang, L.; Song, J.; Sun, C.; et al. Analysis of the Dendrobium officinale transcriptome reveals putative alkaloid biosynthetic genes and genetic markers. Gene 2013, 527, 131–138. [Google Scholar] [CrossRef] [PubMed]
- Weitzel, C.; Simonsen, H.T. Cytochrome P450-enzymes involved in the biosynthesis of mono-and sesquiterpenes. Phytochem. Rev. 2015, 14, 7–24. [Google Scholar] [CrossRef]
- Hamberger, B.; Bak, S. Plant P450s as versatile drivers for evolution of species-specific chemical diversity. Philos. Trans. R. Soc. Lond. B Biol. Sci. 2013, 368, 1–16. [Google Scholar] [CrossRef]
- Salim, V.; Wiens, B.; Masada-Atsumi, S.; Yu, F.; de Luca, V. 7-deoxyloganetic acid synthase catalyzes a key 3 step oxidation to form 7-deoxyloganetic acid in Catharanthus roseus iridoid biosynthesis. Phytochemistry 2014, 101, 23–31. [Google Scholar] [CrossRef] [PubMed]
- Miettinen, K.; Dong, L.; Navrot, N.; Schneider, T.; Burlat, V.; Pollier, J.; Woittiez, L.; van der Krol, S.; Lugan, R.; Ilc, T.; et al. The seco-iridoid pathway from Catharanthus roseus. Nat. Commun. 2014, 5, 3606–3616. [Google Scholar] [PubMed]
- Asada, K.; Salim, V.; Masada-Atsumi, S.; Edmunds, E.; Nagatoshi, M.; Terasaka, K.; Mizukami, H.; de Luca, V. A 7-deoxyloganetic acid glucosyltransferase contributes a key step in secologanin biosynthesis in Madagascar periwinkle. Plant Cell 2013, 25, 4123–4134. [Google Scholar] [CrossRef] [PubMed]
- Irmler, S.; Schröder, G.; St-Pierre, B.; Crouch, N.P.; Hotze, M.; Schmidt, J.; Strack, D.; Matern, U.; Schröder, J. Indole alkaloid biosynthesis in Catharanthus roseus: New enzyme activities and identification of cytochrome P450 CYP72A1 as secologanin synthase. Plant J. 2000, 24, 797–804. [Google Scholar] [CrossRef] [PubMed]
- Wang, C.T.; Liu, H.; Gao, X.S.; Zhang, H.X. Overexpression of G10H and ORCA3 in the hairy roots of Catharanthus roseus improves catharanthine production. Plant Cell Rep. 2010, 29, 887–894. [Google Scholar] [CrossRef] [PubMed]
- Salim, V.; Yu, F.; Altarejos, J.; Luca, V. Virus-induced gene silencing identifies Catharanthus roseus 7-deoxyloganic acid-7-hydroxylase, a step in iridoid and monoterpene indole alkaloid biosynthesis. Plant J. 2013, 76, 754–765. [Google Scholar] [CrossRef] [PubMed]
- Guo, A.Y.; Chen, X.; Gao, G.; Zhang, H.; Zhu, Q.H.; Liu, X.C.; Zhong, Y.F.; Gu, X.; He, K.; Luo, J. PlantTFDB: A comprehensive plant transcription factor database. Nucleic Acids Res. 2008, 36, 966–969. [Google Scholar] [CrossRef]
- Vom Endt, D.; Kijne, J.W.; Memelink, J. Transcription factors controlling plant secondary metabolism: What regulates the regulators? Phytochemistry 2002, 61, 107–114. [Google Scholar] [CrossRef] [PubMed]
- Crocoll, C. Biosynthesis of the Phenolic Monoterpenes, Thymol and Carvacrol, by Terpene Synthases and Cytochrome P450s in Oregano and Thyme. Ph.D. Thesis, Friedrich-Schiller-Universität, Jena, Germany, 2011. [Google Scholar]
- Yang, C.; Fang, X.; Wu, X.; Mao, Y.; Wang, L.; Chen, X. Transcriptional regulation of plant secondary metabolism. J. Integr. Plant Biol. 2012, 54, 703–712. [Google Scholar] [CrossRef] [PubMed]
- Van Schie, C.C.; Haring, M.A.; Schuurink, R.C. Regulation of terpenoid and benzenoid production in flowers. Curr. Opin. Plant Biol. 2006, 9, 203–208. [Google Scholar] [CrossRef]
- Li, C.; Li, D.; Shao, F.; Lu, S. Molecular cloning and expression analysis of WRKY transcription factor genes in Salvia miltiorrhiza. BMC Genomics 2015, 16. [Google Scholar] [CrossRef]
- Xu, Y.; Wang, J.; Wang, S.; Wang, J.; Chen, X. Characterization of GaWRKY1, a cotton transcription factor that regulates the sesquiterpene synthase gene (+)-δ-cadinene synthase-A. Plant Physiol. 2004, 135, 507–515. [Google Scholar] [CrossRef] [PubMed]
- Kato, N.; Dubouzet, E.; Kokabu, Y.; Yoshida, S.; Taniguchi, Y.; Dubouzet, J.G.; Yazaki, K.; Sato, F. Identification of a WRKY protein as a transcriptional regulator of benzylisoquinoline alkaloid biosynthesis in Coptis japonica. Plant Cell Physiol. 2007, 48, 8–18. [Google Scholar] [CrossRef] [PubMed]
- Spyropoulou, E.A.; Haring, M.A.; Schuurink, R.C. RNA sequencing on Solanum lycopersicum trichomes identifies transcription factors that activate terpene synthase promoters. BMC Genomics 2014, 15. [Google Scholar] [CrossRef] [PubMed]
- Suttipanta, N.; Pattanaik, S.; Kulshrestha, M.; Patra, B.; Singh, S.K.; Yuan, L. The transcription factor CrWRKY1 positively regulates the terpenoid indole alkaloid biosynthesis in Catharanthus roseus. Plant Physiol. 2011, 157, 2081–2093. [Google Scholar] [CrossRef] [PubMed]
- Yang, Z.; Patra, B.; Li, R.; Pattanaik, S.; Yuan, L. Promoter analysis reveals cis-regulatory motifs associated with the expression of the WRKY transcription factor CrWRKY1 in Catharanthus roseus. Planta 2013, 238, 1039–1049. [Google Scholar] [CrossRef]
- Skibbe, M.; Qu, N.; Galis, I.; Baldwin, I.T. Induced plant defenses in the natural environment: Nicotiana attenuata WRKY3 and WRKY6 coordinate responses to herbivory. Plant Cell 2008, 20, 1984–2000. [Google Scholar] [CrossRef] [PubMed]
- Ma, D.; Pu, G.; Lei, C.; Ma, L.; Wang, H.; Guo, Y.; Chen, J.; Du, Z.; Wang, H.; Li, G. Isolation and characterization of AaWRKY1, an Artemisia annua transcription factor that regulates the amorpha-4,11-diene synthase gene, a key gene of artemisinin biosynthesis. Plant Cell Physiol. 2009, 50, 2146–2161. [Google Scholar] [CrossRef] [PubMed]
- Zhu, Q.; Li, B.; Mu, S.; Han, B.; Cui, R.; Xu, M.; You, Z.; Dong, H. TTG2-regulated development is related to expression of putative AUXIN RESPONSE FACTOR genes in tobacco. BMC Genomics 2013, 14. [Google Scholar] [CrossRef] [PubMed]
- Shu, S.; Chen, B.; Zhou, M.; Zhao, X.; Xia, H.; Wang, M. De novo sequencing and transcriptome analysis of Wolfiporia cocos to reveal genes related to biosynthesis of triterpenoids. PLoS ONE 2013, 8, e71350. [Google Scholar] [CrossRef] [PubMed]
- Krasileva, K.V.; Buffalo, V.; Bailey, P.; Pearce, S.; Ayling, S.; Tabbita, F.; Soria, M.; Wang, S.; Akhunov, E.; Uauy, C. Separating homeologs by phasing in the tetraploid wheat transcriptome. Genome Biol. 2013, 14, R66. [Google Scholar] [CrossRef] [PubMed]
- Schmieder, R.; Edwards, R. Fast identification and removal of sequence contamination from genomic and metagenomic datasets. PLoS ONE 2011, 6, e17288. [Google Scholar] [CrossRef] [PubMed]
- Korf, I.; Yandell, M.; Bedell, J. Blast; OʼReilly Media, Inc.: Sebastopol, CA, USA, 2003. [Google Scholar]
- Gotz, S.; Garcia-Gomez, J.M.; Terol, J.; Williams, T.D.; Nagaraj, S.H.; Nueda, M.J.; Robles, M.; Talon, M.; Dopazo, J.; Conesa, A. High-throughput functional annotation and data mining with the Blast2GO suite. Nucleic Acids Res. 2008, 36, 3420–3435. [Google Scholar] [CrossRef] [PubMed]
- Mortazavi, A.; Williams, B.A.; McCue, K.; Schaeffer, L.; Wold, B. Mapping and quantifying mammalian transcriptomes by RNA-Seq. Nat. Methods 2008, 5, 621–628. [Google Scholar] [CrossRef] [PubMed]
- Li, B.; Dewey, C. RSEM: Accurate transcript quantification from RNA-Seq data with or without a reference genome. BMC Bioinform. 2011, 12, 323. [Google Scholar] [CrossRef]
- Lv, J.; Liu, P.; Wang, Y.; Gao, B.; Chen, P.; Li, J. Transcriptome Analysis of Portunus trituberculatus in response to salinity stress Provides Insights into the Molecular Basis of Osmoregulation. PLoS ONE 2013, 8, e82155. [Google Scholar] [CrossRef] [PubMed]
- Zhang, X.; Zhao, L.; Larson-Rabin, Z.; Li, D.; Guo, Z. De novo sequencing and characterization of the floral transcriptome of Dendrocalamus latiflorus (Poaceae: Bambusoideae). PLoS ONE 2012, 7, e42082. [Google Scholar] [CrossRef] [PubMed]
- Mao, X.; Cai, T.; Olyarchuk, J.G.; Wei, L. Automated genome annotation and pathway identification using the KEGG Orthology (KO) as a controlled vocabulary. Bioinformatics 2005, 21, 3787–3793. [Google Scholar] [CrossRef] [PubMed]
- McGettigan, P.A. Transcriptomics in the RNA-seq era. Curr. Opin. Chem. Biol. 2013, 17, 4–11. [Google Scholar] [CrossRef] [PubMed]
© 2015 by the authors; licensee MDPI, Basel, Switzerland. This article is an open access article distributed under the terms and conditions of the Creative Commons Attribution license (http://creativecommons.org/licenses/by/4.0/).