
Bioinformatics Mining and Modeling Methods for the Identification of Disease Mechanisms in Neurodegenerative Disorders

 ,
, 
Abstract
:1. Introduction
2. Bioinformatics Methods for the Identification of Disease Mechanisms
2.1. Availability of Data for Mechanism Identification
2.2. The Gap between Genetics and Mechanisms of Disease
- The purely statistical approach of associating SNPs with disease (or better: syndromes, as they are likely to have multiple aetiologies) tends to ignore SNPs that play a role only in a small subgroup of patients. In complex diseases and in particular in neurodegenerative diseases, we have reasons to assume that such subgroups of patients exist [42]. If the dysregulation of several pathways together constitutes the disease phenotype, we may deal with several “rare” and “low effect size” SNPs that act in a cooperative fashion and jointly contribute to the aetiology of the disease. Hence, a population based statistical approach can therefore readily be expected to be associated with a fair amount of false negatives, i.e., SNPs escaping the analysis.
- Any functional impact assessment of intergenic SNPs, using an enrichment approach, requires a substantial number of examples of intergenic SNPs that have already been characterized. Such a “knowledge base” of intergenic SNPs characterized at the mechanistic level is currently not available, and one strategy to mitigate this gap is to develop algorithms predicting the functional impact of intergenic SNPs and other genetic variants [43].
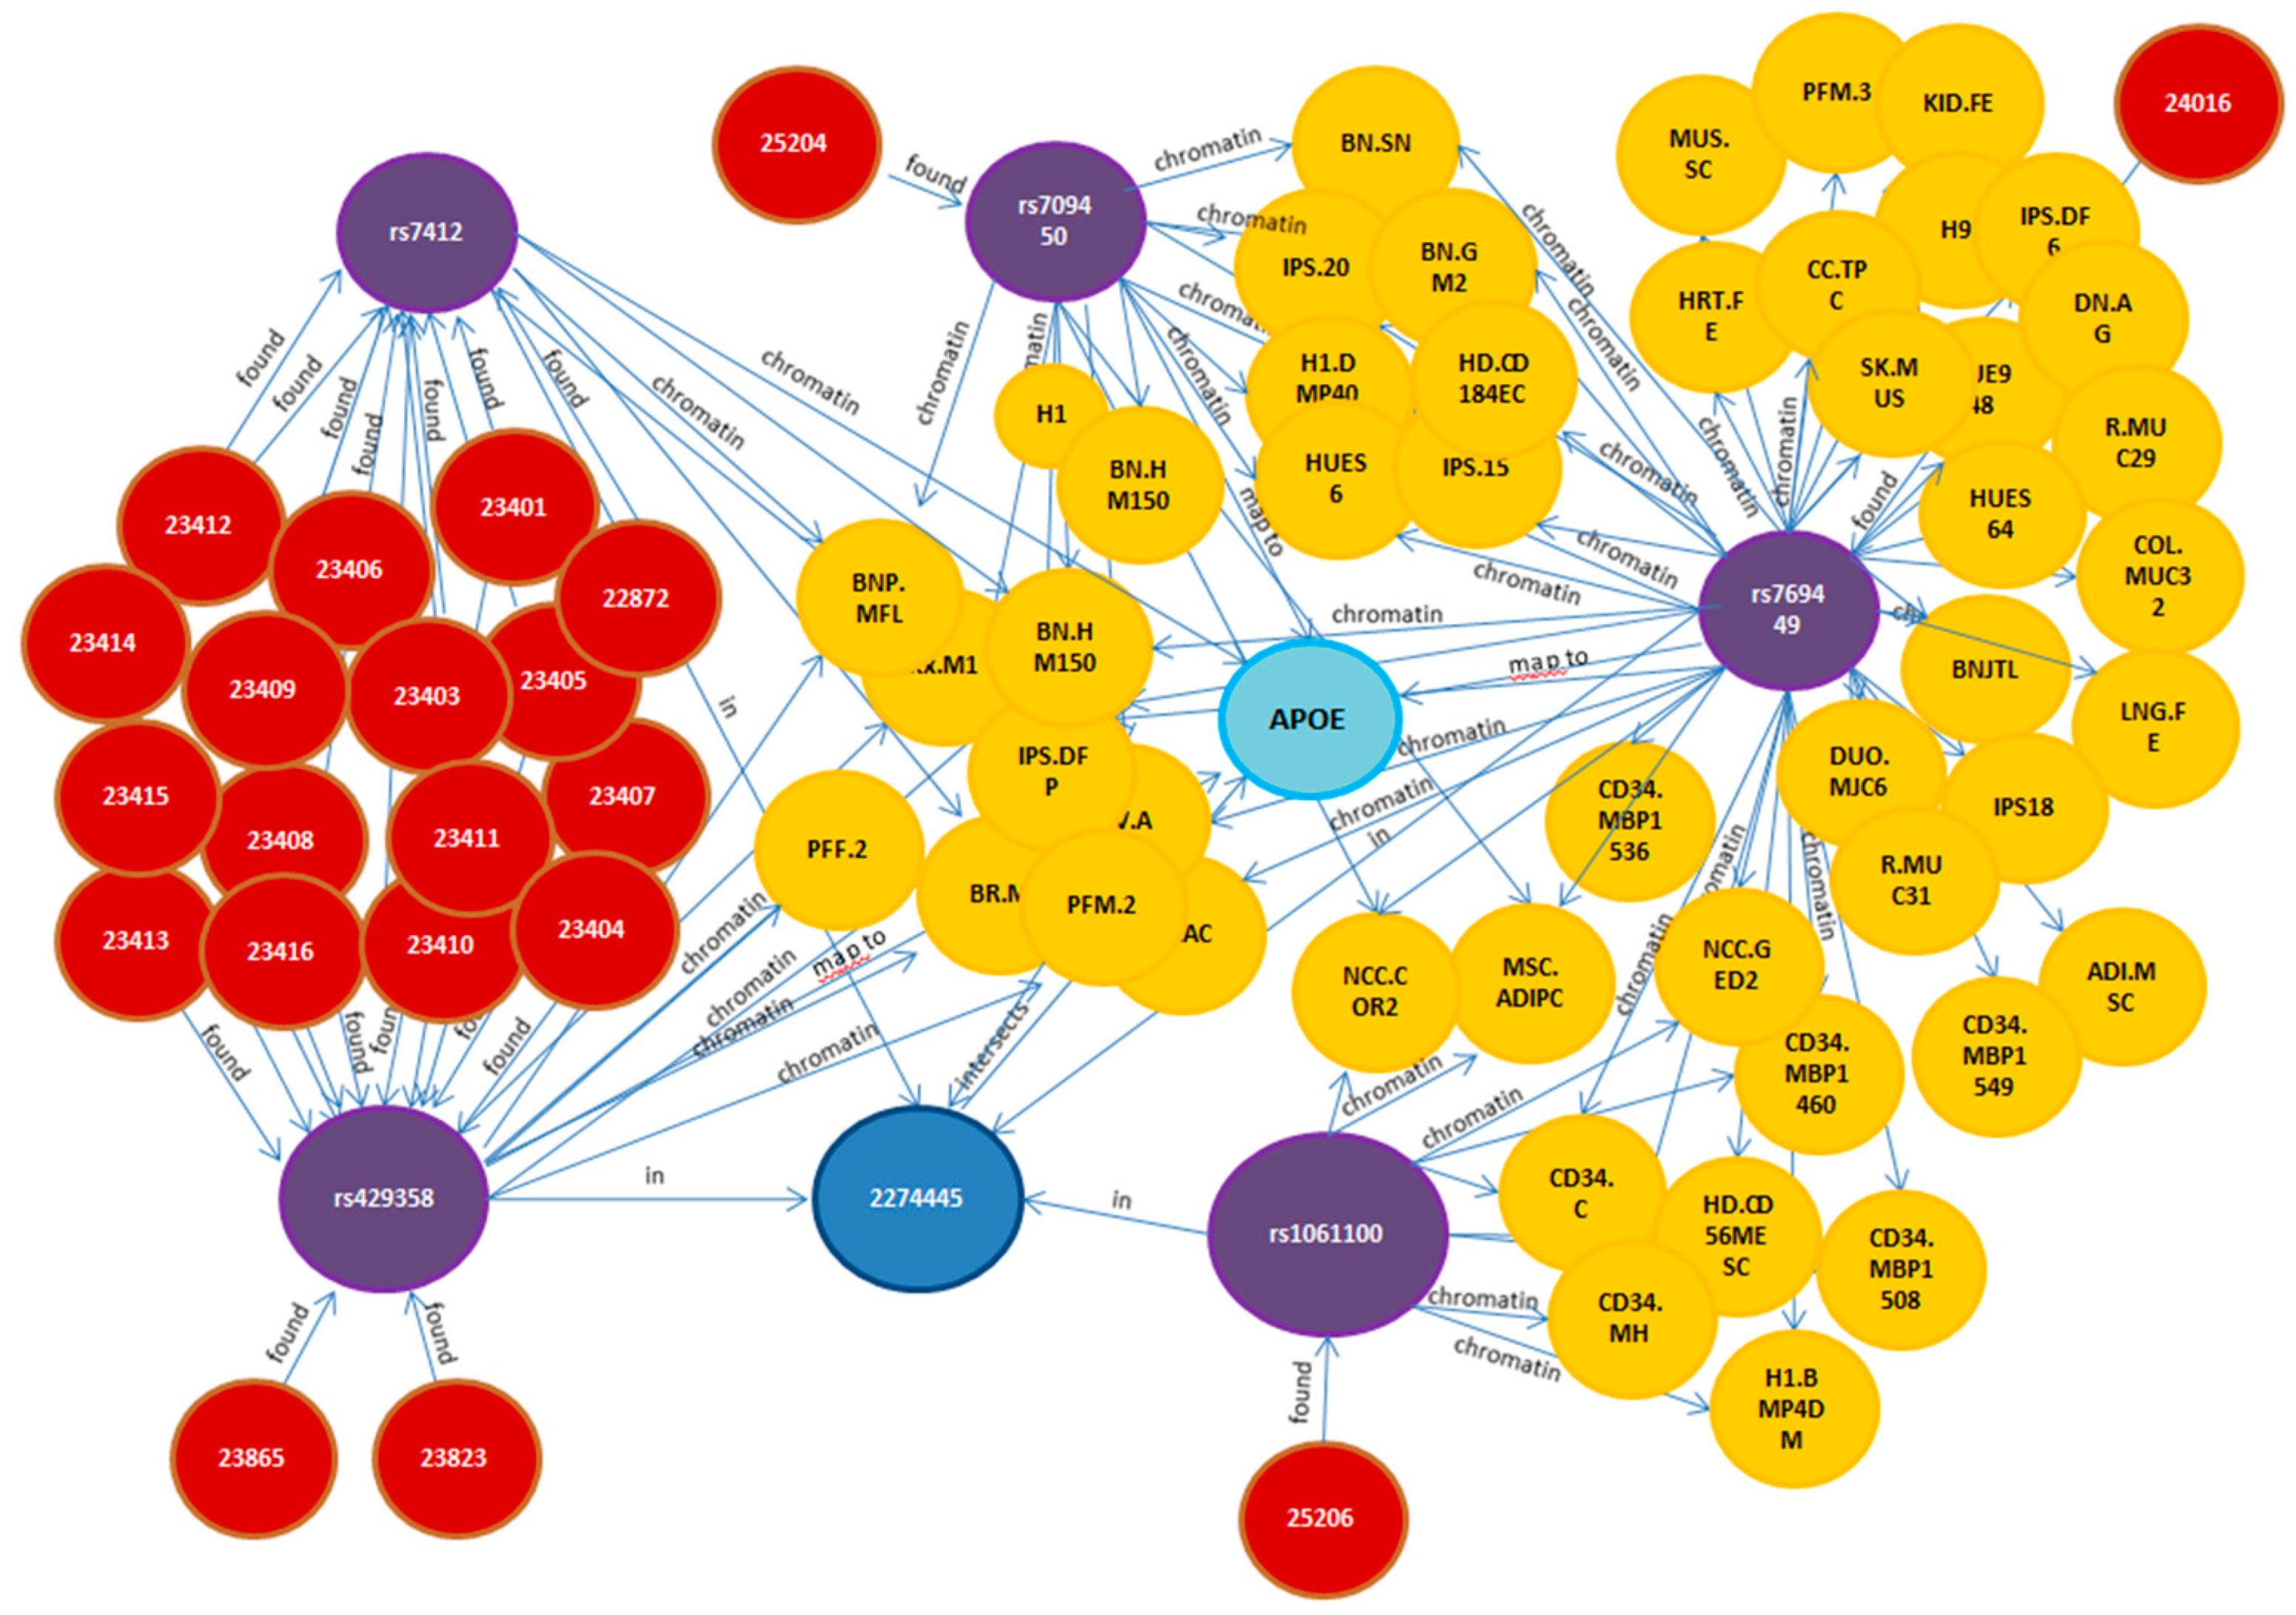
2.2.1. Strategies for Advancing beyond Individual SNPs towards Disease Mechanisms
2.2.2. Multi-Partite Graph Mining: Heat Diffusion Approach
2.3. Model-Driven Identification of Disease Mechanisms
2.3.1. Multiscale Cause-and-Effect Modeling and Mechanism Candidate Identification
- Model-Model Comparisons
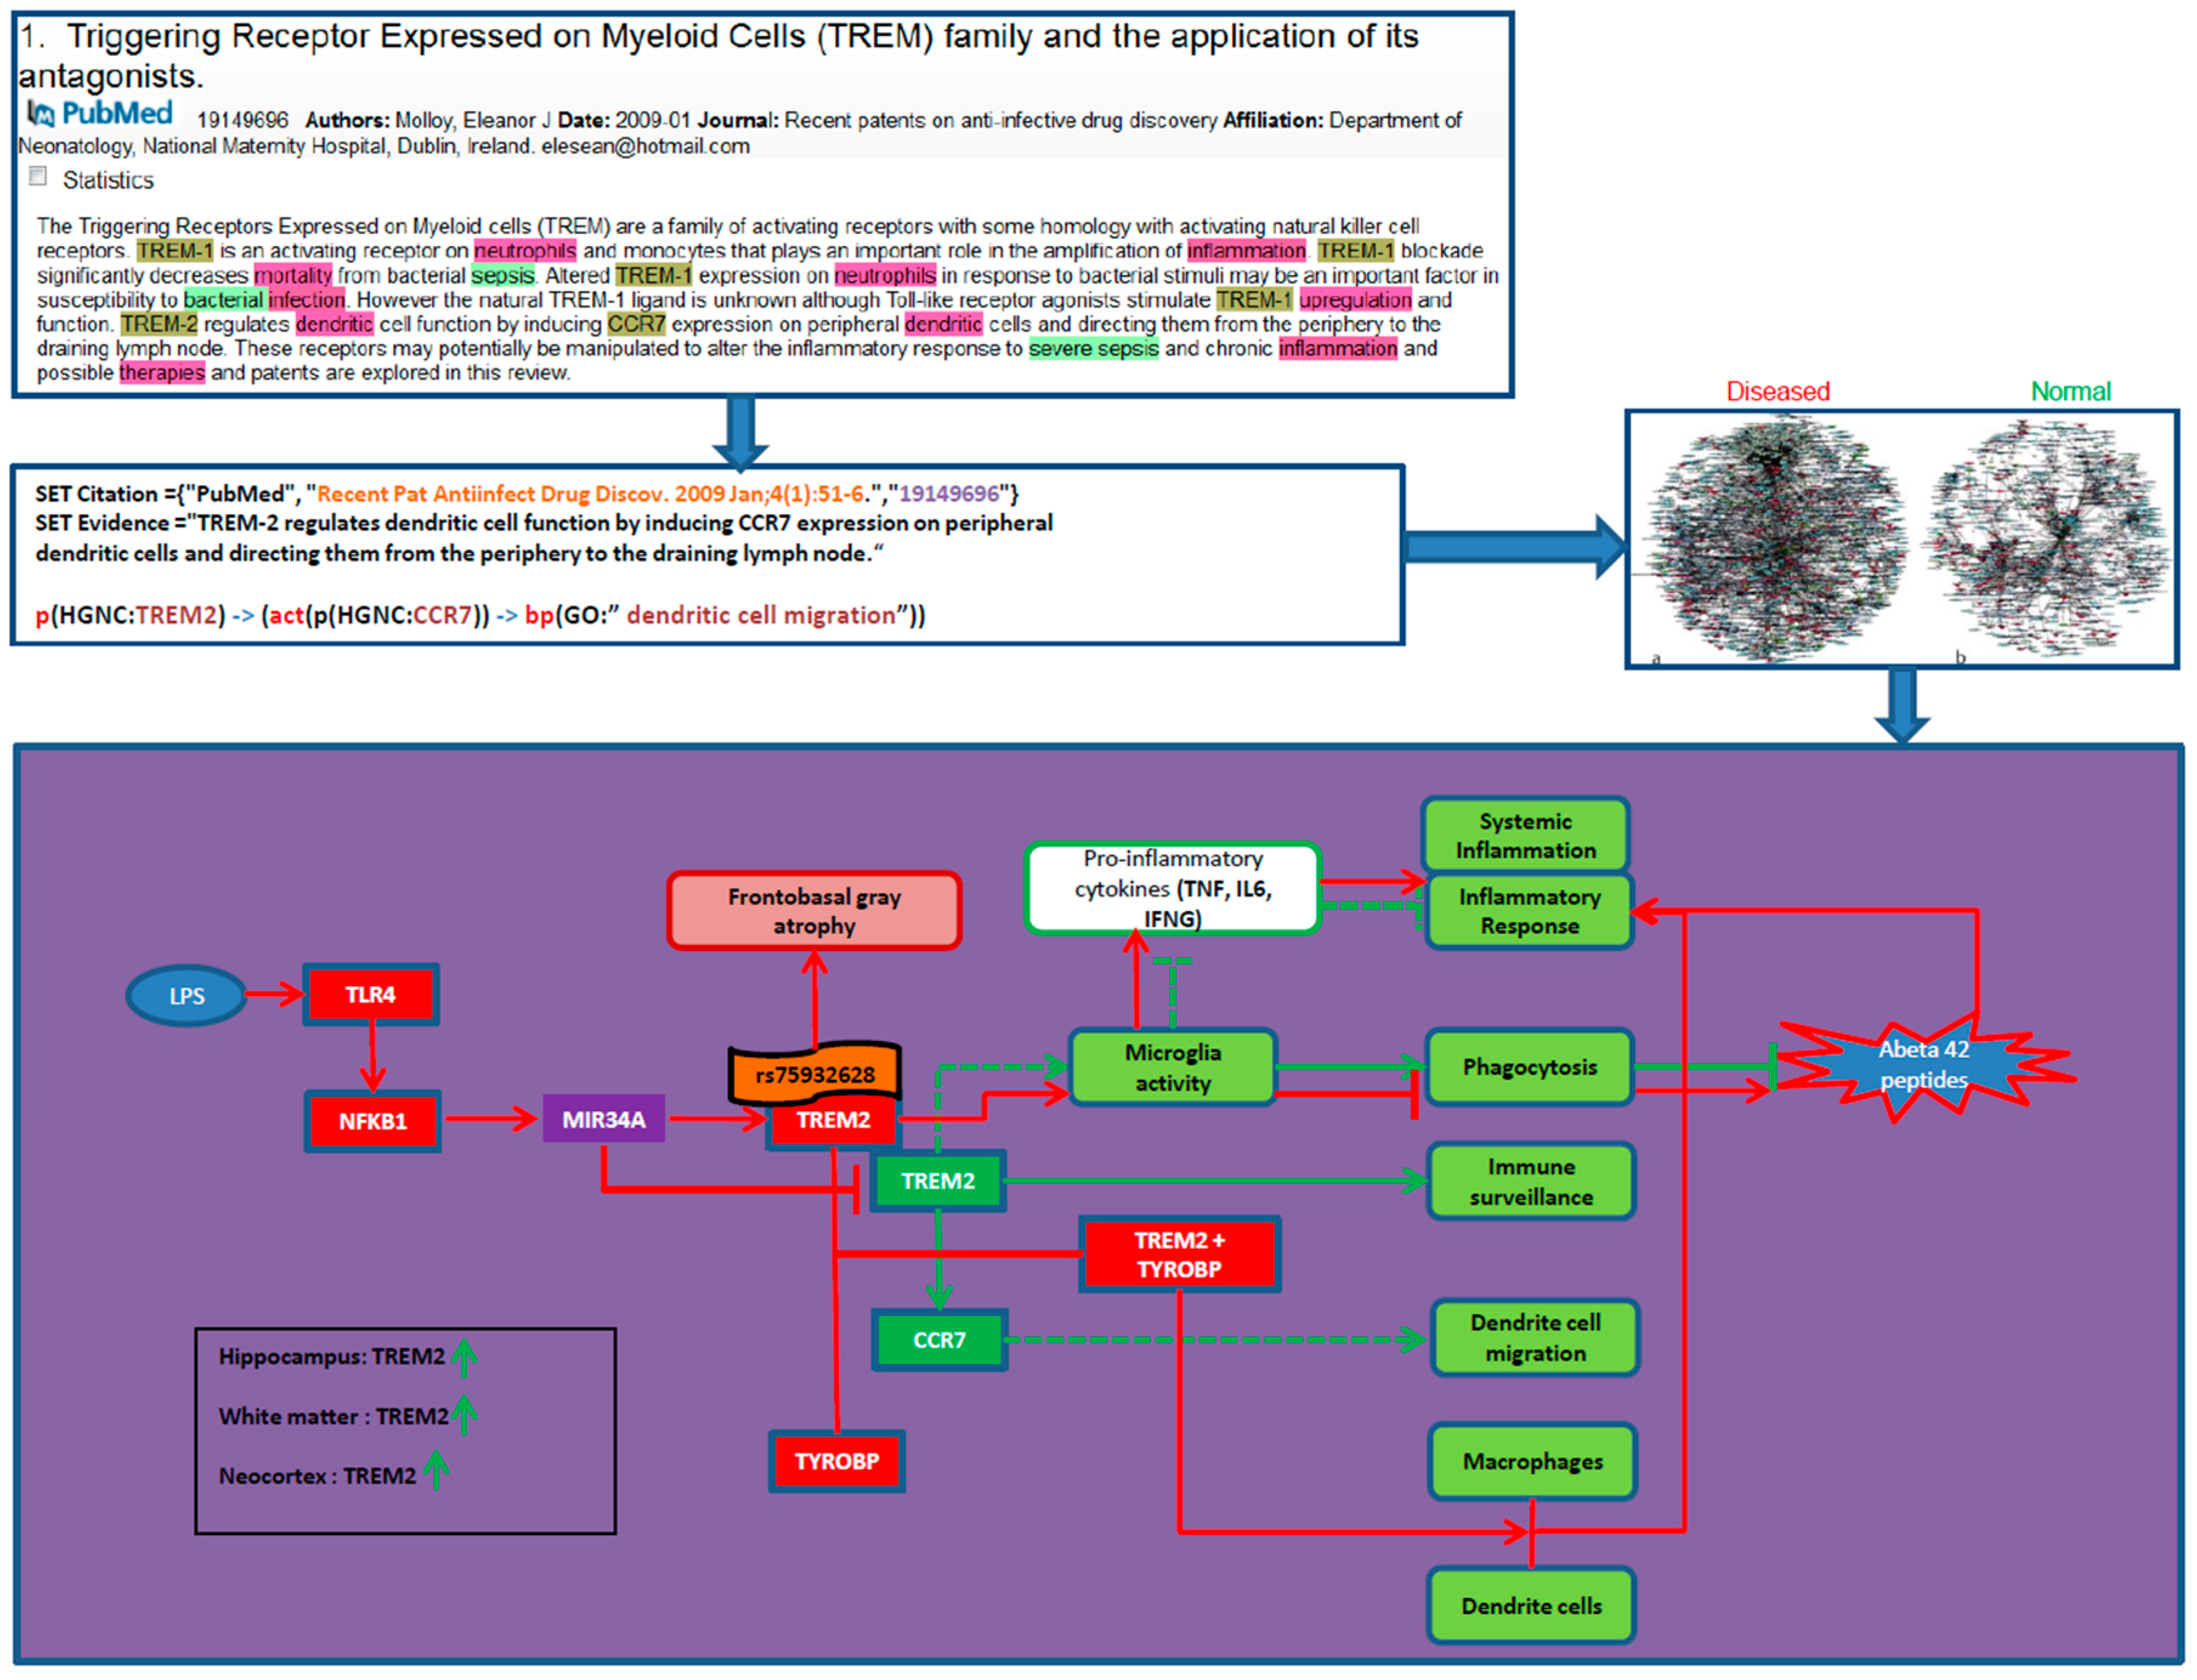
- Reverse Causal Reasoning
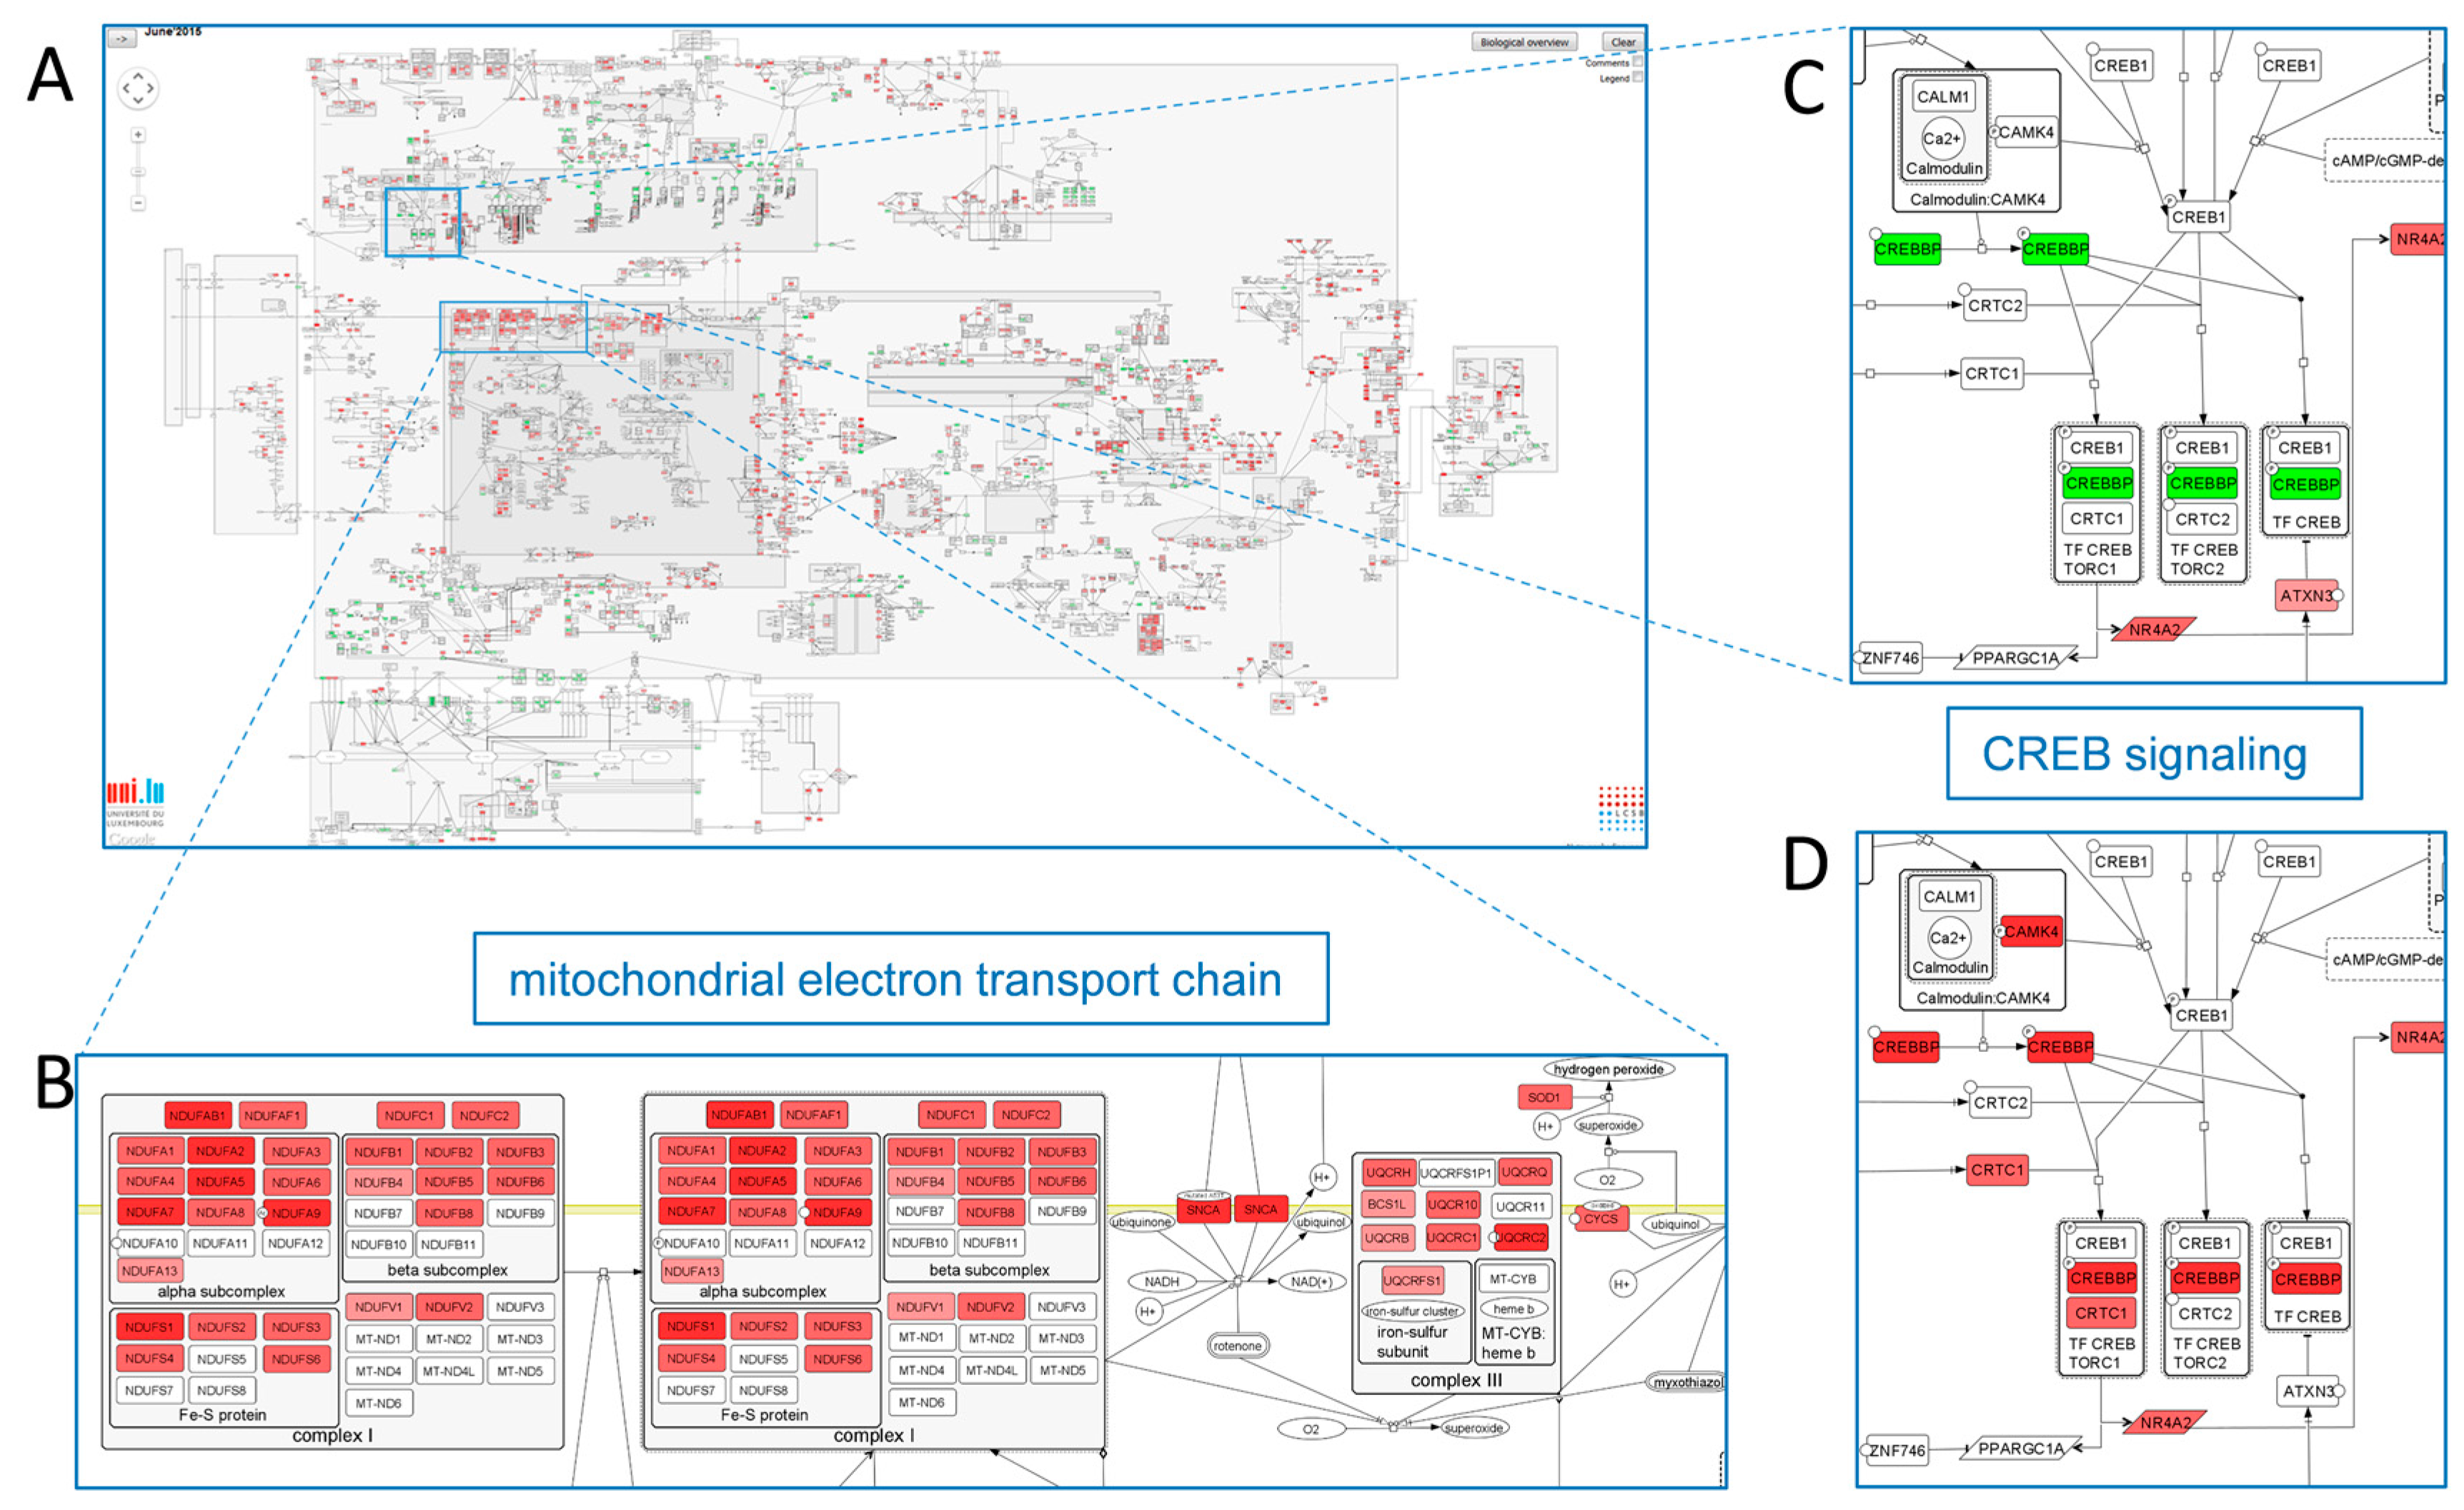
2.3.2. Mechanism-Identification through Data Overlays: The PD Map Approach
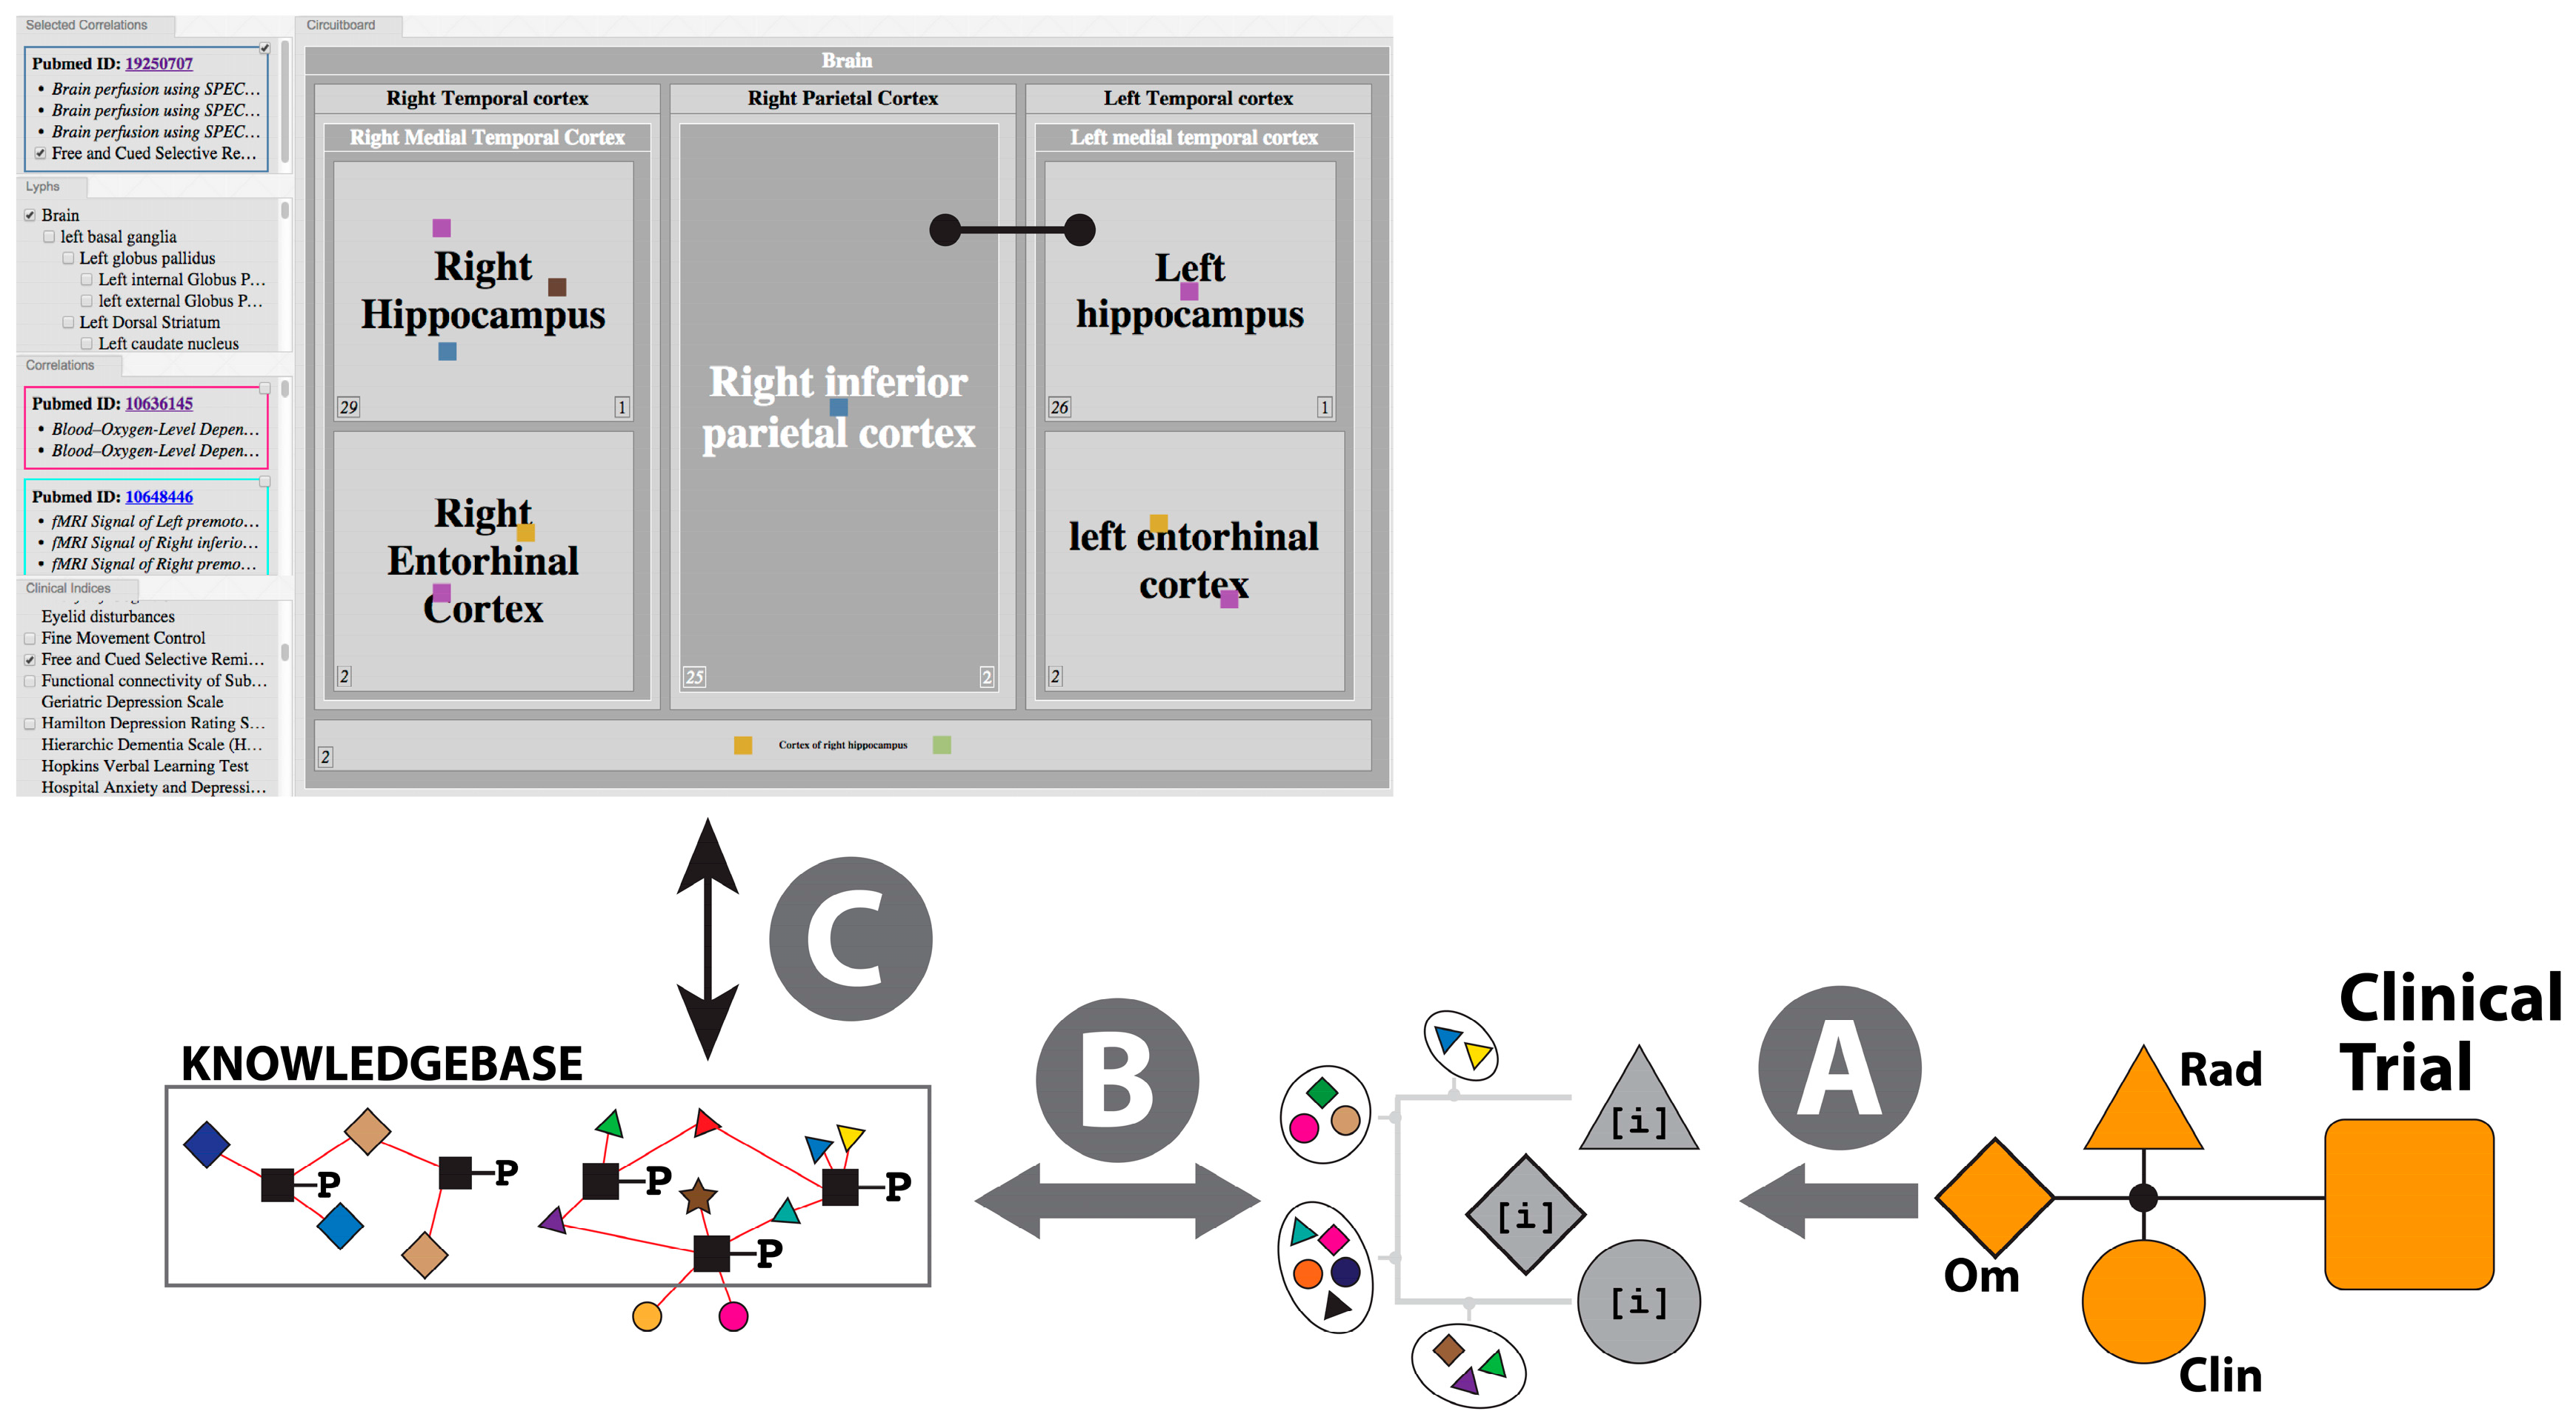
2.3.3. The Pathophysiology Graph: Representation of Multiscale Physiology Using ApiNATOMY
- (a)
- Map multi-modal measurements onto the same formal representation of brain multiscale location (i.e., anatomy)—in Neuro-Degenerative Diseases (NDD) the primary focus is on the anatomical integration of “Omics“-type measurements (e.g., gene expression) and radiology measurements (e.g., thicknesses of neocortical regions);
- (b)
- Organize knowledge about multiscale routes of interaction between different brain locations to objectively compare and contrast physiological and pathophysiological processes—in NDD, knowledge of such routes is critical to track flows of (i) fluid, at the basis of molecular interaction and pathological agent spread; as well as (ii) electrical spread, as the basis of neuropsychometric tests applied to monitor symptoms and signs of disease progress;
- (c)
- Coherently bridge neuropsychometric tests to the underlying neural substrate responsible for behavior observed in NDD patients—given that a specific pathology underlying NDD may express different spread patterns in different patient subgroups, neuropsychometric scores (e.g., memory recall tests) provide an important means to track such spread;
- (d)
- Take into account the lack of functional symmetry of brain anatomy, with particular reference to the asymmetry that typifies the involvement of brain structures in behavior and pathology.

- (i)
- Knowledge Curation: Clinical Scores
- (ii)
- Inferencing for Hypothesis Generation
- (a)
- A lateralized topological model, generated from the combination of human, monkey and rat connectivity data, is built to provide a weighted reference graph that represents brain regions (about 400 regions) and their pairwise connections (about 4000 connections);
- (b)
- The weighted graph in (a) provides the reference map for the application of a Steiner Minimal Tree (SMT) calculation [104,105] that finds parsimonious solutions of paths that link an arbitrary set of brain regions, such that preference is given to connectivity edges in this order: human, monkey, then rat. Given that the SMT problem is known to be NP-complete, we allow for the application of heuristics in the context of NDD calculations [106,107,108], where deemed appropriate—for instance, these heuristics also take into account expert knowledge about the likely direction of spread of NDD pathology from central, lower nuclei towards higher neocortical grey matter;
- (c)
- For each clinical correlation data point, the most parsimonious route (or set of top-scoring routes) linking the brain regions associated with the brain-derived measurements that correlate with the clinical scores is calculated as described in (b) above, to create the correlation reference route set (CRRS);
- (d)
- The calculation of a mechanistic hypothesis for NDD, then, takes as an input combinations of clinical scores and brain-derived measurements that have been clustered from clinical study datasets. The likelihood of mechanistic relevance of the route connecting brain regions (i) correlating with clinical scores; and (ii) from which measurements originate, is scored on the basis of the quantifiably-improved parsimony of (a) the de novo SMT solution for these brain regions compared to (b) the non-redundant graph merger of the independently-derived clinical-score-specific routes from the CRRS.
- (iii)
- Visualization
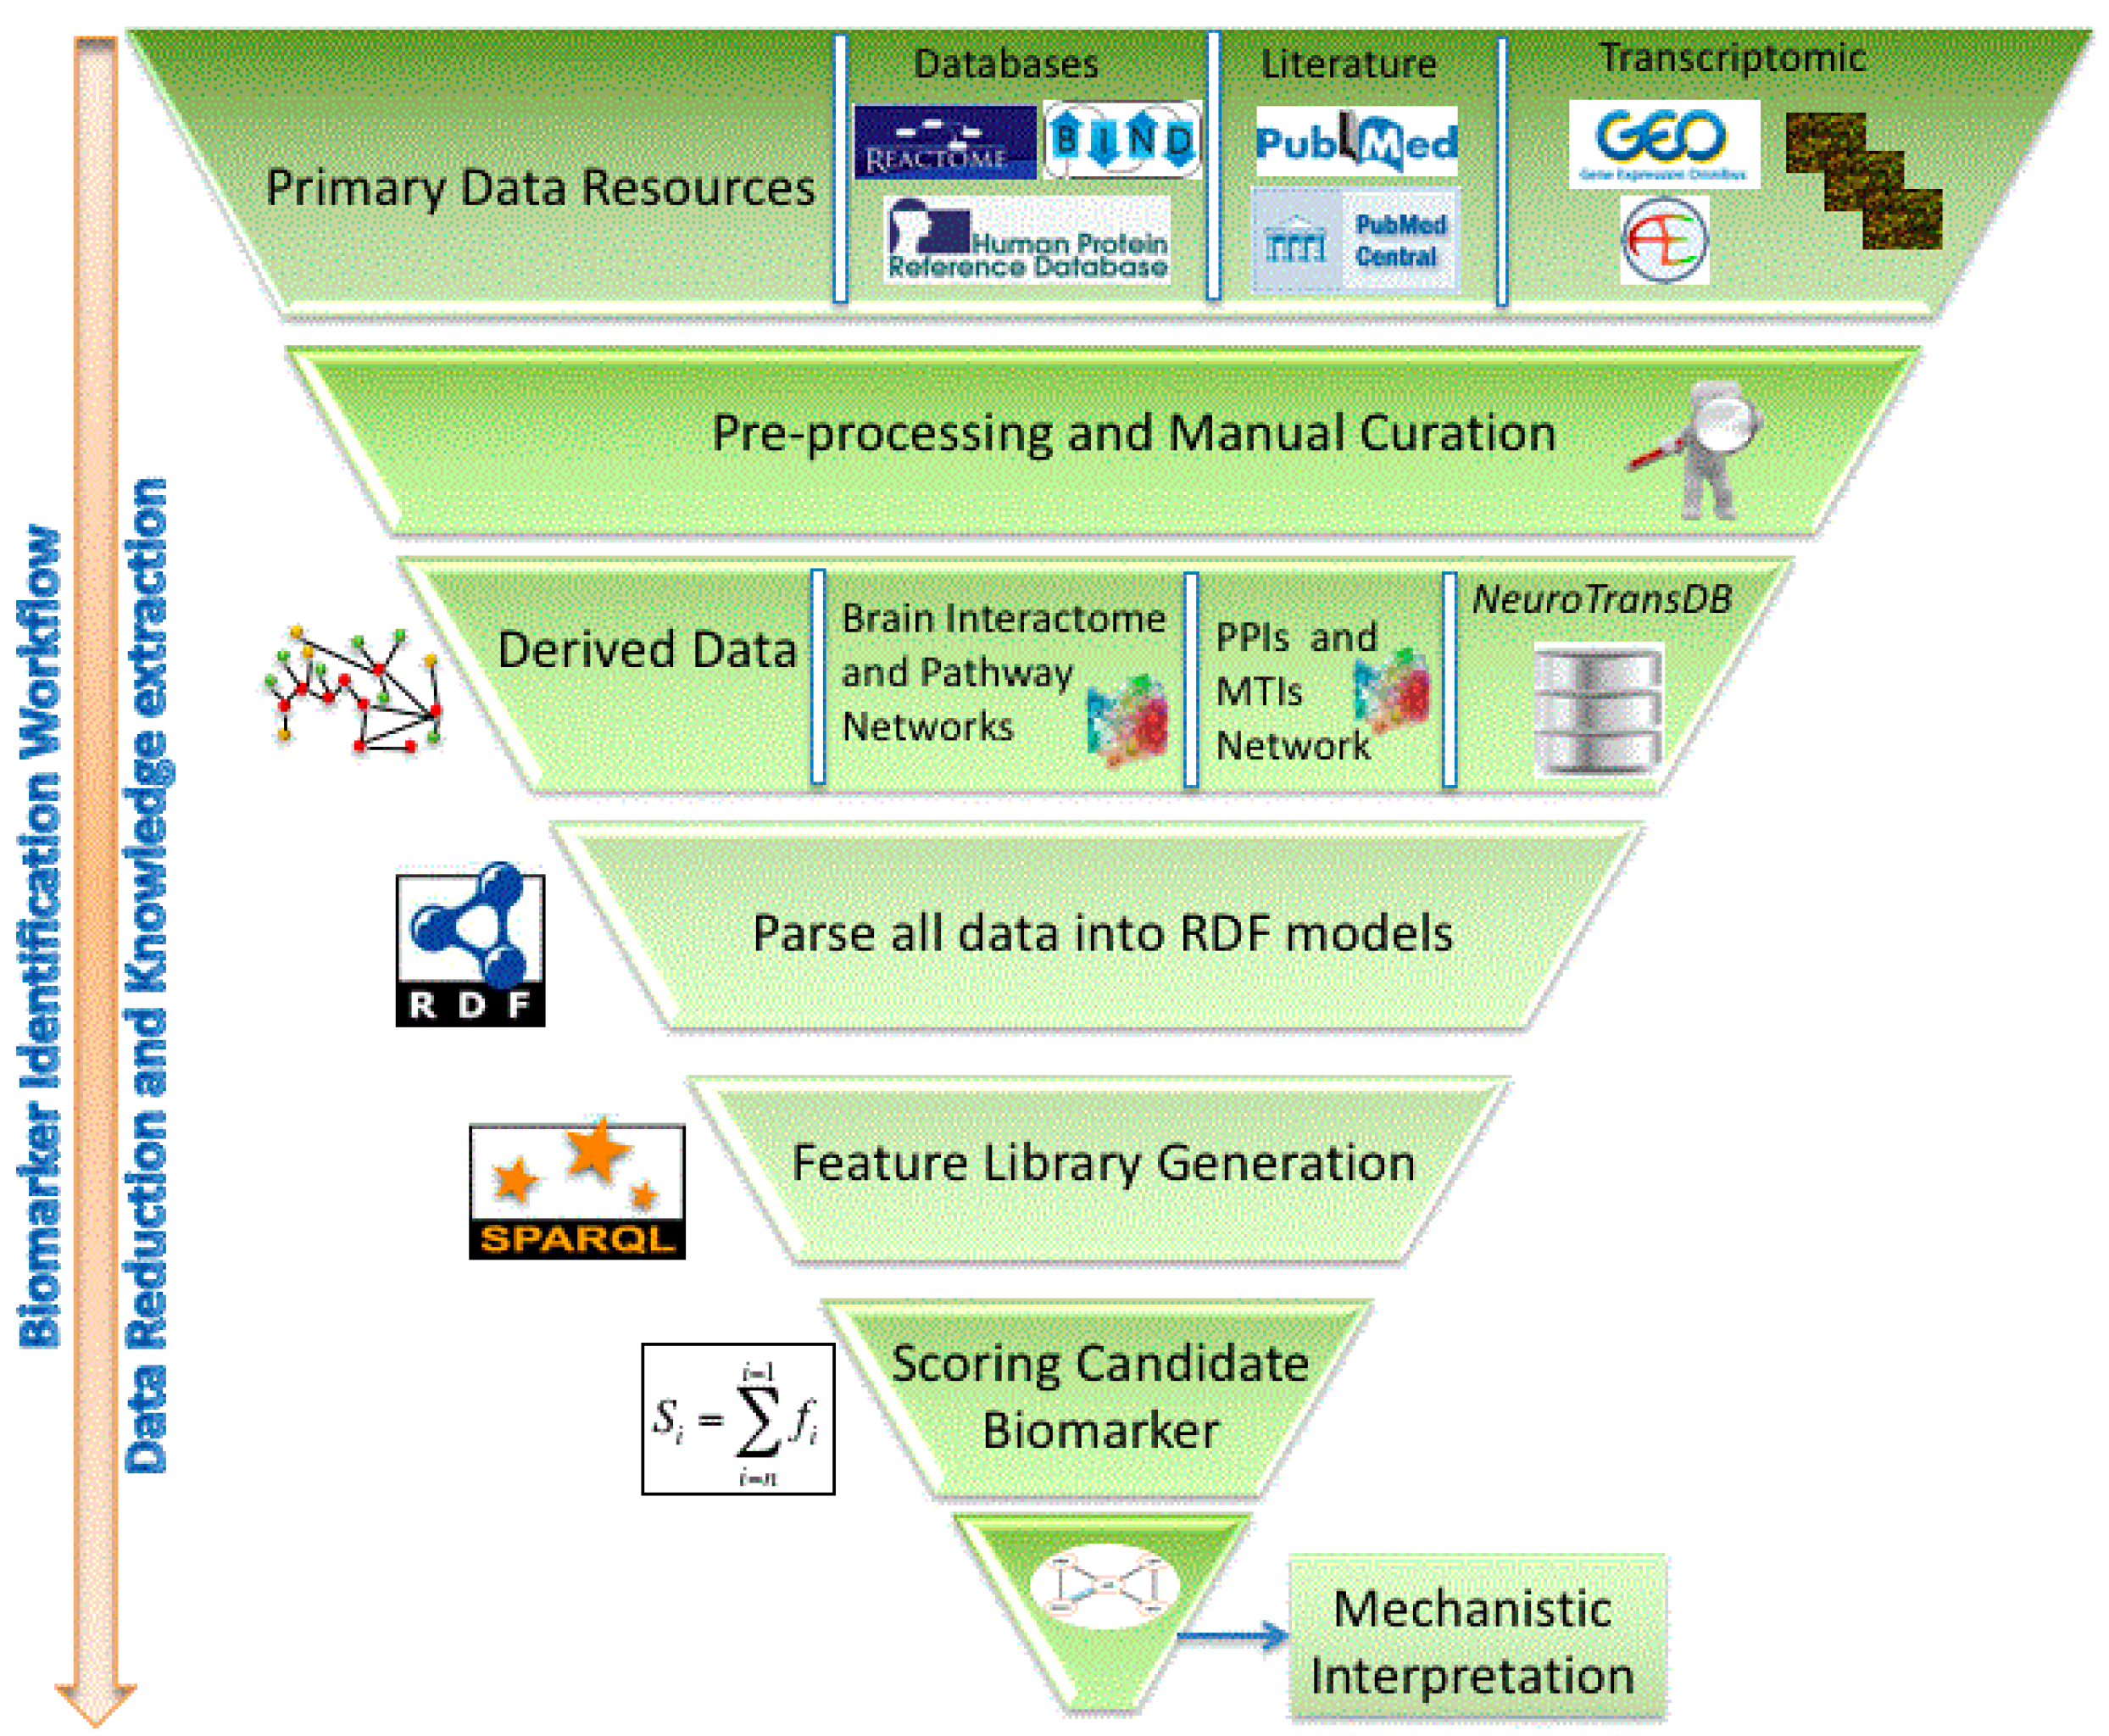
2.3.4. The AETIONOMY Knowledge Base—An Environment for Candidate Mechanism Identification
 represent BEL ans SBML models;
  represents the gene component of the model.
  represents the protein component.
represent BEL ans SBML models; represents the gene component of the model. represents the protein component.
represents the protein component.
represent BEL ans SBML models; represents the gene component of the model. represents the protein component.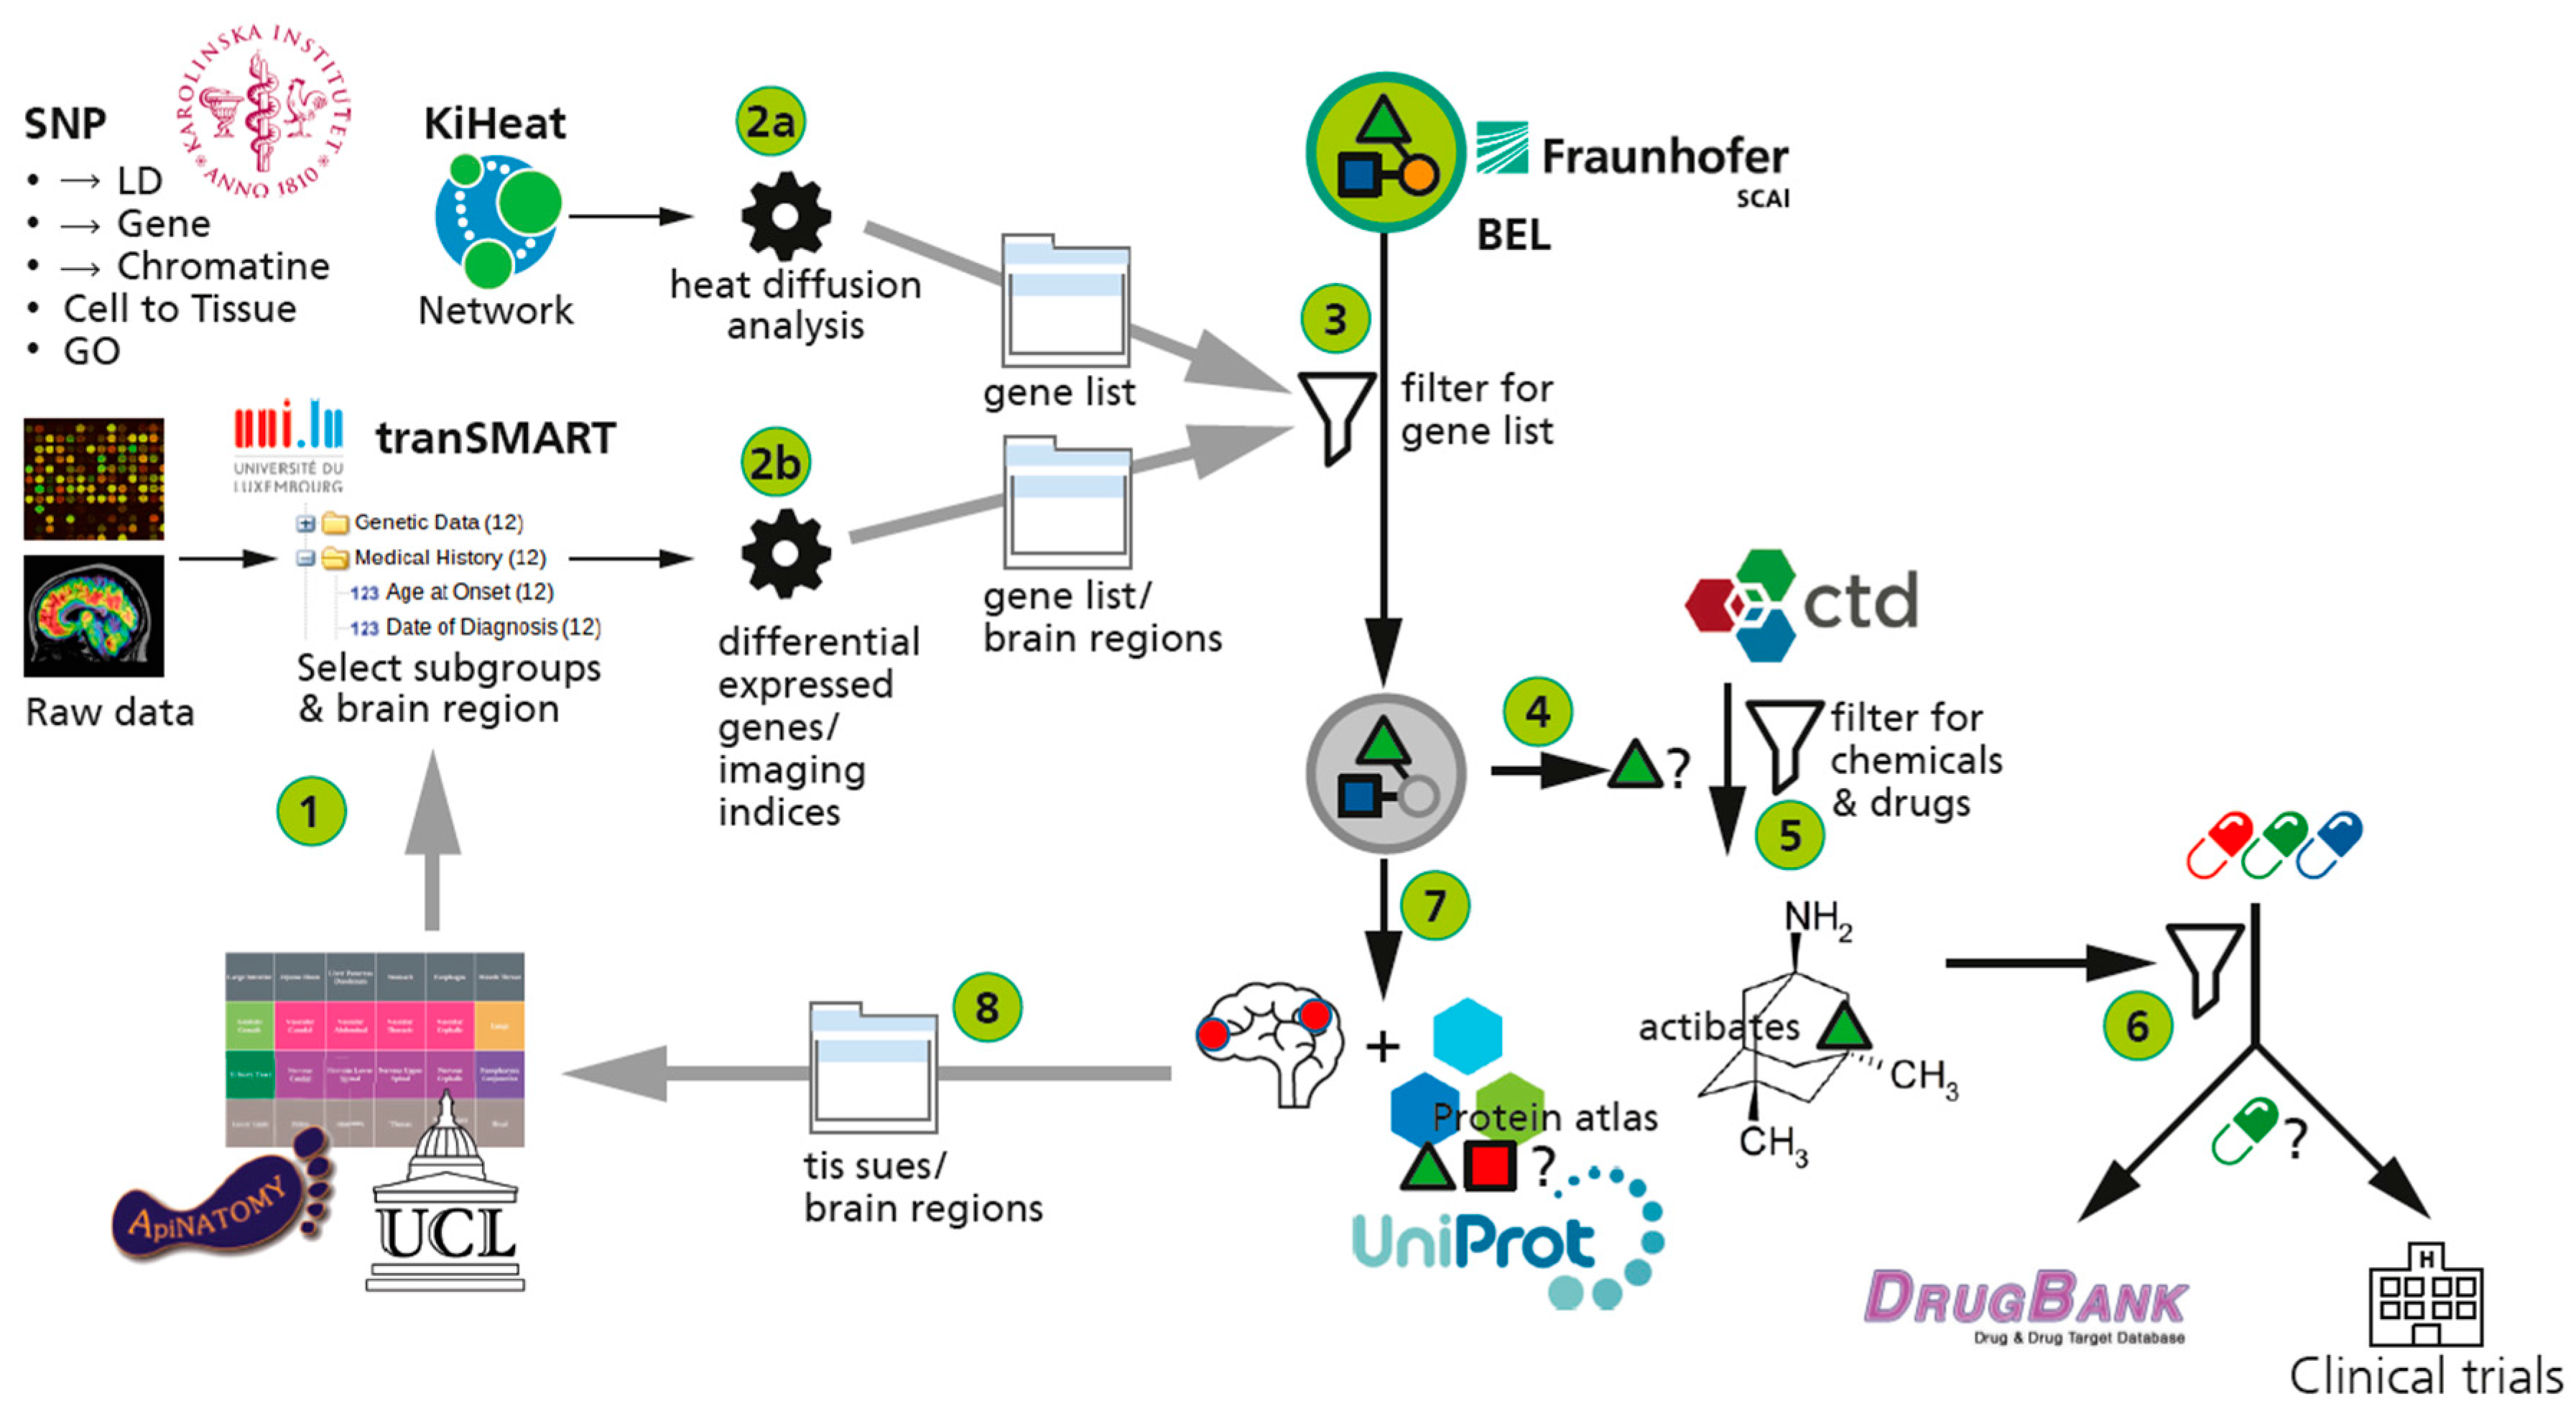
3. Conclusions
Acknowledgments
Author Contributions
Conflicts of Interest
References
- Gomez-Cabrero, D.; Abugessaisa, I.; Maier, D.; Teschendorff, A.; Merkenschlager, M.; Gisel, A.; Ballestar, E.; Bongcam-Rudloff, E.; Conesa, A.; Tegnér, J. Data integration in the era of omics: Current and future challenges. BMC Syst. Biol. 2014, 8, I1. [Google Scholar] [CrossRef] [PubMed]
- The Cancer Genome Atlas. Available online: http://cancergenome.nih.gov/ (accessed on 25 November 2015).
- Akbani, R.; Ng, P.K.S.; Werner, H.M.; Shahmoradgoli, M.; Zhang, F.; Ju, Z.; Liu, W.; Yang, J.-Y.; Yoshihara, K.; Li, J.; et al. A pan-cancer proteomic perspective on The Cancer Genome Atlas. Nat. Commun. 2014, 5, 3887. [Google Scholar] [CrossRef] [PubMed]
- Kandoth, C.; McLellan, M.D.; Vandin, F.; Ye, K.; Niu, B.; Lu, C.; Xie, M.C.; Zhang, Q.Y.; McMichael, J.F.; Wyczalkowski, M.A.; et al. Mutational landscape and significance across 12 major cancer types. Nature 2013, 502, 333–339. [Google Scholar] [CrossRef] [PubMed]
- Ma’ayan, A.; Rouillard, A.D.; Clark, N.R.; Wang, Z.; Duan, Q.; Kou, Y. Lean Big Data integration in systems biology and systems pharmacology. Trends Pharmacol. Sci. 2014, 35, 450–460. [Google Scholar] [CrossRef] [PubMed]
- Sanchez-Garcia, F.; Villagrasa, P.; Matsui, J.; Kotliar, D.; Castro, V.; Akavia, U.D.; Chen, B.J.; Saucedo-Cuevas, L.; Rodriguez Barrueco, R.; Llobet-Navas, D.; et al. Integration of genomic data enables selective discovery of breast cancer drivers. Cell 2014, 159, 1461–1475. [Google Scholar]
- Schadt, E.E. Molecular networks as sensors and drivers of common human diseases. Nature 2009, 461, 218–223. [Google Scholar] [CrossRef] [PubMed]
- Civelek, M.; Lusis, A.J. Systems genetics approaches to understand complex traits. Nat. Rev. Genet. 2014, 15, 34–48. [Google Scholar] [CrossRef] [PubMed]
- Tegnér, J.N.; Compte, A.; Auffray, C.; An, G.; Cedersund, G.; Clermont, G.; Gutkin, B.; Oltvai, Z.N.; Stephan, K.E.; Thomas, R.; et al. Computational disease modelling—Fact or fiction? BMC Syst. Biol. 2009, 3, 56. [Google Scholar] [CrossRef] [PubMed]
- Bateman, R.J.; Xiong, C.; Benzinger, T.L.; Fagan, A.M.; Goate, A.; Fox, N.C.; Marcus, D.S.; Cairns, N.J.; Xie, X.Y.; Blazey, T.M. Clinical and biomarker changes in dominantly inherited Alzheimer’s disease. N. Engl. J. Med. 2012, 367, 795–804. [Google Scholar] [CrossRef] [PubMed]
- Warren, J.D.; Fletcher, P.D.; Golden, H.L. The paradox of syndromic diversity in Alzheimer disease. Nat. Rev. Neurol. 2012, 8, 451–464. [Google Scholar] [CrossRef] [PubMed]
- Tanzi, R.E. The genetics of Alzheimer disease. Cold Spring Harb. Perspect. Med. 2012, 2, a006296. [Google Scholar] [CrossRef] [PubMed]
- Corti, O.; Lesage, S.; Brice, A. What genetics tells us about the causes and mechanisms of Parkinson’s disease. Physiol. Rev. 2011, 91, 1161–1218. [Google Scholar] [CrossRef] [PubMed]
- Heneka, M.T.; Kummer, M.P.; Latz, E. Innate immune activation in neurodegenerative disease. Nat. Rev. Immunol. 2014, 14, 463–477. [Google Scholar] [CrossRef] [PubMed]
- Soto, C. Protein misfolding in neurodegenerative diseases: The key pending questions. J. Neurol. Transl. Neurosci. 2004, 30, 215–224. [Google Scholar]
- Huang, Y.; Mucke, L. Alzheimer mechanisms and therapeutic strategies. Cell 2012, 148, 1204–1222. [Google Scholar] [CrossRef] [PubMed]
- Skaper, S.D.; Facci, L.; Giusti, P. Neuroinflammation, Microglia and Mast Cells in the Pathophysiology of Neurocognitive Disorders: A Review. CNS Neurol. Disord. Drug Targets 2014, 13, 1654–1666. [Google Scholar] [CrossRef] [PubMed]
- Zlokovic, B.V. Neurovascular pathways to neurodegeneration in Alzheimer’s disease and other disorders. Nat. Rev. Neurosci. 2011, 12, 723–738. [Google Scholar] [CrossRef] [PubMed]
- Graf, N.; Hunter, P.; Kohl, P.; Tegner, J.; Viceconti, M. The virtual physiological human: Integrative approaches to computational biomedicine. Interface Focus 2013, 3, 20130003. [Google Scholar]
- Biomarkers Definitions Working Group. Biomarkers and surrogate endpoints: Preferred definitions and conceptual framework. Clin. Pharmacol. Ther. 2001, 69, 89–95. [Google Scholar]
- Nilsson, R.; Peña, J.M.; Björkegren, J.; Tegnér, J. Consistent feature selection for pattern recognition in polynomial time. J. Mach. Learn. Res. 2007, 8, 589–612. [Google Scholar]
- Ginsberg, J.; Mohebbi, M.H.; Patel, R.S.; Brammer, L.; Smolinski, M.S.; Brilliant, L. Detecting influenza epidemics using search engine query data. Nature 2009, 457, 1012–1014. [Google Scholar] [CrossRef] [PubMed]
- Dutkowski, J.; Ideker, T. Protein networks as logic functions in development and cancer. PLoS Comput. Biol. 2011, 7, e1002180. [Google Scholar] [CrossRef] [PubMed]
- Hartwell, L.H.; Hopfield, J.J.; Leibler, S.; Murray, A.W. From molecular to modular cell biology. Nature 1999, 402, C47–C52. [Google Scholar] [CrossRef] [PubMed]
- Opgen-Rhein, R.; Strimmer, K. From correlation to causation networks: A simple approximate learning algorithm and its application to high-dimensional plant gene expression data. BMC Syst. Biol. 2007, 1, 37. [Google Scholar] [CrossRef] [PubMed]
- Bertram, L.; Tanzi, R. Genetics of Alzheimer’s disease. Neurodegeneration 2011, 51–91. [Google Scholar] [CrossRef]
- Mayeux, R.; Stern, Y. Epidemiology of Alzheimer disease. Cold Spring Harbor Perspect. Med. 2012, 2, a006239. [Google Scholar] [CrossRef] [PubMed]
- Licastro, F.; Carbone, I.; Raschi, E.; Porcellini, E. The 21st century epidemic: Infections as inductors of neuro-degeneration associated with Alzheimer’s Disease. Immun. Aging 2014, 11, 22. [Google Scholar] [CrossRef] [PubMed]
- Hill, J.M.; Clement, C.; Pogue, A.I.; Bhattacharjee, S.; Zhao, Y.; Lukiw, W.J. Pathogenic microbes, the microbiome, and Alzheimer’s disease (AD). Front. Aging Neurosci. 2014, 6, 127. [Google Scholar] [CrossRef] [PubMed]
- Raschka, T. Systematic Analysis of Alzheimer´s Disease Co-Expression Networks from Public Transcriptomic Studies. Master’s Thesis, University of Applied Sciences Koblenz, Remagen, Germany, 15 December 2015. [Google Scholar]
- Mueller, S.G.; Weiner, M.W.; Thal, L.J.; Petersen, R.C.; Jack, C.R.; Jagust, W.; Trojanowski, J.Q.; Toga, A.W.; Beckett, L. Ways toward an early diagnosis in Alzheimer’s disease: The Alzheimer’s Disease Neuroimaging Initiative (ADNI). Alzheimer Dement. 2005, 1, 55–66. [Google Scholar] [CrossRef] [PubMed]
- Saykin, A.J.; Shen, L.; Yao, X.; Kim, S.; Nho, K.; Risacher, S.L.; Ramanan, V.K.; Foroud, T.M.; Faber, K.M.; Sarwar, N.; et al. Alzheimer’s Disease Neuroimaging Initiative. Genetic studies of quantitative MCI and AD phenotypes in ADNI: Progress, opportunities, and plans. Alzheimer Dement. 2015, 11, 792–814. [Google Scholar] [CrossRef] [PubMed]
- Thompson, P.M.; Stein, J.L.; Medland, S.E.; Hibar, D.P.; Vasquez, A.A.; Renteria, M.E.; Toro, R.; Jahanshad, N.; Schumann, G.; Franke, B.; et al. The ENIGMA Consortium: Large-scale collaborative analyses of neuroimaging and genetic data. Brain Imaging Behav. 2014, 8, 153–182. [Google Scholar] [PubMed]
- TCGA Data Portal Overview. Available online: https://tcga-data.nci.nih.gov/tcga/ (accessed on 25 September 2015).
- Kitada, T.; Asakawa, S.; Hattori, N.; Matsumine, H.; Yamamura, Y.; Minoshima, S.; Yokochi, M.; Mizuno, Y.; Shimizu, N. Mutations in the parkin gene cause autosomal recessive juvenile parkinsonism. Nature 1998, 392, 605–608. [Google Scholar] [PubMed]
- Karch, C.M.; Goate, A.M. Alzheimer’s disease risk genes and mechanisms of disease pathogenesis. Biol. Psychiatr. 2015, 77, 43–51. [Google Scholar] [CrossRef] [PubMed]
- Bertram, L. Alzheimer’s genetics in the GWAS era: A continuing story of “replications and refutations”. Curr. Neurol. Neurosci. Rep. 2011, 11, 246–253. [Google Scholar] [CrossRef] [PubMed]
- Hou, L.; Zhao, H. A review of post-GWAS prioritization approaches. Front. Genet. 2013, 4, 280. [Google Scholar] [CrossRef] [PubMed]
- Lambert, J.C.; Ibrahim-Verbaas, C.A.; Harold, D.; Naj, A.C.; Sims, R.; Bellenguez, C.; Jun, G.; DeStefano, A.L.; Bis, J.C.; Beecham, G.W.; et al. Meta-analysis of 74,046 individuals identifies 11 new susceptibility loci for Alzheimer’s disease. Nat. Genet. 2013, 45, 1452–1458. [Google Scholar] [CrossRef] [PubMed]
- Li, M.J.; Yan, B.; Sham, P.C.; Wang, J. Exploring the function of genetic variants in the non-coding genomic regions: Approaches for identifying human regulatory variants affecting gene expression. Brief. Bioinf. 2014, bbu018. [Google Scholar] [CrossRef] [PubMed]
- Naz, M.; Hofmann-Apitius, M. Reasoning over genetic variance information in cause-and-effect models of neurodegenerative diseases. Brief. Bioinf. 2015, bbv063. [Google Scholar] [CrossRef] [PubMed]
- Bettens, K.; Sleegers, K.; van Broeckhoven, C. Genetic insights in Alzheimer’s disease. Lancet Neurol. 2013, 12, 92–104. [Google Scholar] [CrossRef]
- Naz, M.; Younesi, E.; Hofmann-Apitius, M. Enhanced functional interpretation of SNPs associated with neurological disorders. in preparation. 2015. [Google Scholar]
- Ritchie, M.D.; Holzinger, E.R.; Li, R.; Pendergrass, S.A.; Kim, D. Methods of integrating data to uncover genotype-phenotype interactions. Nat. Rev. Genet. 2015, 16, 85–97. [Google Scholar] [CrossRef] [PubMed]
- NHGRI—A Catalog of Published Genome-Wide Association Studies. Available online: http://www.genome.gov/gwasstudies (accessed on 25 November 2015).
- Ward, L.D.; Kellis, M. HaploReg: A resource for exploring chromatin states, conservation, and regulatory motif alterations within sets of genetically linked variants. Nucleic Acids Res. 2012, 40, D930–D934. [Google Scholar] [CrossRef] [PubMed]
- Bernstein, B.E.; Stamatoyannopoulos, J.A.; Costello, J.F.; Ren, B.; Milosavljevic, A.; Meissner, A.; Kellis, M.; Marra, M.A.; Beaudet, A.L.; Ecker, J.R.; et al. The NIH roadmap epigenomics mapping consortium. Nat. Biotechnol. 2010, 28, 1045–1048. [Google Scholar] [CrossRef] [PubMed]
- Ernst, J.; Kheradpour, P.; Mikkelsen, T.S.; Shoresh, N.; Ward, L.D.; Epstein, C.B.; Zhang, X.; Wang, L.; Issner, R.; Coyne, M.; et al. Mapping and analysis of chromatin state dynamics in nine human cell types. Nature 2011, 473, 43–49. [Google Scholar] [CrossRef] [PubMed]
- Subramanian, A.; Tamayo, P.; Mootha, V.K.; Mukherjee, S.; Ebert, B.L.; Gillette, M.A.; Paulovich, A.; Pomeroy, S.L.; Golub, T.R.; Lander, E.S.; et al. Gene set enrichment analysis: A knowledge-based approach for interpreting genome-wide expression profiles. Proc. Natl. Acad. Sci. USA 2005, 102, 15545–15550. [Google Scholar] [CrossRef] [PubMed]
- Sutcliffe, J.G.; Hedlund, P.B.; Thomas, E.A.; Bloom, F.E.; Hilbush, B.S. Peripheral reduction of β-amyloid is sufficient to reduce brain β-amyloid: Implications for Alzheimer’s disease. J. Neurosci. Res. 2011, 89, 808–814. [Google Scholar] [CrossRef] [PubMed]
- Moreira, P.I.; Carvalho, C.; Zhu, X.; Smith, M.A.; Perry, G. Mitochondrial dysfunction is a trigger of Alzheimer’s disease pathophysiology. Biochim. Biophys. Acta Mol. Basis Dis. 2010, 1802, 2–10. [Google Scholar] [CrossRef] [PubMed]
- Gottschalk, W.K.; Lutz, M.W.; He, Y.T.; Saunders, A.M.; Burns, D.K.; Roses, A.D.; Chiba-Falek, O. The broad impact of TOM40 on neurodegenerative diseases in aging. J. Parkinsons Dis. Alzheimers Dis. 2014, 1, 12. [Google Scholar] [CrossRef] [PubMed]
- Vandin, F.; Upfal, E.; Raphael, B.J. Algorithms for detecting significantly mutated pathways in cancer. J. Comput. Biol. 2011, 18, 507–522. [Google Scholar] [CrossRef] [PubMed]
- Leiserson, M.D.; Vandin, F.; Wu, H.T.; Dobson, J.R.; Eldridge, J.V.; Thomas, J.L.; Papoutsaki, A.; Kim, Y.; Niu, B.; McLellan, M.; et al. Pan-cancer network analysis identifies combinations of rare somatic mutations across pathways and protein complexes. Nat. Genet. 2015, 47, 106–114. [Google Scholar] [CrossRef] [PubMed]
- Kola, I.; Bell, J. A call to reform the taxonomy of human disease. Nat. Rev. Drug Discov. 2011, 10, 641–642. [Google Scholar] [CrossRef] [PubMed]
- Moriyama, I.M.; Loy, R.M.; Robb-Smith, A.H.T. History of the Statistical Classification of Diseases and Causes of Death. Available online: http://www.cdc.gov/nchs/data/misc/classification_diseases2011.pdf (accessed on 25 November 2015).
- International Classification of Diseases (ICD). Available online: http://www.who.int/classifications/icd/en/ (accessed on 25 November 2015).
- Developing a “Mechanism-Based Taxonomy” of Alzheimer’s and Parkinson’s Disease. Available online: http://www.aetionomy.org/index.php?id=5263 (accessed on 25 November 2015).
- Jack, C.R.; Knopman, D.S.; Jagust, W.J.; Petersen, R.C.; Weiner, M.W.; Aisen, P.S.; Shaw, L.M.; Vemuri, P.; Wiste, H.J.; Weigand, S.D.; et al. Tracking pathophysiological processes in Alzheimer’s disease: An updated hypothetical model of dynamic biomarkers. Lancet Neurol. 2013, 12, 207–216. [Google Scholar] [CrossRef]
- Hofmann-Apitius, M.; Alarcón-Riquelme, M.E.; Chamberlain, C.; McHale, D. Towards the taxonomy of human disease. Nat. Rev. Drug Discov. 2015, 14, 75–76. [Google Scholar] [CrossRef] [PubMed]
- Bringing Knowledge to Life! Available online: www.openbel.org (accessed on 25 November 2015).
- Slater, T. Recent advances in modeling languages for pathway maps and computable biological networks. Drug Discov. Today 2014, 19, 193–198. [Google Scholar] [CrossRef] [PubMed]
- OpenBEL/Openbel-Framework. Available online: https://github.com/OpenBEL/openbel-framework (accessed on 25 November 2015).
- Malhotra, A.; Younesi, E.; Gündel, M.; Müller, B.; Heneka, M.T.; Hofmann-Apitius, M. ADO: A disease ontology representing the domain knowledge specific to Alzheimer’s disease. Alzheimer Dement. 2014, 10, 238–246. [Google Scholar] [CrossRef] [PubMed]
- Younesi, E.; Malhotra, A.; Gündel, M.; Scordis, P.; Kodamullil, A.T.; Page, M.; Müller, B.; Springstubbe, S.; Wüllner, U.; Scheller, D.; et al. PDON: Parkinson’s disease ontology for representation and modeling of the Parkinson’s disease knowledge domain. Theor. Biol. Med. Model. 2015, 12, 20. [Google Scholar] [CrossRef] [PubMed]
- Thomson, T.M.; Sewer, A.; Martin, F.; Belcastro, V.; Frushour, B.P.; Gebel, S.; Park, J.; Schlage, W.K.; Talikka, M.; Vasilyev, D.M.; et al. Quantitative assessment of biological impact using transcriptomic data and mechanistic network models. Toxicol. Appl. Pharmacol. 2013, 272, 863–878. [Google Scholar] [CrossRef] [PubMed]
- Kodamullil, A.T.; Younesi, E.; Naz, M.; Bagewadi, S.; Hofmann-Apitius, M. Computable cause-and-effect models of healthy and Alzheimer’s disease states and their mechanistic differential analysis. Alzheimer Dement. 2015. [Google Scholar] [CrossRef] [PubMed]
- Catlett, N.L.; Bargnesi, A.J.; Ungerer, S.; Seagaran, T.; Ladd, W.; Elliston, K.O.; Pratt, D. Reverse causal reasoning: Applying qualitative causal knowledge to the interpretation of high-throughput data. BMC Bioinf. 2013, 14, 340. [Google Scholar] [CrossRef] [PubMed]
- Chindelevitch, L.; Ziemek, D.; Enayetallah, A.; Randhawa, R.; Sidders, B.; Brockel, C.; Huang, E.S. Causal reasoning on biological networks: Interpreting transcriptional changes. Bioinformatics 2012, 28, 1114–1121. [Google Scholar] [CrossRef] [PubMed]
- Deehan, R.; Maerz-Weiss, P.; Catlett, N.L.; Steiner, G.; Wong, B.; Wright, M.B.; Blander, G.; Elliston, K.O.; Ladd, W.; Bobadilla, M.; et al. Comparative transcriptional network modeling of three PPAR-α/γ co-agonists reveals distinct metabolic gene signatures in primary human hepatocytes. PLoS ONE 2012, 7, e35012. [Google Scholar] [CrossRef] [PubMed]
- Laifenfeld, D.; Drubin, D.A.; Catlett, N.L.; Park, J.S.; van Hooser, A.A.; Frushour, B.P.; de Graaf, D.; Fryburg, D.; Deehan, R. Early Patient Stratification and Predictive Biomarkers in Drug Discovery and Development. In Advances in Systems Biology; Springer: New York, NY, USA, 2012; pp. 645–653. [Google Scholar]
- Laifenfeld, D.; Qiu, L.; Swiss, R.; Park, J.; Macoritto, M.; Will, Y.; Younis, H.S.; Lawton, M. Utilization of causal reasoning of hepatic gene expression in rats to identify molecular pathways of idiosyncratic drug-induced liver injury. Toxicol. Sci. 2014, 137, 234–248. [Google Scholar] [CrossRef] [PubMed]
- Laifenfeld, D.; Drubin, D.A.; Catlett, N.L.; Park, J.S.; van Hooser, A.A.; Frushour, B.P.; de Graaf, D.; Fryburg, D.A.; Deehan, R. Early patient stratification and predictive biomarkers in drug discovery and development: A case study of ulcerative colitis anti-TNF therapy. Adv. Exp. Med. Biol. 2012, 736, 645–653. [Google Scholar] [PubMed]
- Semantic Web Standards. Available online: http://www.w3.org/RDF/ (accessed on 25 November 2015).
- Belleau, F.; Nolin, M.A.; Tourigny, N.; Rigault, P.; Morissette, J. Bio2RDF: Towards a mashup to build bioinformatics knowledge systems. J. Biomed. Inform. 2008, 41, 706–716. [Google Scholar] [CrossRef] [PubMed]
- Katayama, T.; Wilkinson, M.D.; Aoki-Kinoshita, K.F.; Kawashima, S.; Yamamoto, Y.; Yamaguchi, A.; Okamoto, S.; Kawano, S.; Kim, J.D.; Wang, Y.; et al. BioHackathon series in 2011 and 2012: Penetration of ontology and linked data in life science domains. J. Biomed. Semant. 2014, 5, 5. [Google Scholar] [CrossRef] [PubMed]
- Katayama, T.; Wilkinson, M.D.; Micklem, G.; Kawashima, S.; Yamaguchi, A.; Nakao, M.; Yamamoto, Y.; Okamoto, S.; Oouchida, K.; Chun, H.W.; et al. The 3rd DBCLS BioHackathon: Improving life science data integration with Semantic Web technologies. J. Biomed. Semant. 2013, 4, 6. [Google Scholar] [CrossRef] [PubMed]
- EMBL European Bioinformatics Institute. Available online: http://www.ebi.ac.uk (accessed on 25 November 2015).
- The OBO Foundry. Available online: http://www.obofoundry.org (accessed on 25 November 2015).
- Williams, A.J.; Harland, L.; Groth, P.; Pettifer, S.; Chichester, C.; Willighagen, E.L.; Evelo, C.T.; Blomberg, N.; Ecker, G.; Goble, C.; et al. Open PHACTS: Semantic interoperability for drug discovery. Drug Discov. Today 2012, 17, 1188–1198. [Google Scholar] [CrossRef] [PubMed]
- Iyappan, A.; Bagewadi, S.; Page, M.; Hofmann-Apitius, M.; Senger, P. NeuroRDF: Semantic Data Integration Strategies for Modeling Neurodegenerative Diseases. In Proceedings of the 6th International Symposium on Semantic Mining in Biomedicine (SMBM2014), Aveiro, Portugal, 16 October 2014.
- Barrett, T.; Wilhite, S.E.; Ledoux, P.; Evangelista, C.; Kim, I.F.; Tomashevsky, M.; Marshall, K.A.; Phillippy, K.H.; Sherman, P.M.; Holko, M.; et al. NCBI GEO: Archive for functional genomics data sets—Update. Nucleic Acids Res. 2013, 41, D991–D995. [Google Scholar] [CrossRef] [PubMed]
- Kolesnikov, N.; Hastings, E.; Keays, M.; Melnichuk, O.; Tang, Y.A.; Williams, E.; Dylag, M.; Kurbatova, N.; Brandizi, M.; Burdett, T.; et al. ArrayExpress update—Simplifying data submissions. Nucleic Acids Res. 2015, 43, D1113–D1116. [Google Scholar] [CrossRef] [PubMed]
- Chatr-aryamontri, A.; Ceol, A.; Palazzi, L.M.; Nardelli, G.; Schneider, M.V.; Castagnoli, L.; Cesareni, G. MINT: The Molecular INTeraction database. Nucleic Acids Res. 2007, 35, D572–D574. [Google Scholar] [CrossRef] [PubMed]
- Hermjakob, H.; Montecchi-Palazzi, L.; Lewington, C.; Mudali, S.; Kerrien, S.; Orchard, S.; Vingron, M.; Roechert, B.; Roepstorff, P.; Valencia, A.; et al. IntAct: An open source molecular interaction database. Nucleic Acids Res. 2004, 32, D452–D455. [Google Scholar] [CrossRef] [PubMed]
- Zheng, B.; Liao, Z.; Locascio, J.J.; Lesniak, K.A.; Roderick, S.S.; Watt, M.L.; Eklund, A.C.; Zhang-James, Y.; Kim, P.D.; Hauser, M.A.; et al. PGC-1α, a potential therapeutic target for early intervention in Parkinson’s disease. Sci. Transl. Med. 2010, 2, 52ra73. [Google Scholar] [CrossRef] [PubMed]
- Bagewadi, S.; Adhikari, S.; Dhrangadhariya, A.; Irin, A.K.; Ebeling, C.; Namasivayam, A.A.; Page, M.; Hofmann-Apitius, M.; Senger, P. NeuroTransDB: http://www.ebi.ac.uk curated and structured transcriptomic meta-data for neurodegenerative diseases. Database 2015, in press. [Google Scholar]
- Malhotra, A.; Younesi, E.; Bagewadi, S.; Hofman-Apitius, M. Linking hypothetical knowledge patterns to disease molecular signatures for biomarker discovery in Alzheimer’s disease. Genome Med. 2014, 6, 97. [Google Scholar] [CrossRef] [PubMed]
- Bagewadi, S.; Bobić, T.; Hofmann-Apitius, M.; Fluck, J.; Klinger, R. Detecting miRNA Mentions and Relations in Biomedical Literature. F1000 Res. 2014, 3, 205. [Google Scholar] [CrossRef]
- Younesi, E.; Hofmann-Apitius, M. Biomarker-guided translation of brain imaging into disease pathway models. Sci. Rep. 2013, 3, 3375. [Google Scholar] [CrossRef] [PubMed]
- Neuroallianz—Eine Forschungskooperation im Rahmen der Pharma-Initiative Deutschland: Mission. Available online: http://www.neuroallianz.de/en/mission.html (accessed on 25 November 2015).
- Li, X.; Gao, D.; Wang, H.; Li, X.; Yang, J.; Yang, X.; Liu, Z.; Ma, Z. Negative feedback loop between p66Shc and ZEB1 regulates fibrotic EMT response in lung cancer cells. Cell Death Dis. 2015, 6, e1708. [Google Scholar] [CrossRef] [PubMed]
- Soliman, M.A.; Abdel Rahman, A.M.; Lamming, D.W.; Birsoy, K.; Pawling, J.; Frigolet, M.E.; Lu, H.; Fantus, I.G.; Pasculescu, A.; Zheng, Y.; et al. The Adaptor Protein p66Shc Inhibits mTOR-Dependent Anabolic Metabolism. Sci. Signal. 2014, 7, ra17. [Google Scholar] [CrossRef] [PubMed]
- AlzGene. Available online: http://www.alzgene.org (accessed on 25 November 2015).
- Fujita, K.A.; Ostaszewski, M.; Matsuoka, Y.; Ghosh, S.; Glaab, E.; Trefois, C.; Crespo, I.; Perumal, T.M.; Jurkowski, W.; Antony, P.M.; et al. Integrating pathways of Parkinson’s disease in a molecular interaction map. Mol. Neurobiol. 2014, 49, 88–102. [Google Scholar] [CrossRef] [PubMed]
- Funahashi, A.; Matsuoka, Y.; Jouraku, A.; Morohashi, M.; Kikuchi, N.; Kitano, H. ”CellDesigner 3.5: A Versatile Modeling Tool for Biochemical Networks”. Proc. IEEE 2008, 96, 1254–1265. [Google Scholar] [CrossRef]
- University of Luxembourg—Parkinson’s Disease Map. Available online: http://pdmap.uni.lu (accessed on 25 November 2015).
- Glaab, E.; Schneider, R. Comparative pathway and network analysis of brain transcriptome changes during adult aging and in Parkinson’s disease. Neurobiol. Dis. 2015, 74, 1–13. [Google Scholar] [CrossRef] [PubMed]
- Thiele, I.; Swainston, N.; Fleming, R.M.; Hoppe, A.; Sahoo, S.; Aurich, M.K.; Haraldsdottir, H.; Mo, M.L.; Rolfsson, O.; Stobbe, M.D.; et al. A community-driven global reconstruction of human metabolism. Nat. Biotechnol. 2013, 31, 419–425. [Google Scholar] [CrossRef] [PubMed]
- De Bono, B.; Grenon, P.; Sammut, S.J. ApiNATOMY: A novel toolkit for visualizing multiscale anatomy schematics with phenotype-related information. Hum. Mutat. 2012, 33, 837–848. [Google Scholar] [CrossRef] [PubMed]
- Wimalaratne, S.M.; Grenon, P.; Hoehndorf, R.; Gkoutos, G.V.; de Bono, B. An infrastructure for ontology-based information systems in biomedicine: RICORDO case study. Bioinf. Oxf. Engl. 2012, 28, 448–450. [Google Scholar] [CrossRef] [PubMed]
- Mueller, S.G.; Weiner, M.W.; Thal, L.J.; Petersen, R.C.; Jack, C.; Jagust, W.; Trojanowski, J.Q.; Toga, A.W.; Beckett, L. The Alzheimer’s disease neuroimaging initiative (ADNI). Neuroimaging Clin. N. Am. 2005, 15, 869–877. [Google Scholar]
- Marek, K.; Jennings, D.; Lasch, S.; Siderowf, A.; Tanner, C.; Simuni, T.; Coffey, C.; Kieburtz, K.; Flagg, E.; Chowdhury, S.; et al. The Parkinson Progression Marker Initiative (PPMI). Prog. Neurobiol. 2011, 95, 629–635. [Google Scholar] [CrossRef] [PubMed]
- Lu, C.L.; Tang, C.Y.; Lee, R.C.-T. The full Steiner tree problem. Theor. Comput. Sci. 2003, 306, 55–67. [Google Scholar] [CrossRef]
- Gilbert, E.; Pollak, H. Steiner Minimal Trees. SIAM J. Appl. Math. 1968, 16, 1–29. [Google Scholar] [CrossRef]
- Kou, L.; Markowsky, G.; Berman, L. A fast algorithm for Steiner trees. Acta Inform. 1981, 15, 141–145. [Google Scholar] [CrossRef]
- Wu, Y.F.; Widmayer, P.; Wong, C.K. A faster approximation algorithm for the Steiner problem in graphs. Acta Inform. 1986, 23, 223–229. [Google Scholar] [CrossRef]
- Cockayne, E. On the Efficiency of the Algorithm for Steiner Minimal Trees. SIAM J. Appl. Math. 1970, 18, 150–159. [Google Scholar] [CrossRef]
- Shannon, P.; Markiel, A.; Ozier, O.; Baliga, N.S.; Wang, J.T.; Ramage, D.; Amin, N.; Schwikowski, B.; Ideker, T. Cytoscape: A software environment for integrated models of biomolecular interaction networks. Genome Res. 2003, 13, 2498–2504. [Google Scholar] [CrossRef] [PubMed]
- Data Visualization & Analytics Software—TIBCO Spotfire. Available online: http://spotfire.tibco.com/ (accessed on 20 November 2015).
- TranSMART Foundation. Available online: http://transmartfoundation.org (accessed on 25 November 2015).
- eTRIKS. Available online: http://www.etriks.org (accessed on 25 November 2015).
- Foundational Model of Anatomy ontology. Available online: http://sig.biostr.washington.edu/projects/fm/ (accessed on 25 November 2015).
- Younesi, E. (2014) A Knowledge-based Integrative Modeling Approach for in-Silico Identification of Mechanistic Targets in Neurodegeneration with Focus on Alzheimer’s Disease. Available online: http://hss.ulb.uni-bonn.de/2014/3602/3602.htm (accessed on 25 November 2015).
- Neuroscience Information Framework—Search for Neuroscience Resources. Available online: http://www.neuinfo.org (accessed on 25 November 2015).
- Malhotra, A.; Gündel, M.; Rajput, A.M.; Mevissen, H.T.; Saiz, A.; Pastor, X.; Lozano-Rubi, R.; Martinez-Lapiscina, E.H.; Zubizarreta, I.; Mueller, B.; et al. Knowledge retrieval from pubmed abstracts and electronic medical records with the multiple sclerosis ontology. PLoS ONE 2015, 10, e0116718. [Google Scholar] [CrossRef] [PubMed]
- Whetzel, P.L.; Noy, N.F.; Shah, N.H.; Alexander, P.R.; Nyulas, C.; Tudorache, T.; Musen, M.A. BioPortal: Enhanced functionality via new Web services from the National Center for Biomedical Ontology to access and use ontologies in software applications. Nucleic Acids Res. 2011, 39, W541–W545. [Google Scholar] [CrossRef] [PubMed]
- Iyappan, A.; Younesi, E.; Vrooman, H.; Frisoni, G.; Hofmann-Apitius, M. NeuroImage Feature Terminology (NIFT): A controlled terminology for the annotation of brain imaging features. in preparation. 2015. [Google Scholar]
- ClinicalTrials.Gov. Available online: https://clinicaltrials.gov (accessed on 25 November 2015).
- Mattingly, C.J.; Colby, G.T.; Forrest, J.N.; Boyer, J.L. The Comparative Toxicogenomics Database (CTD). Environ. Health Perspect. 2003, 111, 793–795. [Google Scholar] [CrossRef] [PubMed]
- The UniProt Consortium. UniProt: A hub for protein information. Nucleic Acids Res. 2015, 43, D204–D212. [Google Scholar]
- Kutmon, M.; Riutta, A.; Nunes, N.; Hanspers, K.; Willighagen, E.L.; Bohler, A.; Mélius, J.; Waagmeester, A.; Sinha, S.R.; Miller, R.; et al. WikiPathways: Capturing the full diversity of pathway knowledge. Nucleic Acids Res. 2015, 19, gkv1024. [Google Scholar] [CrossRef] [PubMed]
- Law, V.; Knox, C.; Djoumbou, Y.; Jewison, T.; Guo, A.C.; Liu, Y.; Maciejewski, A.; Arndt, D.; Wilson, M.; Neveu, V.; et al. DrugBank 4.0: Shedding new light on drug metabolism. Nucleic Acids Res. 2014, 42, D1091–D1097. [Google Scholar] [CrossRef] [PubMed]
- Kristian, A.; Yates, G.B.; Seal, R.L.; Wright, M.W.; Bruford, E.A. Genenames.org: The HGNC resources in 2015. Nucleic Acids Res. 2015, 43, D1071–D1078. [Google Scholar]
- PubMed—NCBI. Available online: http://www.ncbi.nlm.nih.gov/pubmed (accessed on 25 November 2015).
- Croft, D.; Mundo, A.F.; Haw, R.; Milacic, M.; Weiser, J.; Wu, G.; Caudy, M.; Garapati, P.; Gillespie, M.; Kamdar, M.R.; et al. The Reactome pathway knowledgebase. Nucleic Acids Res. 2014, 42, D472–D477. [Google Scholar] [CrossRef] [PubMed]
- Uhlén, M.; Fagerberg, L.; Hallström, B.M.; Lindskog, C.; Oksvold, P.; Mardinoglu, A.; Sivertsson, Å.; Kampf, C.; Sjöstedt, E.; Asplund, A.; et al. Tissue-based map of the human proteome. Science 2015, 23, 347. [Google Scholar] [CrossRef] [PubMed]
- The NCBI Handbook. Available online: http://www.ncbi.nlm.nih.gov/books/NBK143764/ (accessed on 25 November 2015).
- Degtyarenko, K.; de Matos, P.; Ennis, M.; Hastings, J.; Zbinden, M.; McNaught, A.; Alcántara, R.; Darsow, M.; Guedj, M.; Ashburner, M. ChEBI: A database and ontology for chemical entities of biological interest. Nucleic Acids Res. 2008, 36, D344–D350. [Google Scholar] [CrossRef] [PubMed]
- Mitchell, A.; Chang, H.-Y.; Daugherty, L.; Fraser, M.; Hunter, S.; Lopez, R.; McAnulla, C.; McMenamin, C.; Nuka, G.; Pesseat, S.; et al. The InterPro protein families database: The classification resource after 15 years. Nucleic Acids Res. 2015, 43, D213–D221. [Google Scholar] [CrossRef] [PubMed]
- Chatr-Aryamontri, A.; Breitkreutz, B.J.; Oughtred, R.; Boucher, L.; Heinicke, S.; Chen, D.; Stark, C.; Breitkreutz, A.; Kolas, N.; O’Donnell, L.; et al. The BioGRID interaction database: 2015 update. Nucleic Acids Res. 2015, 43, D440–D448. [Google Scholar] [CrossRef] [PubMed]
- Szklarczyk, D.; Franceschini, A.; Wyder, S.; Forslund, K.; Heller, D.; Huerta-Cepas, J.; Simonovic, M.; Roth, A.; Santos, A.; Tsafou, K.P.; et al. STRING v10: Protein–protein interaction networks, integrated over the tree of life. Nucleic Acids Res. 2015, 43, D447–D452. [Google Scholar] [CrossRef] [PubMed]
- Galon, J.; Costes, A.; Sanchez-Cabo, F.; Kirilovsky, A.; Mlecnik, B.; Lagorce-Pagès, C.; Tosolini, M.; Camus, M.; Berger, A.; Wind, P.; et al. Type, density, and location of immune cells within human colorectal tumors predict clinical outcome. Science 2006, 313, 1960–1964. [Google Scholar] [CrossRef] [PubMed]
© 2015 by the authors; licensee MDPI, Basel, Switzerland. This article is an open access article distributed under the terms and conditions of the Creative Commons by Attribution (CC-BY) license (http://creativecommons.org/licenses/by/4.0/).
Share and Cite
Hofmann-Apitius, M.; Ball, G.; Gebel, S.; Bagewadi, S.; De Bono, B.; Schneider, R.; Page, M.; Kodamullil, A.T.; Younesi, E.; Ebeling, C.; et al. Bioinformatics Mining and Modeling Methods for the Identification of Disease Mechanisms in Neurodegenerative Disorders. Int. J. Mol. Sci. 2015, 16, 29179-29206. https://doi.org/10.3390/ijms161226148
Hofmann-Apitius M, Ball G, Gebel S, Bagewadi S, De Bono B, Schneider R, Page M, Kodamullil AT, Younesi E, Ebeling C, et al. Bioinformatics Mining and Modeling Methods for the Identification of Disease Mechanisms in Neurodegenerative Disorders. International Journal of Molecular Sciences. 2015; 16(12):29179-29206. https://doi.org/10.3390/ijms161226148
Chicago/Turabian StyleHofmann-Apitius, Martin, Gordon Ball, Stephan Gebel, Shweta Bagewadi, Bernard De Bono, Reinhard Schneider, Matt Page, Alpha Tom Kodamullil, Erfan Younesi, Christian Ebeling, and et al. 2015. "Bioinformatics Mining and Modeling Methods for the Identification of Disease Mechanisms in Neurodegenerative Disorders" International Journal of Molecular Sciences 16, no. 12: 29179-29206. https://doi.org/10.3390/ijms161226148
APA StyleHofmann-Apitius, M., Ball, G., Gebel, S., Bagewadi, S., De Bono, B., Schneider, R., Page, M., Kodamullil, A. T., Younesi, E., Ebeling, C., Tegnér, J., & Canard, L. (2015). Bioinformatics Mining and Modeling Methods for the Identification of Disease Mechanisms in Neurodegenerative Disorders. International Journal of Molecular Sciences, 16(12), 29179-29206. https://doi.org/10.3390/ijms161226148