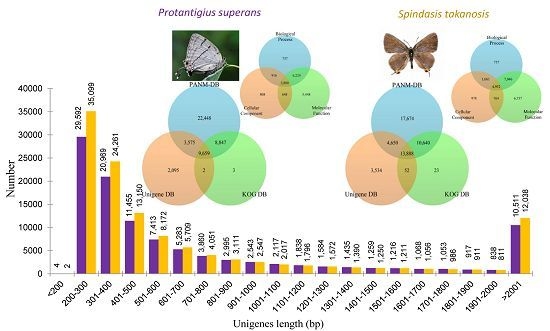
Transcriptome Characterization for Non-Model Endangered Lycaenids, Protantigius superans and Spindasis takanosis, Using Illumina HiSeq 2500 Sequencing
Abstract
:1. Introduction
2. Results and Discussion
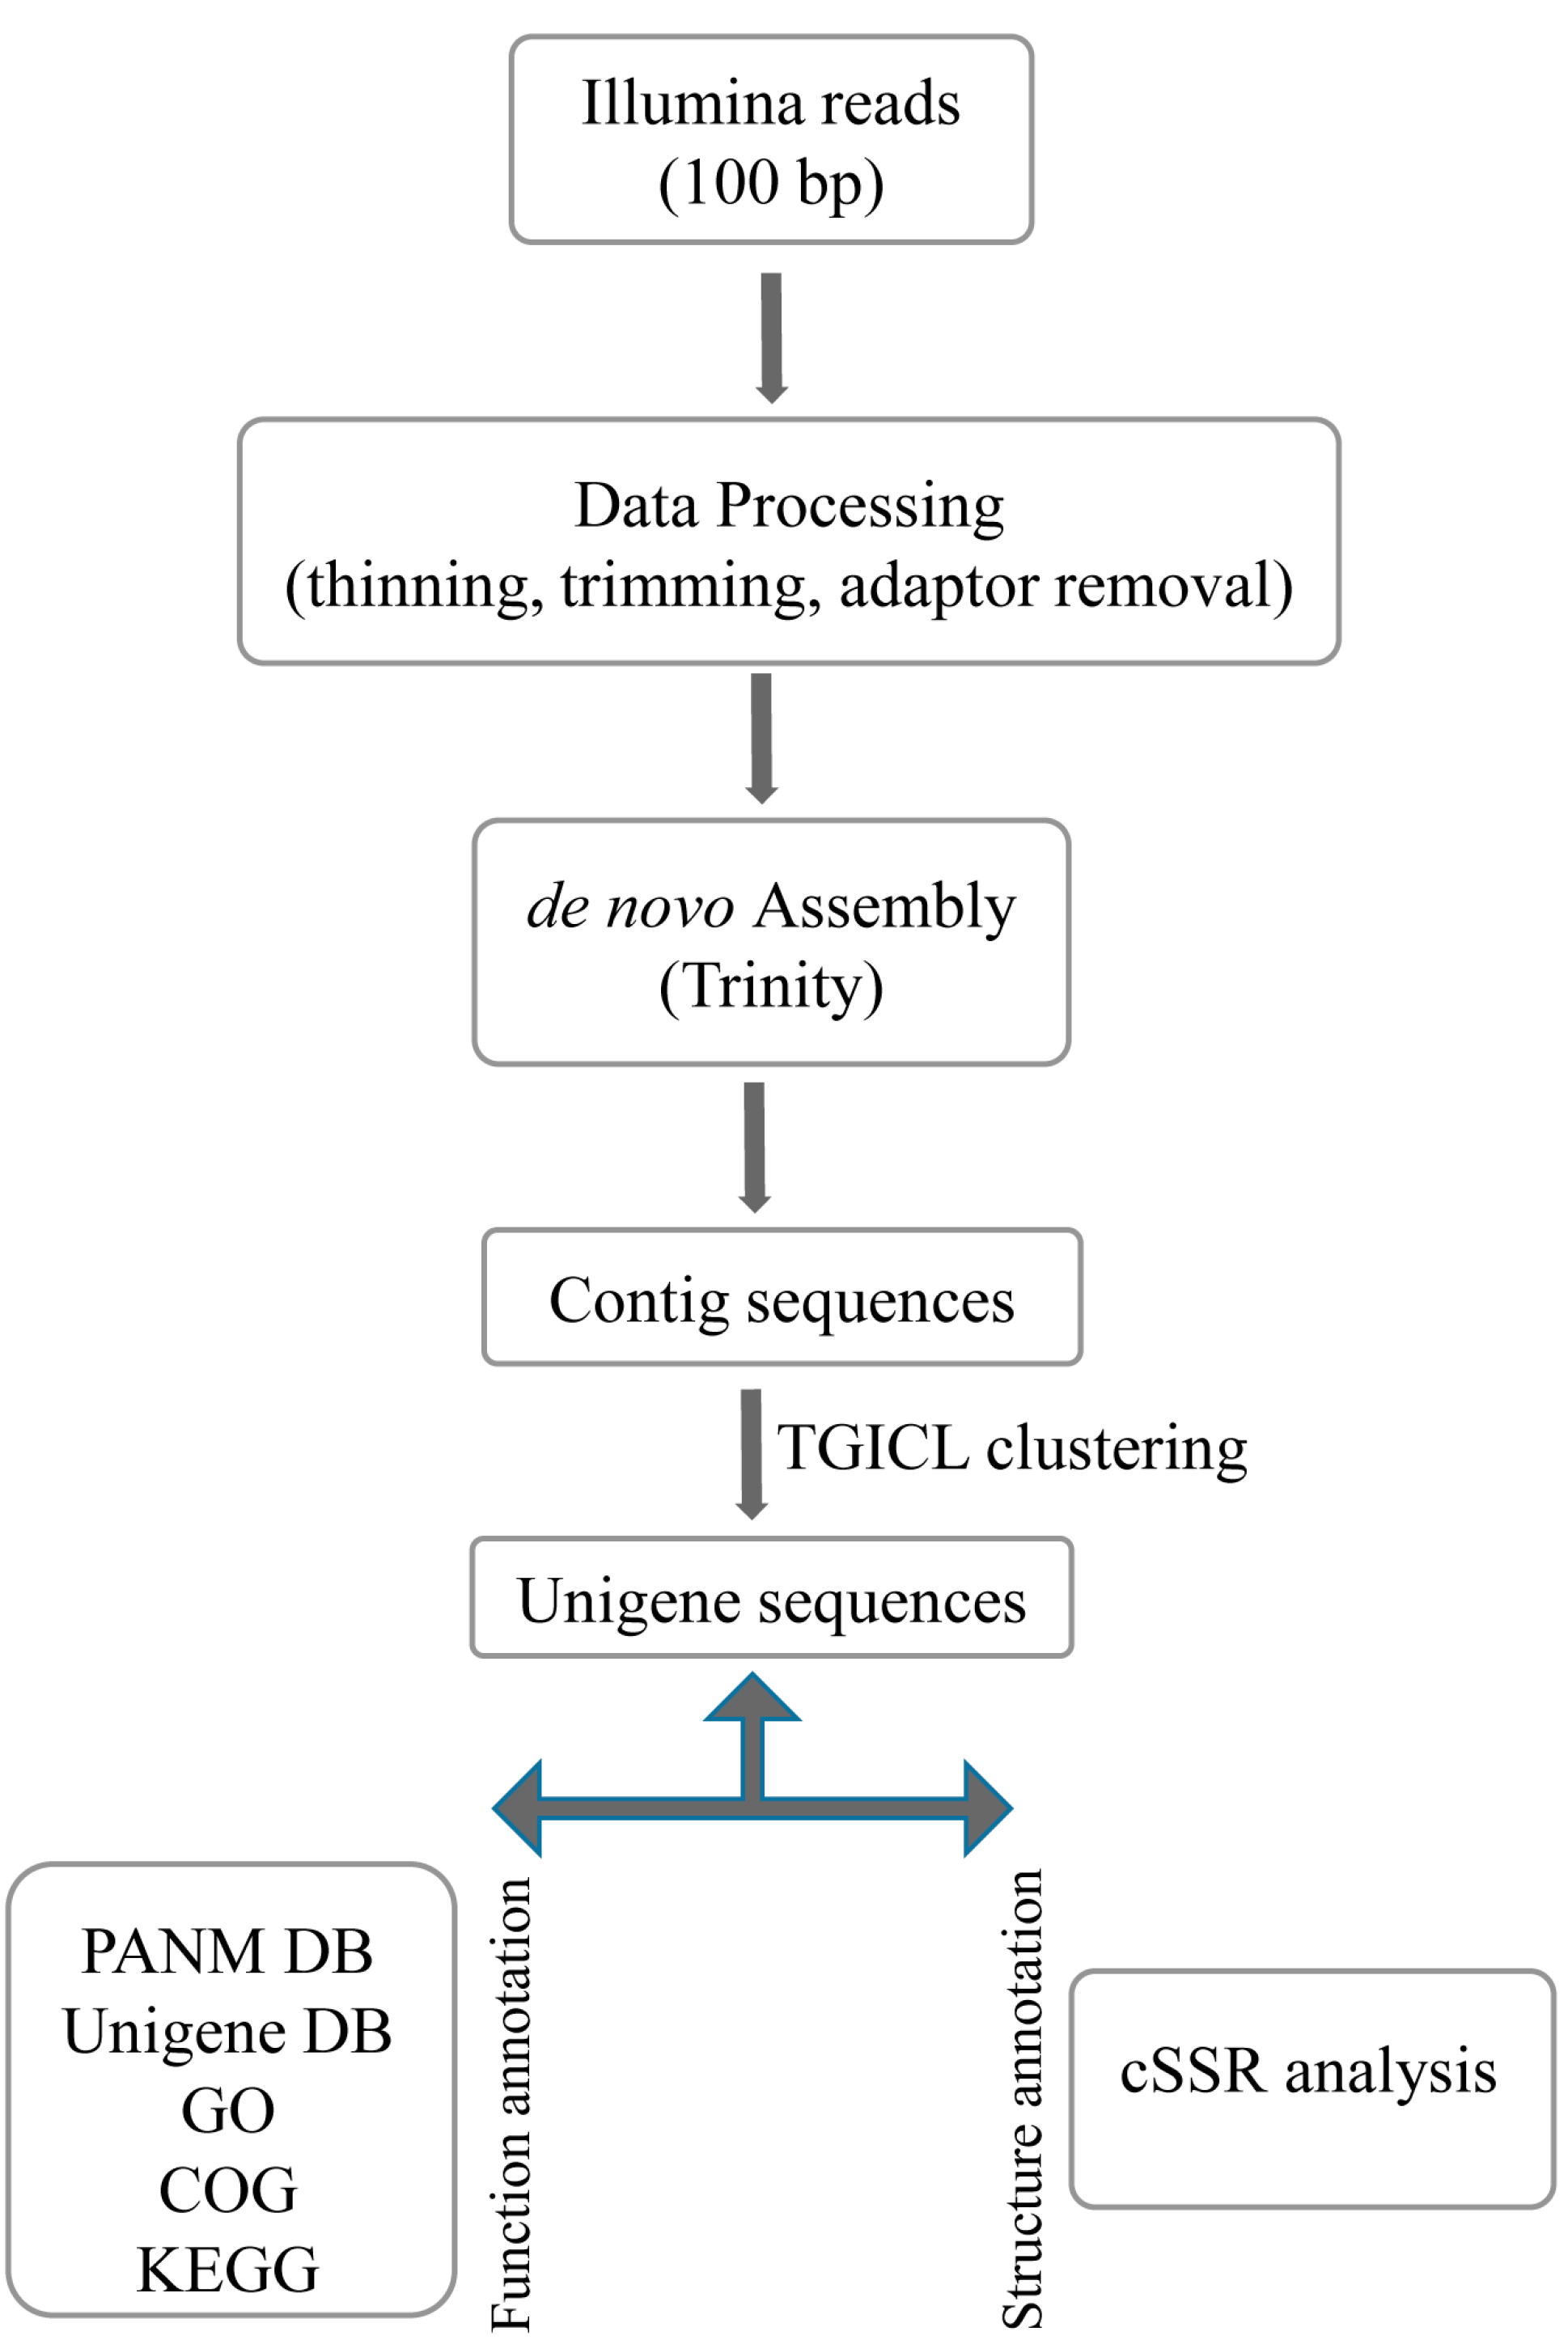
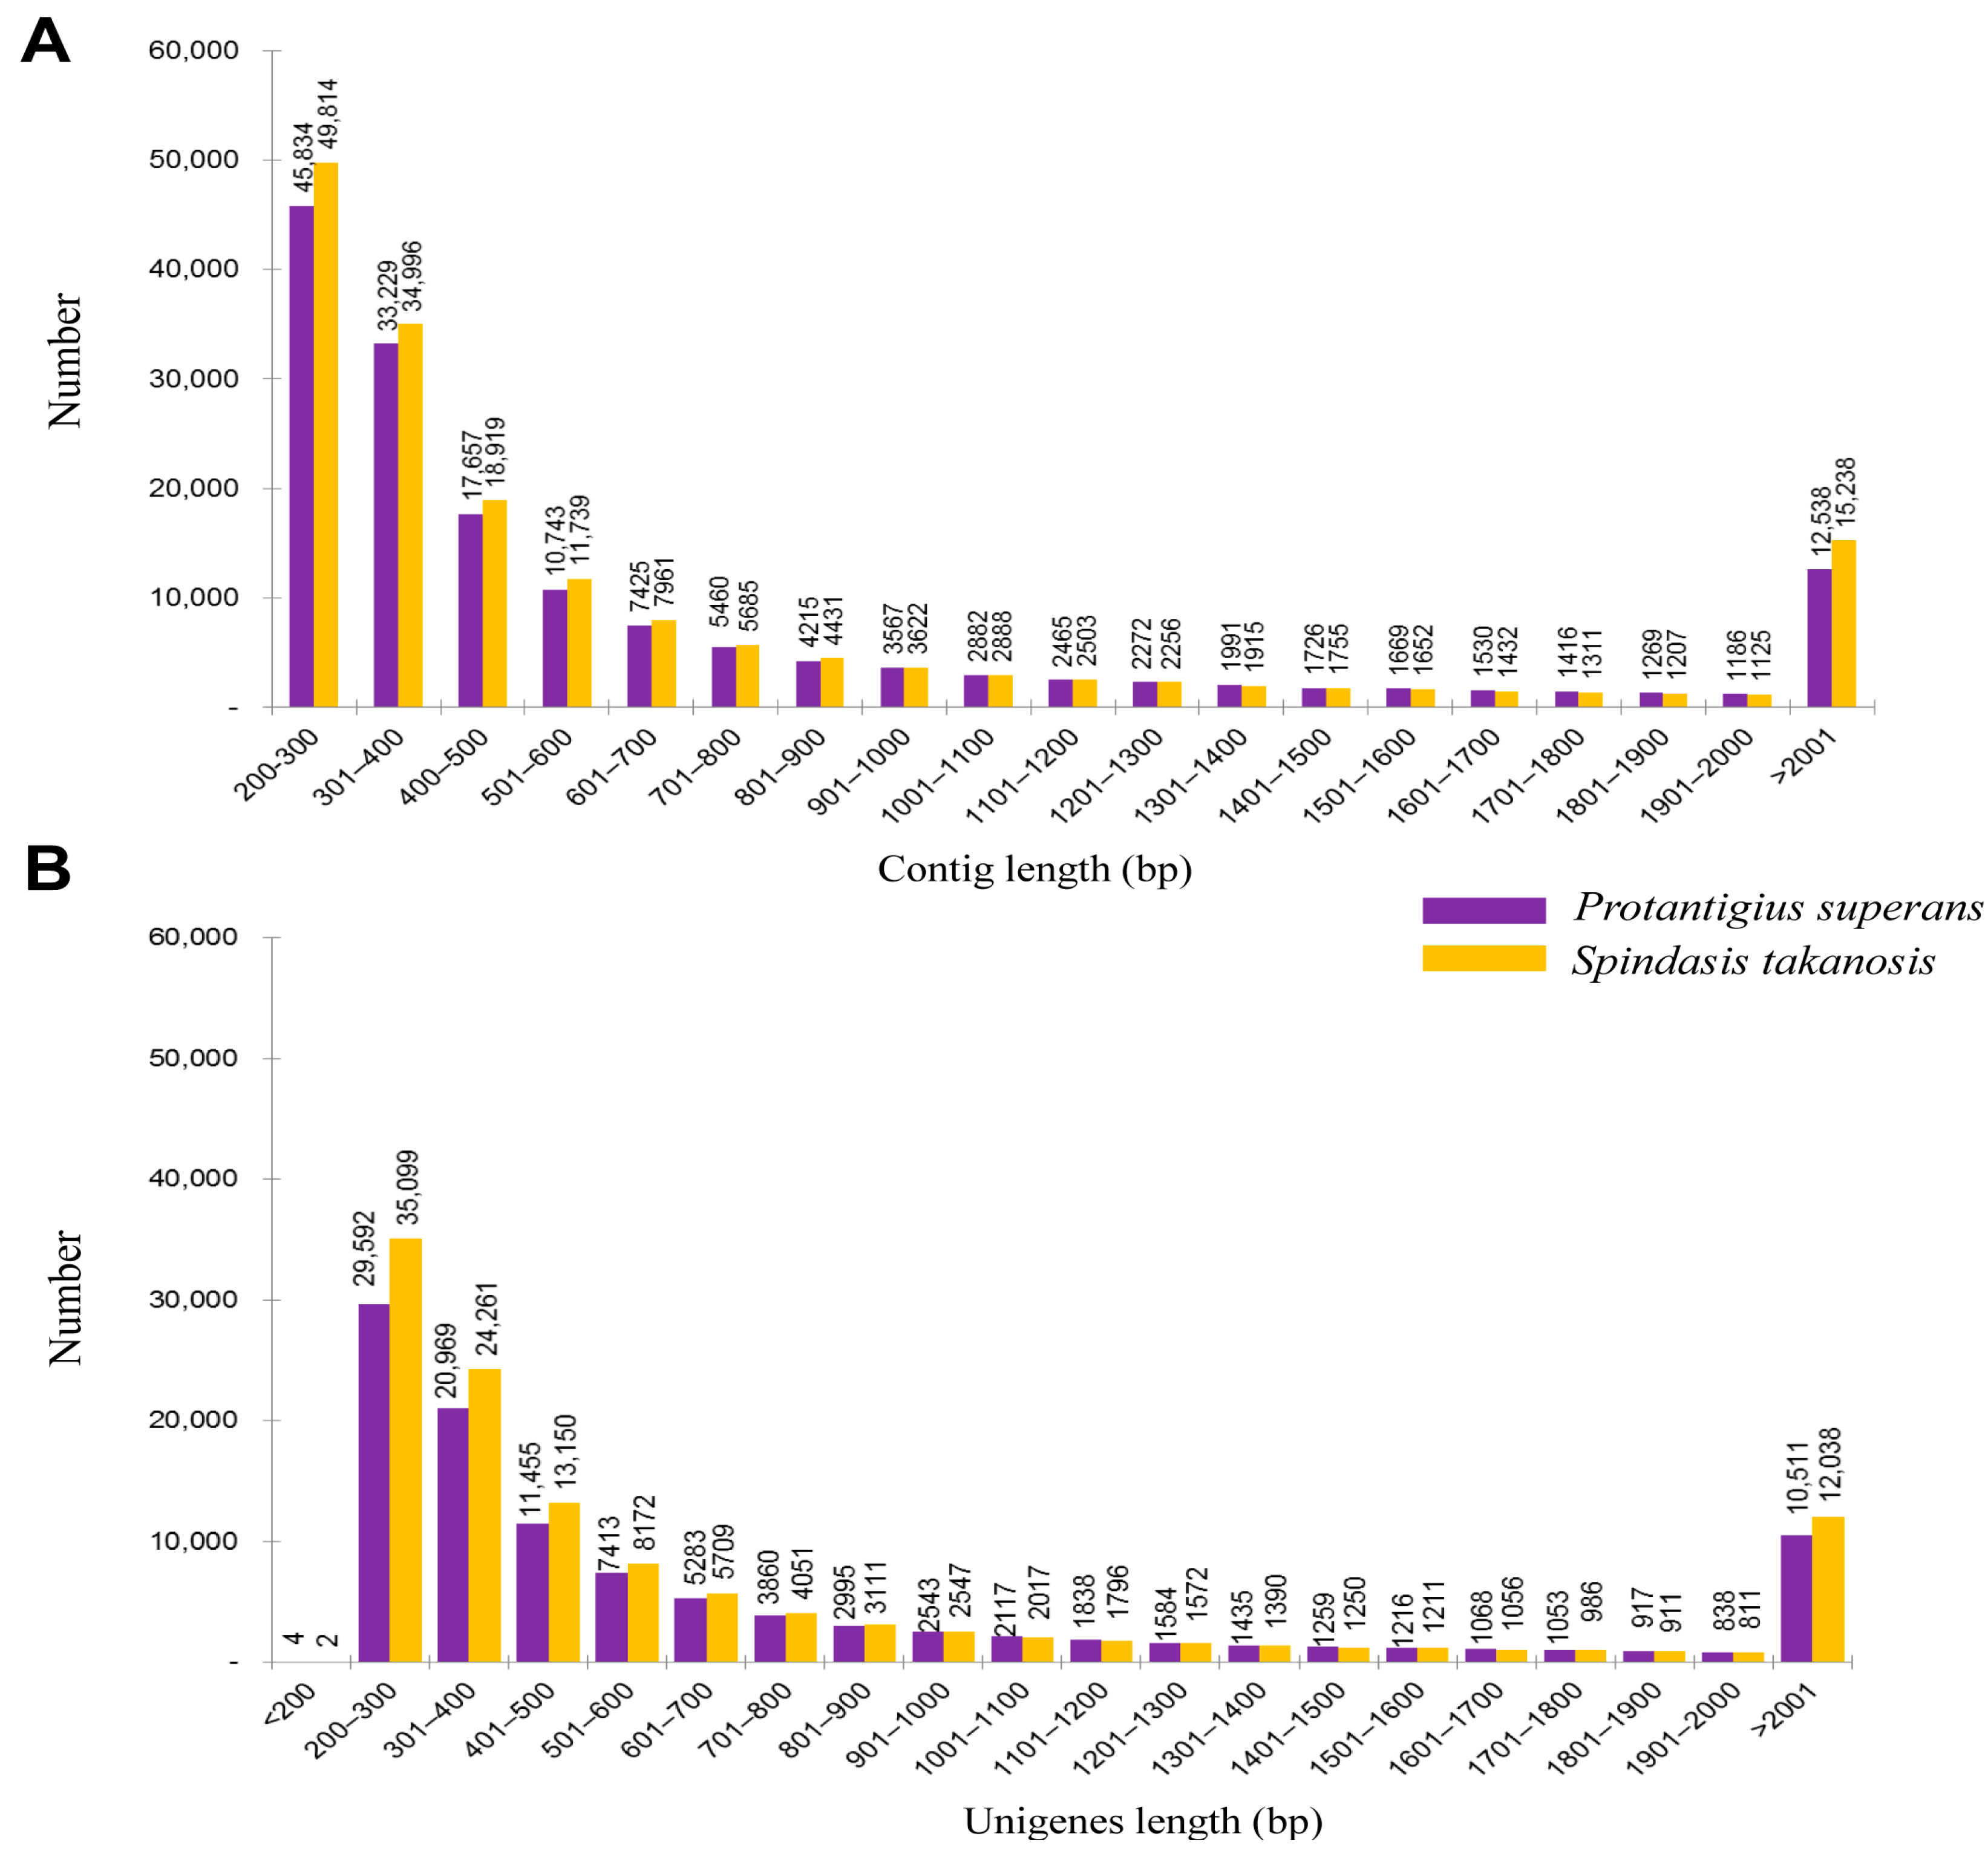
2.1. Transcriptome Analysis
| Assembly Features | Spindasis takanosis | Protantigius superans |
|---|---|---|
| Raw Reads | ||
| Number of sequences | 249,312,792 | 258,875,070 |
| Number of bases | 31,413,411,792 | 32,618,258,820 |
| Mean length (bp) | 126 | 126 |
| Clean reads | ||
| Number of sequences | 245,110,582 | 254,340,693 |
| Number of bases | 30,515,812,866 | 31,607,701,940 |
| Mean length (bp) | 124.5 | 124.3 |
| N50 length (bp) | 126 | 126 |
| GC% | 41.96 | 39.81 |
| High-quality reads (%) | 98.31 (sequences), 97.14 (bases) | 98.25 (sequences), 96.90 (bases) |
| Number of reads discarded (%) | 1.69 (sequences), 2.86 (bases) | 1.75 (sequence), 3.1 (bases) |
| Contig information | ||
| Total number of contig | 170,449 | 159,074 |
| Number of bases | 134,036,728 | 118,721,203 |
| Mean length of contig (bp) | 786.4 | 746.3 |
| N50 length of contig (bp) | 1372 | 1220 |
| GC% of contig | 38.58 | 38.45 |
| Longest contig (bp) | 16,820 | 15,152 |
| No. of large contigs (≥500 bp) | 66,844 | 62,485 |
| Unigene information- | ||
| Total number of unigenes | 121,140 | 107,950 |
| Number of bases | 100,232,710 | 89,022,313 |
| Mean length of unigene (bp) | 827.4 | 824.7 |
| N50 length of unigene (bp) | 1537 | 1452 |
| GC% of unigene | 38.68 | 38.46 |
| Length ranges (bp) | 124–16,820 | 114–17,062 |
2.2. Sequence Annotation
| Databases | All Annotated Transcripts | ≤300 bp | 300–1000 bp | ≥1000 bp | ||||
|---|---|---|---|---|---|---|---|---|
| P. superans | S. takanosis | P. superans | S. takanosis | P. superans | S. takanosis | P. superans | S. takanosis | |
| PANM-DB | 44,529 | 46,852 | 6272 | 7342 | 19,244 | 19,666 | 19,013 | 19,844 |
| UNIGENE | 15,331 | 22,124 | 1267 | 2751 | 5098 | 7848 | 8966 | 11,525 |
| KOG | 18,511 | 24,603 | 1273 | 2721 | 5399 | 7971 | 11,839 | 13,911 |
| GO | 18,661 | 22,275 | 1956 | 2705 | 6355 | 7566 | 10,350 | 12,004 |
| KEGG | 5259 | 6697 | 541 | 897 | 1615 | 2289 | 3103 | 3511 |
| ALL | 46,754 | 51,908 | 6739 | 8721 | 20,557 | 22,559 | 19,458 | 20,628 |
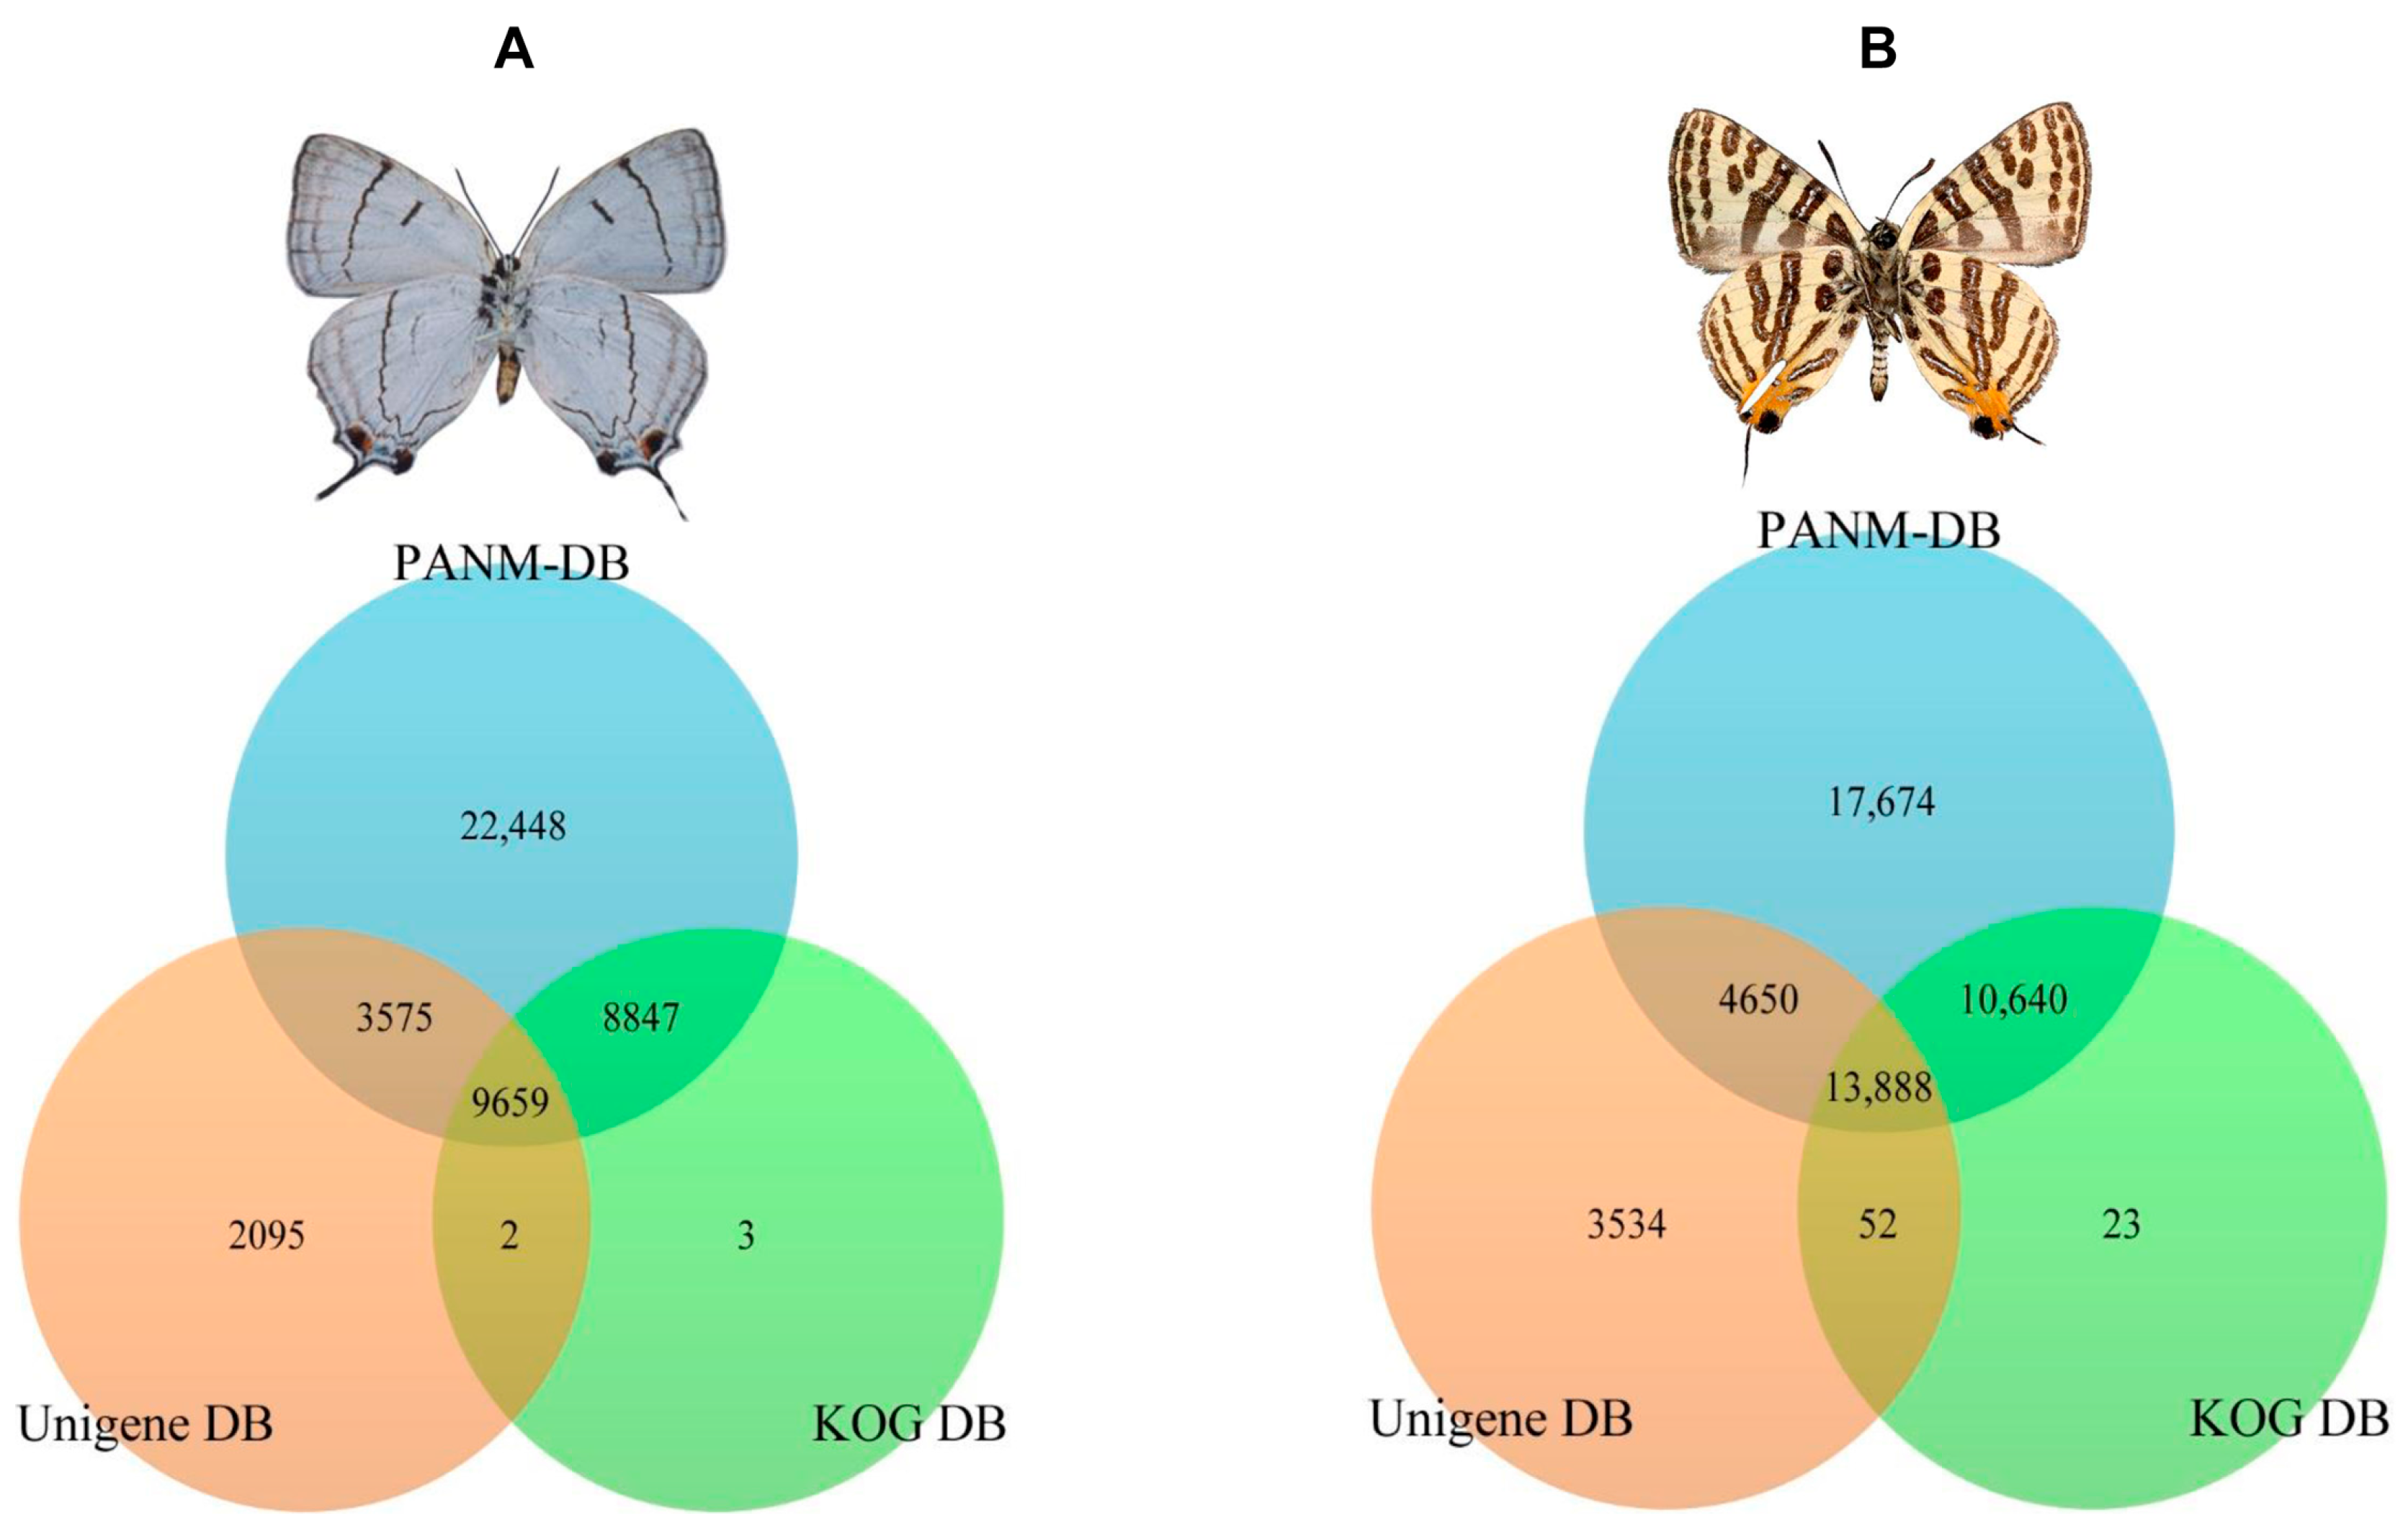
2.3. Homology Characteristics of Assembled Unigenes
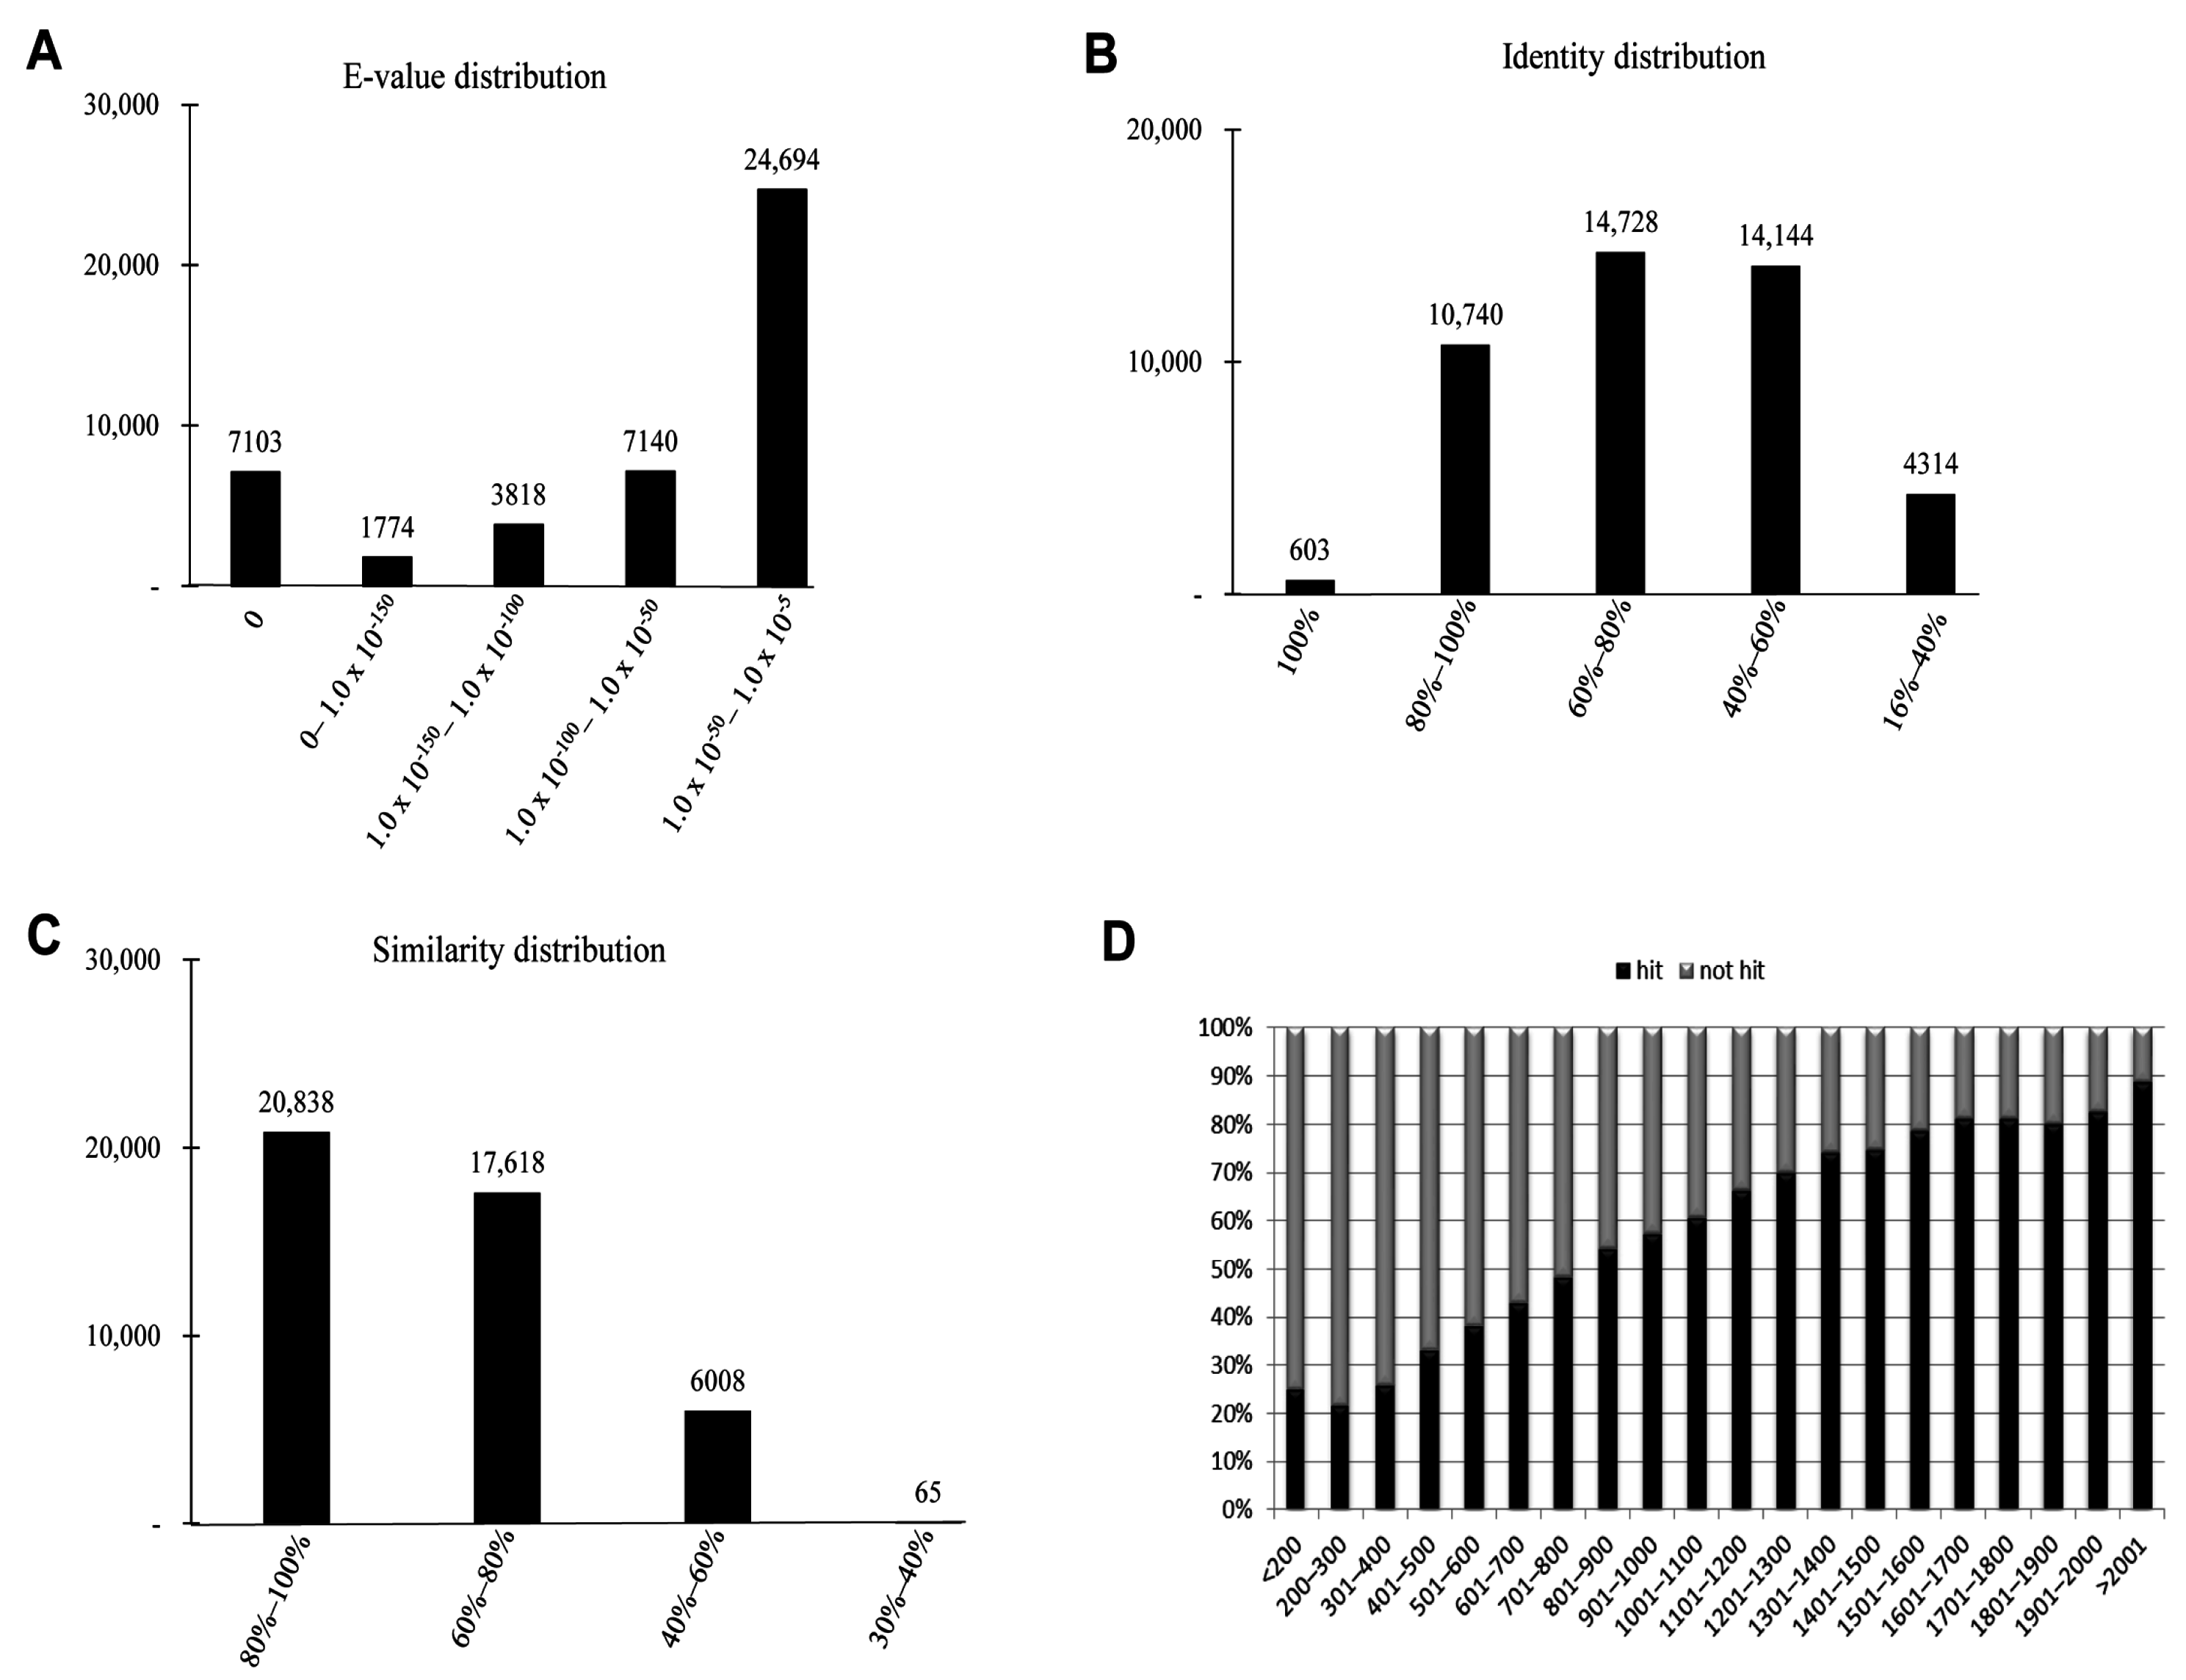
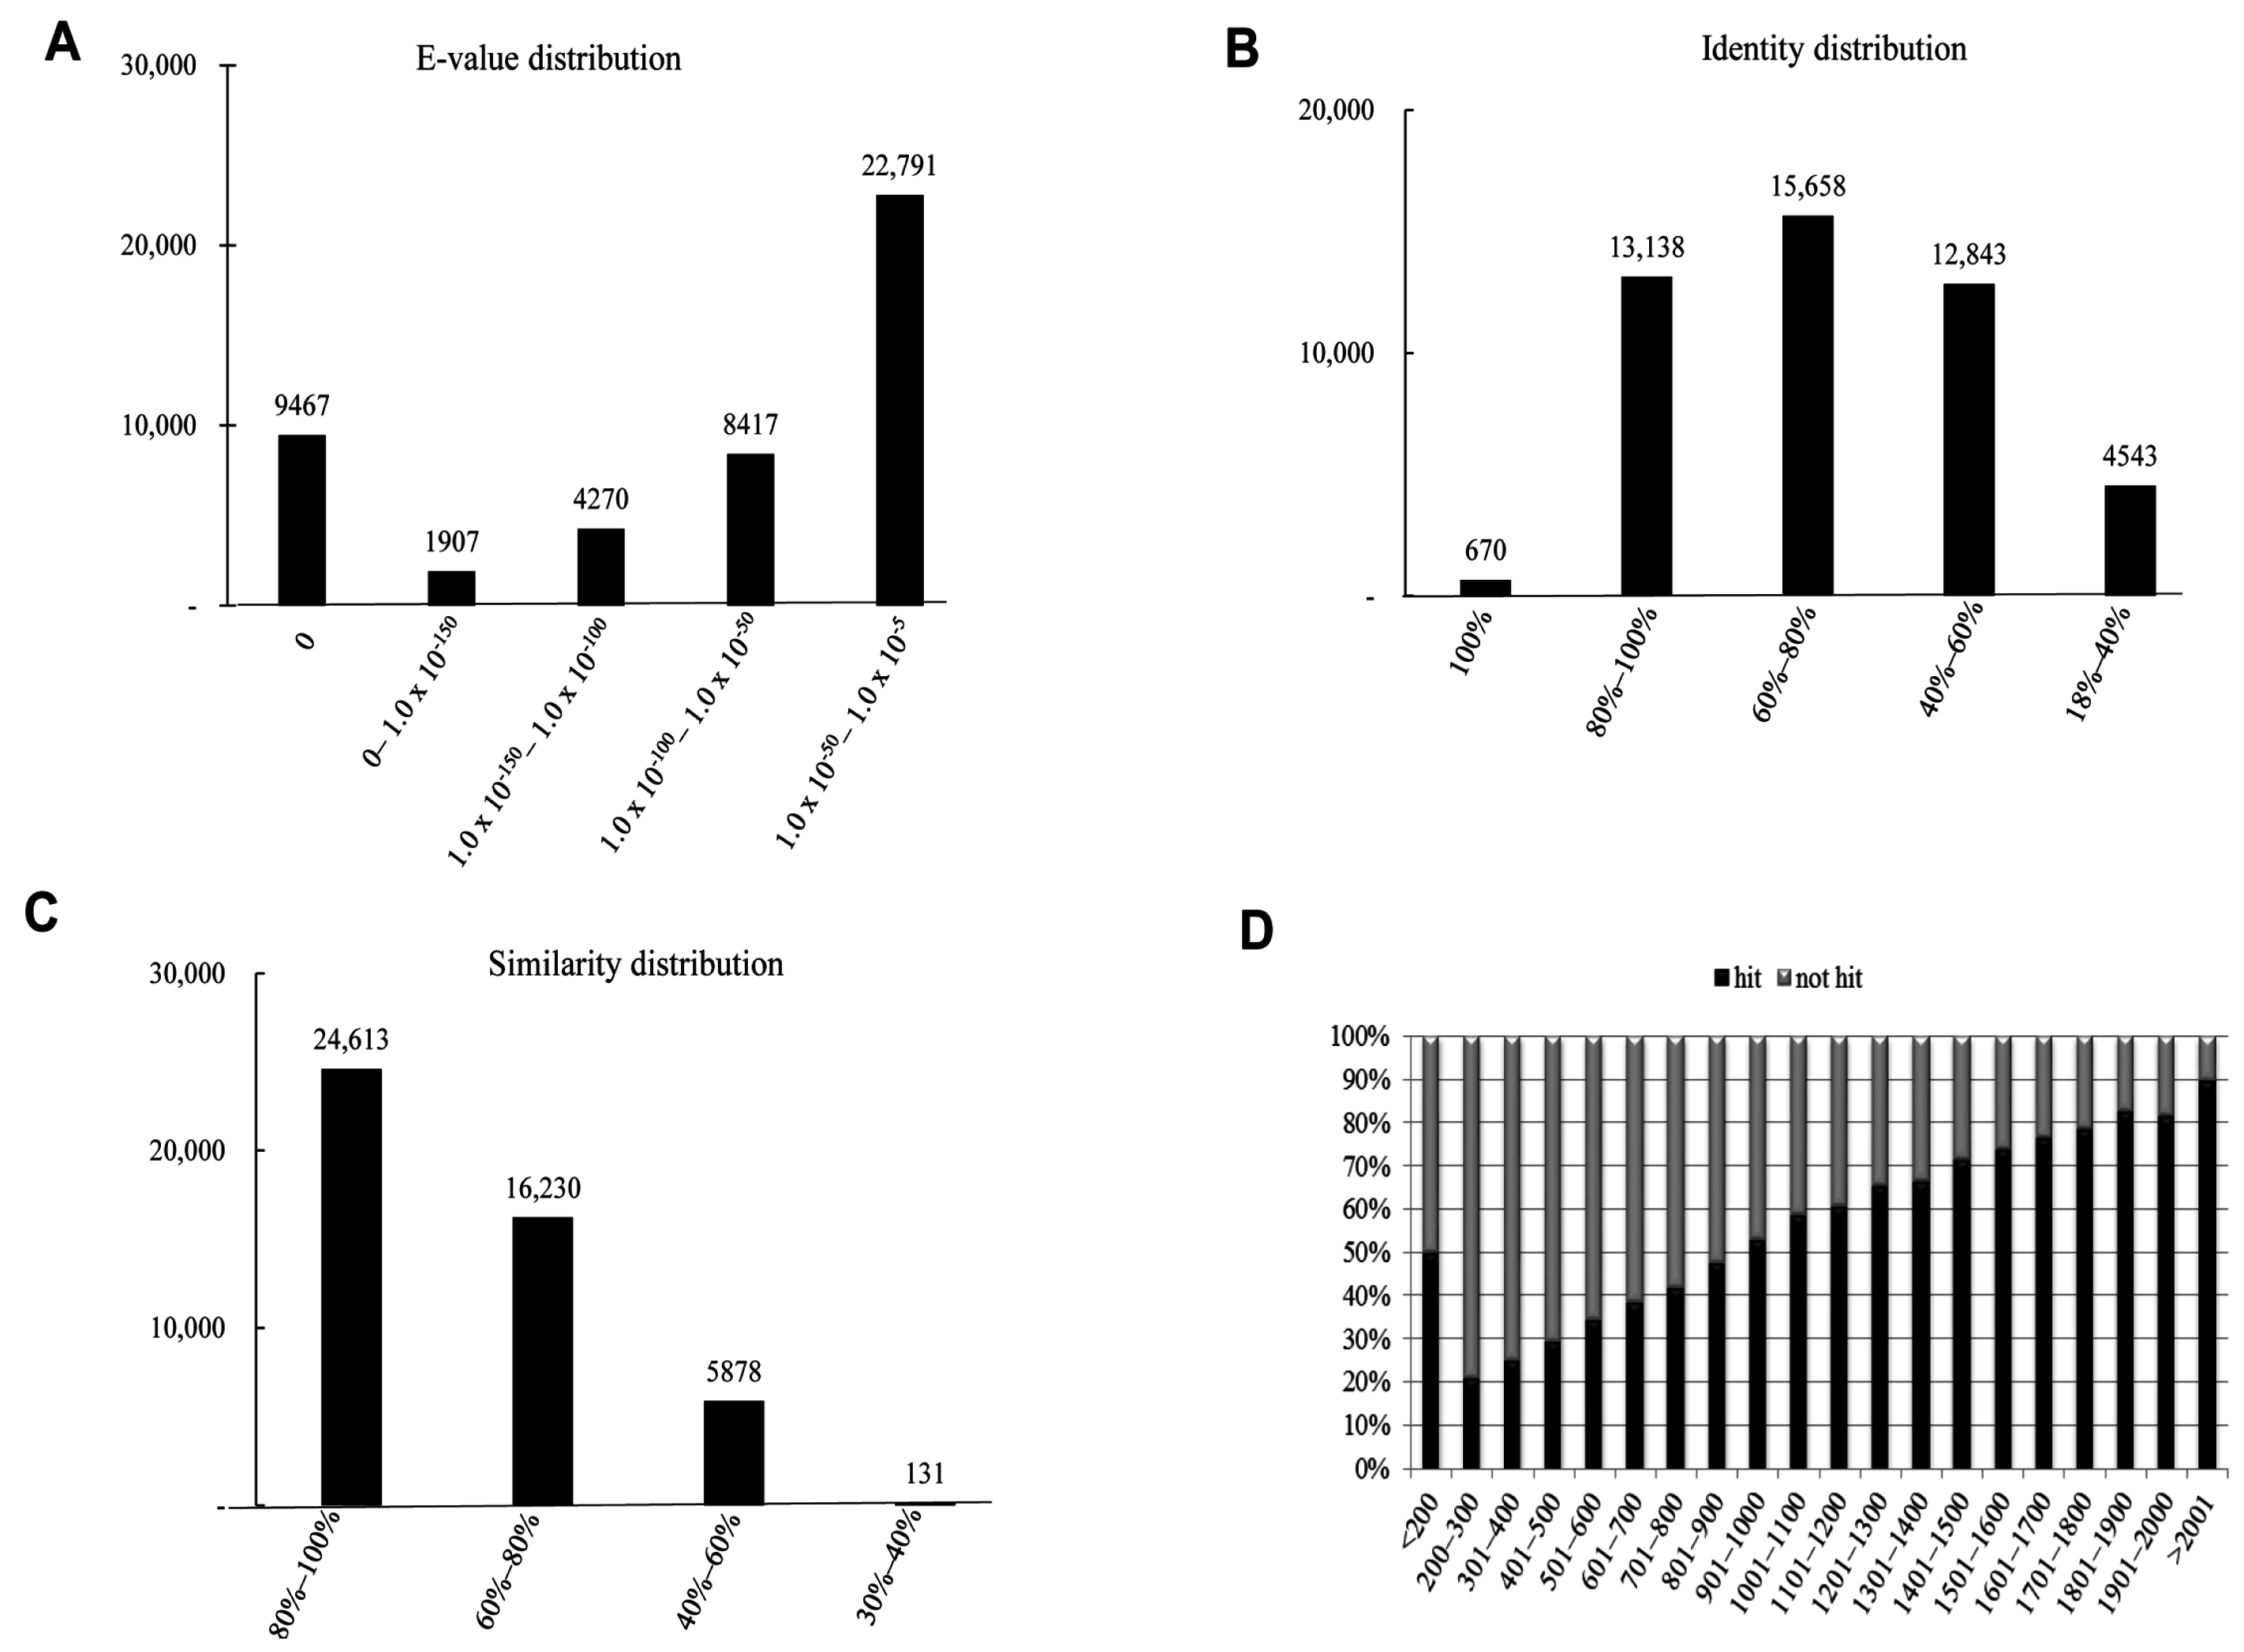

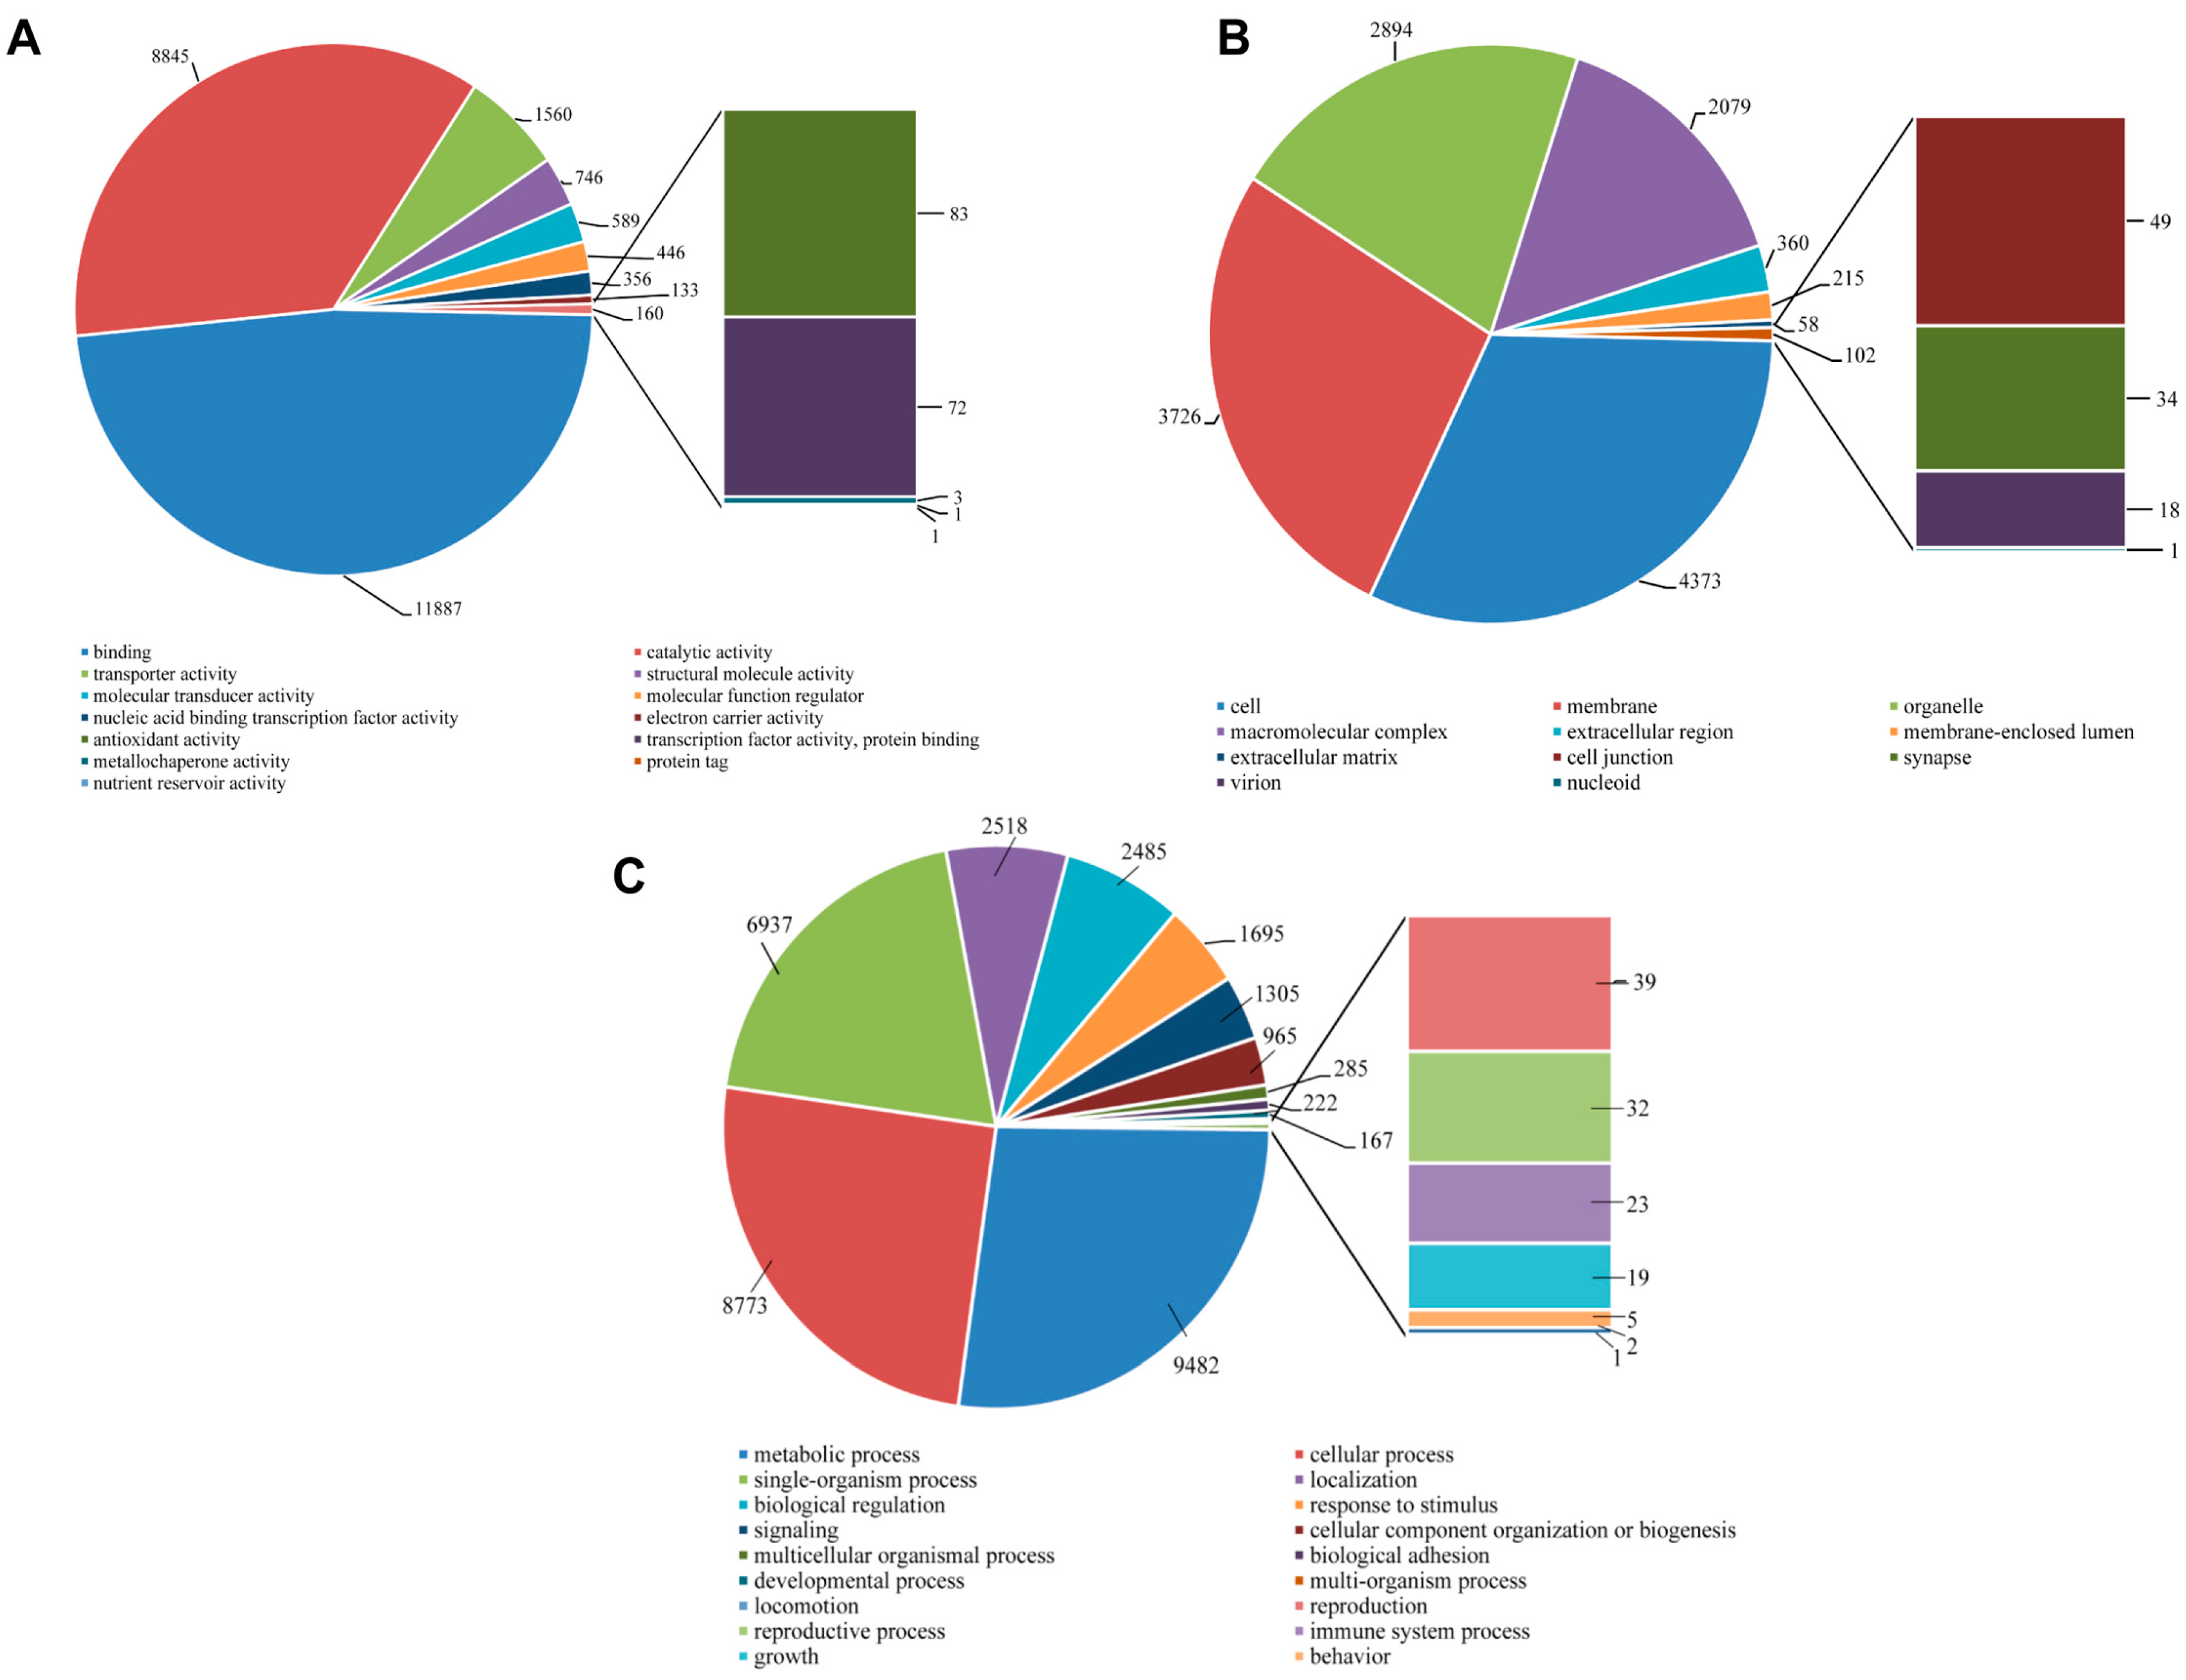
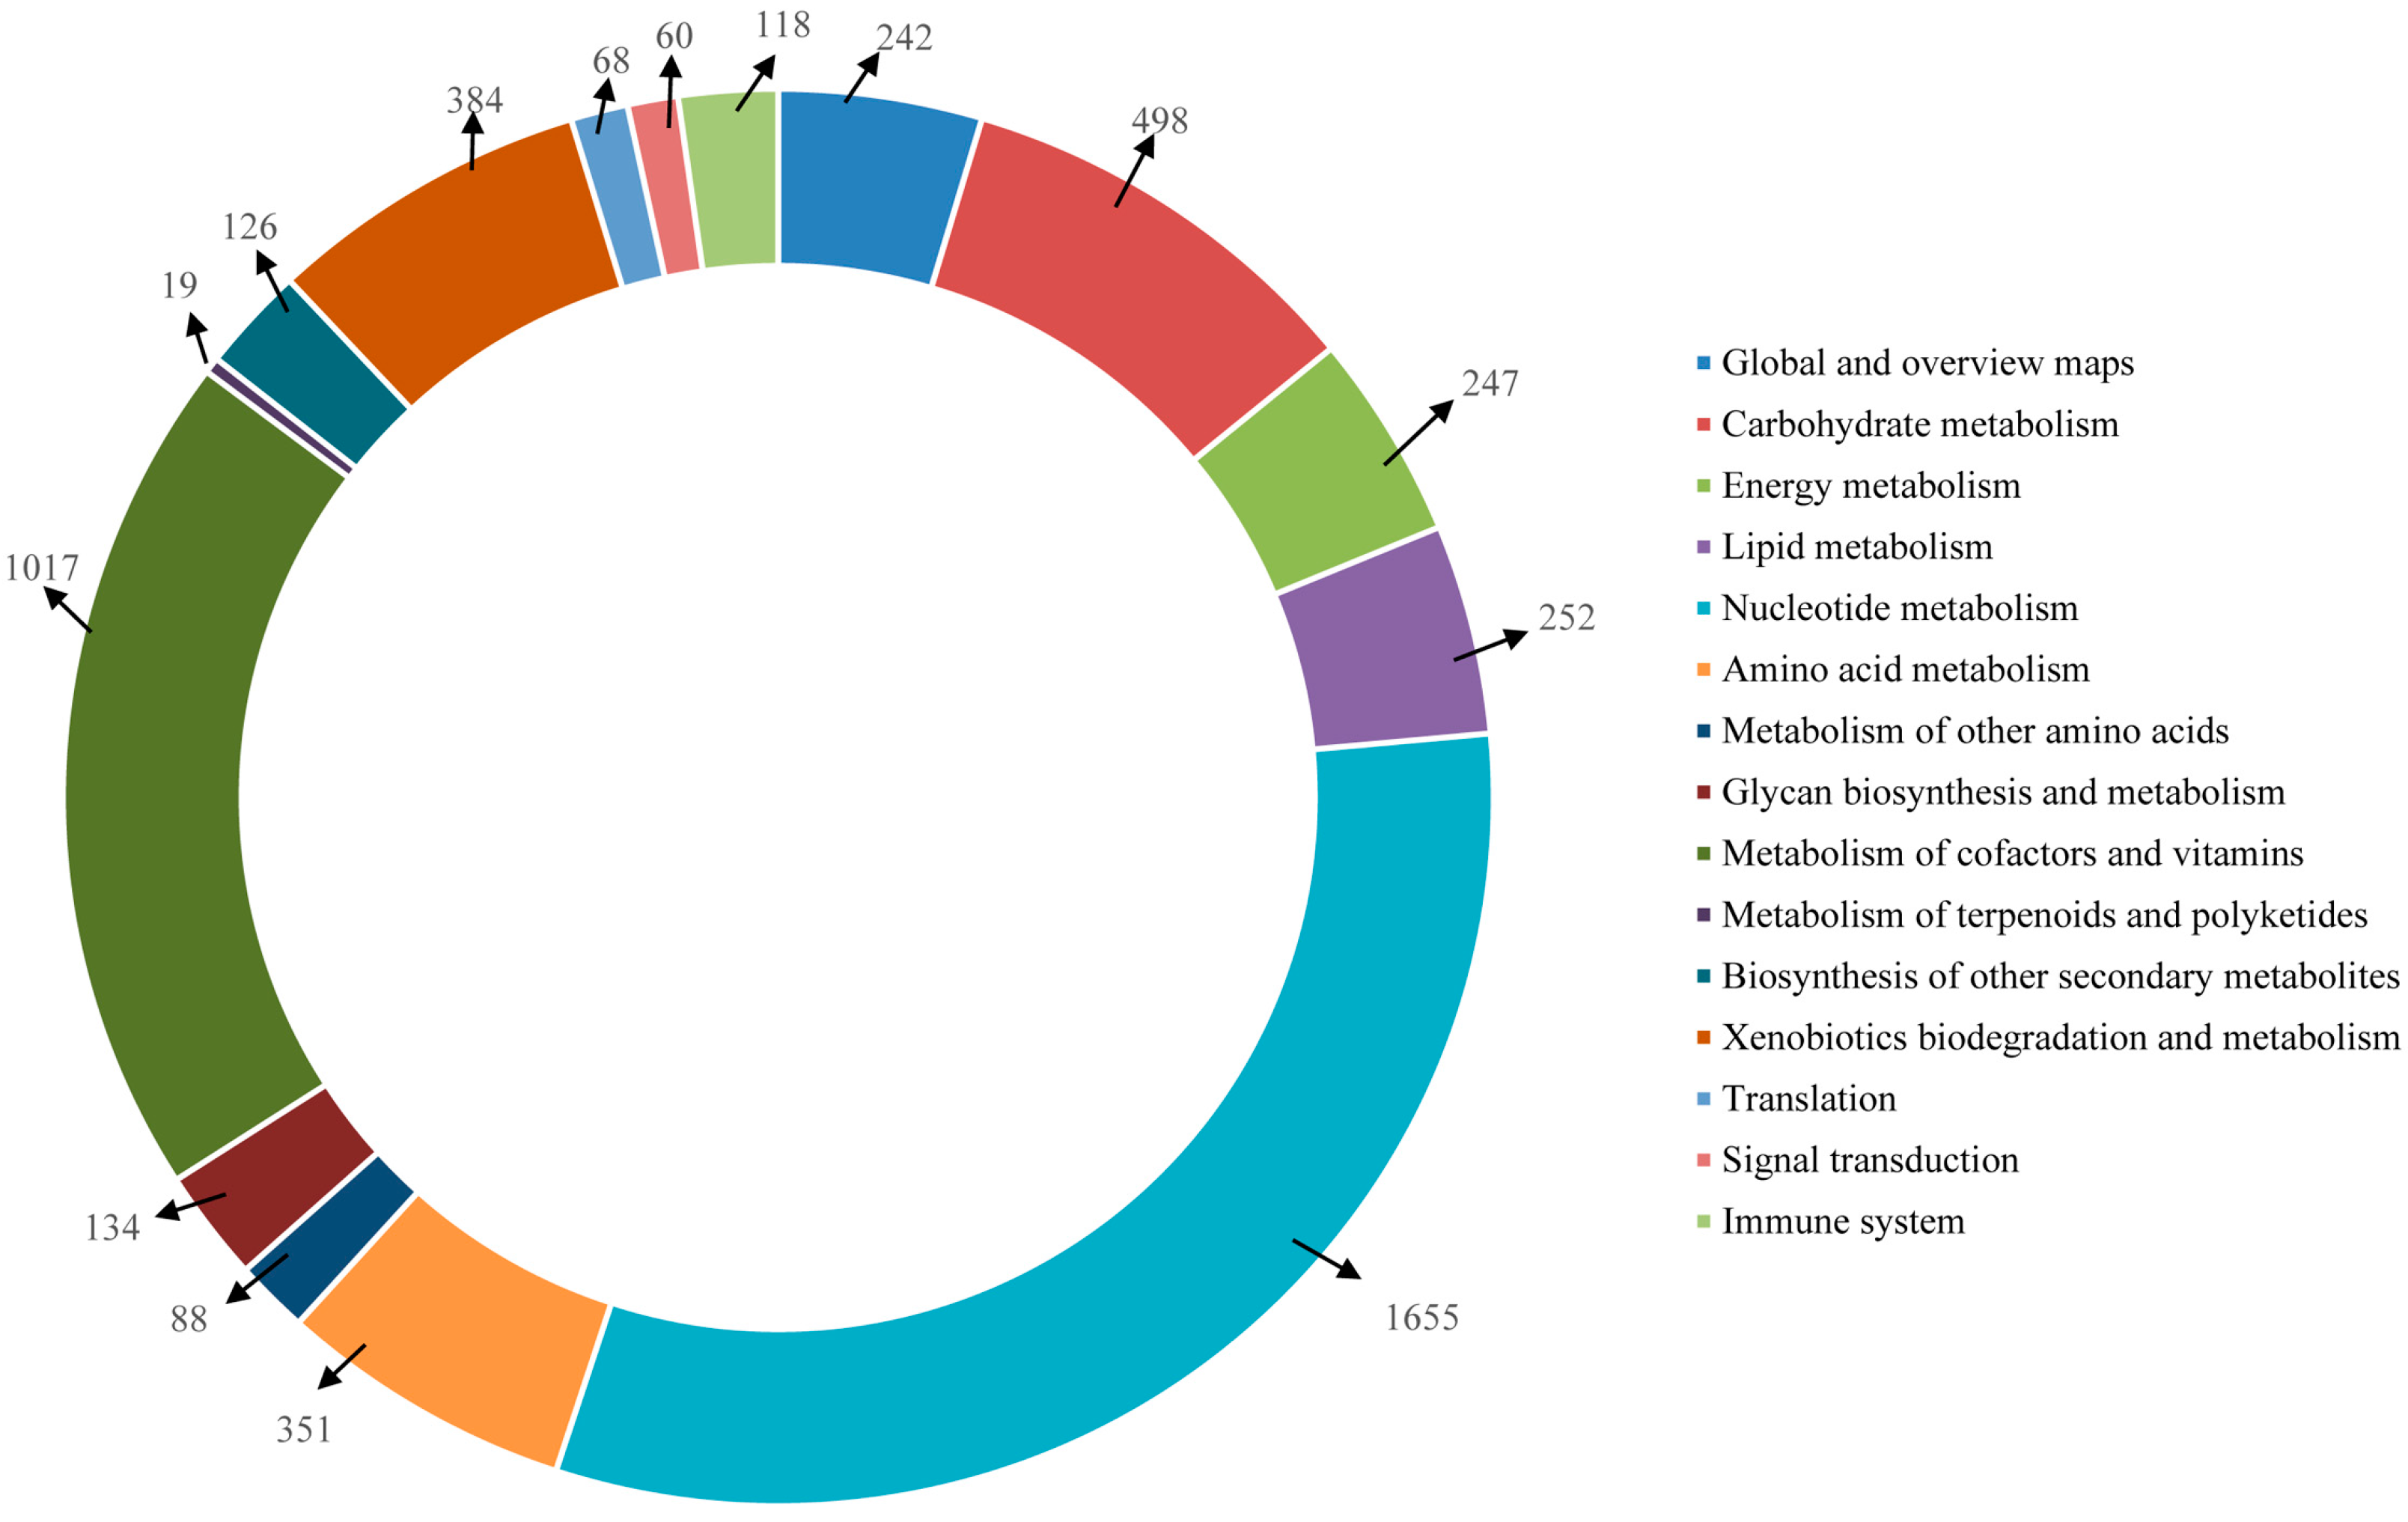
2.4. Functional Annotation Using GO and KEGG


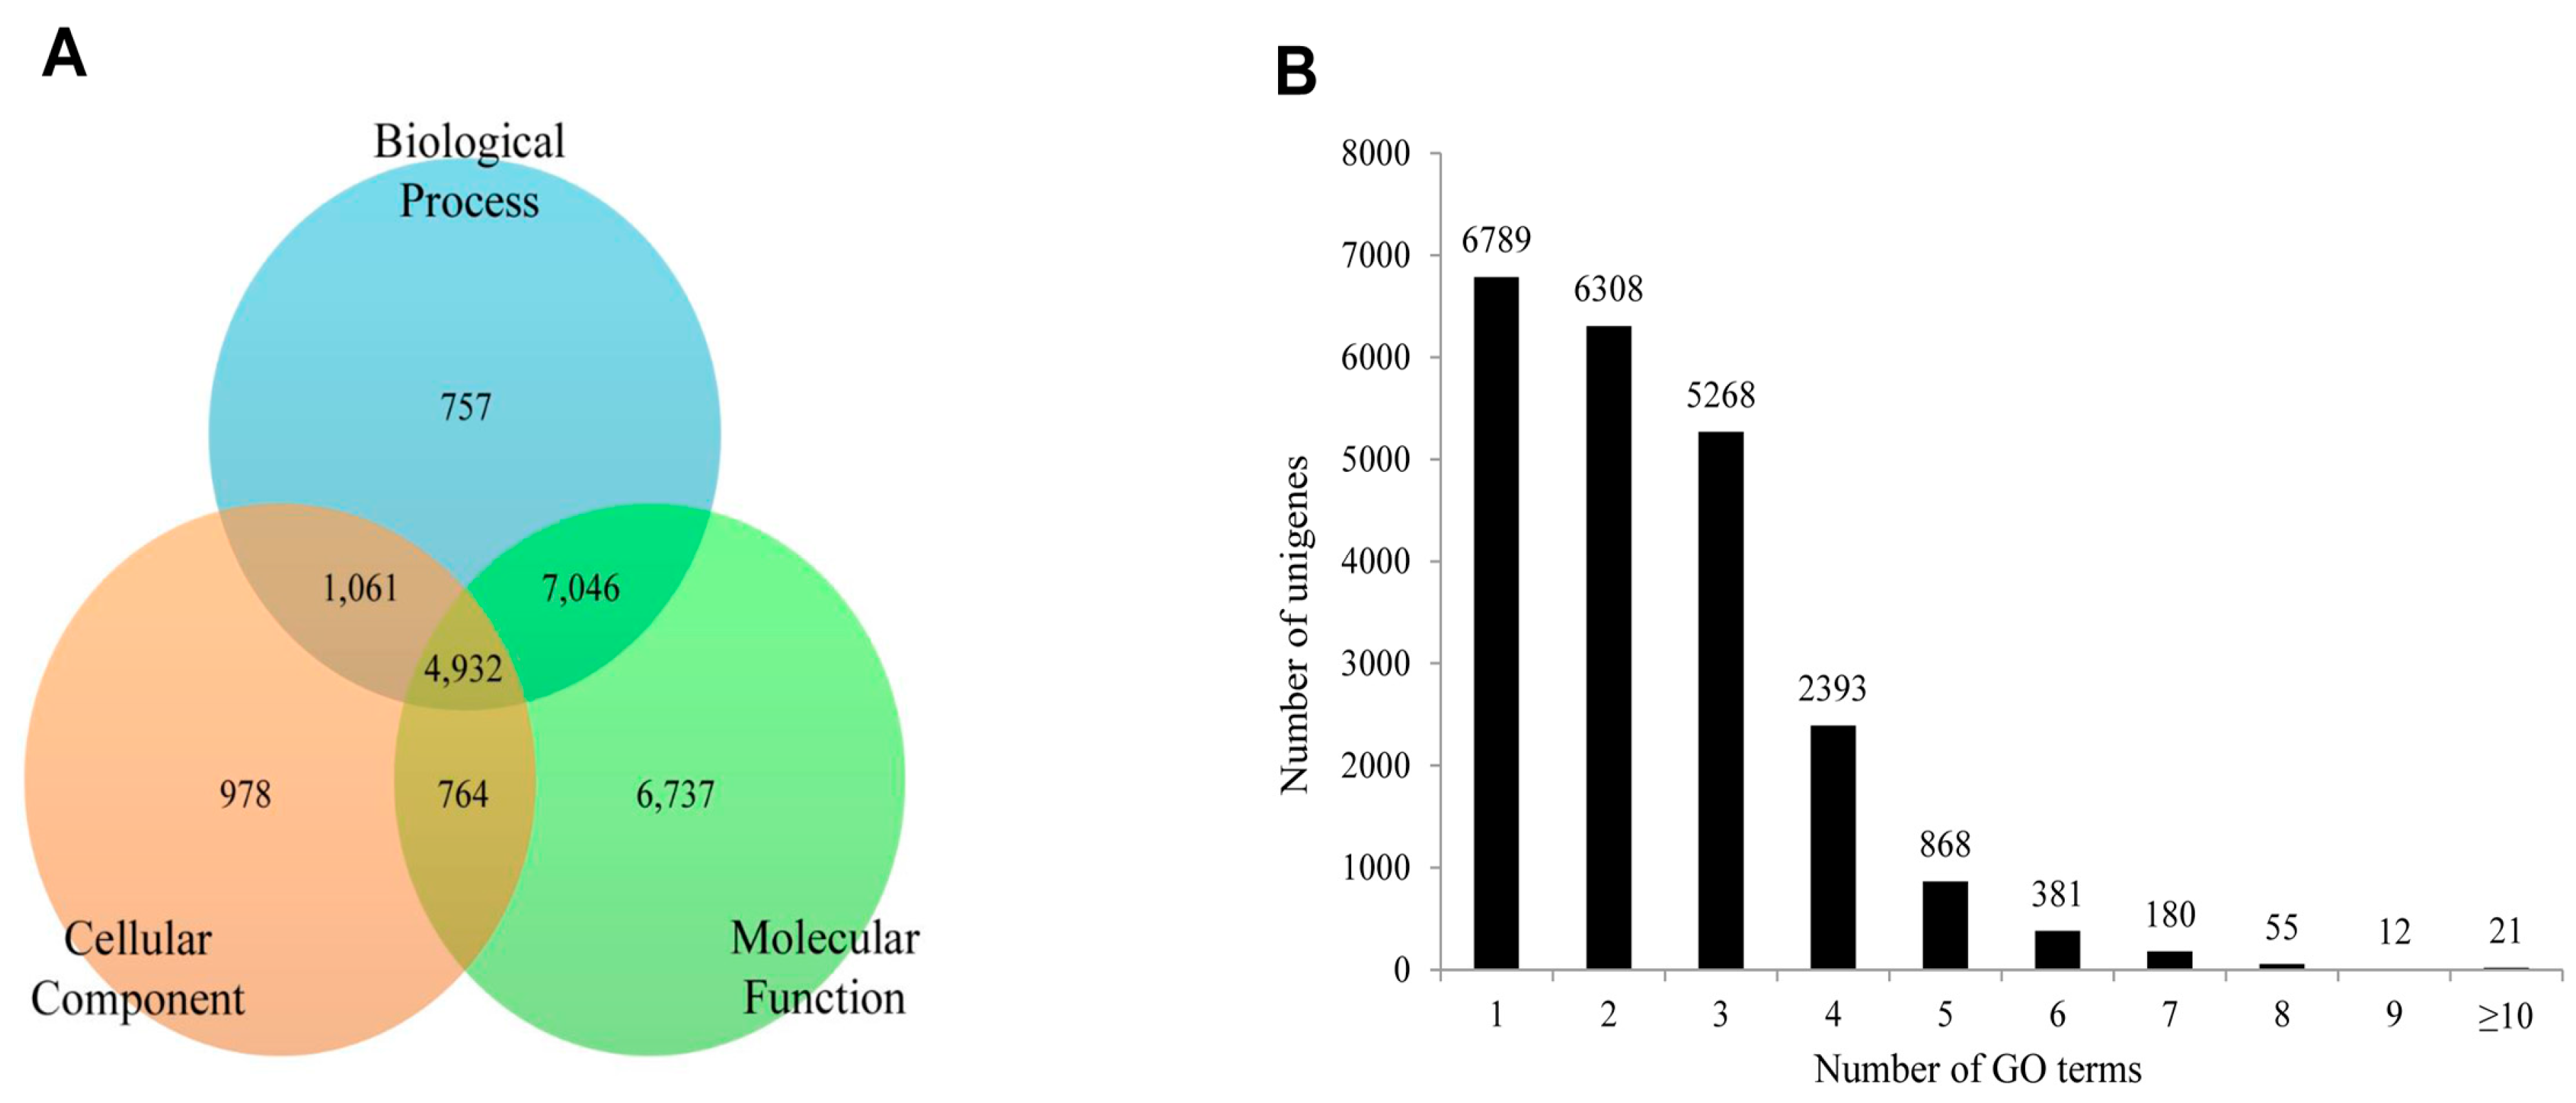

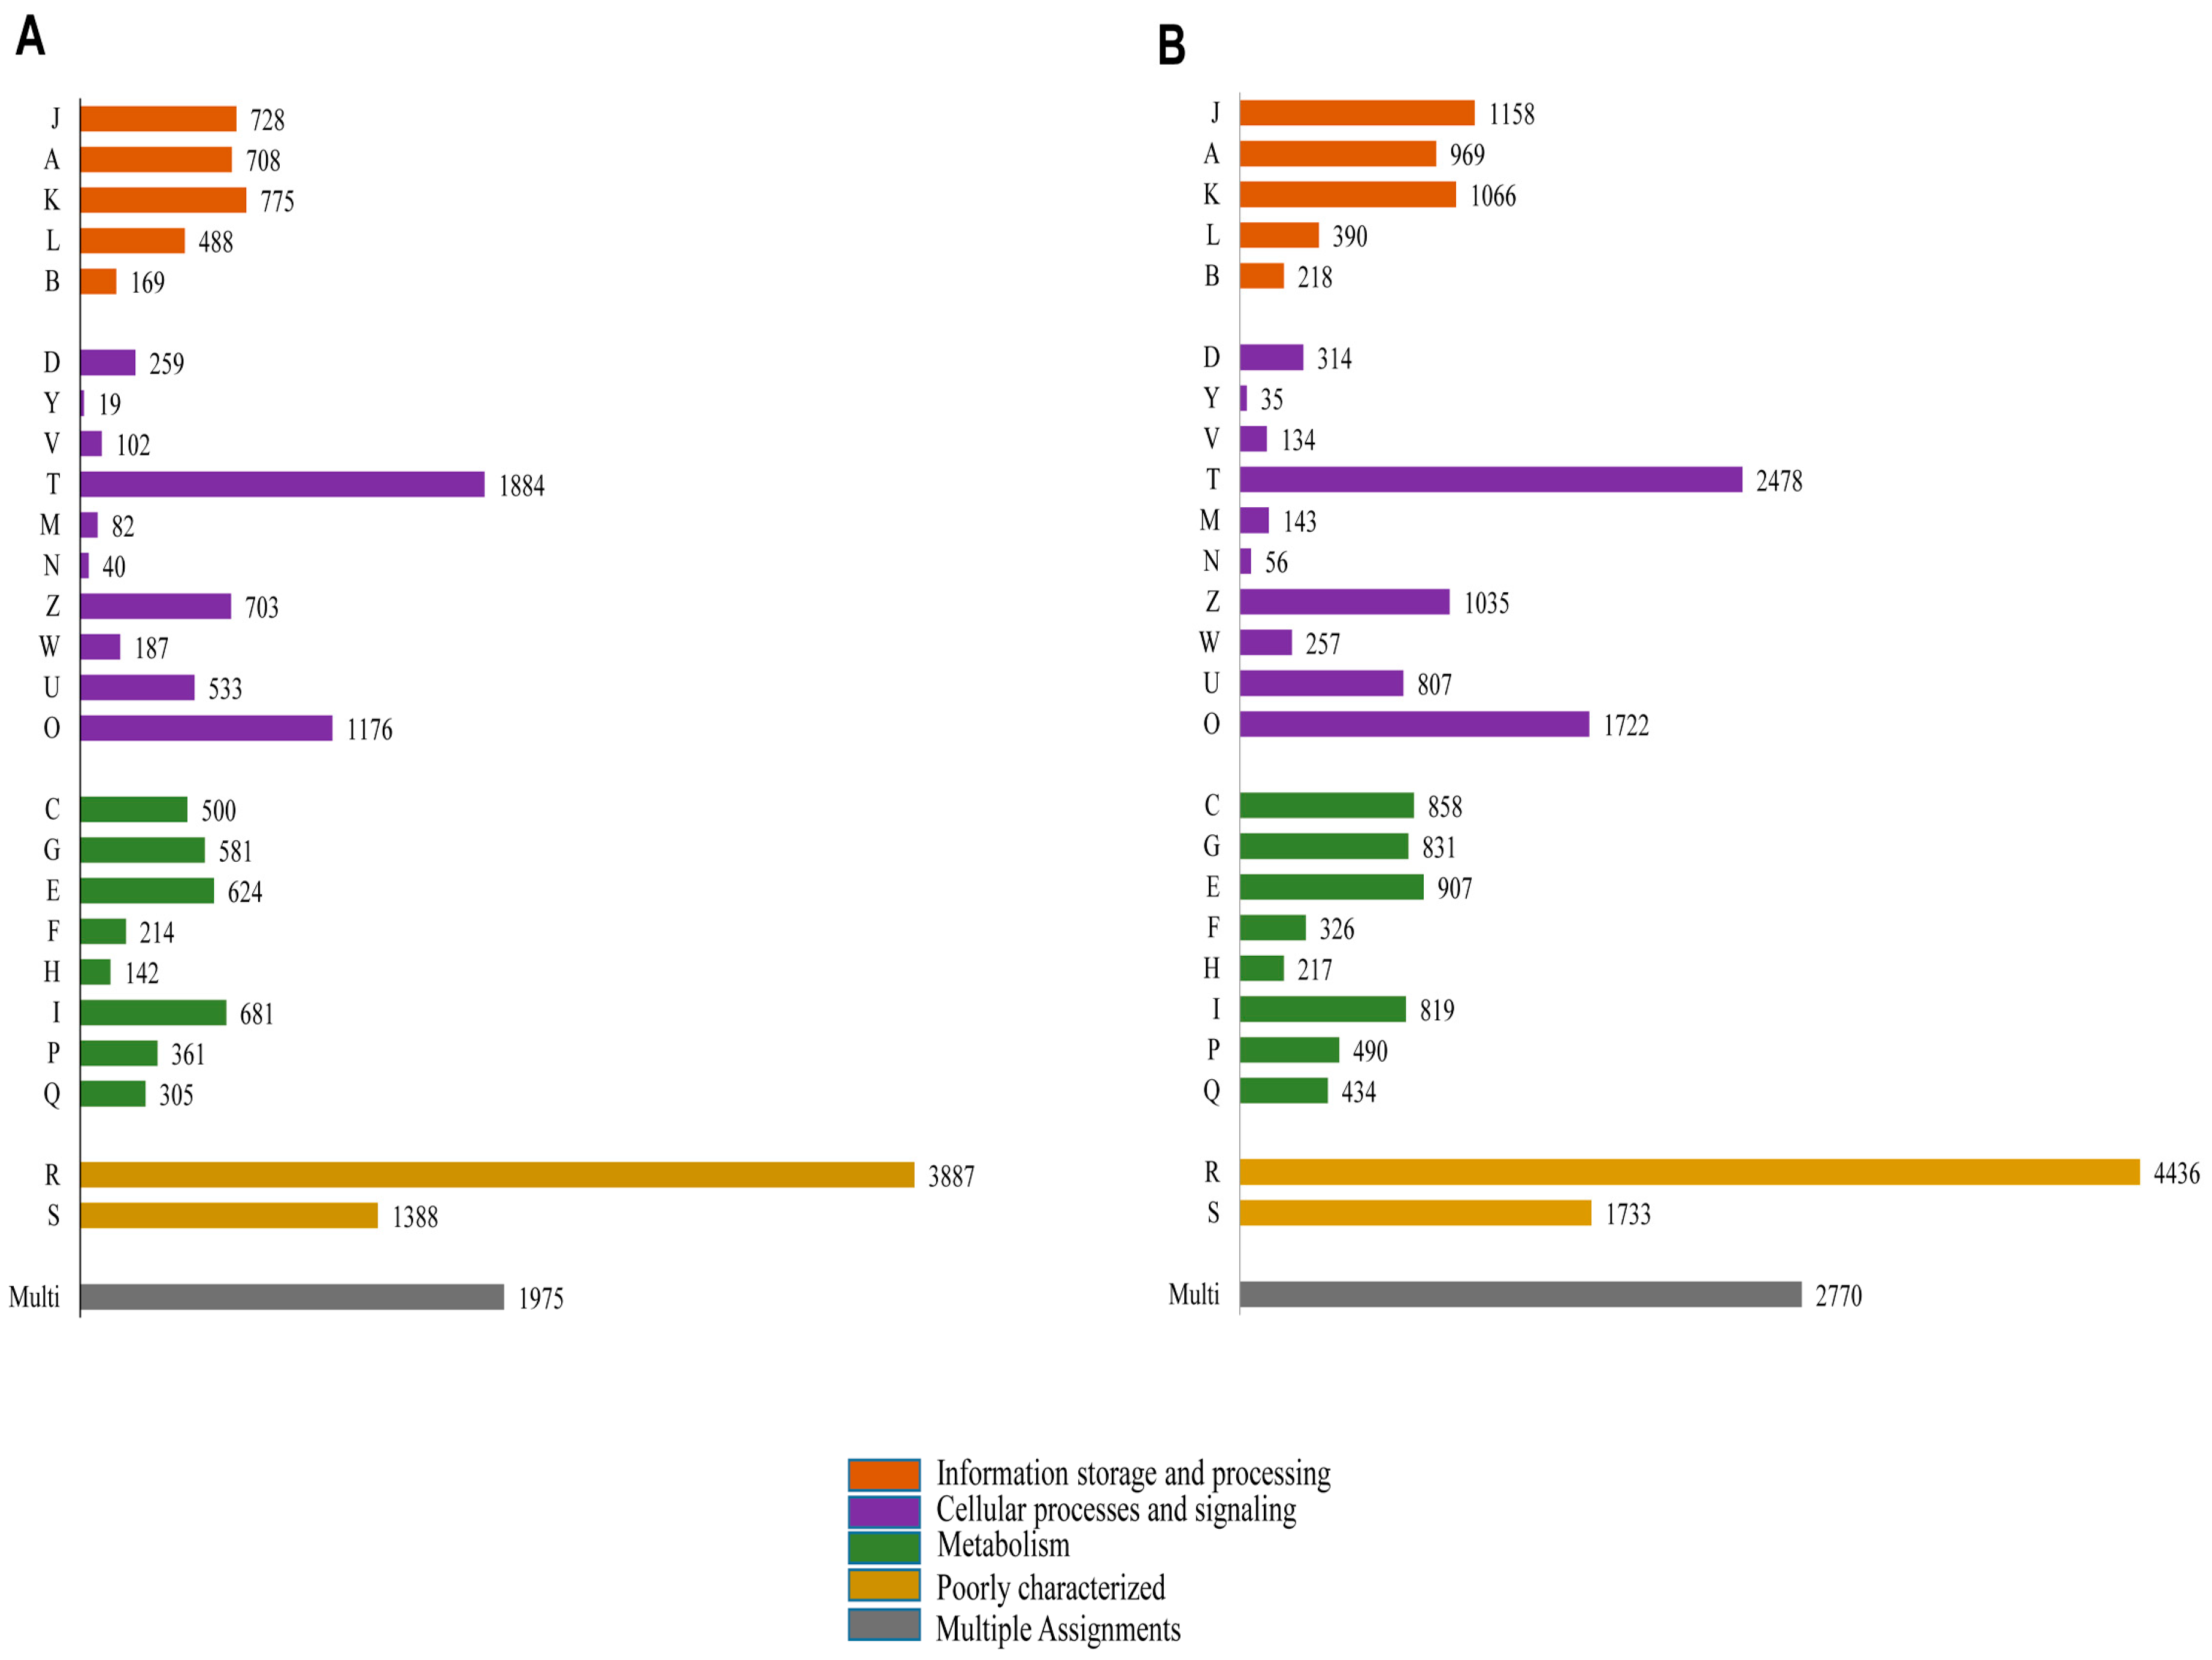
2.5. Protein Domain Analysis
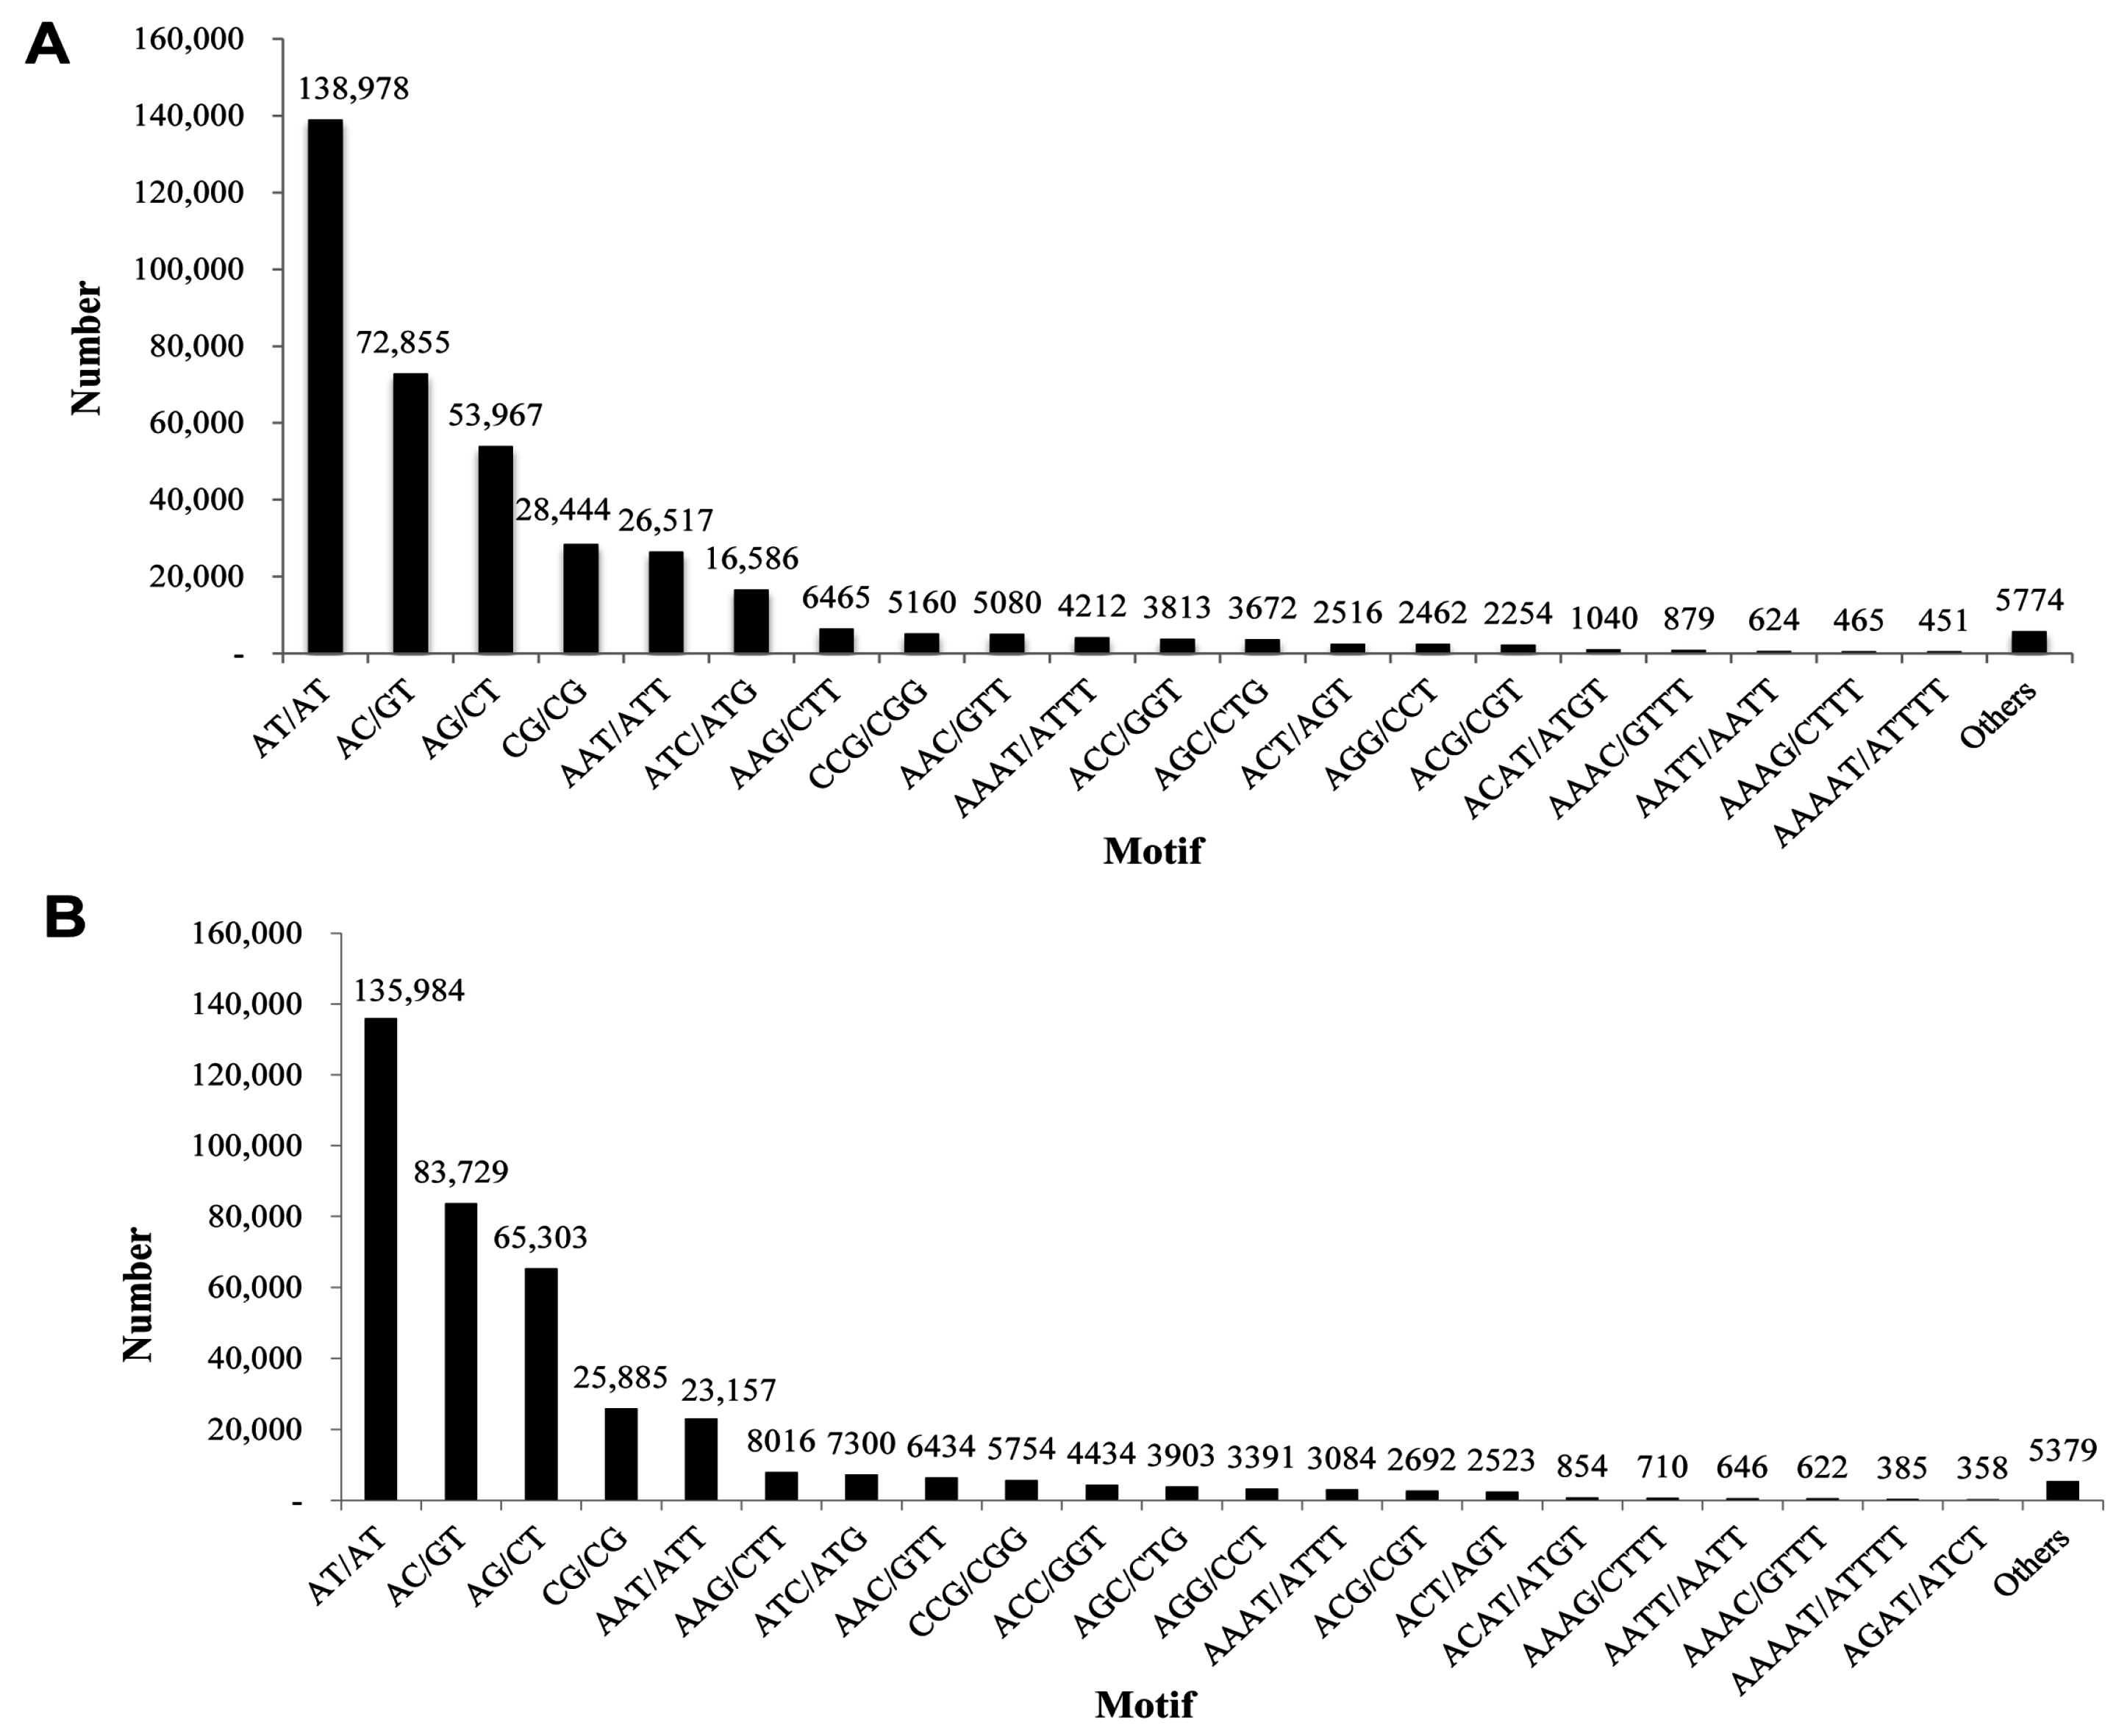
2.6. Discovery of Microsatellites
| Motif Length | Repeat Numbers | ||||||||||||||||||||
|---|---|---|---|---|---|---|---|---|---|---|---|---|---|---|---|---|---|---|---|---|---|
| 3 | 4 | 5 | 6 | 7 | 8 | 9 | 10 | 11 | 12 | 13 | 14 | 15 | 16 | 17 | 18 | 19 | 20 | ≥21 | Number # | % $ | |
| Di | 254,481 | 30,793 | 5254 | 1495 | 642 | 425 | 300 | 190 | 155 | 142 | 33 | 70 | 43 | 33 | 39 | 29 | 18 | 20 | 82 | 294,244 | 76.99 |
| Tri | 61,763 | 8858 | 2514 | 765 | 332 | 182 | 29 | 15 | 14 | 10 | 7 | 1 | 9 | 6 | 3 | 2 | 2 | 3 | 10 | 74,525 | 19.5 |
| Tetra | 8967 | 1050 | 196 | 32 | 1 | 1 | 4 | 3 | 3 | 0 | 0 | 2 | 0 | 0 | 0 | 2 | 1 | 0 | 3 | 10,265 | 2.68 |
| Penta | 2024 | 175 | 32 | 4 | 5 | 0 | 0 | 0 | 0 | 0 | 0 | 1 | 0 | 0 | 0 | 0 | 0 | 1 | 0 | 2242 | 0.59 |
| Hexa | 538 | 82 | 6 | 9 | 0 | 2 | 1 | 0 | 3 | 0 | 2 | 0 | 0 | 0 | 0 | 0 | 0 | 0 | 0 | 643 | 0.17 |
| Hepta | 156 | 14 | 3 | 3 | 1 | 3 | 1 | 2 | 1 | 0 | 0 | 0 | 1 | 1 | 0 | 0 | 0 | 0 | 0 | 186 | 0.052 |
| Octa | 55 | 1 | 2 | 0 | 0 | 0 | 1 | 0 | 0 | 0 | 0 | 0 | 0 | 0 | 0 | 0 | 0 | 0 | 0 | 59 | 0.018 |
| Total | 327,984 | 40,973 | 8007 | 2308 | 981 | 613 | 336 | 210 | 176 | 152 | 42 | 74 | 53 | 40 | 42 | 33 | 21 | 24 | 95 | 382,164 | 100.00 |
| Motif Length | Repeat Numbers | ||||||||||||||||||||
|---|---|---|---|---|---|---|---|---|---|---|---|---|---|---|---|---|---|---|---|---|---|
| 3 | 4 | 5 | 6 | 7 | 8 | 9 | 10 | 11 | 12 | 13 | 14 | 15 | 16 | 17 | 18 | 19 | 20 | ≥21 | Number # | % $ | |
| Di | 272,076 | 31,299 | 4624 | 1078 | 476 | 291 | 211 | 149 | 142 | 140 | 33 | 46 | 62 | 57 | 38 | 30 | 31 | 17 | 101 | 310,901 | 79.61 |
| Tri | 59,652 | 5834 | 1249 | 416 | 215 | 111 | 16 | 21 | 16 | 11 | 4 | 5 | 4 | 4 | 8 | 4 | 3 | 5 | 26 | 67,604 | 17.31 |
| Tetra | 7734 | 859 | 295 | 134 | 10 | 9 | 6 | 11 | 8 | 3 | 8 | 6 | 7 | 2 | 2 | 2 | 1 | 0 | 1 | 9098 | 2.33 |
| Penta | 1687 | 185 | 49 | 6 | 11 | 6 | 5 | 3 | 1 | 4 | 1 | 0 | 0 | 0 | 1 | 0 | 0 | 1 | 0 | 1960 | 0.50 |
| Hexa | 613 | 77 | 5 | 2 | 3 | 2 | 1 | 1 | 3 | 0 | 1 | 2 | 1 | 0 | 1 | 0 | 0 | 0 | 0 | 738 | 0.019 |
| Hepta | 113 | 17 | 2 | 5 | 3 | 1 | 3 | 1 | 2 | 0 | 0 | 0 | 0 | 1 | 0 | 0 | 0 | 0 | 0 | 148 | 0.003 |
| Octa | 73 | 4 | 10 | 2 | 0 | 0 | 2 | 2 | 0 | 0 | 0 | 0 | 0 | 0 | 0 | 0 | 0 | 0 | 0 | 93 | 0.002 |
| Total | 341,948 | 38,275 | 6234 | 1643 | 718 | 420 | 244 | 188 | 172 | 158 | 47 | 59 | 74 | 64 | 50 | 36 | 35 | 23 | 128 | 390,516 | 100.00 |
3. Experimental Section
3.1. Ethics Statement
3.2. Sample Preparation and Illumina Sequencing
3.3. De Novo Assembly and Annotation
3.4. Identification of cSSR Markers
4. Conclusions
Supplementary Materials
Acknowledgments
Author Contributions
Conflicts of Interest
References
- Fox, R.; Warren, M.S.; Brereton, T.M.; Roy, D.B.; Robinson, A. A new Red List of British butterflies. Insect Conserv. Divers. 2011, 4, 159–172. [Google Scholar] [CrossRef]
- Nakamura, Y. Conservation of butterflies in Japan: Status, actions and strategy. J. Insect Conserv. 2011, 15, 5–22. [Google Scholar] [CrossRef]
- IUCN. IUCB Red List of Threatened Species. Version 2010.4. Available online: http://www.iucnredlist.org (accessed on 14 July 2015).
- Van Swaay, C.; Cuttelod, A.; Collins, S.; Maes, D.; Lopez Munguira, M.; Sasic, M.; Settele, J.; Verovnik, R.; Verstrael, T.; Warren, M.; et al. European Red List of Butterflies; Publications Office of the European Union: Luxembourg, 2010. [Google Scholar]
- Choi, S.W.; Kim, S.S. The past and current status of endangered butterflies in Korea. Entomol. Sci. 2012, 15, 1–12. [Google Scholar] [CrossRef]
- National Institute of Biological Resources. Korean Red List of Threatened Species, 2nd ed.; National Institute of Biological Resources: Incheon, Korea, 2014. [Google Scholar]
- Pierce, N.E.; Braby, M.F.; Heath, A.; Lohman, D.J.; Mathew, J.; Rand, D.B.; Travassos, M.A. The ecology and evolution of ant association in the Lycaenidae (Lepidoptera). Annu. Rev. Entomol. 2002, 47, 733–771. [Google Scholar] [CrossRef] [PubMed]
- Fiedler, K. The host genera of Ant-Parasitic Lycaenidae Butterflies: A Review. 2012, 10, 153975. [Google Scholar] [CrossRef]
- Thomas, J.A.; Simcox, D.J.; Clarke, R.T. Successful conservation of a threatened Maculinea butterfly. Science 2009, 325, 80–83. [Google Scholar] [CrossRef] [PubMed]
- Bonebrake, T.C.; Ponisio, L.C.; Boggs, C.L.; Ehrlich, P.R. More than just indicators: A review of tropical butterfly ecology and conservation. Biol. Conserv. 2010, 143, 1831–1841. [Google Scholar] [CrossRef]
- Ministry of Environment. Endangered Plants and Animals in Korea; Ministry of Environment: Seoul, Korean, 2005.
- Jang, Y.J. Review on host ant of social parasitic Myrmecophiles in Korean Lycaenidae (Lepidoptera). J. Lepd. Soc. Korea 2007, 17, 29–38. [Google Scholar]
- Kim, I.; Lee, E.M.; Seol, K.Y.; Yun, E.Y.; Lee, Y.B.; Hwang, J.S.; Jin, B.R. The mitochondrial genome of the Korean hairstreak, Coreana raphaelis (Lepidoptera: Lycaenidae). Insect Mol. Biol. 2006, 15, 217–225. [Google Scholar] [CrossRef] [PubMed]
- Kim, M.J.; Kang, A.R.; Jeong, H.C.; Kim, K.G.; Kim, I. Reconstructing intraordinal relationships in Lepidoptera using mitochondrial genome data with the description of two newly sequenced lycaenids, Spindasis takanosis and Protantigius superans (Lepidoptera: Lycaenidae). Mol. Phylogenet. Evol. 2011, 61, 436–445. [Google Scholar] [CrossRef] [PubMed]
- Allendorf, F.W.; Hohenlohe, P.A.; Luikart, G. Genomics and the future of conservation genetics. Nat. Rev. Genet. 2010, 11, 697–709. [Google Scholar] [CrossRef] [PubMed]
- Hoffman, J.I.; Simpson, F.; David, P.; Rijks, J.M.; Kuiken, T.; Thorne, M.A.; Lacy, R.C.; Dasmahapatra, K.K. High throughput sequencing reveals inbreeding depression in a natural population. Proc. Natl. Acad. Sci. USA 2014, 111, 3775–3780. [Google Scholar] [CrossRef] [PubMed]
- Nagaraj, S.H.; Gasser, R.B.; Ranganathan, S. A hitchhiker’s guide to expressed sequence tag (EST) analysis. Brief. Bioinform. 2007, 8, 6–21. [Google Scholar] [CrossRef] [PubMed]
- Vera, J.C.; Wheat, C.W.; Fescemeyer, H.W.; Frilander, M.J.; Crawford, D.L.; Hanski, I.; Marden, J.H. Rapid transcriptome characterization for a nonmodel organism using 454 pyrosequencing. Mol. Ecol. 2008, 17, 1636–1647. [Google Scholar] [CrossRef] [PubMed]
- Smee, M.R.; Pauchet, Y.; Wilkinson, P.; Wee, B.; Singer, M.C.; French-Constant, R.H.; Hodgson, D.J.; Mikheyev, A.S. Microsatellites for the Marsh Fritillary Butterfly: De Novo transcriptome sequencing, and a comparison with amplified length polymorphism (AFLP) markers. PLoS ONE 2013, 8, e54721. [Google Scholar] [CrossRef] [PubMed]
- Gompert, Z.; Lucas, L.K.; Fordyce, J.A.; Forister, M.L.; Nice, C.C. Secondary contact between Lycaeides idas and L. Melissa in the Rocky Mountains: Extensive admixture and a patchy hybrid zone. Mol. Ecol. 2010, 19, 3171–3192. [Google Scholar] [CrossRef] [PubMed]
- O’Bryhim, J.; Chong, J.P.; Lance, S.L.; Jones, K.L.; Roe, K.J. Development and characterization of sixteen microsatellite markers for the federally endangered species: Leptodea leptodon (Bivalvia: Unionidae) using paired-end Illumina shotgun sequencing. Conserv. Genet. Res. 2012, 4, 787–789. [Google Scholar] [CrossRef]
- Lance, S.L.; Love, C.N.; Nunziata, S.O.; O’Bryhim, J.R.; Scott, D.E.; Flynn, R.W.; Jones, K.L. 32 species validation of a new Illumina paired-end approach for the development of microsatellites. PLoS ONE 2013, 8, e81853. [Google Scholar] [CrossRef] [PubMed]
- Zhan, S.; Merlin, C.; Boore, J.L.; Reppert, S.M. The monarch butterfly genome yields insights into long-distance migration. Cell 2011, 147, 1171–1185. [Google Scholar] [CrossRef] [PubMed]
- Grabherr, M.G.; Haas, B.J.; Yassour, M.; Levin, J.Z.; Thompson, D.A.; Amit, I.; Adiconis, X.; Fan, L.; Raychowdhury, R.; Zeng, Q.; et al. Full-length transcriptome assembly from RNA-Seq data without a reference genome. Nat. Biotechnol. 2011, 29, 644–652. [Google Scholar] [CrossRef] [PubMed]
- Xie, Y.; Wu, G.; Tang, J.; Luo, R.; Patterson, J.; Liu, S.; Huang, W.; He, G.; Gu, S.; Li, S.; et al. SOAPdenovo-Trans: De novo transcriptome assembly with short RNA-Seq reads. Bioinformatics 2014, 30, 1660–1666. [Google Scholar] [CrossRef] [PubMed]
- Birol, I.; Jackman, S.D.; Nielsen, C.B.; Qian, J.Q.; Varhol, R.; Stazyk, G.; Morin, R.D.; Zhao, Y.; Hirst, M.; Schein, J.E.; et al. De novo transcriptome assembly with ABySS. Bioinformatics 2009, 25, 2872–2877. [Google Scholar] [CrossRef] [PubMed]
- Schultz, M.H.; Zerbino, D.R.; Vinqron, M.; Birney, E. Oases: Robust de novo RNA-seq assembly across the dynamic range of expression levels. Bioinformatics 2012, 28, 1086–1092. [Google Scholar] [CrossRef] [PubMed]
- Jimenez-Guri, E.; Huerta-Cepas, J.; Cozzuto, L.; Wotton, K.R.; Kang, H.; Himmelbauer, H.; Roma, G.; Gabaldon, T.; Jaeger, J. Comparative transcriptomics of early dipteran development. BMC Genom. 2013, 14. [Google Scholar] [CrossRef] [PubMed]
- Zhou, X.; Qian, K.; Tong, Y.; Zhu, J.J.; Qiu, X.; Zeng, X. De novo transcriptome of the hemimetabolous German cockroach (Blattella germanica). PLoS ONE 2014, 9, e106932. [Google Scholar] [CrossRef] [PubMed]
- Chen, H.; Lin, L.; Xie, M.; Zhang, G.; Su, W. De novo sequencing, assembly and characterization of antennal transcriptome of Anomala corpulenta Motschulsky (Coleoptera: Rutelidae). PLoS ONE 2014, 9, e114238. [Google Scholar] [CrossRef] [PubMed]
- Riesgo, A.; Andrade, S.C.S.; Sharma, P.P.; Novo, M.; Perez-Porro, A.R.; Vahtera, V.; Gonzalez, V.L.; Kawauchi, G.Y.; Giribet, G. Comparative description of ten transcriptomes of newly sequenced invertebrates and efficiency estimation of genomic sampling in non-model taxa. Front. Zool. 2012, 9. [Google Scholar] [CrossRef] [PubMed]
- Wang, X.J.; Xu, R.H.; Wang, R.I.; Liu, A.Z. Transcriptome analysis of Sacha Inchi (Plukenetia volubilis L.) seeds at two developmental stages. BMC Genom. 2012, 13. [Google Scholar] [CrossRef] [PubMed]
- Vogel, H.; Altincicek, B.; Glockner, G.; Vilcinskas, A. A comprehensive transcriptome and immune-gene repertoire of the lepidopteran model host Galleria mellonella. BMC Genom. 2011, 12. [Google Scholar] [CrossRef] [PubMed]
- De Assis Fonseca, F.C.; Firmino, A.A.P.; de Macedo, L.L.P.; Coelho, R.R.; de Sousa Junior, J.D.A.; Silva-Junior, O.B.; Togawa, R.C.; Pappas Junior, G.J.; Brandao de Gois, L.A.; Mattar da Silva, M.C.; et al. Sugarcane giant borer transcriptome analysis and identification of genes related to digestion. PLoS ONE 2015, 10, e0118231. [Google Scholar] [CrossRef] [PubMed]
- Nirmala, X.; Schetelig, M.F.; Yu, F.; Handler, A.M. An EST database of the Caribbean fruit fly, Anastrepha suspense (Diptera: Tephritidae). Gene 2013, 517, 212–217. [Google Scholar] [CrossRef] [PubMed]
- Rhee, S.Y.; Wood, V.; Dolinski, K.; Draghici, S. Use and misuse of the gene ontology annotations. Nat. Rev. Genet. 2008, 9, 509–515. [Google Scholar] [CrossRef] [PubMed]
- Tanaka, H.; Ishibashi, J.; Fujita, K.; Nakajima, Y.; Sagisaka, A.; Tomimoto, K.; Suzuki, N.; Yoshiyama, M.; Kaneko, Y.; Iwasaki, T.; et al. A genome-wide analysis of genes and gene families involved in innate immunity of Bombyx mori. Insect Biochem. Mol. Biol. 2008, 38, 1087–1110. [Google Scholar] [CrossRef] [PubMed]
- Rao, X.J.; Cao, X.; He, Y.; Hu, Y.; Zhang, X.; Chen, Y.R.; Blissard, G.; Kanost, M.R.; Yu, X.Q.; Jiang, H. Structural features, evolutionary relationships, and transcriptional regulation of C-type lectin-domain proteins in Manduca sexta. Insect Biochem. Mol. Biol. 2015, 62, 75–85. [Google Scholar] [CrossRef] [PubMed]
- Zagrobelny, M.; Scheibye-Alsing, K.; Jensen, N.B.; Moller, B.L.; Gorodkin, J.; Bak, S. 454 pyrosequencing based transcriptome analysis of Zygaena filipendulae with focus on genes involved in biosynthesis of cyanogenic glucosides. BMC Genom. 2009, 10. [Google Scholar] [CrossRef] [PubMed]
- Bai, X.D.; Mamidala, P.; Rajarapu, S.P.; Jones, S.C.; Mittapalli, O. Transcriptomics of the bed bug (Cimex lectularius). PLoS ONE 2011, 6, e16336. [Google Scholar] [CrossRef] [PubMed]
- Brayer, K.J.; Segal, D.J. Keep your fingers off my DNA: Protein-protein interactions mediated by C2H2 zinc finger domains. Cell Biochem. Biophys. 2008, 50, 111–131. [Google Scholar] [CrossRef] [PubMed]
- Seetharam, A.; Bai, Y.; Stuart, G.W. A survey of well conserved families of C2H2 zinc-finger genes in Daphnia. BMC Genom. 2010, 11. [Google Scholar] [CrossRef] [PubMed]
- Altincicek, B.; Vilcinskas, A. Identification of immune-related genes from an apterygote insect, the firebrat Thermobia domestica. Insect Biochem. Mol. Biol. 2007, 37, 726–731. [Google Scholar] [CrossRef] [PubMed]
- Jung, H.; Lyons, R.E.; Dinh, H.; Hurwood, D.A.; McWilliam, S.; Mather, P.B. Transcriptomics of a giant freshwater prawn (Macrobrachium rosenbergii): De novo assembly, annotation and marker discovery. PLoS ONE 2011, 6, e27938. [Google Scholar] [CrossRef] [PubMed]
- Teichmann, S.A.; Chothia, C. Immunoglobulin superfamily proteins in Caenorhabditis elegans. J. Mol. Biol. 2000, 296, 1367–1383. [Google Scholar] [CrossRef] [PubMed]
- Meng, X.; Zhang, Y.; Bao, H.; Liu, Z. Sequence analysis of insecticide action and detoxification-related genes in the insect pest natural enemy Pardosa pseudoannulata. PLoS ONE 2015, 10, e0125242. [Google Scholar] [CrossRef] [PubMed]
- Zhu, J.Y.; Wu, G.X.; Yang, B. High-throughput discovery of SSR genetic markers in the yellow mealworm beetle, Tenebrio molitor (Coleoptera: Tenebrionidae), from its transcriptome database. Acta Entomol. Sin. 2013, 56, 724–728. [Google Scholar]
- Mikheyev, A.S.; Vo, T.; Wee, B.; Singer, M.C.; Parmesan, C. Rapid microsatellite isolation from a butterfly by de novo transcriptome sequencing: Performance and a comparison with AFLP-derived distances. PLoS ONE 2010, 5, e11212. [Google Scholar] [CrossRef] [PubMed]
- Zalapa, J.E.; Cuevas, H.; Zhu, H.; Steffan, S.; Senalik, D.; Zeldin, E.; McCown, B.; Harbut, R.; Simon, P. Using next-generation sequencing approaches to isolate simple sequence repeat (SSR) loci in the plant sciences. Am. J. Bot. 2012, 99, 193–208. [Google Scholar] [CrossRef] [PubMed]
- Miller, A.D.; Good, R.T.; Coleman, R.A.; Lancaster, M.L.; Weeks, A.R. Microsatellite loci and the complete mitochondrial DNA sequence characterized through next generation sequencing and de novo assembly for the critically endangered orange-bellied parrot, Neophema chrysogaster. Mol. Biol. Rep. 2013, 40, 35–42. [Google Scholar] [CrossRef] [PubMed]
- Zhang, S.H.; Luo, H.; Du, H.; Wang, D.Q.; Wei, Q.W. Isolation and characterization of twenty-six microsatellite loci for the tetraploid fish Dabry’s sturgeon (Acipenser dabryanus). Conserv. Genet. Res. 2013, 5, 409–412. [Google Scholar] [CrossRef]
- Feldmeyer, B.; Wheat, C.W.; Krezdorn, N.; Rotter, B.; Pfenninger, M. Short read Illumina data for the de novo assembly of a non-model snail species transcriptome (Radix balthica, Basommatophora, Pulmonata), and a comparison of assembler performance. BMC Genom. 2011, 12. [Google Scholar] [CrossRef] [PubMed]
- Martin, M. Cutadapt removes adapter sequences from high-throughput sequencing reads. EMBnet J. 2011, 17, 10–12. [Google Scholar] [CrossRef]
- Jiang, H.; Lei, R.; Ding, S.-W.; Zhu, S. Skewer: A fast and accurate adapter trimmer for next-generation sequencing paired-end reads. BMC Bioinform. 2014, 15, 182. [Google Scholar] [CrossRef] [PubMed]
- Pertea, G.; Huang, X.; Liang, F.; Antonescu, V.; Sultana, R.; Karamycheva, S.; Lee, Y.; White, J.; Cheung, F.; Parvizi, B.; et al. TIGR Gene Indices clustering tools (TGICL): A software system for fast clustering of large EST datasets. Bioinformatics 2003, 19, 651–652. [Google Scholar] [CrossRef] [PubMed]
- Kang, S.W.; Patnaik, B.B.; Hwang, H.J.; Park, S.Y.; Lee, J.S.; Han, Y.S.; Lee, Y.S. PANM DB (Protostome DB) for the annotation of NGS data of mollusks. Korean J. Malacol. 2015, 31, 243–247. [Google Scholar] [CrossRef]
- UniGene. Available online: ftp://ftp.ncbi.nih.gov/repository/UniGene/ (accessed on 17 July 2015).
- Tatusov, R.L.; Fedorova, N.D.; Jackson, J.D.; Jacobs, A.R.; Kiryutin, B.; Koonin, E.V.; Krylov, D.M.; Mazumder, R.; Mekhedov, S.L.; Nikolskaya, A.N.; et al. The COG database: An updated version includes eukaryotes. BMC Bioinform. 2003, 4. [Google Scholar] [CrossRef]
- Kanehisa, M.; Goto, S.; Kawashima, S.; Okuno, Y.; Hattori, M. The KEGG resource for deciphering the genome. Nucleic Acids Res. 2004, 32, 277–280. [Google Scholar] [CrossRef] [PubMed]
- Oliveros, J.C. VENNY: An Interactive Tool for Comparing List with Venn Diagram. VENNY Website. Available online: http://bioinfogp.cnb.csic.es/tools/venny/index.html (accessed on 25 August 2015).
- Consea, A.; Gotz, S.; Garcia-Gomez, J.; Terol, J.; Talon, M.; Robles, M. BLAST2GO: A universal tool for annotation, visualization and analysis in functional genomics research. Bioinformatics 2005, 21, 3674–3676. [Google Scholar] [CrossRef] [PubMed]
- Quevillon, E.; Silventoinen, V.; Pillai, S.; Harte, N.; Mulder, N.; Apweiler, R.; Lopez, R. InterProScan: Protein domains identifier. Nucleic Acids Res. 2005, 33, 116–120. [Google Scholar] [CrossRef] [PubMed]
- MISA-MicroSAtellite Identification Tool. Available online: http://pgrc.ipk-gatersleben.de/misa/ (accessed on 21 August 2015).
- You, F.M.; Huo, N.; Gu, Y.Q.; Luo, M.C.; Ma, Y.; Hane, D.; Lazo, G.R.; Dvorak, J.; Anderson, O.D. BatchPrimer3: A high throughput web application for PCR and sequencing primer design. BMC Bioinform. 2008, 9. [Google Scholar] [CrossRef] [PubMed]
© 2015 by the authors; licensee MDPI, Basel, Switzerland. This article is an open access article distributed under the terms and conditions of the Creative Commons by Attribution (CC-BY) license (http://creativecommons.org/licenses/by/4.0/).
Share and Cite
Patnaik, B.B.; Hwang, H.-J.; Kang, S.W.; Park, S.Y.; Wang, T.H.; Park, E.B.; Chung, J.M.; Song, D.K.; Kim, C.; Kim, S.; et al. Transcriptome Characterization for Non-Model Endangered Lycaenids, Protantigius superans and Spindasis takanosis, Using Illumina HiSeq 2500 Sequencing. Int. J. Mol. Sci. 2015, 16, 29948-29970. https://doi.org/10.3390/ijms161226213
Patnaik BB, Hwang H-J, Kang SW, Park SY, Wang TH, Park EB, Chung JM, Song DK, Kim C, Kim S, et al. Transcriptome Characterization for Non-Model Endangered Lycaenids, Protantigius superans and Spindasis takanosis, Using Illumina HiSeq 2500 Sequencing. International Journal of Molecular Sciences. 2015; 16(12):29948-29970. https://doi.org/10.3390/ijms161226213
Chicago/Turabian StylePatnaik, Bharat Bhusan, Hee-Ju Hwang, Se Won Kang, So Young Park, Tae Hun Wang, Eun Bi Park, Jong Min Chung, Dae Kwon Song, Changmu Kim, Soonok Kim, and et al. 2015. "Transcriptome Characterization for Non-Model Endangered Lycaenids, Protantigius superans and Spindasis takanosis, Using Illumina HiSeq 2500 Sequencing" International Journal of Molecular Sciences 16, no. 12: 29948-29970. https://doi.org/10.3390/ijms161226213
APA StylePatnaik, B. B., Hwang, H.-J., Kang, S. W., Park, S. Y., Wang, T. H., Park, E. B., Chung, J. M., Song, D. K., Kim, C., Kim, S., Lee, J. B., Jeong, H. C., Park, H. S., Han, Y. S., & Lee, Y. S. (2015). Transcriptome Characterization for Non-Model Endangered Lycaenids, Protantigius superans and Spindasis takanosis, Using Illumina HiSeq 2500 Sequencing. International Journal of Molecular Sciences, 16(12), 29948-29970. https://doi.org/10.3390/ijms161226213


