
Global Profiling of Various Metabolites in Platycodon grandiflorum by UPLC-QTOF/MS

 , ,
, ,
Abstract
:1. Introduction
2. Results and Discussion
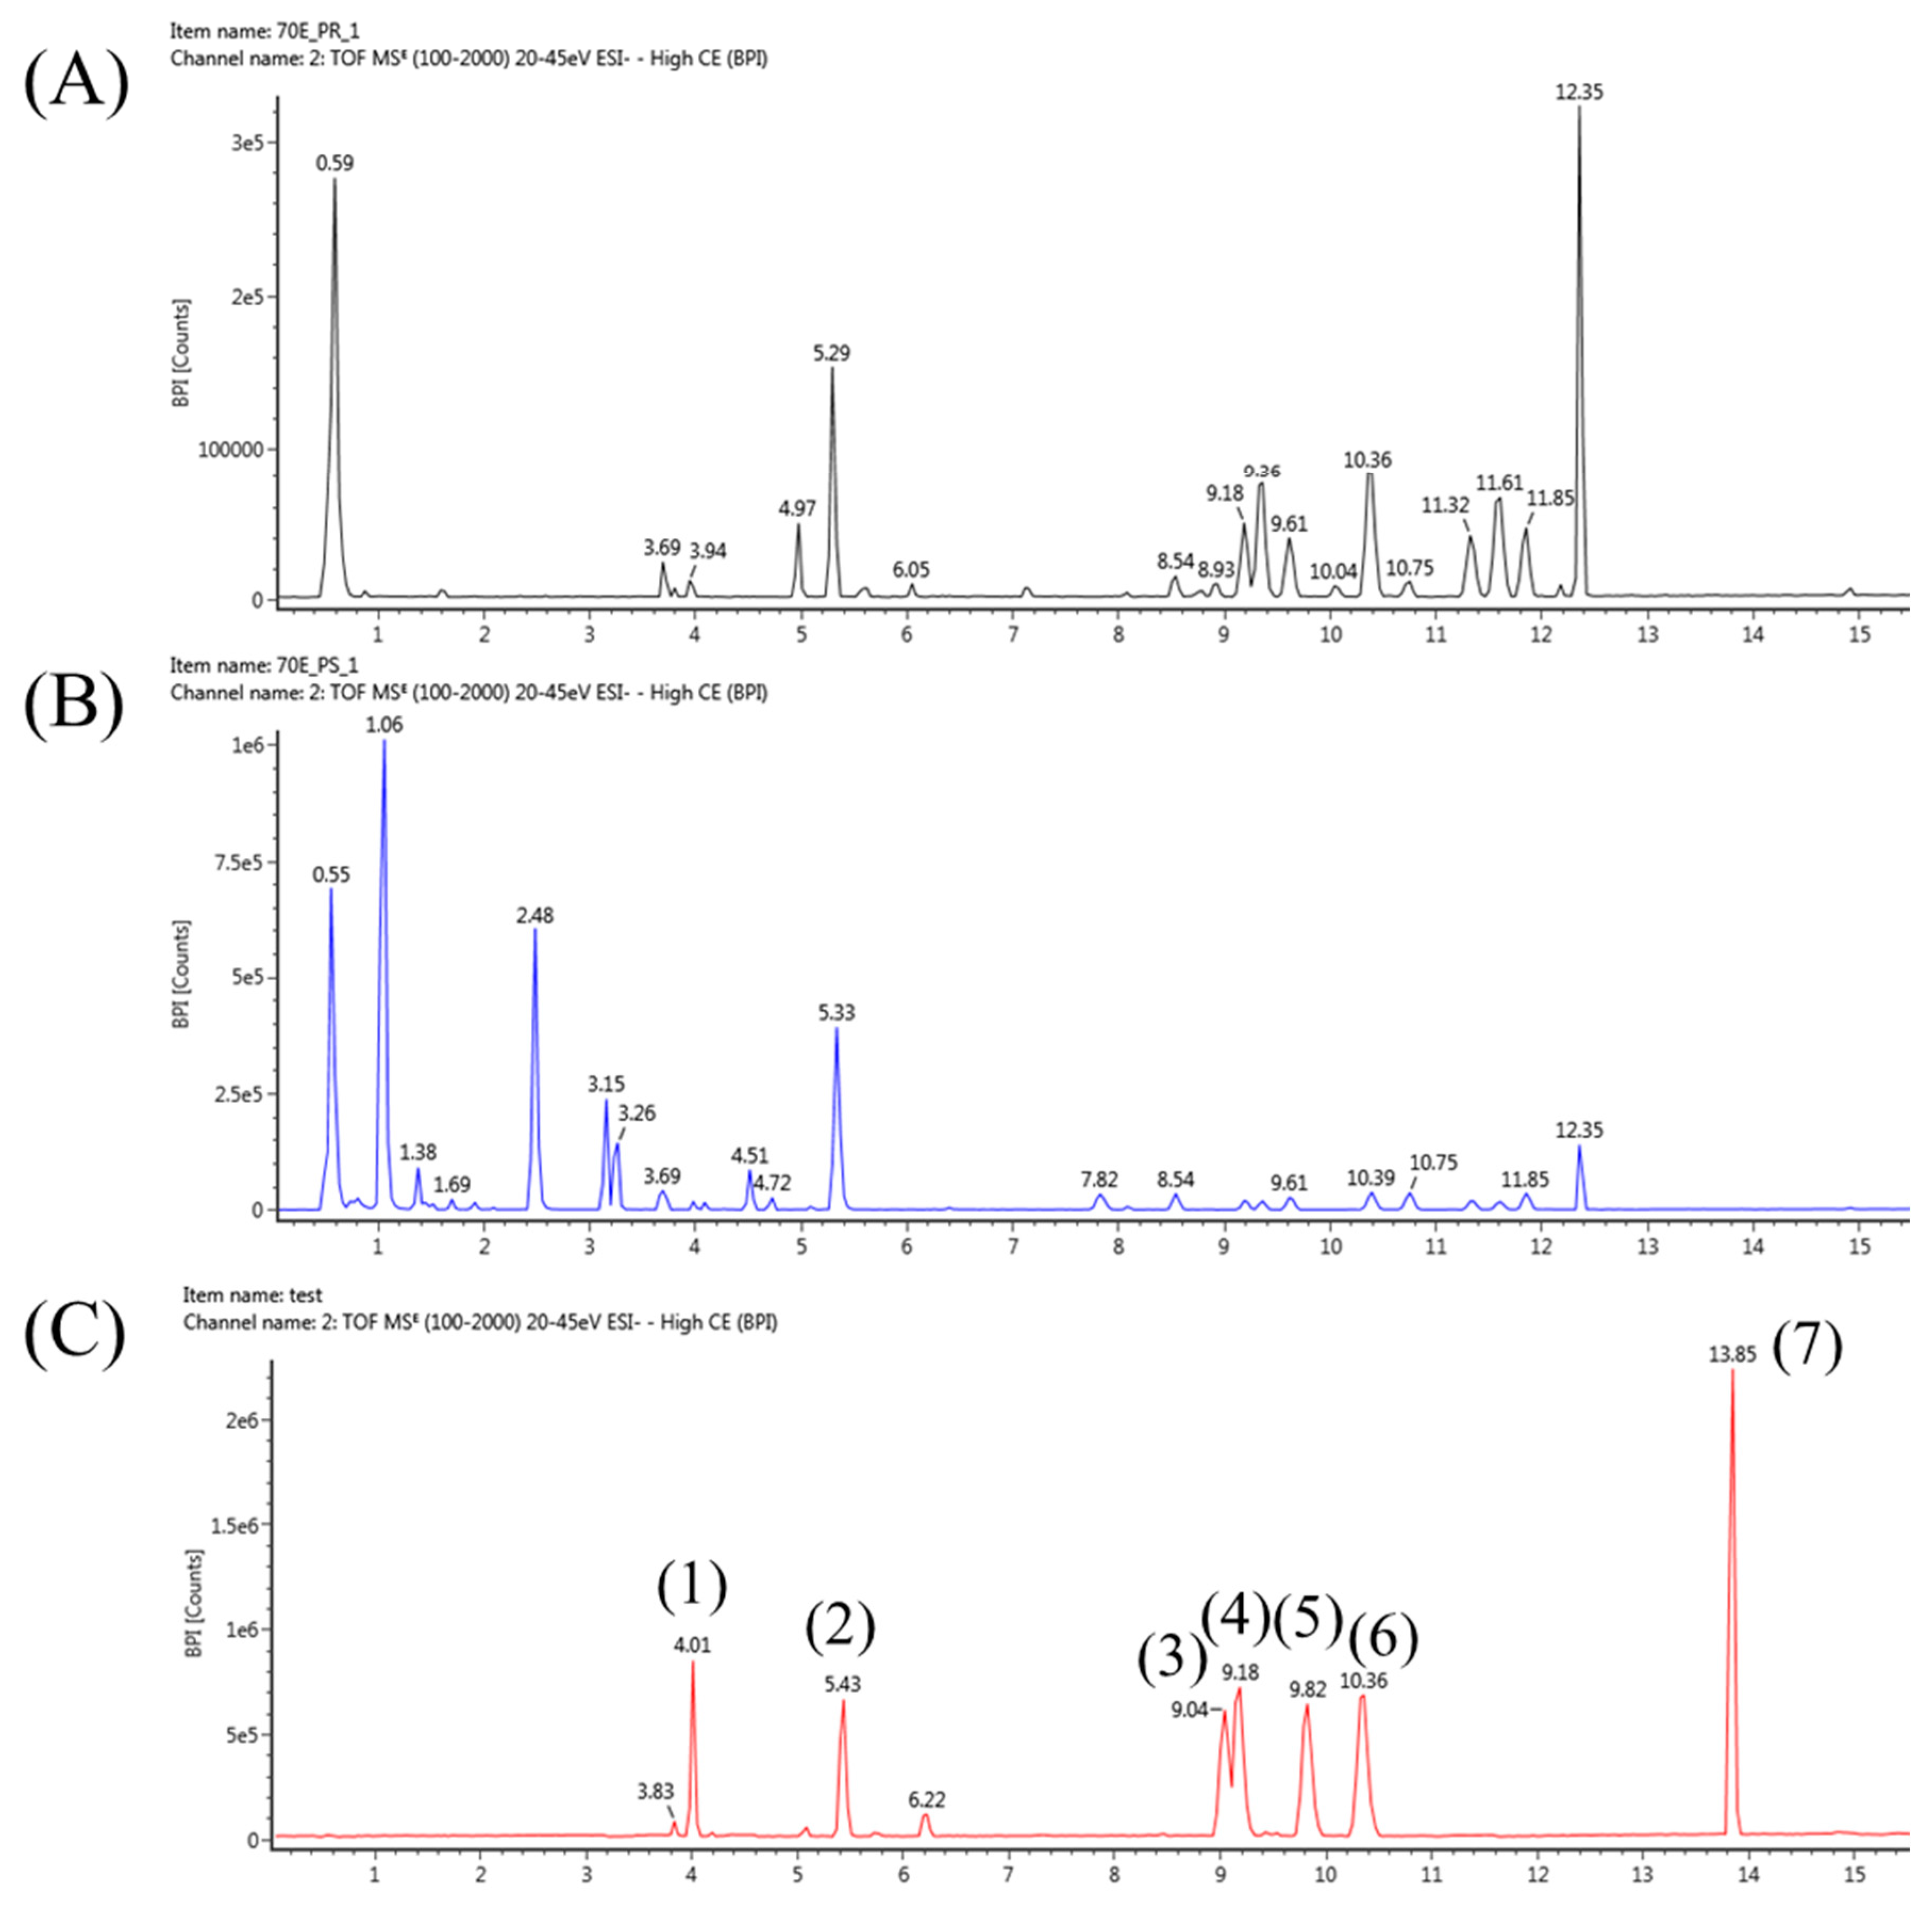
2.1. Construction of LC-MS Conditions to Profile Platycodon grandiflorum Metabolites

| No. | Standards | RT (min) | Molecular Formula | Expected Neutral Mass (Da) | Observed Neutral Mass (Da) | QTOF/MS (ESI-) m/z | Mass Accuracy (ppm) | Adducts |
|---|---|---|---|---|---|---|---|---|
| 1 | Platycoside E | 4.01 | C69H112O38 | 1548.6832 | 1548.6783 | 1593.6765 | −3.08 | +HCOO |
| 2 | Platycodin D3 | 5.43 | C63H102O33 | 1386.6303 | 1386.6268 | 1431.625 | −2.44 | +HCOO |
| 3 | Platycodin D2 | 9.04 | C63H102O33 | 1386.6303 | 1386.6264 | 1385.6191 | −2.84 | -H |
| 4 | Platycodin D | 9.18 | C57H92O28 | 1224.5775 | 1224.5765 | 1269.5747 | −0.82 | +HCOO |
| 5 | Polygalacin D | 9.82 | C57H92O27 | 1208.5826 | 1208.5795 | 1253.5777 | −2.5 | +HCOO |
| 6 | Platycogenic acid A | 10.36 | C57H90O29 | 1238.5568 | 1238.5562 | 1237.5489 | −0.5 | -H |
| 7 | Platycodigenin | 13.85 | C30H48O7 | 520.34 | 520.3399 | 519.3326 | −0.21 | -H |
| No. | Standards | Correlation (R2) | Linear Range (ng) | LOD (ng) |
|---|---|---|---|---|
| 1 | Platycoside E | 0.9939 | 1–40 | 1 |
| 2 | Platycodin D3 | 0.9975 | 1–100 | 1 |
| 3 | Platycodin D2 | 0.9976 | 1–100 | 1 |
| 4 | Platycodin D | 0.9898 | 1–40 | 1 |
| 5 | Polygalacin D | 0.9926 | 0.2–100 | 0.2 |
| 6 | Platycogenic acid A | 0.9957 | 1–100 | 1 |
| 7 | Platycodigenin | 0.9952 | 0.2–20 | 0.2 |
2.2. Optimization of Extraction Protocols for Platycodon grandiflorum Metabolites
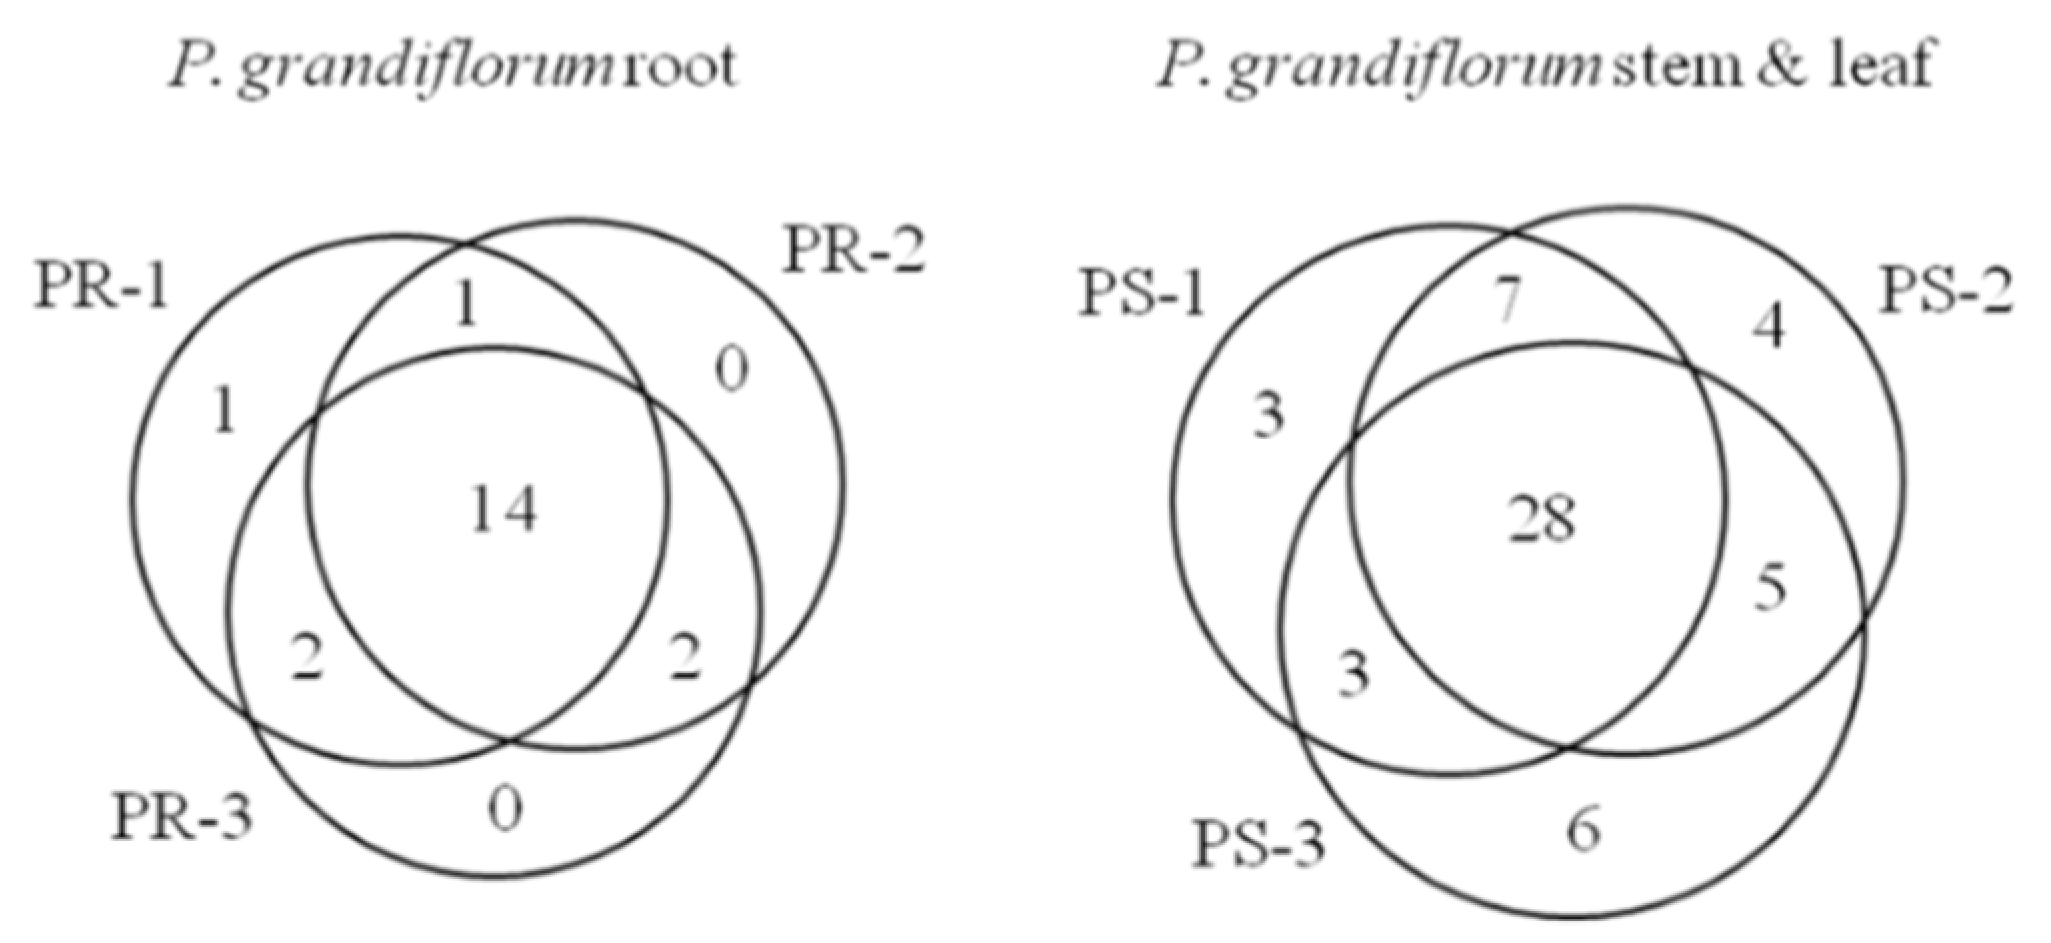
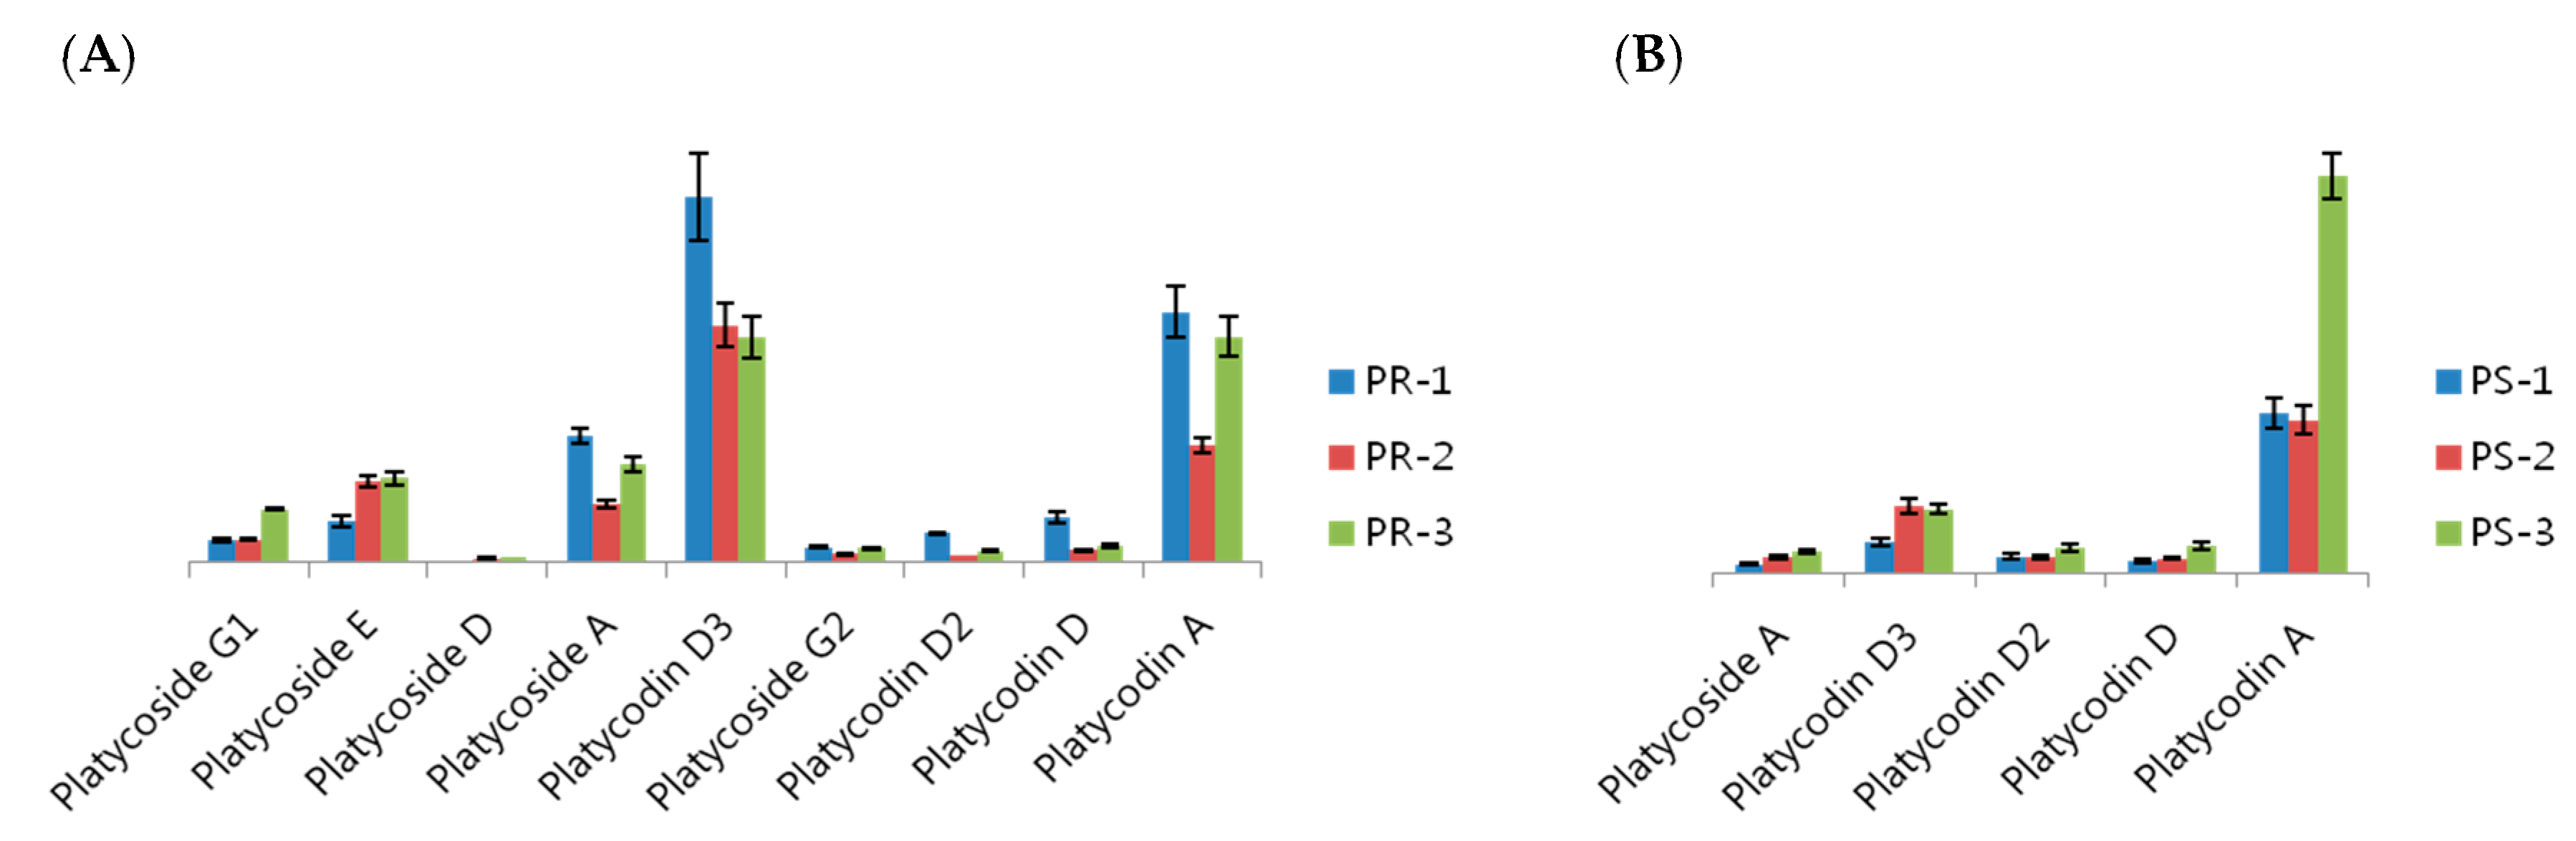
2.3. Analysis of Various Metabolites in the Stem, Leaf and Roots of Platycodon grandiflorum
| No. | RT (min) | Metabolites | Expected Neutral Mass (Da) | Observed Neutral Mass (Da) | QTOF/MS (ESI-) m/z | Mass Accuracy (ppm) | Adducts | Intensity (n = 3) | ||
|---|---|---|---|---|---|---|---|---|---|---|
| PR-1 | PR-2 | PR-3 | ||||||||
| 1 | 0.55 | Glutamine | 146.0691 | 146.0688 | 145.0615 | −2.5 | -H | a 1837 ± 187 | - | - |
| 2 | 0.55 | Planteose | 504.169 | 504.169 | 549.1672 | 0 | +HCOO | 4903 ± 667 | - | 5636 ± 392 |
| 3 | 0.55 | α-Kojibiose | 342.1162 | 342.1161 | 387.1143 | −0.22 | -H | 1837 ± 958 | 16,344 ± 1310 | - |
| 4 | 0.6 | Maleic acid | 116.011 | 116.0113 | 115.004 | 2.98 | -H | - | 487 ± 66 | 483 ± 31 |
| 5 | 0.62 | 2-Hydroxyfuran-3-formic acid | 128.011 | 128.0104 | 173.0086 | −3.5 | +HCOO | 2305 ± 106 | 2025 ± 113 | 1752 ± 44 |
| 6 | 0.63 | 2-Furoic acid | 112.016 | 112.0163 | 111.009 | 1.99 | -H | 7646 ± 355 | 6875 ± 226 | 5943 ± 171 |
| 7 | 0.63 | Citric acid | 192.027 | 192.0264 | 191.0191 | −3.21 | -H | 41,368 ± 2527 | 37,122 ± 1795 | 32,419 ± 1422 |
| 8 | 2.11 | Arnebifuranone | 316.1311 | 316.1310 | 361.1292 | −0.19 | +HCOO | 661 ± 20 | 889 ± 28 | 656 ± 31 |
| 9 | 2.35 | Brusatol | 520.1945 | 520.1934 | 565.1917 | −1.8 | +HCOO | 4005 ± 351 | 2836 ± 266 | 5753 ± 492 |
| 10 | 3.8 | Platycoside G1 | 1416.6409 | 1416.6364 | 1461.6346 | −3.11 | +HCOO | 2456 ± 195 | 2457 ± 100 | 5734 ± 106 |
| 11 | 3.97 | Platycoside E | 1548.6832 | 1548.6788 | 1593.677 | −2.74 | +HCOO | 4451 ± 655 | 8863 ± 674 | 9183 ± 699 |
| 12 | 3.99 | Lobetyolin | 396.1784 | 396.1785 | 441.1767 | 0.19 | +HCOO | 13,407 ± 265 | 5473 ± 271 | 6794 ± 393 |
| 13 | 4.15 | Platycoside D | 1532.6882 | 1532.679 | 1577.6772 | −5.83 | +HCOO | - | 385 ± 47 | 500 ± 30 |
| 14 | 4.98 | Platycoside A | 1254.5881 | 1254.5849 | 1299.5831 | −2.48 | +HCOO | 13,802 ± 805 | 6425 ± 435 | 10,745 ± 864 |
| 15 | 5.31 | Platycodin D3 | 1386.6303 | 1386.6261 | 1431.6243 | −2.96 | +HCOO | 40,086 ± 4797 | 25,927 ± 2368 | 24,630 ± 2328 |
| 16 | 5.67 | Platycoside G2 | 1284.5986 | 1284.5937 | 1283.5865 | −3.82 | -H | 1626 ± 140 | 926 ± 103 | 1503 ± 149 |
| 17 | 8.24 | Deapioplatycodin D | 1092.5353 | 1092.5333 | 1137.5315 | −1.74 | +HCOO | 658 ± 47 | - | 443 ± 45 |
| 18 | 8.8 | Platycodin D2 | 1386.6303 | 1386.6231 | 1385.6159 | −5.2 | -H | 3130 ± 171 | 744 ± 44 | 1172 ± 103 |
| 19 | 8.93 | Platycodin D | 1224.5775 | 1224.5717 | 1269.5699 | −4.58 | +HCOO | a 4868 ± 606 | 1255 ± 67 | 1757 ± 161 |
| 20 | 9.35 | Platycodin A | 1266.5881 | 1266.5844 | 1311.5826 | −2.82 | +HCOO | 27,391 ± 2780 | 12,819 ± 889 | 24,750 ± 2250 |
| No. | RT (min) | Metabolites | Expected Neutral Mass (Da) | Observed Neutral Mass (Da) | QTOF/MS (ESI-) m/z | Mass Accuracy (ppm) | Adducts | Intensity (n = 3) | ||
|---|---|---|---|---|---|---|---|---|---|---|
| PS-1 | PS-2 | PS-3 | ||||||||
| 1 | 0.51 | Arginine | 174.1117 | 174.1114 | 173.1041 | −1.65 | -H | a 477 ± 38 | 594 ± 37 | - |
| 2 | 0.55 | Aspartic acid | 133.0375 | 133.0374 | 132.0301 | −0.79 | -H | 405 ± 53 | - | - |
| 3 | 0.55 | Glutamic acid | 147.0532 | 147.0529 | 146.0456 | −1.59 | -H | 464 ± 47 | 506 ± 30 | - |
| 4 | 0.55 | Glutamine | 146.0691 | 146.0692 | 145.0619 | 0.14 | -H | 1306 ± 223 | 2516 ± 304 | - |
| 5 | 0.55 | Planteose | 504.169 | 504.1687 | 549.1669 | −0.57 | +HCOO | 619 ± 59 | - | - |
| 6 | 0.55 | Sodium ferulate | 216.0399 | 216.0391 | 215.0318 | −3.58 | -H | 996 ± 77 | - | 924 ± 36 |
| 7 | 0.55 | α-Kojibiose | 342.1162 | 342.1162 | 387.1144 | −0.03 | +HCOO | - | - | 10,644 ± 1655 |
| 8 | 0.56 | Ribose | 150.0528 | 150.0522 | 195.0504 | −3.26 | +HCOO | 1321 ± 83 | 1488 ± 103 | 1994 ± 138 |
| 9 | 0.6 | Maleic acid | 116.011 | 116.0113 | 115.004 | 2.99 | -H | 2127 ± 103 | 2421 ± 125 | 1743 ± 58 |
| 10 | 0.61 | 5-Oxoproline | 129.0426 | 129.0427 | 128.0354 | 0.88 | -H | - | 643 ± 49 | - |
| 11 | 0.61 | Pyruvic acid | 88.016 | 88.0161 | 133.0143 | 0.3 | +HCOO | 10,969 ± 482 | 11,961 ± 423 | 8726 ± 469 |
| 12 | 0.62 | 2-Furoic acid | 112.016 | 112.0164 | 111.0091 | 3.1 | -H | 4606 ± 239 | 5134 ± 222 | 3194 ± 252 |
| 13 | 0.62 | 2-Hydroxyfuran-3-formic acid | 128.011 | 128.0106 | 173.0088 | −2.23 | +HCOO | a 1611 ± 92 | 1806 ± 111 | 1397 ± 60 |
| 14 | 0.62 | Citric acid | 192.027 | 192.0263 | 191.019 | −3.61 | -H | 26,784 ± 677 | 30,360 ± 1294 | 18,681 ± 375 |
| 15 | 0.77 | 6,7-Dihydroxycoumarin | 178.0266 | 178.0261 | 223.0243 | −2.23 | +HCOO | 1090 ± 83 | 677 ± 33 | 513 ± 27 |
| 16 | 0.8 | 1-O-Caffeoyquinic acid | 354.0951 | 354.0951 | 353.0878 | 0.05 | -H | - | - | 4272 ± 498 |
| 17 | 1 | Decaffeoylacteoside | 462.1737 | 462.1741 | 461.1669 | 0.91 | -H | 339 ± 46 | 494 ± 50 | 329 ± 33 |
| 18 | 1.01 | Tryptophan | 204.0899 | 204.0899 | 203.0826 | −0.01 | -H | 813 ± 83 | 974 ± 106 | 566 ± 34 |
| 19 | 1.06 | Quinic acid | 192.0634 | 192.063 | 191.0557 | −2.21 | -H | 26,641 ± 1875 | 27,777 ± 2173 | 31,286 ± 1747 |
| 20 | 1.07 | 4-O-Caffeoylquinic acid | 354.0951 | 354.0951 | 353.0878 | −0.08 | -H | - | - | 83,405 ± 3981 |
| 21 | 1.1 | Shikimic acid | 174.0528 | 174.0527 | 173.0454 | −0.78 | -H | 591 ± 50 | 624 ± 77 | 811 ± 90 |
| 22 | 1.15 | 1,5-Dihydrxy-2,3,4,7-tetramethoxyxanthone | 348.0845 | 348.0838 | 393.082 | −1.77 | +HCOO | 354 ± 20 | - | 329 ± 25 |
| 23 | 1.15 | 4-O-β-d Glucopyranosyl-cis-cinnamic acid | 326.1002 | 326.1002 | 325.0929 | 0.08 | -H | 1445 ± 147 | - | 1392 ± 86 |
| 24 | 1.21 | Genistein-7,4'-di-O-β-d-glucoside | 594.1585 | 594.1583 | 593.151 | −0.32 | -H | - | 1280 ± 176 | - |
| 25 | 1.26 | 1-O-Caffeoyl-β-d-glucopyranoside | 342.0951 | 342.095 | 341.0878 | −0.14 | -H | 2243 ± 143 | 2603 ± 289 | 2525 ± 148 |
| 26 | 1.35 | o-Coumaric acid | 164.0473 | 164.0472 | 163.04 | −0.6 | -H | 670 ± 118 | 859 ± 177 | 962 ± 102 |
| 27 | 1.38 | Chlorogenic acid | 354.0951 | 354.095 | 353.0877 | −0.27 | -H | 12,530 ± 967 | 14,301 ± 1076 | 14,725 ± 798 |
| 28 | 1.91 | 3-O-trans-Coumaroylquinic acid | 338.1002 | 338.1001 | 337.0928 | −0.24 | -H | 3879 ± 282 | 6685 ± 483 | 3502 ± 257 |
| 29 | 2.04 | 9-Hydroxylinalool-9-β-d-glucopyranoside | 332.1835 | 332.1834 | 377.1816 | −0.35 | +HCOO | 680 ± 116 | 431 ± 77 | 868 ± 111 |
| 30 | 2.11 | Arnebifuranone | 316.1311 | 316.131 | 361.1292 | −0.1 | +HCOO | - | 373 ± 32 | - |
| 31 | 2.24 | Kaempferol-3-O-neohesperidoside | 594.1585 | 594.1581 | 593.1508 | −0.69 | -H | - | - | a 1578 ± 158 |
| 32 | 2.37 | Brusatol | 520.1945 | 520.1944 | 565.1926 | −0.08 | +HCOO | - | 6136 ± 483 | 4755 ± 461 |
| 33 | 2.4 | Kaempferol-3-gentiobioside | 610.1534 | 610.1523 | 609.145 | −1.86 | -H | - | 1030 ± 284 | - |
| 34 | 2.49 | Kaempferol | 286.0477 | 286.0467 | 285.0394 | −3.62 | -H | - | - | 4400 ± 366 |
| 35 | 2.5 | Quercetin-3-O-glucuronide 6″-methyl ester | 492.0904 | 492.0907 | 491.0834 | 0.58 | -H | 1028 ± 88 | 900 ± 100 | - |
| 36 | 2.53 | Taraxacolide 1-glucopyranoside | 430.2203 | 430.2204 | 475.2186 | 0.3 | +HCOO | 3078 ± 242 | 4529 ± 519 | 3659 ± 430 |
| 37 | 3 | 1,5-O-Dicaffeoylquinic acid | 516.1268 | 516.1269 | 515.1196 | 0.25 | -H | - | - | 510 ± 31 |
| 38 | 3.27 | 3'-Hydroxypuerarin | 448.1006 | 448.1009 | 447.0936 | 0.75 | -H | 1894 ± 208 | 2107 ± 231 | 2228 ± 243 |
| 39 | 3.27 | Eriodictyol-7-O-β-d-methyl-glucuronopyranoside | 478.1111 | 478.111 | 477.1038 | −0.19 | -H | - | 750 ± 67 | 975 ± 61 |
| 40 | 3.37 | Luteolin 7-O-(6''- O-acetyl)-β-d-glucopyranoside | 490.1111 | 490.1112 | 489.1039 | 0.13 | -H | 790 ± 58 | 21,846 ± 1788 | 7148 ± 472 |
| 41 | 3.37 | Quercetin-3-O-(6"-O-acetyl)-β-d-glucopyranoside | 506.106 | 506.107 | 505.0997 | 1.91 | -H | - | 369 ± 34 | 763 ± 116 |
| 42 | 3.38 | Epicatechin-3-O-gallate | 442.09 | 442.0907 | 487.0889 | 1.49 | +HCOO | - | 3838 ± 400 | 1207 ± 95 |
| 43 | 3.58 | 5-O-Caffeoyl quinic acid butyl ester | 410.1577 | 410.1579 | 409.1506 | 0.5 | -H | 328 ± 28 | 516 ± 96 | 361 ± 21 |
| 44 | 3.62 | Kaempferol-3-O-(6′′-O-acetyl)-β-d-glucopyranoside | 490.1111 | 490.1122 | 489.1049 | 2.14 | -H | 74,782 ± 6202 | - | - |
| 45 | 3.99 | Methyl-β-d-fructofuranoside | 180.0634 | 180.0632 | 179.0559 | −0.9 | -H | 1944 ± 224 | 2168 ± 222 | - |
| 46 | 4.98 | Platycoside A | 1254.588 | 1254.585 | 1299.583 | −2.28 | +HCOO | 417 ± 48 | 815 ± 147 | 1088 ± 108 |
| 47 | 5.11 | 5,7,3′,5′-Tetrahydroxyflavanone | 288.0634 | 288.0629 | 287.0556 | −1.81 | -H | 3719 ± 239 | 2445 ± 142 | - |
| 48 | 5.24 | Epigallocatechin | 594.1373 | 594.137 | 593.1298 | −0.49 | -H | - | - | 581 ± 78 |
| 49 | 5.31 | Platycodin D3 | 1386.63 | 1386.625 | 1431.623 | −3.83 | +HCOO | a 1582 ± 209 | 3569 ± 375 | 3396 ± 291 |
| 50 | 5.35 | 5,7,2',5'-Tetrahydroxy-flavone | 286.0477 | 286.0473 | 285.04 | −1.48 | -H | 152,282 ± 7073 | 146,318 ± 5227 | 136,503 ± 4826 |
| 51 | 5.36 | 5,7,8,3′,4′-Pentamethoxy flavones | 302.0427 | 302.0424 | 301.0352 | −0.71 | -H | 542 ± 63 | 558 ± 76 | 515 ± 45 |
| 52 | 6.27 | Apigenin-7-O-β-d-glucuronide ethyl ester | 474.1162 | 474.1166 | 473.1093 | 0.79 | -H | 2009 ± 109 | 1265 ± 145 | - |
| 53 | 7.83 | Apigenol | 270.0528 | 270.0522 | 269.0449 | −2.32 | -H | 43,135 ± 2315 | 59,953 ± 3044 | 38,068 ± 1691 |
| 54 | 8.8 | Platycodin D2 | 1386.63 | 1386.626 | 1385.618 | −3.45 | -H | 849 ± 156 | 792 ± 113 | 1307 ±205 |
| 55 | 8.94 | Platycodin D | 1224.578 | 1224.574 | 1269.572 | −2.86 | +HCOO | 613 ± 88 | 763 ± 87 | 1416 ± 190 |
| 56 | 9.37 | Platycodin A | 1266.588 | 1266.584 | 1311.583 | −2.91 | +HCOO | 8564 ± 832 | 8149 ± 769 | 21,255 ± 1202 |
3. Experimental Section
3.1. Platycodon grandiflorum Samples
3.2. Standard Constituents and Reagents
3.3. Sample Preparation
3.4. UPLC-QTOF-MS Analysis
4. Conclusions
Acknowledgments
Author Contributions
Conflicts of Interest
References
- Tada, A.; Kaneiwa, Y.; Shoji, J.; Shibata, S. Studies on the saponins of the root of Platycodon grandiflorum A. DE CANDOLLE. I. Isolation and the structure of platycodin-D. Chem. Pharm. Bull. 1975, 23, 2965–2972. [Google Scholar] [CrossRef] [PubMed]
- Choi, Y.H.; Yoo, D.S.; Choi, C.W.; Cha, M.R.; Kim, Y.S.; Lee, H.S.; Lee, K.R.; Ryu, S.Y. Platyconic Acid A, a Genuine Triterpenoid Saponin from the Roots of Platycodon grandiflorum. Molecules 2008, 13, 2871–2879. [Google Scholar] [CrossRef] [PubMed]
- Nyakudya, E.; Jeong, J.H.; Lee, N.K.; Jeong, Y.S. Platycosides from the Roots of Platycodon grandiflorum and Their Health Benefits. Prev. Nutr. Food Sci. 2014, 19, 59–68. [Google Scholar] [CrossRef] [PubMed]
- Chung, J.W.; Noh, E.J.; Zhao, H.L.; Sim, J.S.; Ha, Y.W.; Shin, E.M.; Lee, E.B.; Cheong, C.S.; Kim, Y.S. Anti-inflammatory Activity of Prosapogenin Methyl Ester of Platycodin D via Nuclear Factor-kappaB Pathway Inhibition. Biol. Pharm. Bull. 2008, 31, 2114–2120. [Google Scholar] [CrossRef] [PubMed]
- Zhao, H.L.; Cho, K.H.; Ha, Y.W.; Jeong, T.S.; Lee, W.S.; Kim, Y.S. Cholesterol-lowering effect of platycodin D in hypercholesterolemic ICR mice. Eur. J. Pharmacol. 2006, 537, 166–173. [Google Scholar] [CrossRef] [PubMed]
- Lee, J.Y.; Hwang, W.I.; Lim, S.T. Antioxidant and anticancer activities of organic extracts from Platycodon grandiflorum A. De Candolle roots. J. Ethnopharmacol. 2004, 93, 409–415. [Google Scholar] [CrossRef] [PubMed]
- Jeong, C.H.; Choi, G.N.; Kim, J.H.; Kwak, J.H.; Kim, D.O.; Kim, Y.J.; Heo, H.J. Antioxidant activities from the aerial parts of Platycodon grandiflorum. Food Chem. 2010, 118, 278–282. [Google Scholar] [CrossRef]
- Noh, J.R.; Kim, Y.H.; Gang, G.T.; Yang, K.J.; Kim, S.K.; Ryu, S.Y.; Kim, Y.S.; Lee, C.H.; Lee, H.S. Preventative Effects of Platycodon grandiflorum Treatment on Hepatic Steatosis in High Fat Diet-Fed C57BL/6 Mice. Biol. Pharm. Bull. 2010, 33, 450–454. [Google Scholar] [CrossRef] [PubMed]
- Kim, K.S.; Ezaki, O.; Ikemoto, S.; Itakura, H. Effects of Platycodon Grandilorum Feeding on Serum and Liver Lipid Concentrations in Rats with Diet-Induced Hyperlipidemia. J. Nutr. Sci. Vitaminol. 1995, 41, 485–491. [Google Scholar] [CrossRef] [PubMed]
- Ravipati, A.S.; Zhang, L.; Koyyalamudi, S.R.; Jeong, S.C.; Reddy, N.; Bartlett, J.; Smith, P.T.; Shanmugam, K.; Münch, G.; Wu, M.J.; et al. Antioxidant and anti-inflammatory activities of selected Chinese medicinal plants and their relation with antioxidant content. BMC Complem. Altern. Med. 2012, 12, 173–188. [Google Scholar] [CrossRef] [PubMed]
- Kim, K.S.; Seo, E.K.; Lee, Y.C.; Lee, T.K.; Cho, Y.W.; Ezaki, O.; Kim, C.H. Effect of dietary Platycodon grandiflorum on the improvement of insulin resistance in obese Zucker rats. J. Nutr. Biochem. 2000, 11, 420–424. [Google Scholar] [CrossRef]
- Jang, D.S.; Lee, Y.M.; Jeong, I.H.; Kim, J.S. Constituents of the Flowers of Platycodon grandiflorum with Inhibitory Activity on Advanced Glycation End Products and Rat Lens Aldose Reductase In Vitro. Arch. Pharm. Res. 2010, 33, 875–880. [Google Scholar] [CrossRef] [PubMed]
- Schauer, N.; Fernie, A.R. Plant metabolomics: towards biological function and mechanism. Trends Plant. Sci. 2006, 11, 508–516. [Google Scholar] [CrossRef] [PubMed]
- Sumner, L.W.; Mendes, P.; Dixon, R.A. Plant metabolomics: Large-scale phytochemistry in the functional genomics era. Phytochemistry. 2003, 62, 817–836. [Google Scholar] [CrossRef]
- Fukusaki, E.; Kobayashi, A. Plant Metabolomics: Potential for Practical Operation. J. Biosci. Bioeng. 2005, 100, 347–354. [Google Scholar] [CrossRef] [PubMed]
- Ward, J.L.; Baker, J.M.; Beale, M.H. Recent applications of NMR spectroscopy in plant metabolomics. FEBS J. 2007, 274, 1126–1131. [Google Scholar] [CrossRef] [PubMed]
- Krishnan, P.; Kruger, N.J.; Ratcliffe, R.G. Metabolite fingerprinting and profiling in plants using NMR. J. Exp. Bot. 2005, 56, 255–265. [Google Scholar] [CrossRef] [PubMed]
- t’Kindt, R.; Morreel, K.; Deforce, D.; Boerjan, W.; Bocxlaer, J.V. Joint GC–MS and LC–MS platforms for comprehensive plant metabolomics: Repeatability and sample pre-treatment. J. Chromatogr. B 2009, 877, 3572–3580. [Google Scholar] [CrossRef] [PubMed]
- Grata, E.; Boccard, J.; Guillarme, D.; Glauser, G.; Carrupt, P.A.; Farmer, E.E.; Wolfender, J.L.; Rudaz, S. UPLC–TOF-MS for plant metabolomics: A sequential approach for wound marker analysis in Arabidopsis thaliana. J. Chromatogr. B 2008, 871, 261–270. [Google Scholar] [CrossRef] [PubMed]
- Steinmann, D.; Ganzera, M. Recent advances on HPLC/MS in medicinal plant analysis. J. Pharmaceut. Biomed. 2011, 55, 744–757. [Google Scholar] [CrossRef] [PubMed]
- Vos, R.C.D.; Moco, S.; Lommen, A.; Keurentjes, J.J.; Bino, R.J.; Hall, R.D. Untargeted large-scale plant metabolomics using liquid chromatography coupled to mass spectrometry. Nat. Protoc. 2007, 2, 778–791. [Google Scholar] [CrossRef] [PubMed]
- Kim, N.; Choi, B.Y.; Lee, D.; Shin, Y.S.; Bang, K.H.; Cha, S.W.; Lee, J.W.; Choi, H.K.; Jang, D.S.; Lee, D. Metabolomic Approach for Age Discrimination of Panax ginseng Using UPLC-Q-Tof MS. J. Agric. Food Chem. 2011, 59, 10435–10441. [Google Scholar] [CrossRef] [PubMed]
- Xie, G.X.; Ni, Y.; Su, M.M.; Zhang, Y.Y.; Zhao, A.H.; Gao, X.F.; Liu, Z.; Xiao, P.G.; Jia, W. Application of ultra-performance LC-TOF MS metabolite profiling techniques to the analysis of medicinal Panax herbs. Metabolomics 2008, 4, 248–260. [Google Scholar] [CrossRef]
- Natural Products Application Solution with UNIFI:Waters. Available online: http://www.waters.com/waters/en_US/Natural-Products-Application-Solution-with UNIFI/nav.htm?cid=134777097&lset=1&locale=en_US&changedCountry=Y (accessed on 10 December 2013).
- He, Z.; Qiao, C.; Han, Q.; Wang, Y.; Ye, W.; Xu, H. New triterpenoid saponins from the roots of Platycodon grandiflorum. Tetrahedron 2005, 61, 2211–2215. [Google Scholar] [CrossRef]
- Ishii, H.; Tori, K.; Tozyo, T.; Yoshimura, Y. Saponins from roots of Platycodon grandiflorum. Part 2. Isolation and structure of new triterpene glycosides. J. Chem. Soc. Perkin Trans. 1 1984, 661–668. [Google Scholar] [CrossRef]
- Li, W.; Xiang, L.; Zhang, J.; Zheng, Y.N.; Han, L.K.; Saito, M. A new triterpenoid saponin from the roots of Platycodon. grandiflorum. Chin. Chem. Lett. 2007, 18, 306–308. [Google Scholar] [CrossRef]
- Choi, Y.H.; Yoo, D.S.; Cha, M.R.; Choi, C.W.; Kim, Y.S.; Choi, S.U.; Lee, K.R.; Ryu, S.Y. Antiproliferative effects of saponins from the roots of Platycodon. grandiflorum on cultured human tumor cells. J. Nat. Prod. 2010, 73, 1863–1867. [Google Scholar] [CrossRef] [PubMed]
© 2015 by the authors; licensee MDPI, Basel, Switzerland. This article is an open access article distributed under the terms and conditions of the Creative Commons by Attribution (CC-BY) license (http://creativecommons.org/licenses/by/4.0/).
Share and Cite
Lee, J.W.; Ji, S.-H.; Kim, G.-S.; Song, K.-S.; Um, Y.; Kim, O.T.; Lee, Y.; Hong, C.P.; Shin, D.-H.; Kim, C.-K.; et al. Global Profiling of Various Metabolites in Platycodon grandiflorum by UPLC-QTOF/MS. Int. J. Mol. Sci. 2015, 16, 26786-26796. https://doi.org/10.3390/ijms161125993
Lee JW, Ji S-H, Kim G-S, Song K-S, Um Y, Kim OT, Lee Y, Hong CP, Shin D-H, Kim C-K, et al. Global Profiling of Various Metabolites in Platycodon grandiflorum by UPLC-QTOF/MS. International Journal of Molecular Sciences. 2015; 16(11):26786-26796. https://doi.org/10.3390/ijms161125993
Chicago/Turabian StyleLee, Jae Won, Seung-Heon Ji, Geum-Soog Kim, Kyung-Sik Song, Yurry Um, Ok Tae Kim, Yi Lee, Chang Pyo Hong, Dong-Ho Shin, Chang-Kug Kim, and et al. 2015. "Global Profiling of Various Metabolites in Platycodon grandiflorum by UPLC-QTOF/MS" International Journal of Molecular Sciences 16, no. 11: 26786-26796. https://doi.org/10.3390/ijms161125993
APA StyleLee, J. W., Ji, S.-H., Kim, G.-S., Song, K.-S., Um, Y., Kim, O. T., Lee, Y., Hong, C. P., Shin, D.-H., Kim, C.-K., Lee, S.-E., Ahn, Y.-S., & Lee, D.-Y. (2015). Global Profiling of Various Metabolites in Platycodon grandiflorum by UPLC-QTOF/MS. International Journal of Molecular Sciences, 16(11), 26786-26796. https://doi.org/10.3390/ijms161125993