2. Results and Discussion
We first argue why the previously established criteria for the successful elimination of water vapor interference is not reliable using a simple example, liquid H
2O. The bending mode of liquid H
2O is located in the amide I region around 1645 cm
−1. From a spectroscopic viewpoint, we can consider liquid H
2O as some protein mimic which has only one secondary structure.
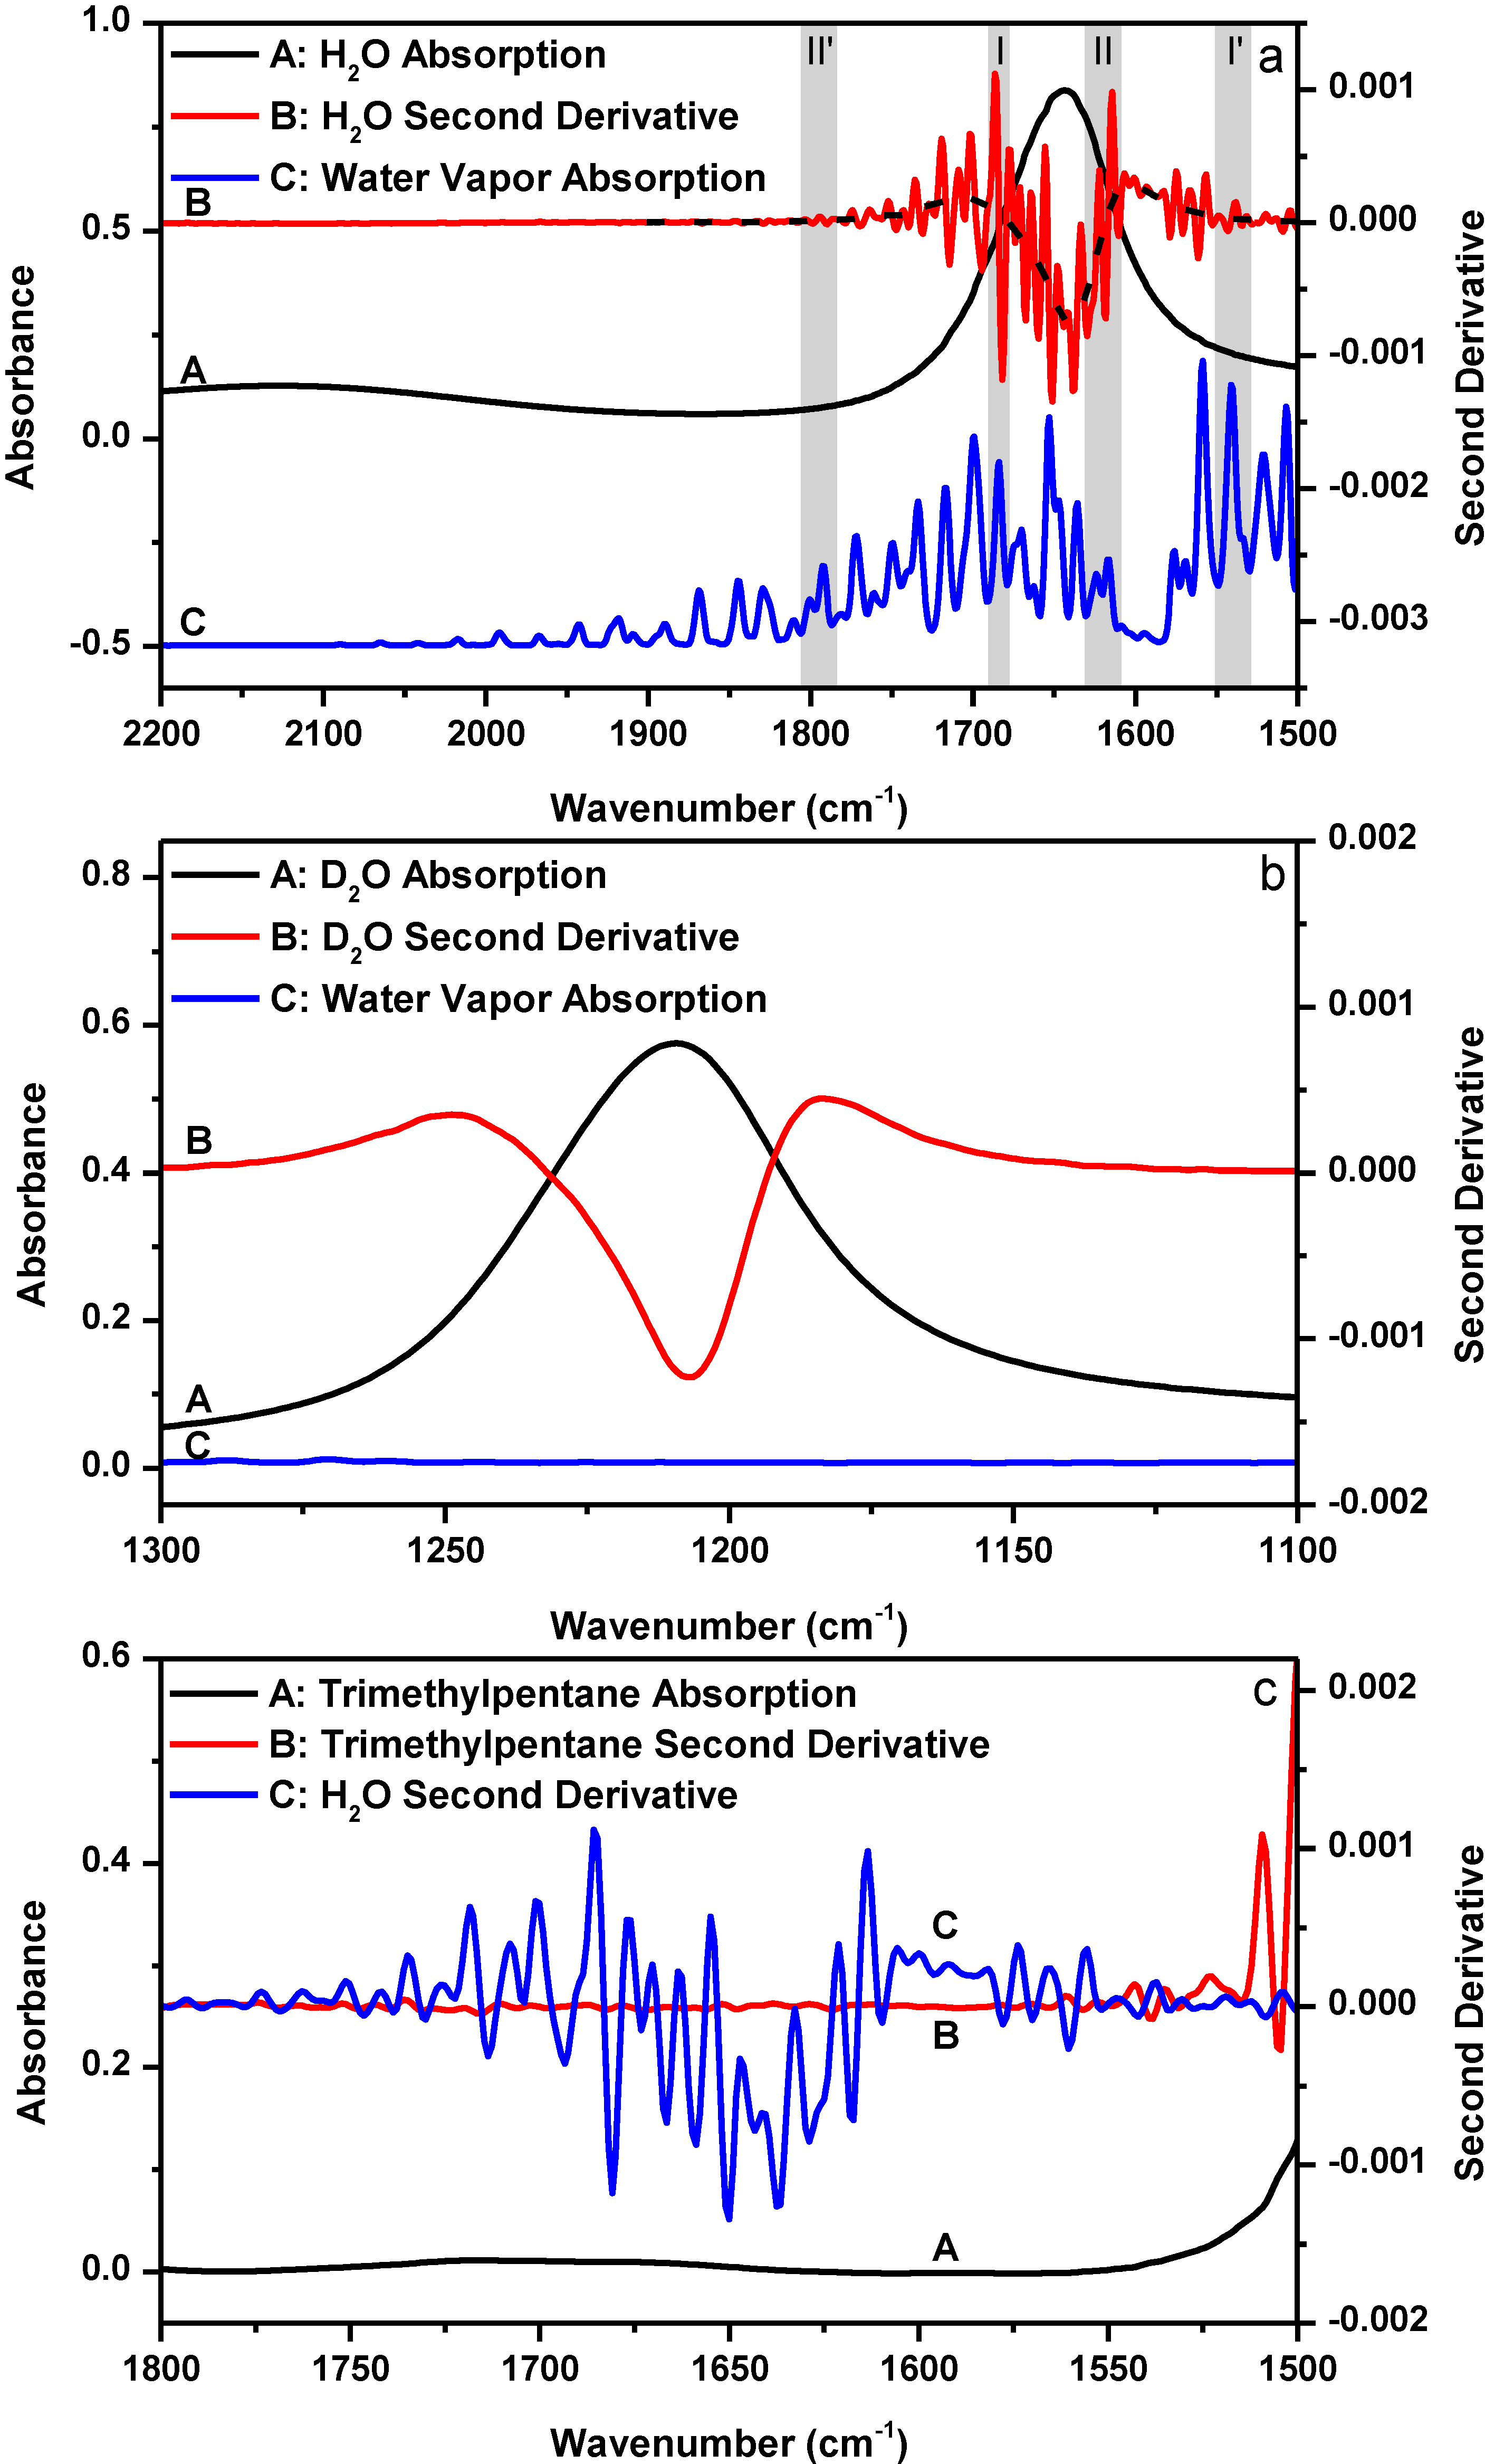
Figure 1a shows the FTIR absorption spectrum of liquid H
2O bending mode and its corresponding second derivative as well as the absorption spectrum of water vapor in the 2200–1500 cm
−1 spectral region.
Figure 1b shows the FTIR absorption spectrum of liquid D
2O bending mode and its corresponding second derivative as well as the absorption spectrum of water vapor in the 1300–1100 cm
−1 spectral region. The comparison between the two figures offers a nice illustration of how water vapor interference affects the outcome of second derivative treatment. As shown in
Figure 1b, the second derivative spectrum of liquid D
2O only gives one resolved peak located at 1207 cm
−1. By contrast, the second derivative spectrum of liquid H
2O in
Figure 1a appears to contain many resolved component peaks in the 1800–1500 cm
−1 bending mode region. Since the only difference between the two cases is that there are water vapor absorptions in the H
2O bending mode region and no water vapor absorption in the D
2O bending mode region, it is obvious that the resolved peaks in the second derivative spectrum of H
2O in
Figure 1a are the artifacts due to water vapor interference. The dashed line passing through the original second derivative spectrum of liquid H
2O in
Figure 1a shows in principle what the second derivative spectrum of liquid H
2O should have looked like if there was no water vapor interference in the H
2O bending mode region. This dashed line was obtained by first over-smoothing the absorption spectrum of liquid H
2O for three times using a 25-point window and then performing the second derivative treatment using a 25-point window. Obviously, without knowing the significant impact of water vapor interference on the outcome of second derivative treatment, one may falsely take the resolved artifact peaks in
Figure 1a as some true component peaks.
The absorption spectrum of liquid H
2O in
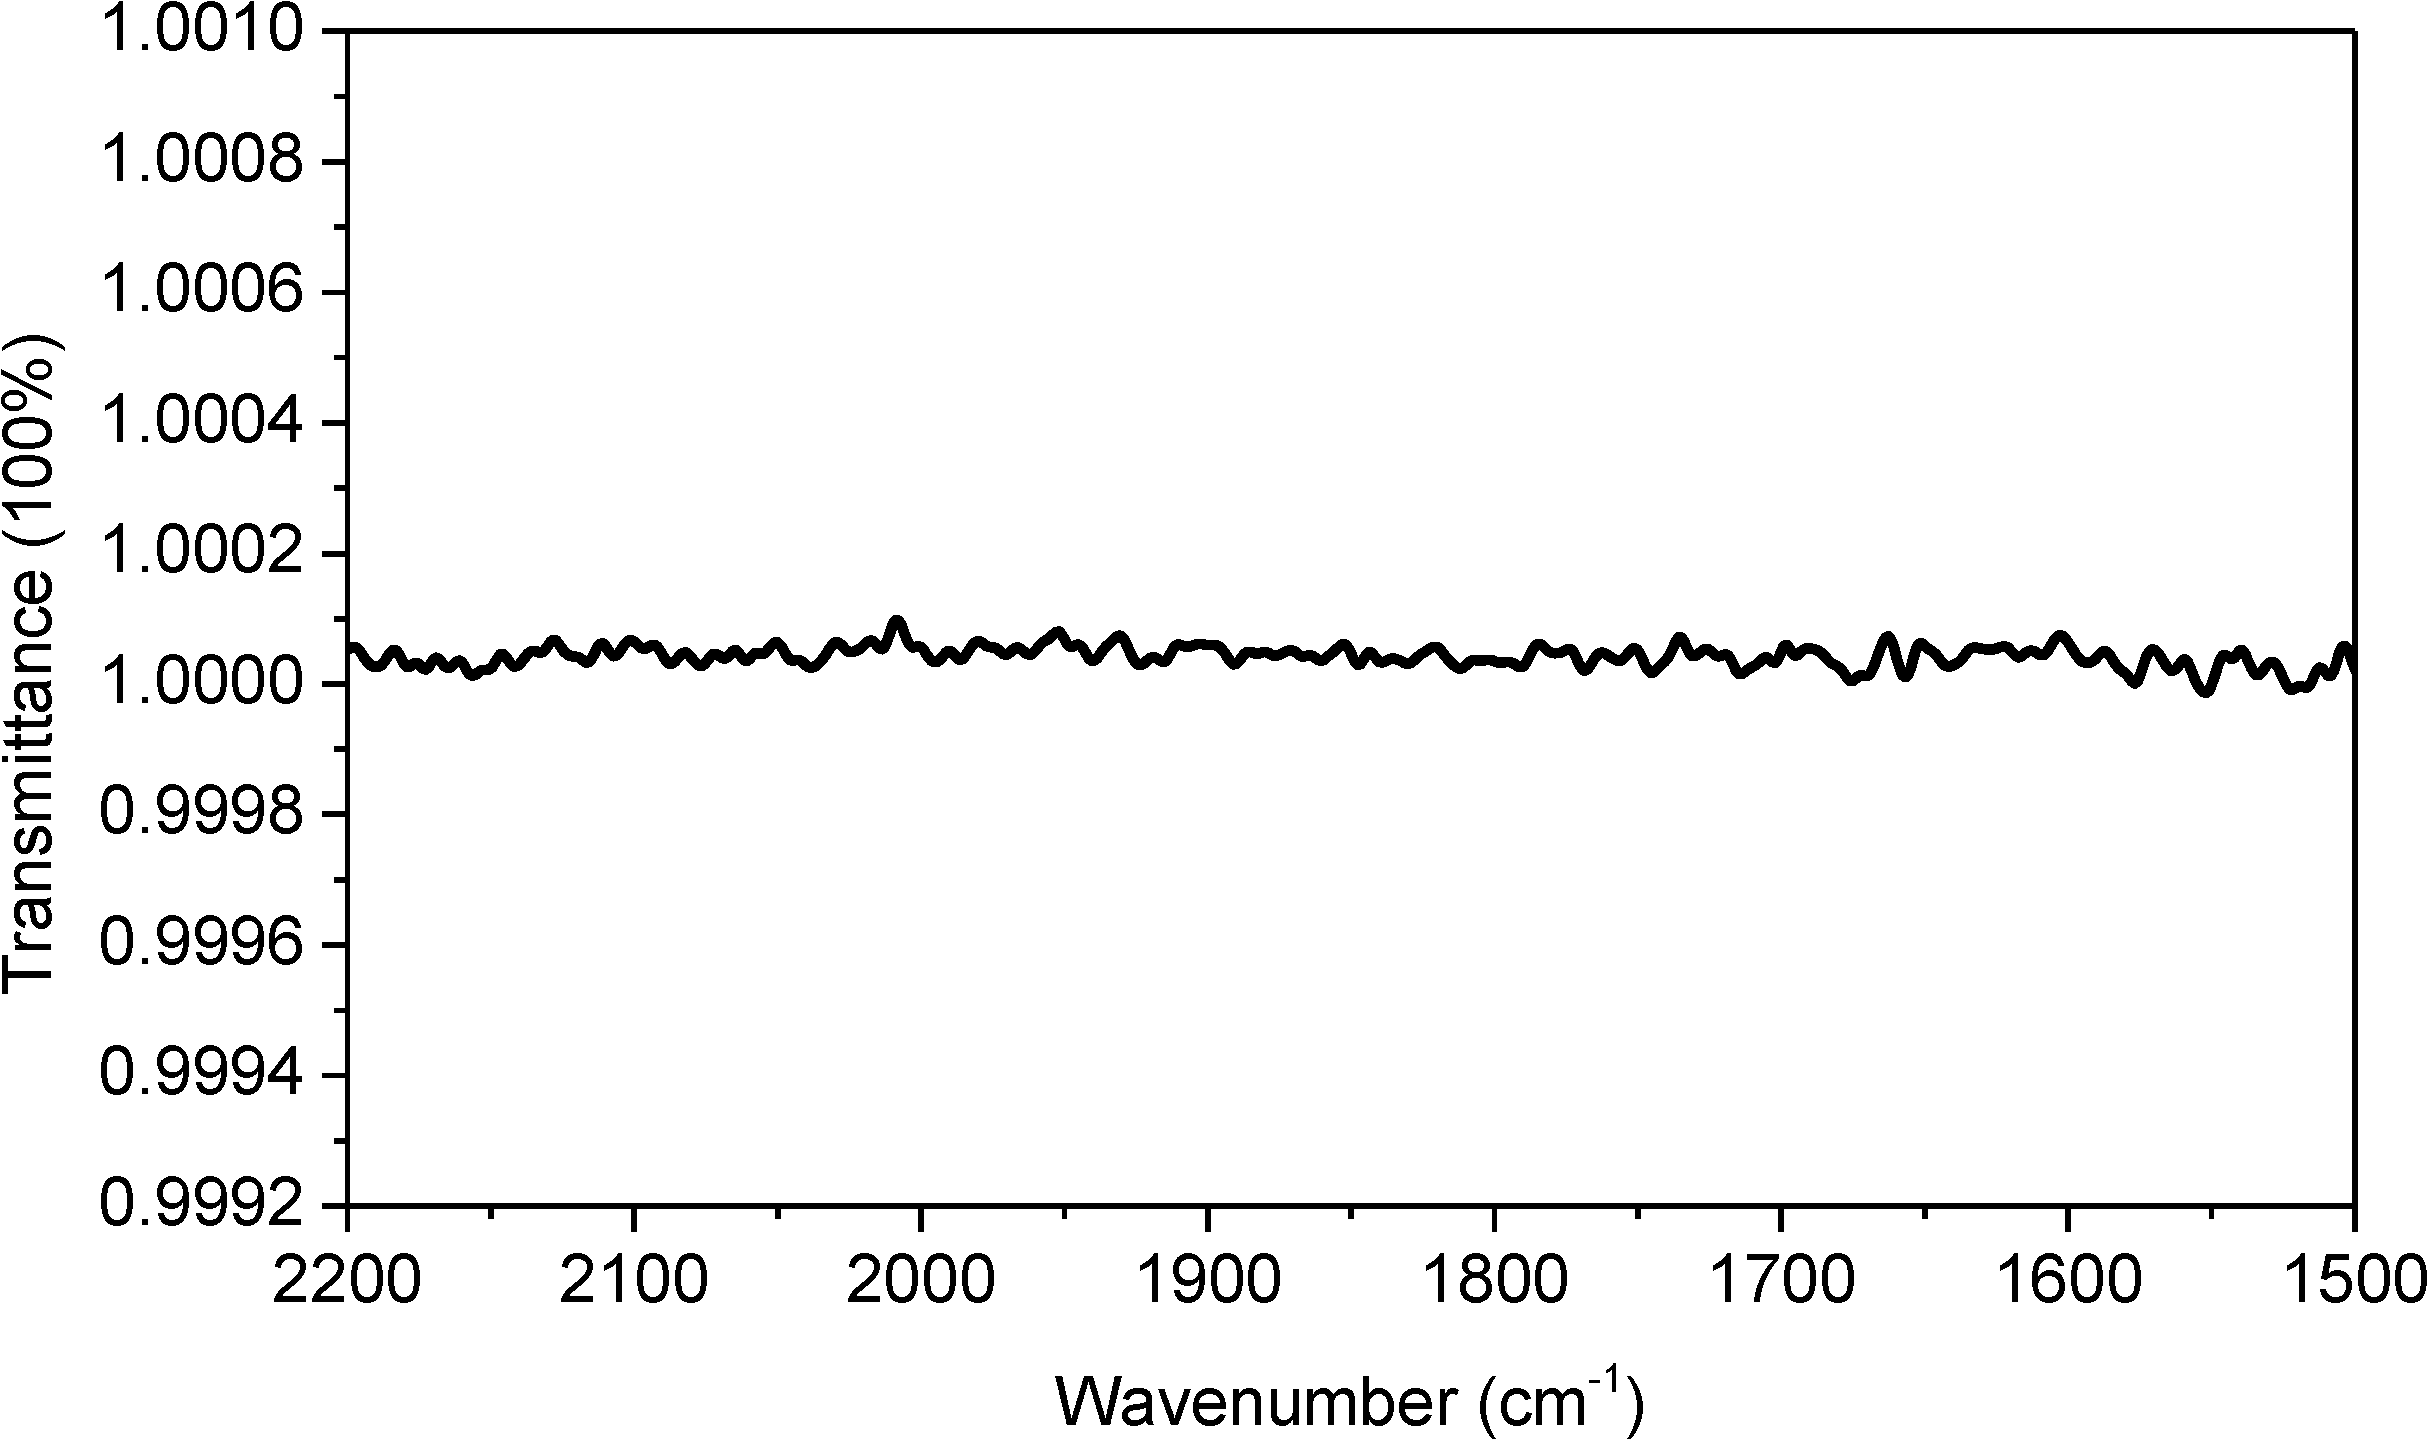
Figure 1a was taken with an FTIR spectrometer equipped with a sample shuttle. Using the sample shuttle is mathematically equivalent to conducting reference subtraction with a subtraction factor of 1. As demonstrated in
Figure 2, the sample shuttle can ensure a constant water vapor concentration during spectral acquisition, thus resulting in complete atmospheric compensation between sample scanning and reference scanning. Therefore, one may wonder why complete atmospheric compensation is not observed in
Figure 1a and why the absorption spectrum of liquid H
2O is still terribly affected by water vapor interference. In the following, we provide a qualitative interpretation as well as a mathematical reasoning for this surprising observation.
Figure 1.
(a) FTIR absorption (A: black) and second derivative (B: red) spectra of liquid H2O and the absorption spectrum of water vapor (C: blue). Dashed line: theoretical second derivative spectrum of liquid H2O; (b) FTIR absorption (A: black) and second derivative (B: red) spectra of liquid D2O and the absorption spectrum of water vapor (C: blue); (c) FTIR absorption (A: black) and second derivative (B: red) spectra of trimethylpentane and the second derivative spectrum of liquid H2O (C: blue). Second derivative spectrum is displayed with its resolved peaks pointing downwards. The absorbance of water vapor is in arbitrary unit. Spectral resolution: 4 cm−1.
Figure 2.
100% transmittance spectrum. This spectrum was taken with an empty optical path and with closed sample compartment. The optical bench of our FTIR spectrometer is a sealed design. This spectrum can be repeatedly obtained with ease under our lab conditions. Spectral resolution: 4 cm−1.
Figure 2.
100% transmittance spectrum. This spectrum was taken with an empty optical path and with closed sample compartment. The optical bench of our FTIR spectrometer is a sealed design. This spectrum can be repeatedly obtained with ease under our lab conditions. Spectral resolution: 4 cm−1.
In
Figure 1a, we shade and mark two pairs of spectral regions (
i.e., region I
versus region I', and region II
versus region II'). In each pair, the absorbance of water vapor in the two regions are similar, but the absorbance of liquid H
2O in the two regions are quite different. In principle, the two second derivative spectra of liquid H
2O in the paired spectral regions should be affected by water vapor interference to a similar extent upon atmospheric perturbation as the absorbance of water vapor in the two regions are similar. However, we can easily tell from the four marked regions that this is not the case by using the “oscillating” magnitude of the original second derivative signal relative to the reference (
i.e., the dash line in
Figure 1a) as a qualitative indicator for the extent of water vapor interference. In
Figure 1a, the second derivative signal magnitude in region I is more intense than that in region I'; and the second derivative signal magnitude looks obvious in region II but negligible in region II'. Considering the differences among these regions with respect to the absorbance of liquid H
2O, we can deduce that the extent of water vapor interference at each frequency must highly depend on the absorbance of liquid H
2O at that frequency; and larger absorbance of liquid H
2O apparently results in more pronounced water vapor interference in the second derivative spectrum. We here introduce a concept that we refer to as “sample’s absorbance-dependent water vapor interference” to describe the above observation. We should keep in mind that sample’s absorbance means liquid H
2O’s absorbance, not water vapor’s absorbance. We can further illustrate our discovery in an alternative way by performing the following experiment. Since the sample’s absorbance can abnormally magnify water vapor interference in second derivative spectrum, if we take the FTIR spectrum of some sample which has no absorption in a spectral region, we should see the disappearance of the sample’s absorbance-dependent water vapor interference phenomenon in the second derivative spectrum in that spectral region.
Figure 1c shows the absorption and second derivative spectra of 2,2,4-trimethylpentane, a hydrocarbon compound which basically has no absorption in the 1800–1550 cm
−1 spectral region. The second derivative spectrum of liquid H
2O was re-shown here for comparison at the same scale. The absorption spectrum of 2,2,4-trimethylpentane was taken under the same condition as liquid H
2O,
i.e., using sample shuttle to ensure negligible water vapor concentration fluctuation in the optical path during spectral acquisition. As expected, the second derivative spectrum of 2,2,4-trimethylpentane in the 1800–1550 cm
−1 spectral region is basically a flat line and sample’s absorbance-dependent water vapor interference is negligible.
The sample’s absorbance-dependent water vapor interference is a new phenomenon that has never been reported before. First, this phenomenon is not simply due to the deviation from Beer’s law of the measured absorbance of liquid H
2O. A deviation from Beer’s law can result in the situation where water vapor interference can depend on sample’s absorbance as different regions of the sample’s absorption band deviate from Beer’s law to different extents. However, the absorption maxima of liquid H
2O in
Figure 1a is smaller than 1 and it is within the linear range of our FTIR spectrometer as evidenced in
Figure S1. And even in the low-absorbing regions of liquid H
2O such as the regions above 1700 cm
−1 and below 1600 cm
−1 in
Figure 1a, we can still observe water vapor interference. Second, the sample’s absorbance-dependent water vapor interference is not simply due to the deviation from Beer’s law of the water vapor absorption. According to “resolution error theory” by Anderson and Griffiths [
24,
25], the absorption spectrum of water vapor measured under low spectral resolution (
i.e., 4 cm
−1) does not follow Beer’s law. This means that the spectral subtraction between two different water vapor absorption spectra with one universal subtraction factor can never result in complete atmospheric compensation within the entire sample’s absorption band. However, in our study, we keep the concentration of water vapor constant with sample shuttle during spectral acquisition (as evidenced in
Figure 2). Therefore, the “resolution error” issue is no longer an issue in our study.
To better understand this new phenomenon, we provide the following mathematical reasoning. As we know, the negative logarithm of the ratio of sample’s single-beam spectrum to reference’s single-beam spectrum gives an FTIR absorption spectrum. If we take the liquid H
2O spectrum in
Figure 1a as an example, the measured absorbance of liquid H
2O taken under atmospheric conditions can in principle be expressed according to Equation (1). In Equation (1),
AbsH2O(
measured) is the measured value of liquid H
2O’s absorbance;
AbsH2O(
theoretical) is the theoretical value of liquid H
2O’s absorbance; the second term, log
![Ijms 15 10018 i002]()
, is the water vapor interference term where
I0 is the energy of infrared (IR) radiation from the IR source;
TcaF2 is the transmittance of CaF
2 window and is assumed to be identical for both sample scanning and reference scanning;
![Ijms 15 10018 i004]()
is the transmittance of water vapor in sample scanning;
![Ijms 15 10018 i005]()
is the transmittance of water vapor in reference scanning. If we assume a constant water vapor concentration level during spectral acquisition (this can be technically achieved as evidenced by the water-vapor-free 100% transmittance spectrum in
Figure 2),
![Ijms 15 10018 i004]()
and
![Ijms 15 10018 i005]()
will be equal and the log
![Ijms 15 10018 i002]()
term will be zero. In this way, the measured absorbance of liquid H
2O,
AbsH2O(
measured), will be its true value,
AbsH2O(
theoretical). This situation is called complete atmospheric compensation and under such situation the measured absorption spectrum of liquid H
2O will be free from water vapor interference. However, any spectral measurement is accompanied by noise. Therefore, in practice, the measured absorbance of liquid H
2O,
AbsH2O(
measured), should be expressed according to Equation (2) by taking noise into account. In Equation (2),
Noises′ is the noise level of the single-beam spectrum of sample scanning and
NoiseR is the noise level of the single-beam spectrum of reference scanning. If
Noises′ and
NoiseR are equal, the log
![Ijms 15 10018 i007]()
term can still be zero at each frequency and the measured absorbance,
AbsH2O(
measured), will still be equal to its theoretical value of
AbsH2O(
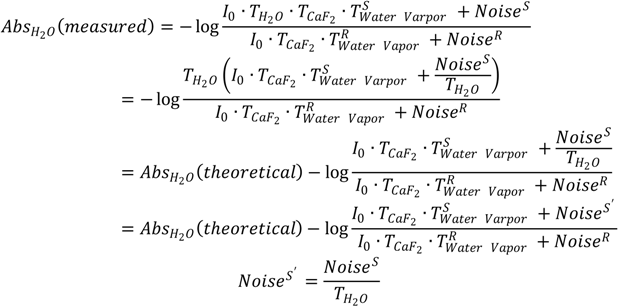
theoretical). Yet, the real situation is that the layer of liquid H
2O in the optical path actually behaves like an optical filter that attenuates the energy of IR radiation from the IR source. As spectral noise level depends on the energy of IR radiation [
26], this will make
Noises′ different from
NoiseR. Consequently, the water vapor interference term of log
![Ijms 15 10018 i007]()
is no longer zero and the measured absorbance of liquid H
2O will contain the contributions from uncompensated water vapor absorptions even if
![Ijms 15 10018 i004]()
=
![Ijms 15 10018 i005]()
. Moreover, since the noise level varies with the absorbance of liquid H
2O at each frequency, the water vapor interference term of log
![Ijms 15 10018 i007]()
will be different at each frequency within the absorption band. This will result in the so-called sample’s absorbance-dependent water vapor interference. The relationship of
![Ijms 15 10018 i008]()
·
Noises also explains why the larger the absorbance of liquid H
2O, the greater the water vapor interference. In this mathematical reasoning, we use noise as the origin of the additive term in Equation (2). Whether there is an alternative cause for the additive term is an open question and deserves future investigation.
We here take liquid H
2O as an example for our reasoning, the sample’s absorbance-dependent water vapor interference phenomenon is apparently an issue inherent to any FTIR measurement including in the case of measuring protein FTIR spectrum whenever the measurement is taken under atmospheric conditions. By nature, the sample’s absorbance-dependent water vapor interference can be considered as a unique type of deviation from Beer’s law, but it is different from the deviation from Beer’s law in quantitative analysis in our conventional wisdom because the measured sample’s absorbance still follows Beer’s law. It is the second derivative spectrum that is significantly “deviated” from its true spectrum.
An immediate implication from the sample’s absorbance-dependent water vapor interference phenomenon is that the successful elimination of water vapor interference at several selected frequencies in the amide I region or from the 1850–1720 cm−1 window region cannot guarantee the successful elimination of water vapor interference from the entire amide I region because the extent of water vapor interference varies with protein’s absorbance at each frequency. Therefore, the above mathematical reasoning provides the theoretical basis for us to challenge the reliability of the established “single-point” criterion and “window-region” criterion.
We now provide several examples to further question the reliability of the established “single-point” and “window-region” criteria.
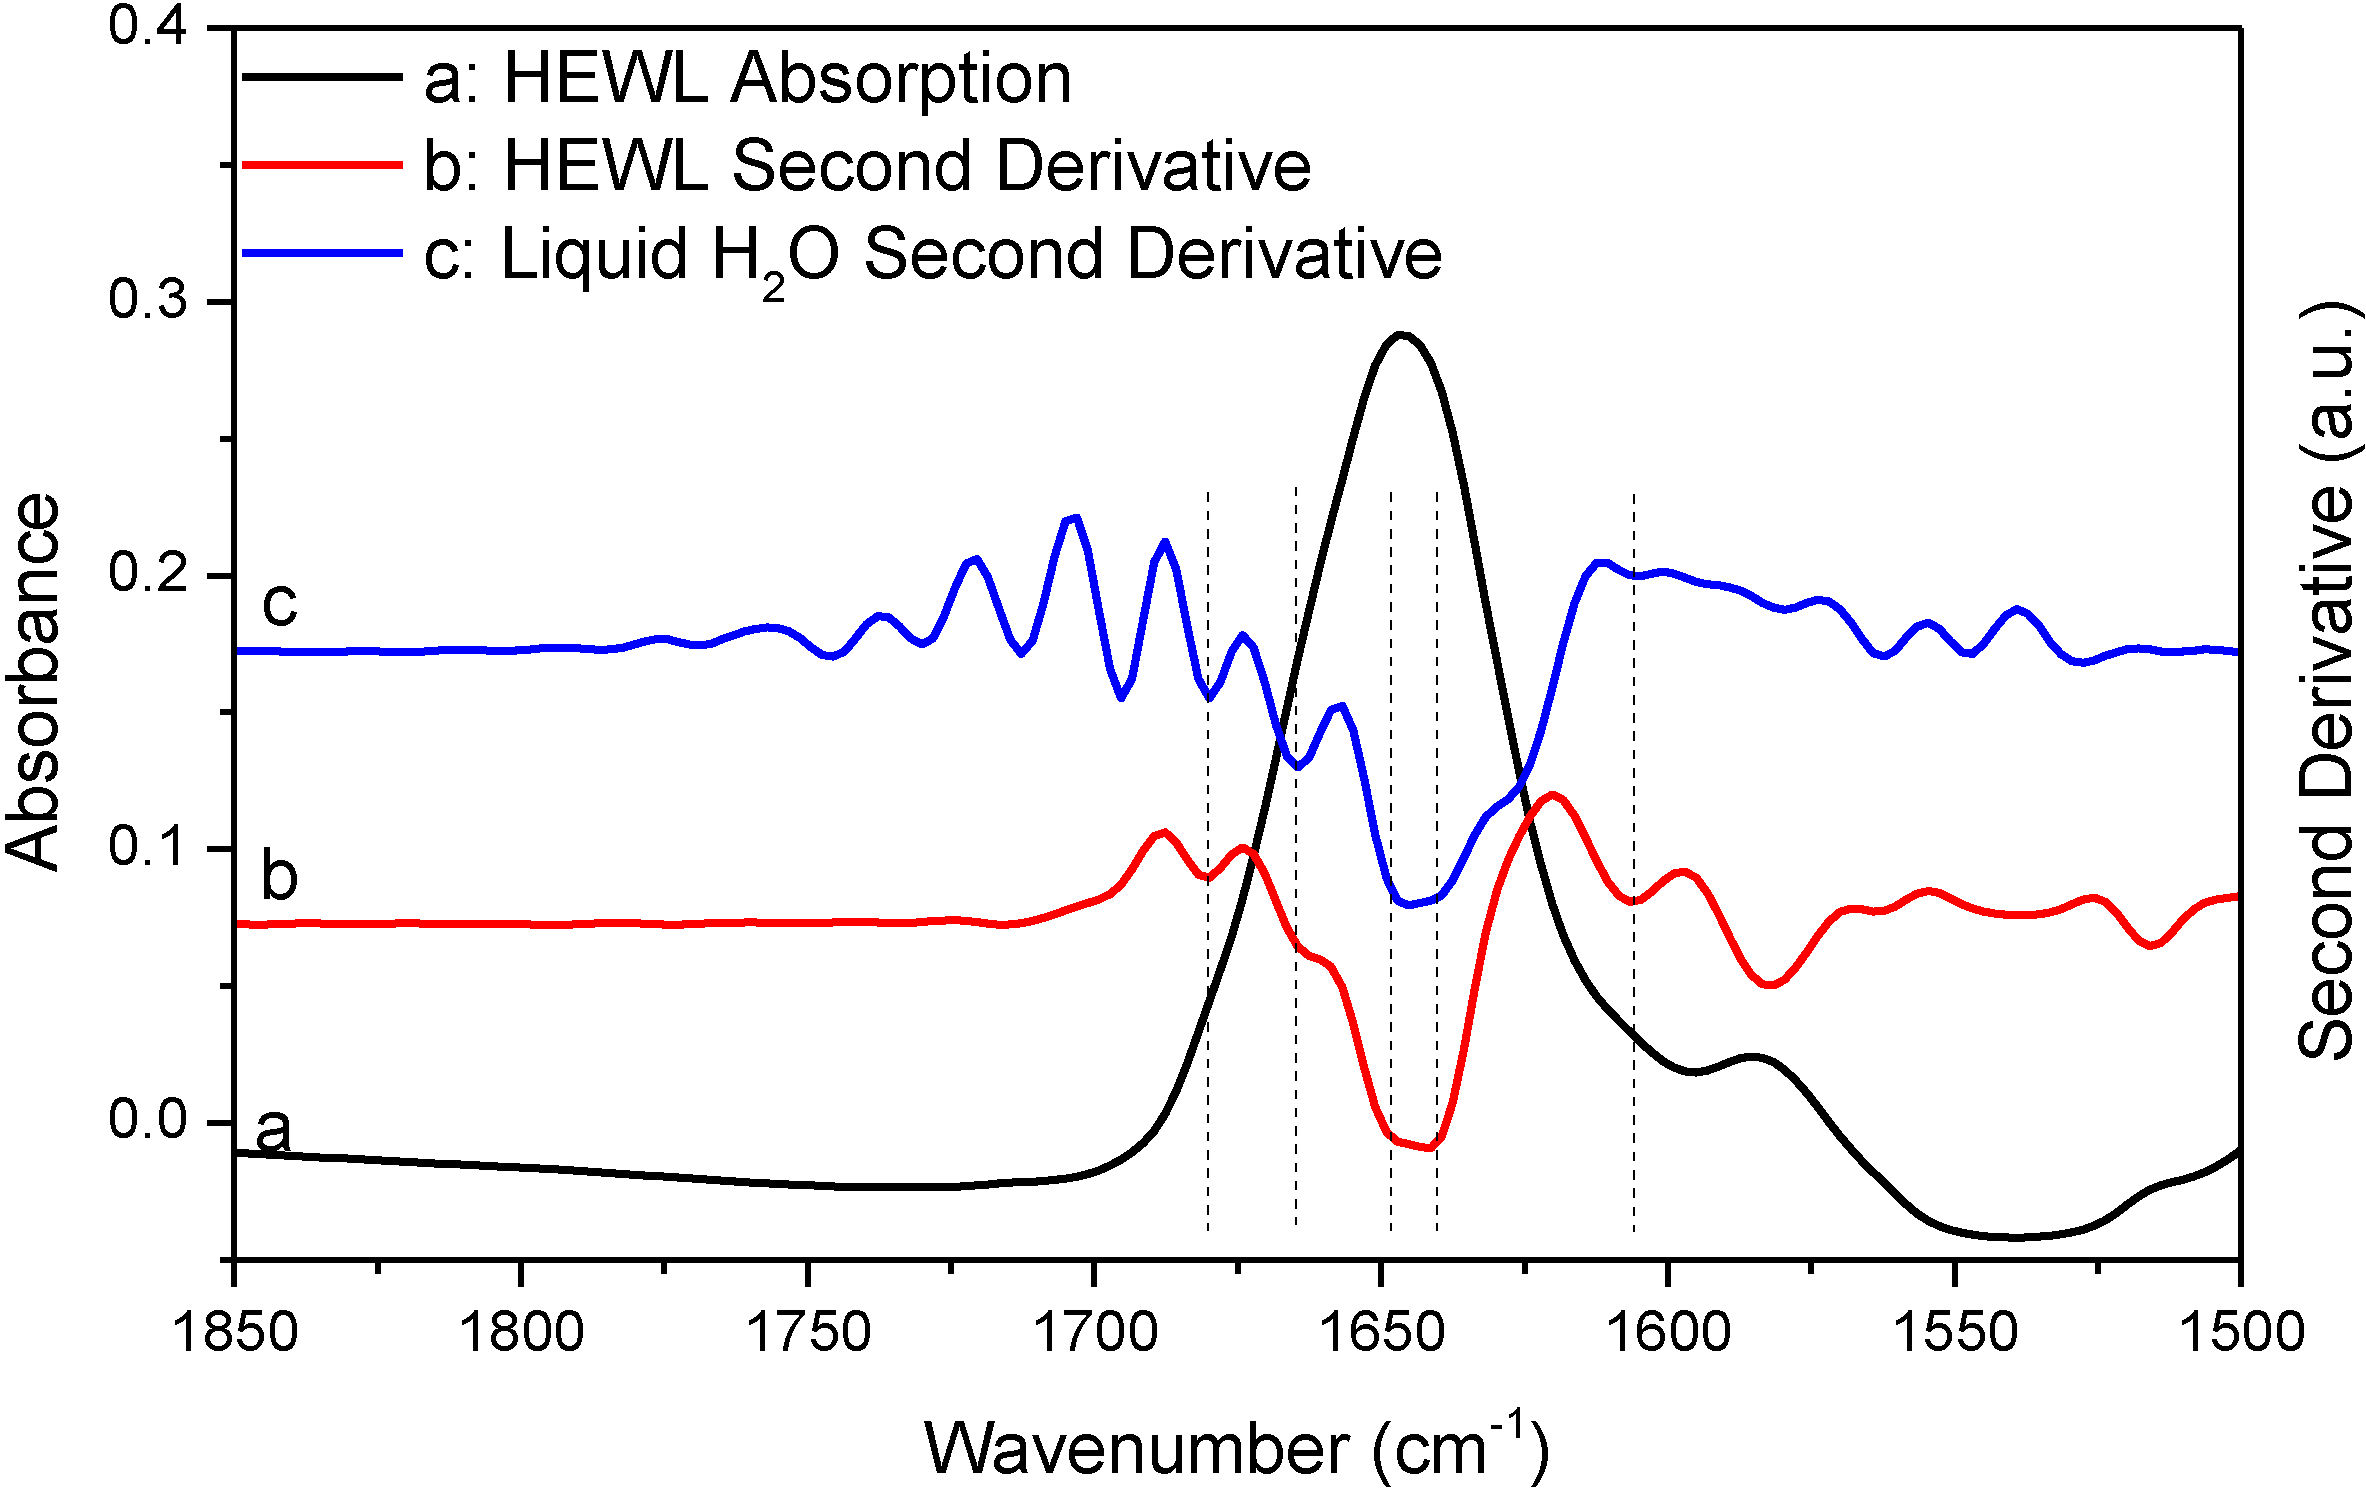
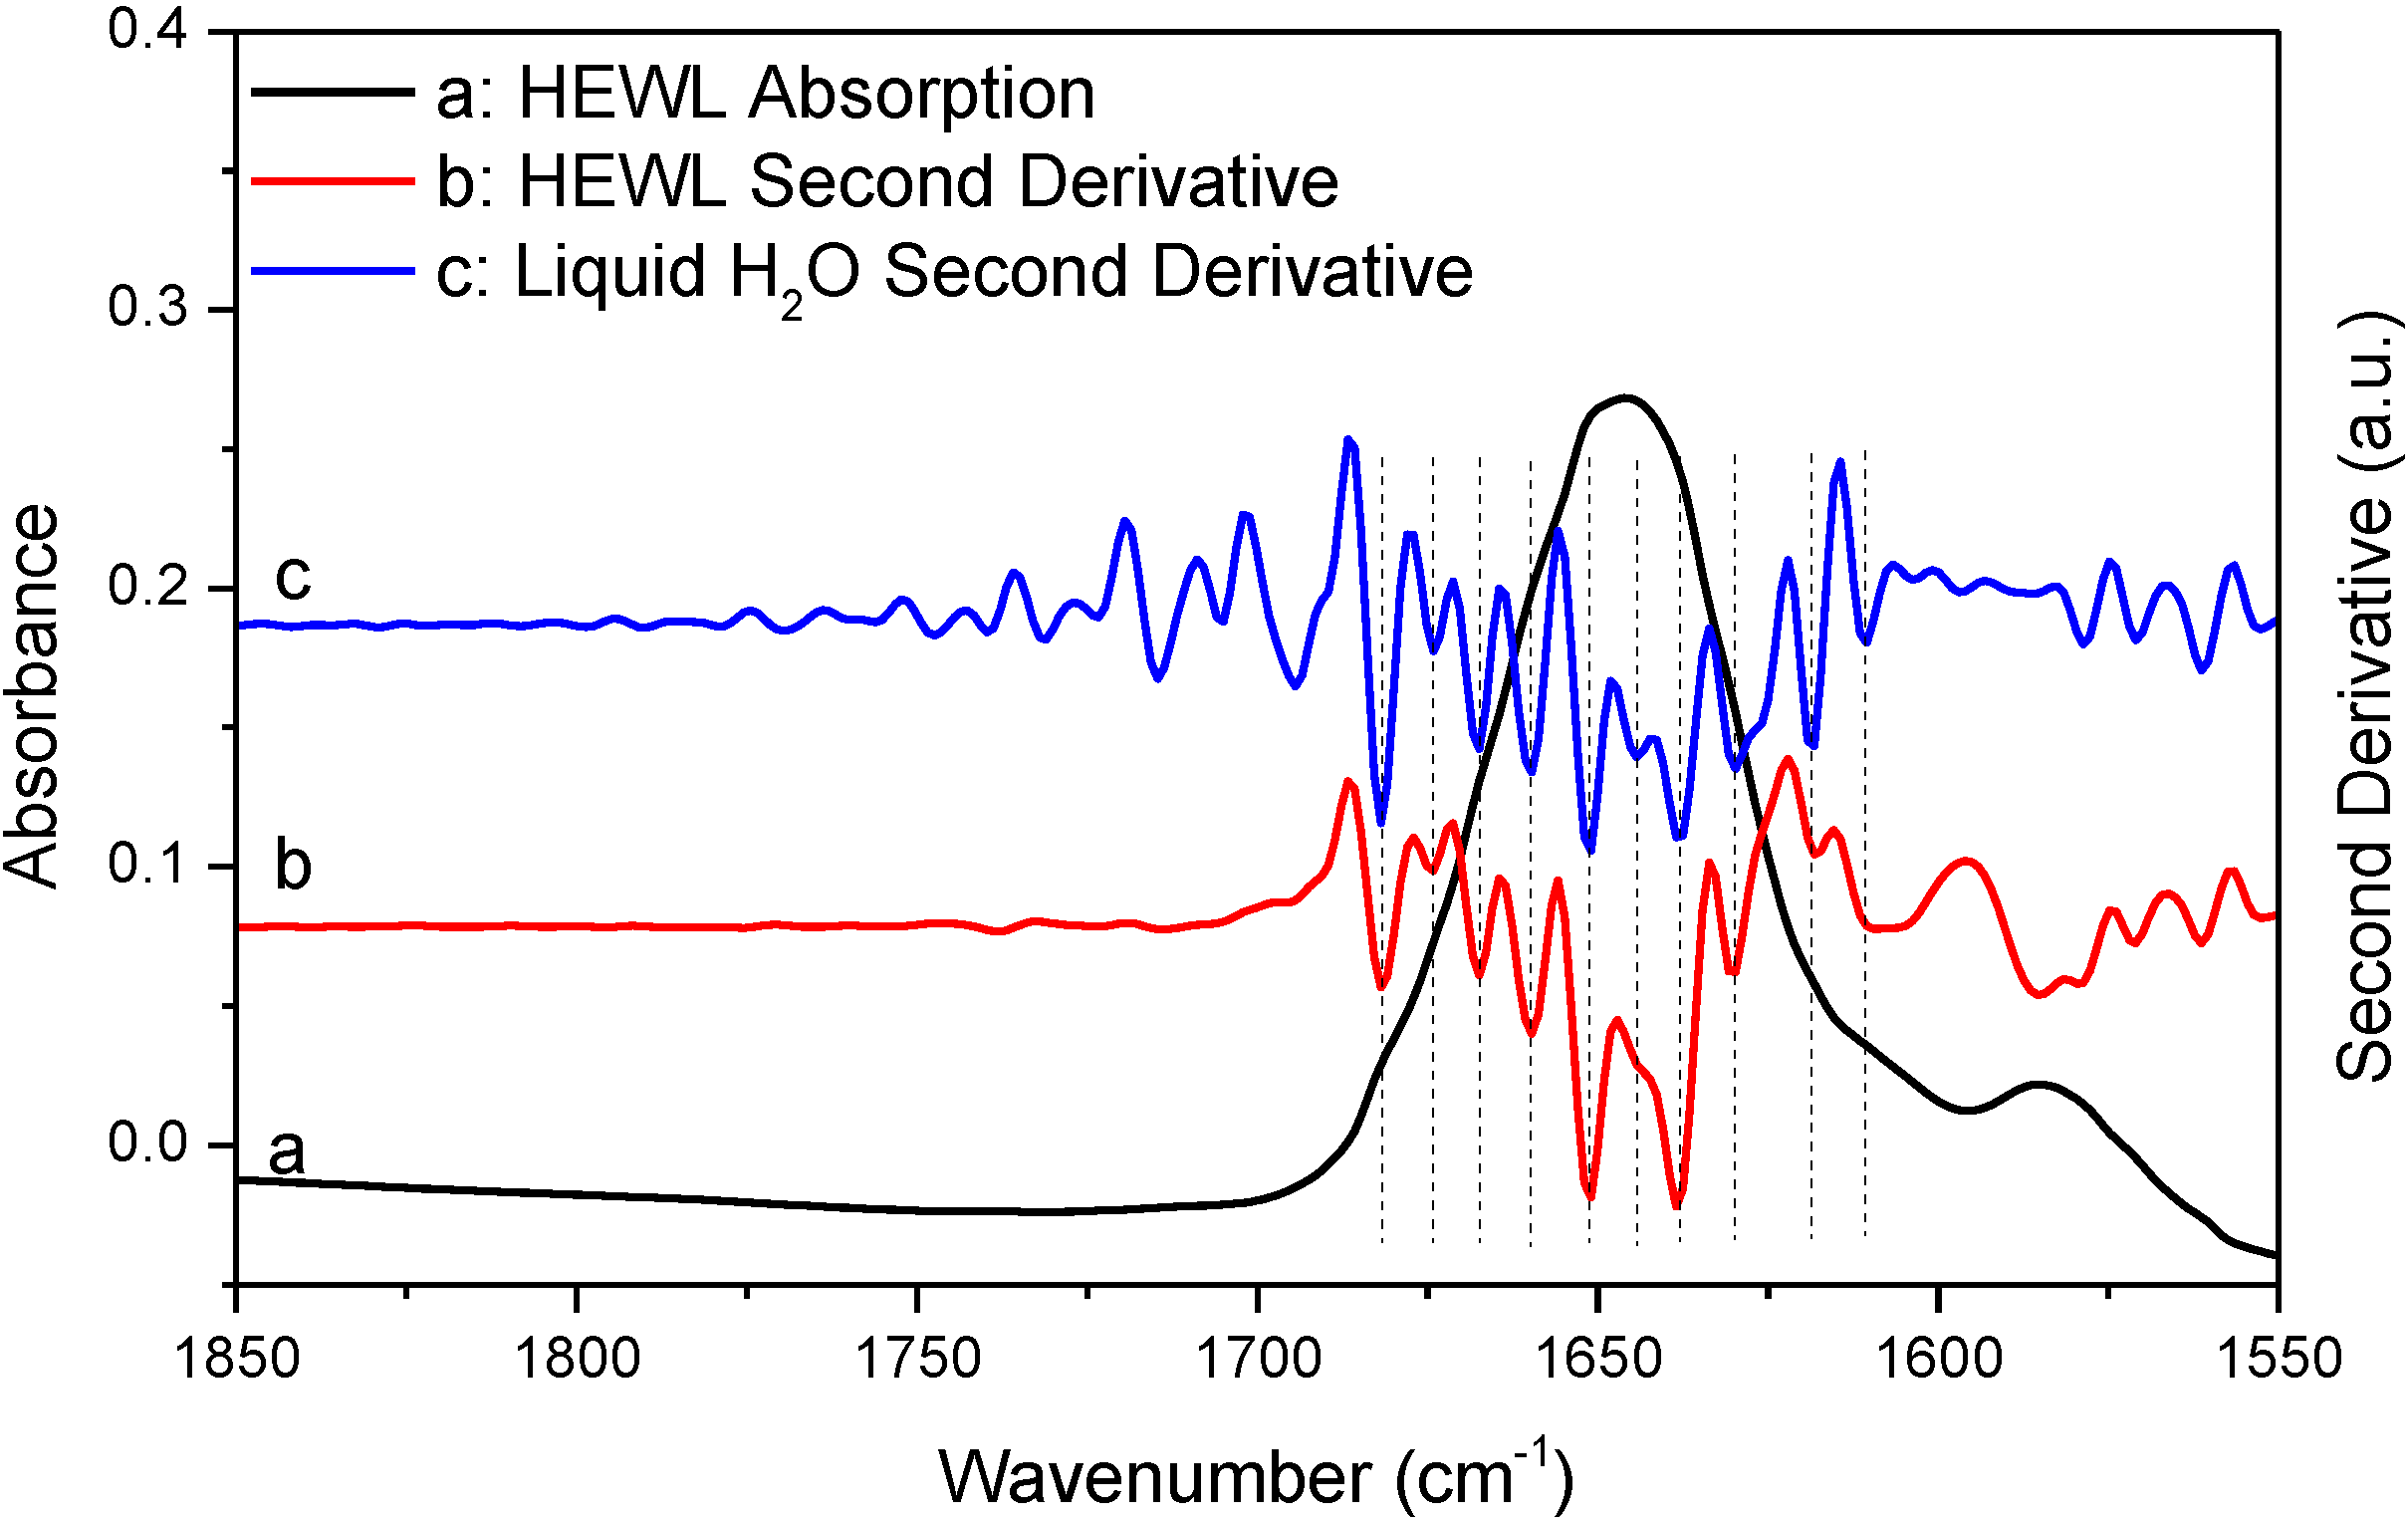
Figure 3 shows the absorption spectrum of deuterated hen egg white lysozyme (HEWL) amide I' band. The spectrum was obtained with sample shuttle to ensure negligible water vapor concentration fluctuation during spectral acquisition. HEWL is used here as a model protein. Though choosing HEWL is random, the nearly featureless amide I band of HEWL indeed makes HEWL a nice model protein when testing the effect of water vapor interference on the outcomes of second derivative and FSD. The absorption spectrum of HEWL apparently satisfies the established criteria for the elimination of water vapor interference. First, the original absorption spectrum looks rather smooth and contains no obvious features that can be assigned to water vapor absorption. Furthermore, none of the resolved peaks by second derivative technique matches the absorption peaks of water vapor in frequency as indicated in
Table 1. These observations support that the HEWL spectrum satisfies the “single-point” criterion. Second, the 1850–1720 cm
−1 window regions in both of the original spectrum and the second derivative spectrum in
Figure 3 are featureless besides some spectral noises. This point is more explicitly illustrated in
Figure S2 with the magnified window region. This means that the HEWL spectrum in
Figure 3 also satisfies the “window-region” criterion. Based on the above observations, we can conclude that the HEWL spectrum in
Figure 3 satisfies all of the established criteria and should be considered as being negligibly affected by water vapor interference. Consequently, the resolved peaks in the second derivative spectrum of HEWL should be assigned to protein secondary structures. Yet, the comparison between the two second derivative spectra of HEWL and liquid H
2O in
Figure 3 obviously contradicts such conclusion. As indicated by the vertical lines in
Figure 3, all the peaks resolved by second derivative technique from HEWL spectrum match the resolved peaks (
i.e., the artifact peaks due to water vapor interference) from liquid H
2O very well. In
Table 1, we list the two sets of frequencies to further illustrate this point. This observation serves as strong evidence to support that a protein absorption spectrum judged by the established criteria to be water vapor interference free can still be significantly affected by water vapor interference. In
Table 1, one may wonder why the actual frequencies of the resolved peaks due to water vapor interference do not match the frequencies of water vapor absorption bands. This is due to the fact that the resolved peak frequencies and even the number of the resolved peaks by second derivative technique highly depend on window size in Savitzky-Golay algorithm used for second derivative treatment and zero-filling factor. Realizing this point is critical. Otherwise, we may falsely conclude that the resolved peaks in the second derivative spectrum of HEWL are the component peaks due to protein secondary structures because these peaks do not match the absorption peaks of water vapor in frequency according to the “single-point” criterion.
Figure 3.
FTIR absorption (a) and second derivative (b) spectra of HEWL in D
2O and second derivative spectrum of liquid H
2O (c). Second derivative spectrum is displayed with its resolved peaks pointing downwards and is in arbitrary unit (a.u.). The negative
y-axis offset observed in the HEWL absorption spectrum is due to a slight mismatch in thickness between sample IR cell and reference IR cell which results in imperfect solvent D
2O subtraction. This has no effect on water vapor compensation between sample scanning and reference scanning [
3]. Spectral resolution: 4 cm
−1.
Table 1.
Frequencies of the resolved peaks in the second derivative spectra of HEWL and liquid H2O and frequencies of the absorption peaks of water vapor in the amide I region.
Table 1.
Frequencies of the resolved peaks in the second derivative spectra of HEWL and liquid H2O and frequencies of the absorption peaks of water vapor in the amide I region.
| Spectrum | Peak Frequency (cm−1) |
|---|
| HEWL (second derivative) | 1682 | 1674 | 1667 | 1660 | 1651 | 1638 | 1630 | 1618 |
| Liquid H2O (second derivative) | 1682 | 1674 | 1667 | 1660 | 1651 | 1638 | 1630 | 1618 |
| Water Vapor (absorption) | 1684 | 1670 | 1663 | 1653 | 1647 | 1636 | 1623 | 1616 |
In
Figure 4 and
Figure 5, we performed additional comparative studies of HEWL and liquid H
2O under different conditions,
i.e., using 8 cm
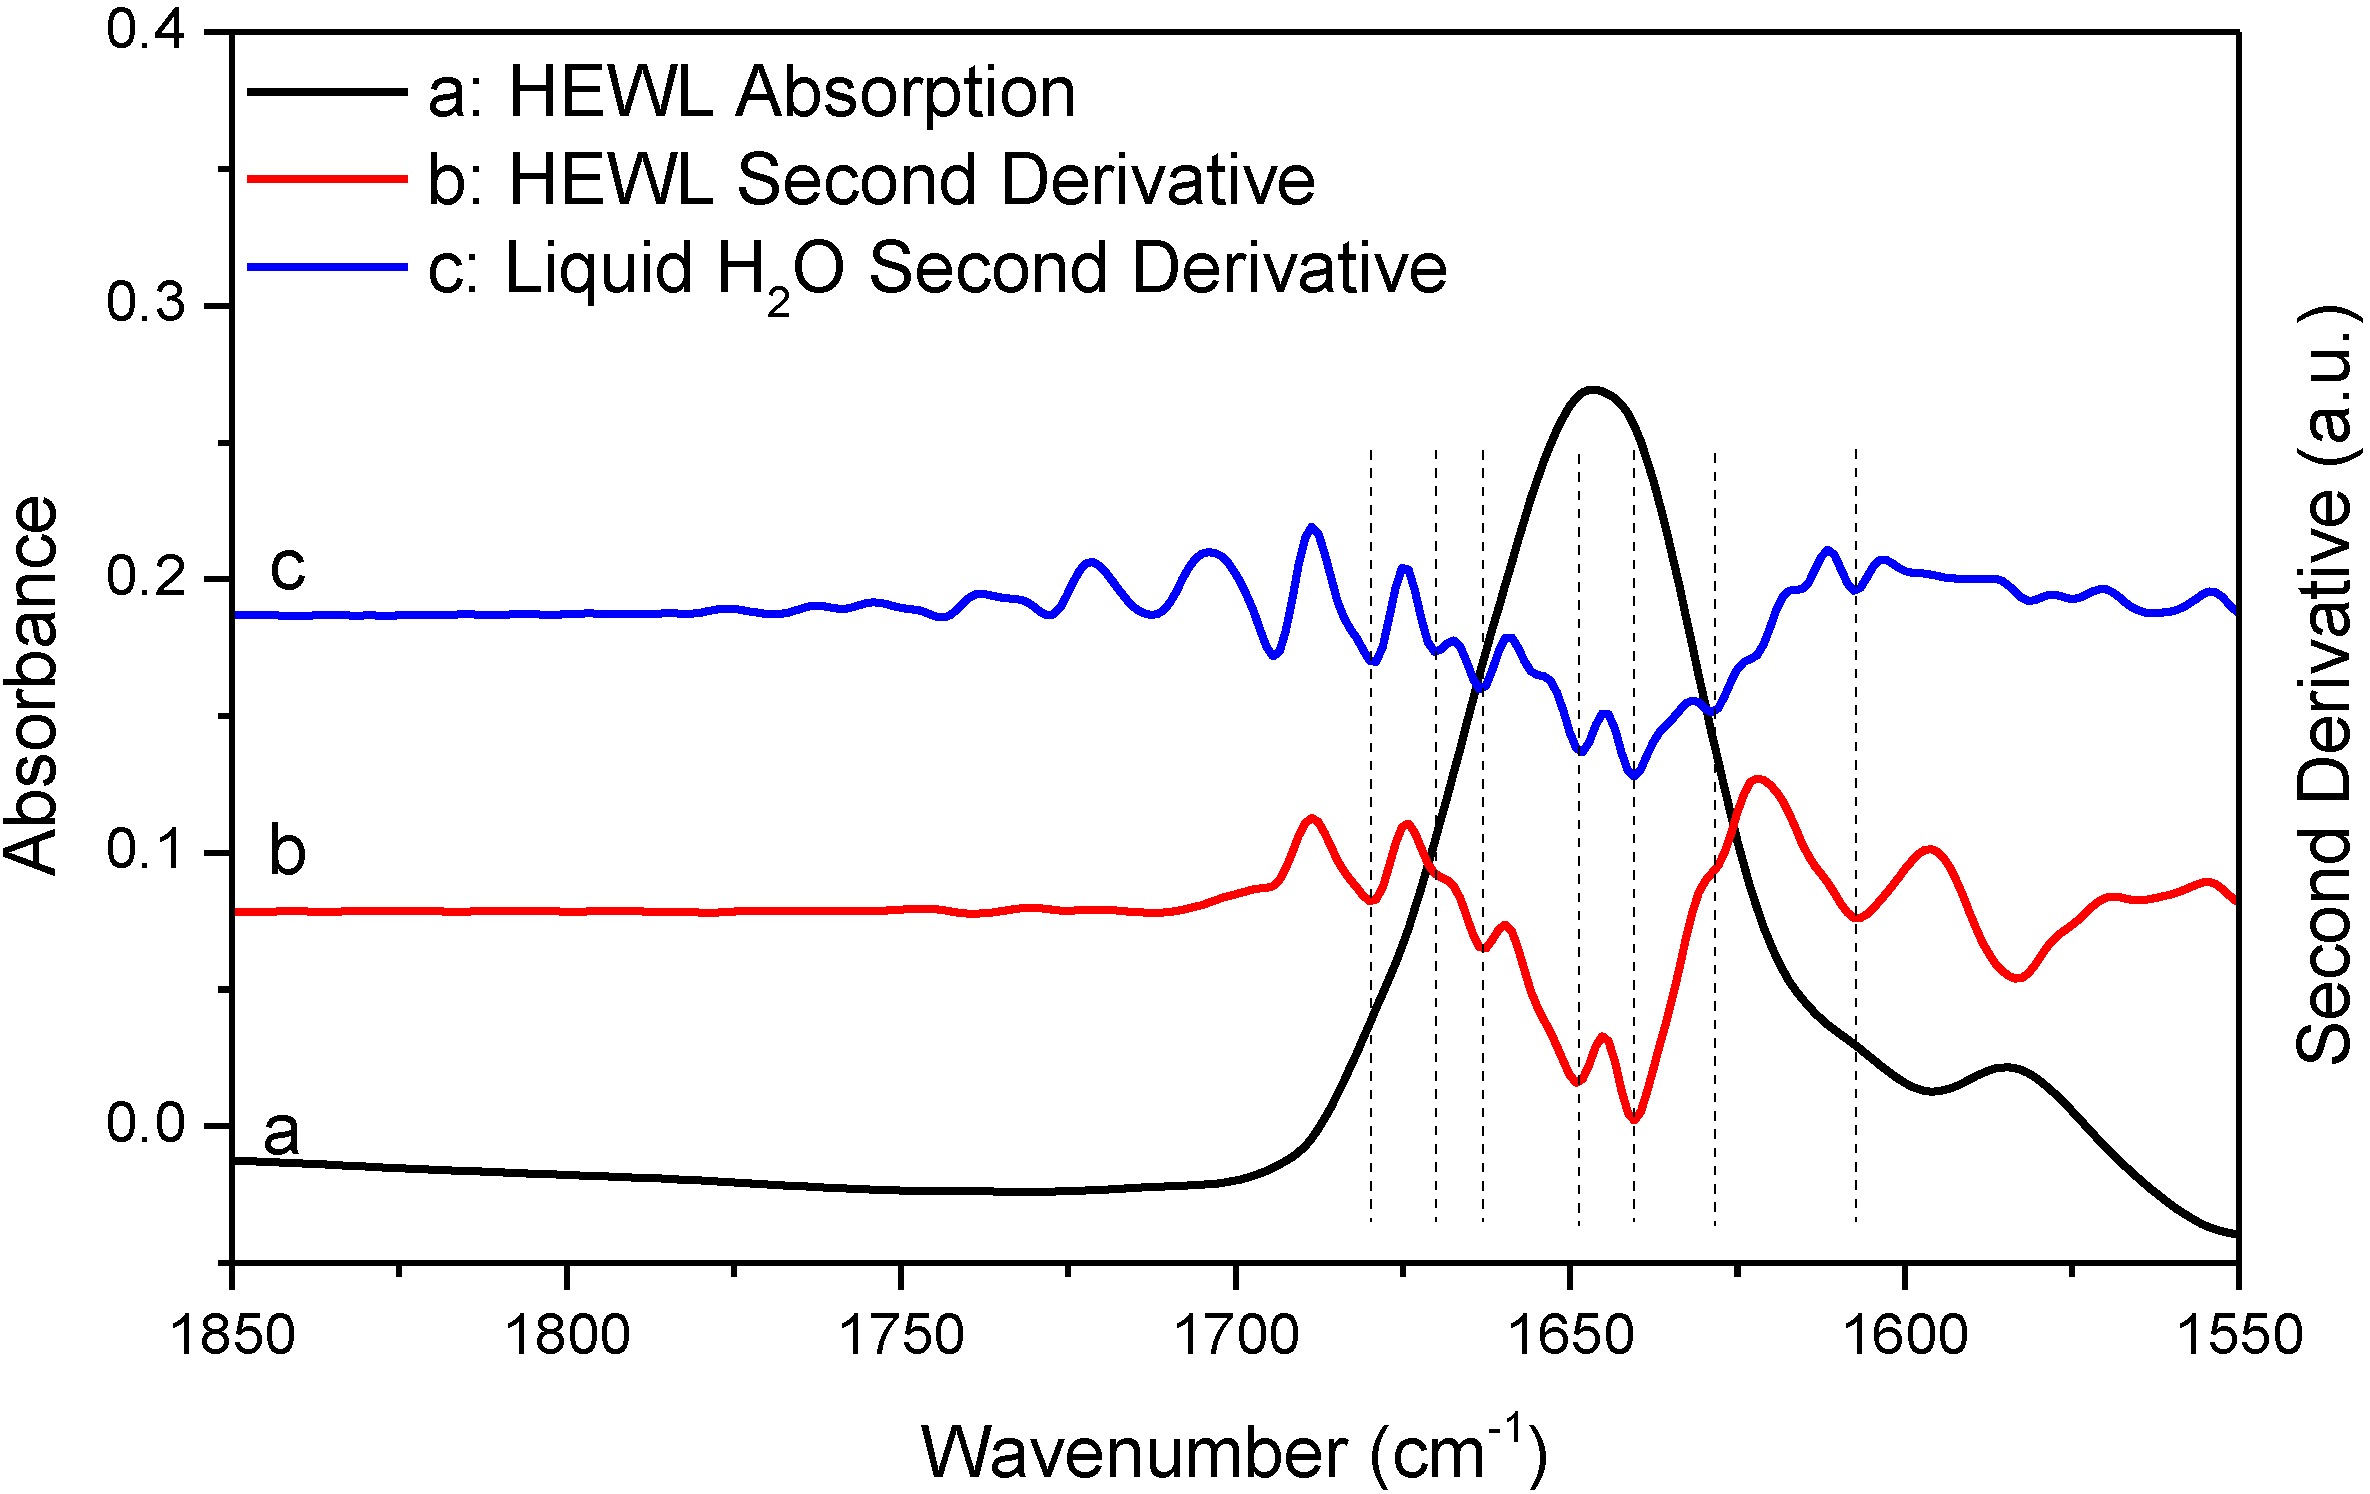
−1 spectral resolution to collect the absorption spectrum of HEWL and using smoothing to pretreat the absorption spectrum of HEWL before second derivative treatment.
Figure 4 shows the HEWL absorption spectrum collected with 8 cm
−1 resolution and its second derivative;
Figure 5 shows the HEWL absorption spectrum after 17-point smoothing and its second derivative. In
Figure 4 and
Figure 5, the second derivative spectra of liquid H
2O that are subjected to the same acquisition condition and spectral treatment are shown for comparison. The two HEWL absorption spectra apparently satisfy both the “single-point” criterion and the “window-region” criterion. This is as expected because low spectral resolution and smoothing are known to be able to further suppress water vapor interference. Yet, the perfect match in frequency between the second derivative spectra of HEWL and liquid H
2O as illustrated by the vertical lines in
Figure 4 and
Figure 5 again supports that a protein spectrum satisfying the established criteria is still affected by water vapor interference significantly. It also indicates that the perfect match in frequency between the two sets of resolved peaks of HEWL and liquid H
2O in
Figure 3 is not just a coincidence. Besides the HEWL system, we also investigated two additional protein systems, bovine serum albumin and cytochrome c. The two absorption spectra shown in
Figures S3 and S4 satisfy both the “single-point” criterion and the “window-region” criterion. Yet, the two spectra are still significantly affected by water vapor interference as evidenced through the comparison between the second derivative spectra of protein and liquid H
2O. These observations again support our argument that the established criteria cannot offer reliable evaluation of water vapor interference in the protein amide I band.
Figure 4.
FTIR absorption (a) and second derivative (b) spectra of HEWL in D2O and second derivative spectrum of liquid H2O (c). Second derivative spectrum is displayed with its resolved peaks pointing downwards and is in arbitrary unit (a.u.). Spectral resolution: 8 cm−1.
Figure 4.
FTIR absorption (a) and second derivative (b) spectra of HEWL in D2O and second derivative spectrum of liquid H2O (c). Second derivative spectrum is displayed with its resolved peaks pointing downwards and is in arbitrary unit (a.u.). Spectral resolution: 8 cm−1.
Figure 5.
FTIR absorption (a) and second derivative (b) spectra of HEWL in D2O and second derivative spectrum of liquid H2O (c). Second derivative spectrum is displayed with its resolved peaks pointing downwards and is in arbitrary unit (a.u.). Both of the spectra of HEWL and liquid H2O were subjected to 17-point smoothing. Spectral resolution: 4 cm−1.
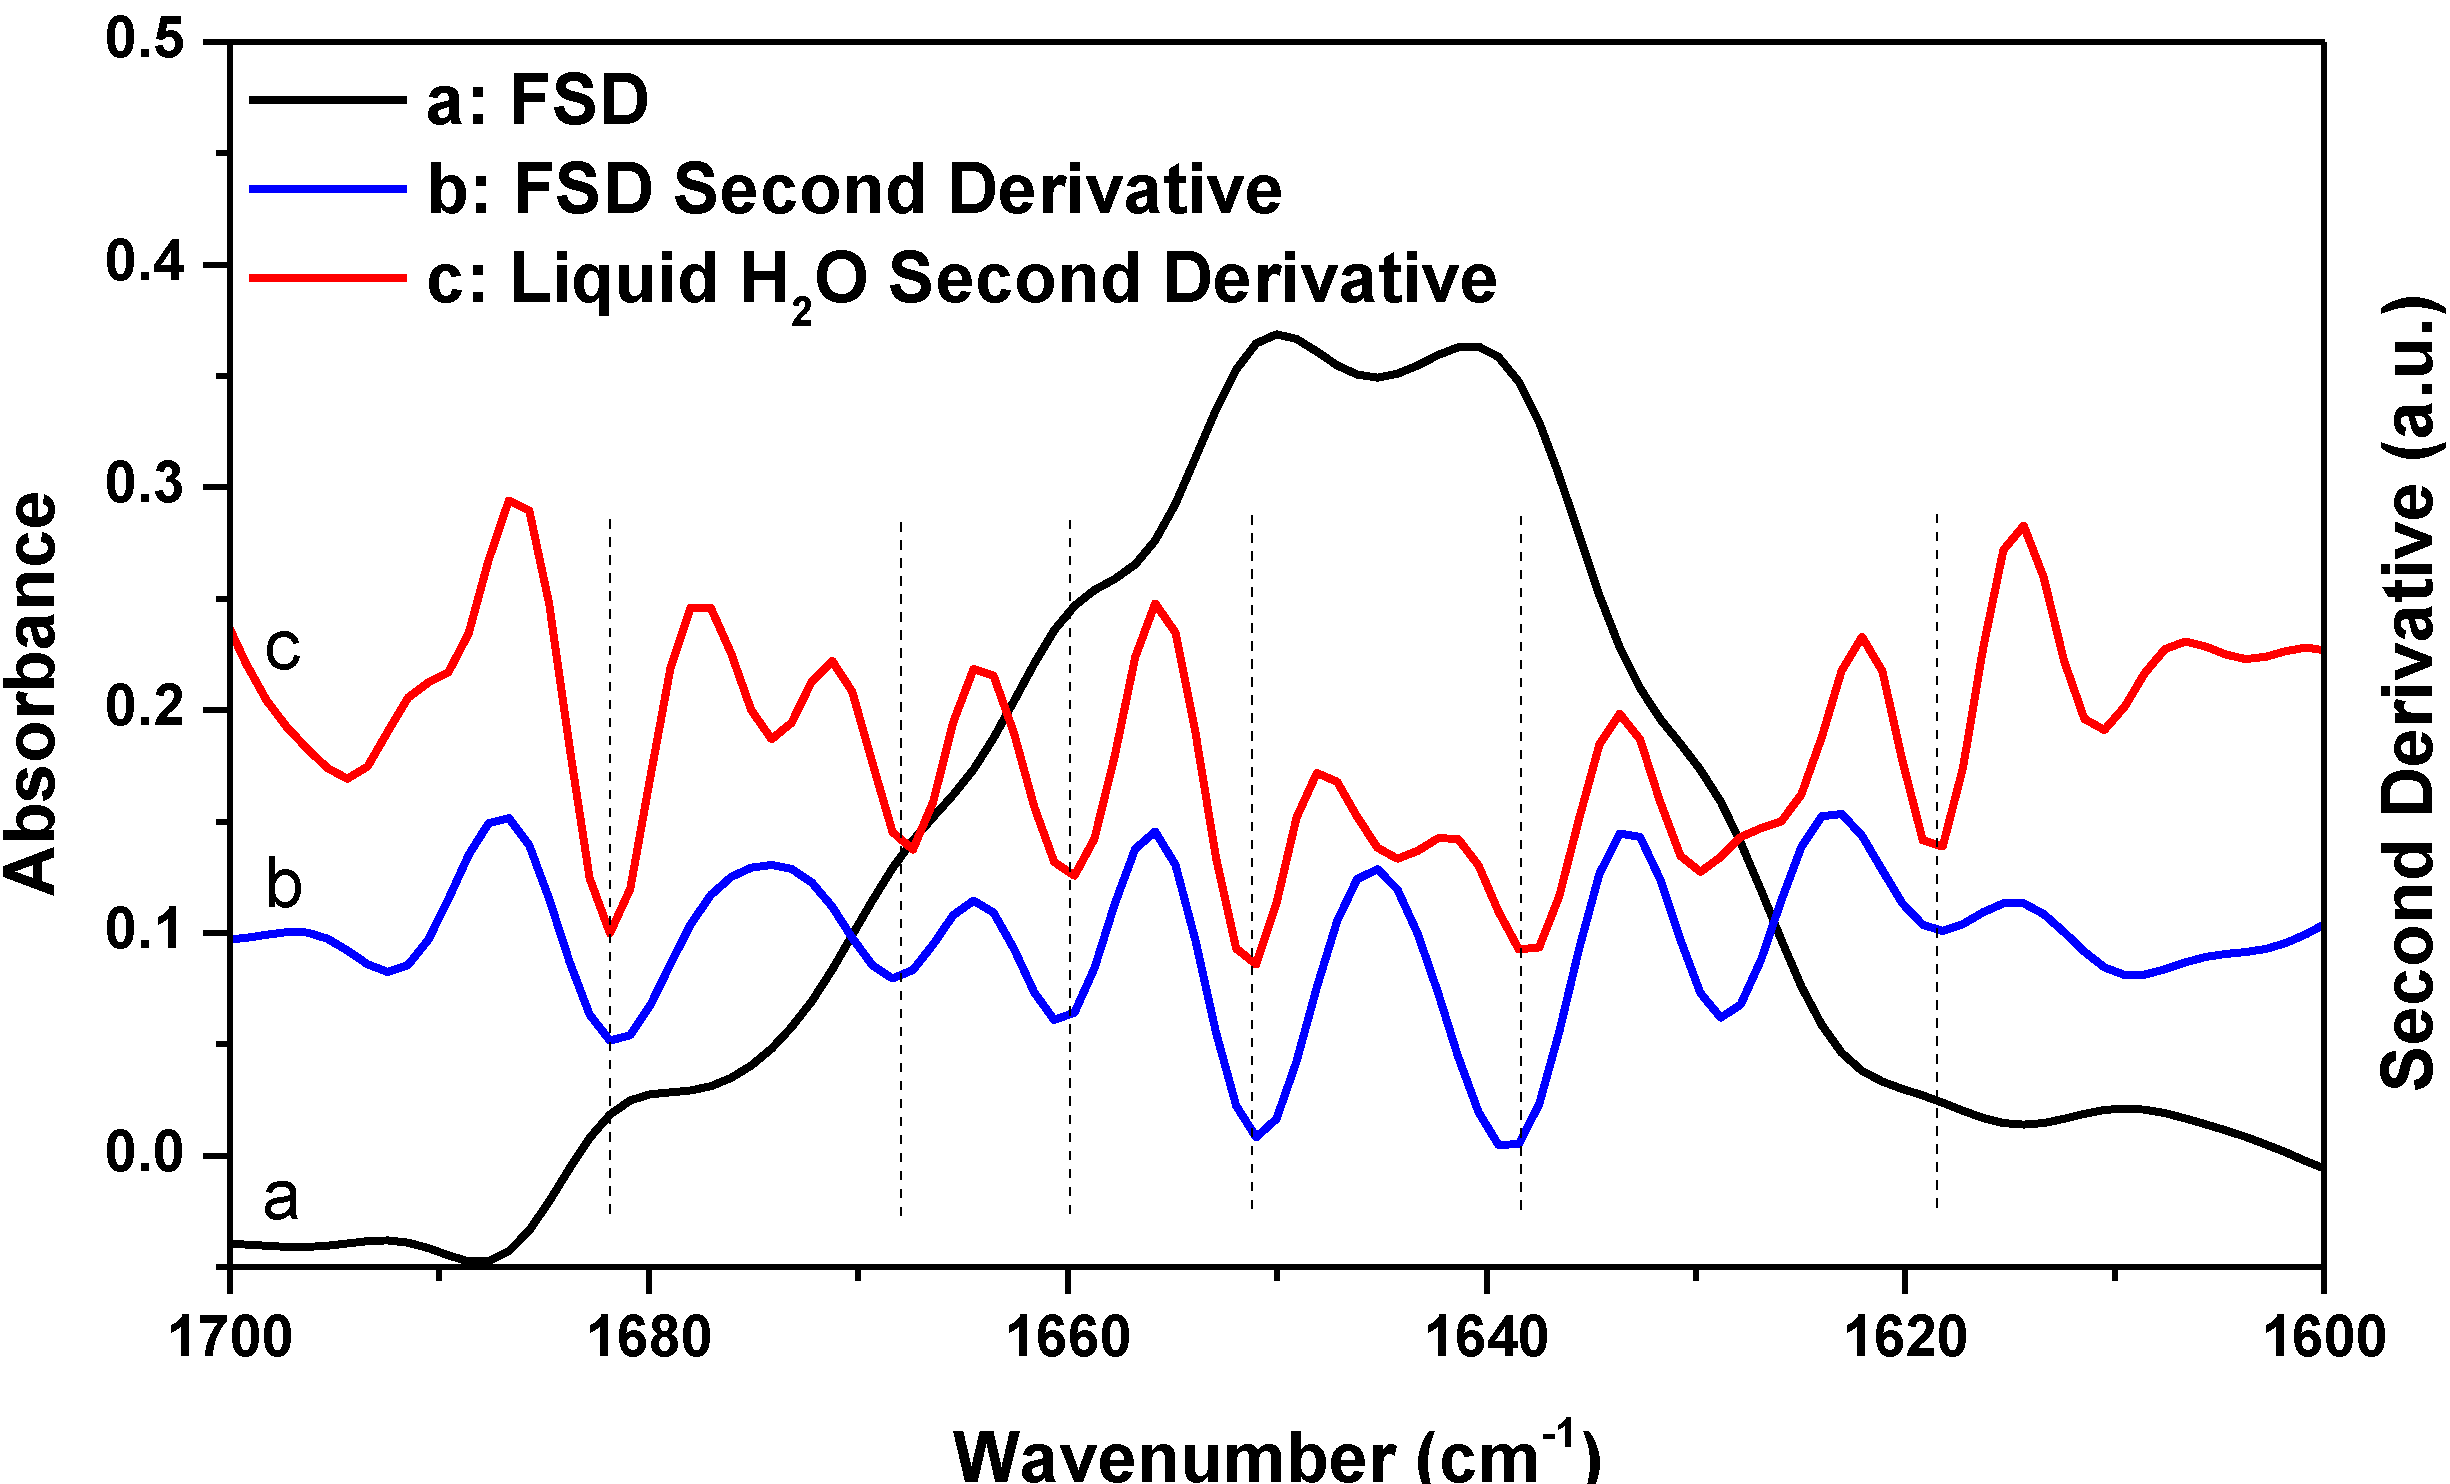
Besides second derivative, FSD is another widely used resolution-enhancement technique in protein secondary structural analysis. To see whether the FSD result also supports the argument that a protein spectrum satisfying the established criteria for successful water vapor absorption elimination can still be significantly affected by water vapor interference, we performed a comparative FSD study of HEWL and liquid H
2O, as shown in
Figure 6. The FSD treatment was performed on the HEWL absorption spectrum shown in
Figure 3 using Lorentzian bandwidth of 20 cm
−1 and noise suppression factor of 0.3. FSD is a subjective technique and there is no consensus in the literature on what should be the most appropriate values for bandwidth and noise suppression factor in FSD for protein secondary structure analysis. The two parameters for
Figure 6 had been used previously for protein spectra taken with Bruker’s FTIR spectrometer [
27]. In
Figure 6, we further performed second derivative treatment on the FSD spectrum as the exact positions of the component peaks in the FSD spectrum often need to be determined by further second derivative treatment on the FSD spectrum [
27]. As indicated by the vertical lines in
Figure 6, the peaks resolved with FSD from HEWL match the resolved artifact peaks due to water vapor interference from liquid H
2O very well. Therefore, the FSD study also supports our argument that the previously established criteria for successful elimination of water vapor interference are not reliable.
Figure 6.
FSD spectrum of HEWL in D2O (a) and its corresponding second derivative (b) and second derivative spectrum of liquid H2O (c). Second derivative spectrum is displayed with its resolved peaks pointing downwards and is in arbitrary unit (a.u.). Spectral resolution: 4 cm−1.
Figure 6.
FSD spectrum of HEWL in D2O (a) and its corresponding second derivative (b) and second derivative spectrum of liquid H2O (c). Second derivative spectrum is displayed with its resolved peaks pointing downwards and is in arbitrary unit (a.u.). Spectral resolution: 4 cm−1.
Since the above mathematical reasoning demonstrates that both the “single-point” and “window-region” criteria are problematic, it is thus desirable to develop some type of “whole-spectrum” criterion to better evaluate the extent of water vapor interference. In fact, the comparative second derivative study of protein and liquid H
2O has provided us a solution. We can employ such comparison as a new criterion to more reliably evaluate water vapor interference. This new criterion can be implemented in the following way. First, we take the absorption spectra of a protein sample and liquid H
2O under identical acquisition conditions and then make them subject to the same data processing such as smoothing and spectral subtraction. Second, we perform a comparison between the second derivative spectra of protein and liquid H
2O. There are two possible situations that one would face. If we do have a perfect elimination of water vapor interference, the second derivative spectrum of liquid H
2O will be like that of liquid D
2O, showing only one component peak. Then under this situation, the resolved peaks from the second derivative spectrum of protein should be identified to be the true component peaks due to protein secondary structures. If we do not have a perfect elimination of water vapor interference, we will search for the matched peaks between the second derivative spectra of protein and liquid H
2O like what we have done in
Figure 3,
Figure 4 and
Figure 5. The resolved peak in the second derivative spectrum of protein that matches the artifact peak in the second derivative spectrum of liquid H
2O in frequency should be considered as artifacts due to water vapor interference (or at least suspected as coincidence does exist occasionally). Besides frequency matching, the similarity in shape between the two matched peaks is another piece of strong evidence for us to confirm the identity of the artifact peak due to water vapor interference.
Before we conclude, there are two additional issues that we would like to address particularly with respect to the implications of our work for the FTIR analysis of protein secondary structures. First, we want to emphasize that though we proposed a new criterion in this study and also questioned the reliability of the established criteria, we have no intent to say that the previously established criteria should be abandoned. In practice, the previously established criteria and the newly proposed criterion can work together to ensure a more reliable second derivative or FSD treatment on protein absorption spectrum. Second, we would like to state that water vapor interference needs not to be a serious concern in every FTIR analysis of protein secondary structure. As we know, there are three types of FTIR approaches in protein secondary structural analysis. The first one is the FTIR curve-fitting approach with the aid of second derivative and FSD. With this approach, the initial guess about the frequencies and the number of the component peaks are based on the results from second derivative or FSD treatment. The actual curve-fitting can be performed on the original spectrum, the inverted second derivative spectrum, or the FSD spectrum. This type of approach is the one that we have been discussing in this study and it is the widely used one compared to the latter two. The second approach is through the curve-fitting of the original absorption spectrum without the aid of second derivative or FSD [
28,
29,
30]. This is a direct-fit approach. With this approach, the initial guess about the frequencies and the number of the component peaks are not based on the results from second derivative or FSD treatment. The third approach is the chemometric approach based on multivariate statistical analysis [
31,
32,
33,
34,
35,
36]. Both of the direct-fit approach and the chemometric approach can be immune to water vapor interference as long as the absorption spectrum is in decent quality without obvious spikes from water vapor. Furthermore, for the chemometric approach, as it is a pure mathematical treatment, it is immune to water vapor interference even though the second derivative or FSD spectra are used in the statistical analysis. Therefore, for the latter two approaches, the previously established criteria are good enough to ensure the FTIR analysis is negligibly affected by water vapor interference. By contrast, for the first FTIR approach involving second derivative or FSD treatment, we do need to have more rigorous criteria to evaluate the effect of water vapor interference. Otherwise, the resolved peaks by second derivative or FSD techniques may largely be the artifacts due to water vapor interference as we have illustrated in
Figure 3,
Figure 4,
Figure 5 and
Figure 6. In this respect, the direct-fit approach and the chemometric approach are advantageous over the second derivative-based or FSD-based curve-fitting approach in protein secondary structural analysis.


 , is the water vapor interference term where I0 is the energy of infrared (IR) radiation from the IR source; TcaF2 is the transmittance of CaF2 window and is assumed to be identical for both sample scanning and reference scanning;
  is the transmittance of water vapor in sample scanning;
  is the transmittance of water vapor in reference scanning. If we assume a constant water vapor concentration level during spectral acquisition (this can be technically achieved as evidenced by the water-vapor-free 100% transmittance spectrum in Figure 2),
 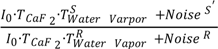 term can still be zero at each frequency and the measured absorbance, AbsH2O(measured), will still be equal to its theoretical value of AbsH2O(theoretical). Yet, the real situation is that the layer of liquid H2O in the optical path actually behaves like an optical filter that attenuates the energy of IR radiation from the IR source. As spectral noise level depends on the energy of IR radiation [26], this will make Noises′ different from NoiseR. Consequently, the water vapor interference term of log
 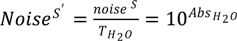 · Noises also explains why the larger the absorbance of liquid H2O, the greater the water vapor interference. In this mathematical reasoning, we use noise as the origin of the additive term in Equation (2). Whether there is an alternative cause for the additive term is an open question and deserves future investigation.
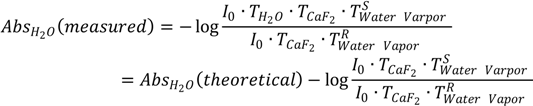

