In Silico Identification of Structure Requirement for Novel Thiazole and Oxazole Derivatives as Potent Fructose 1,6-Bisphosphatase Inhibitors

Abstract
:1. Introduction
2. Results and Discussion
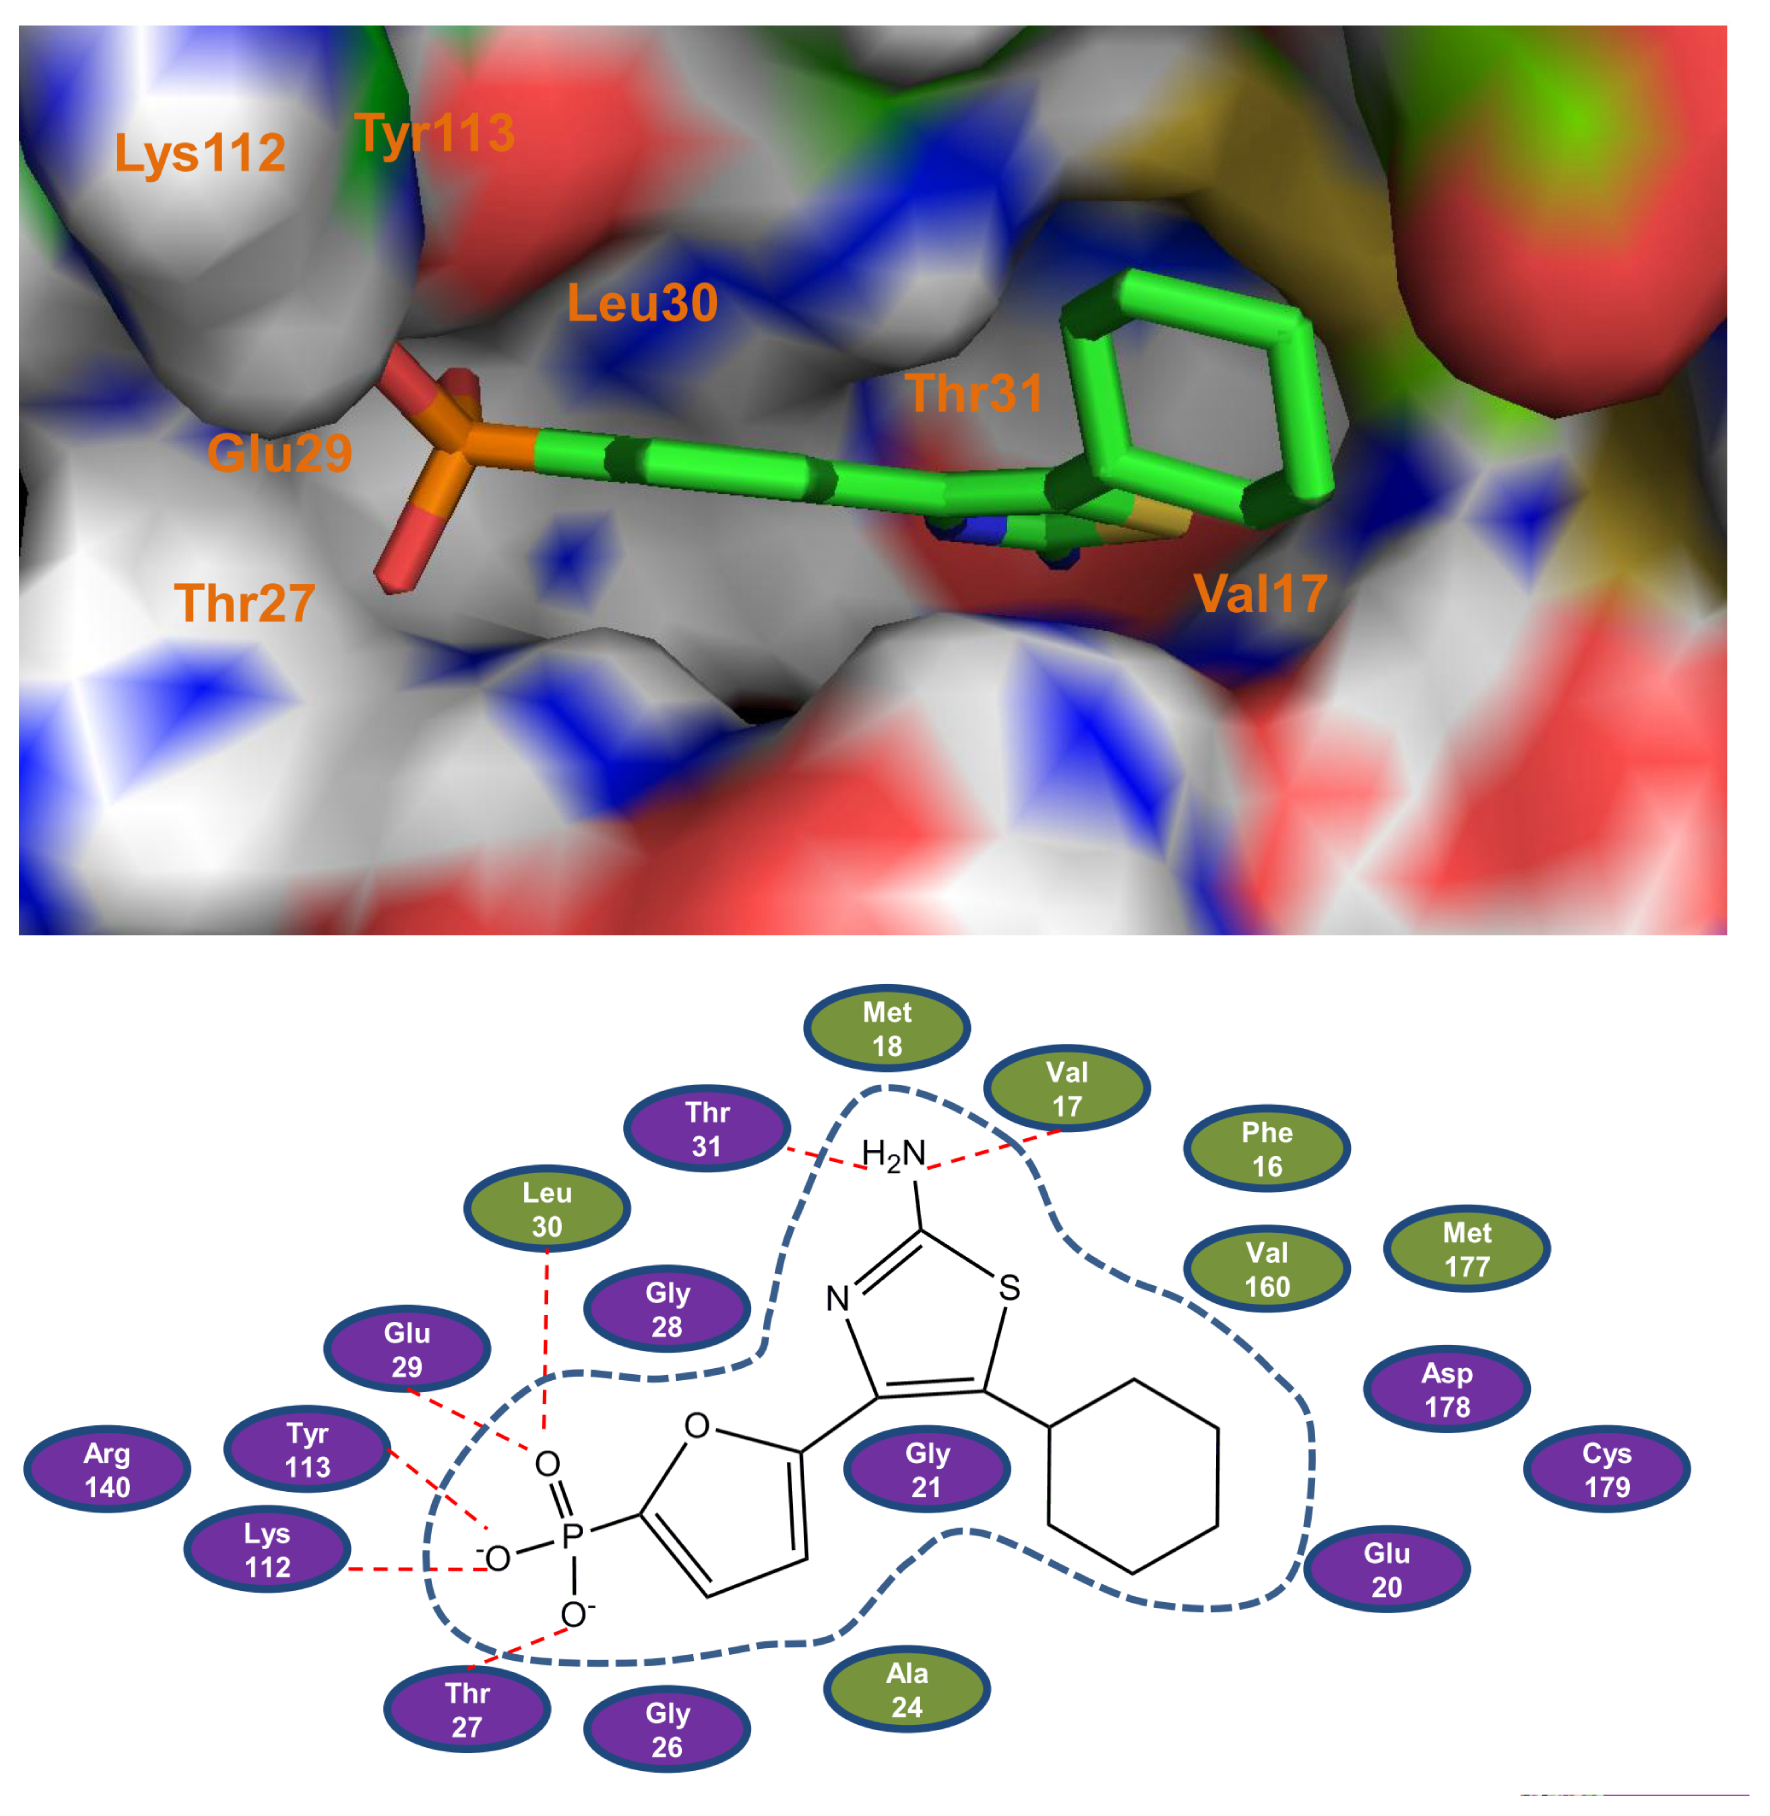
2.1. Molecular Docking
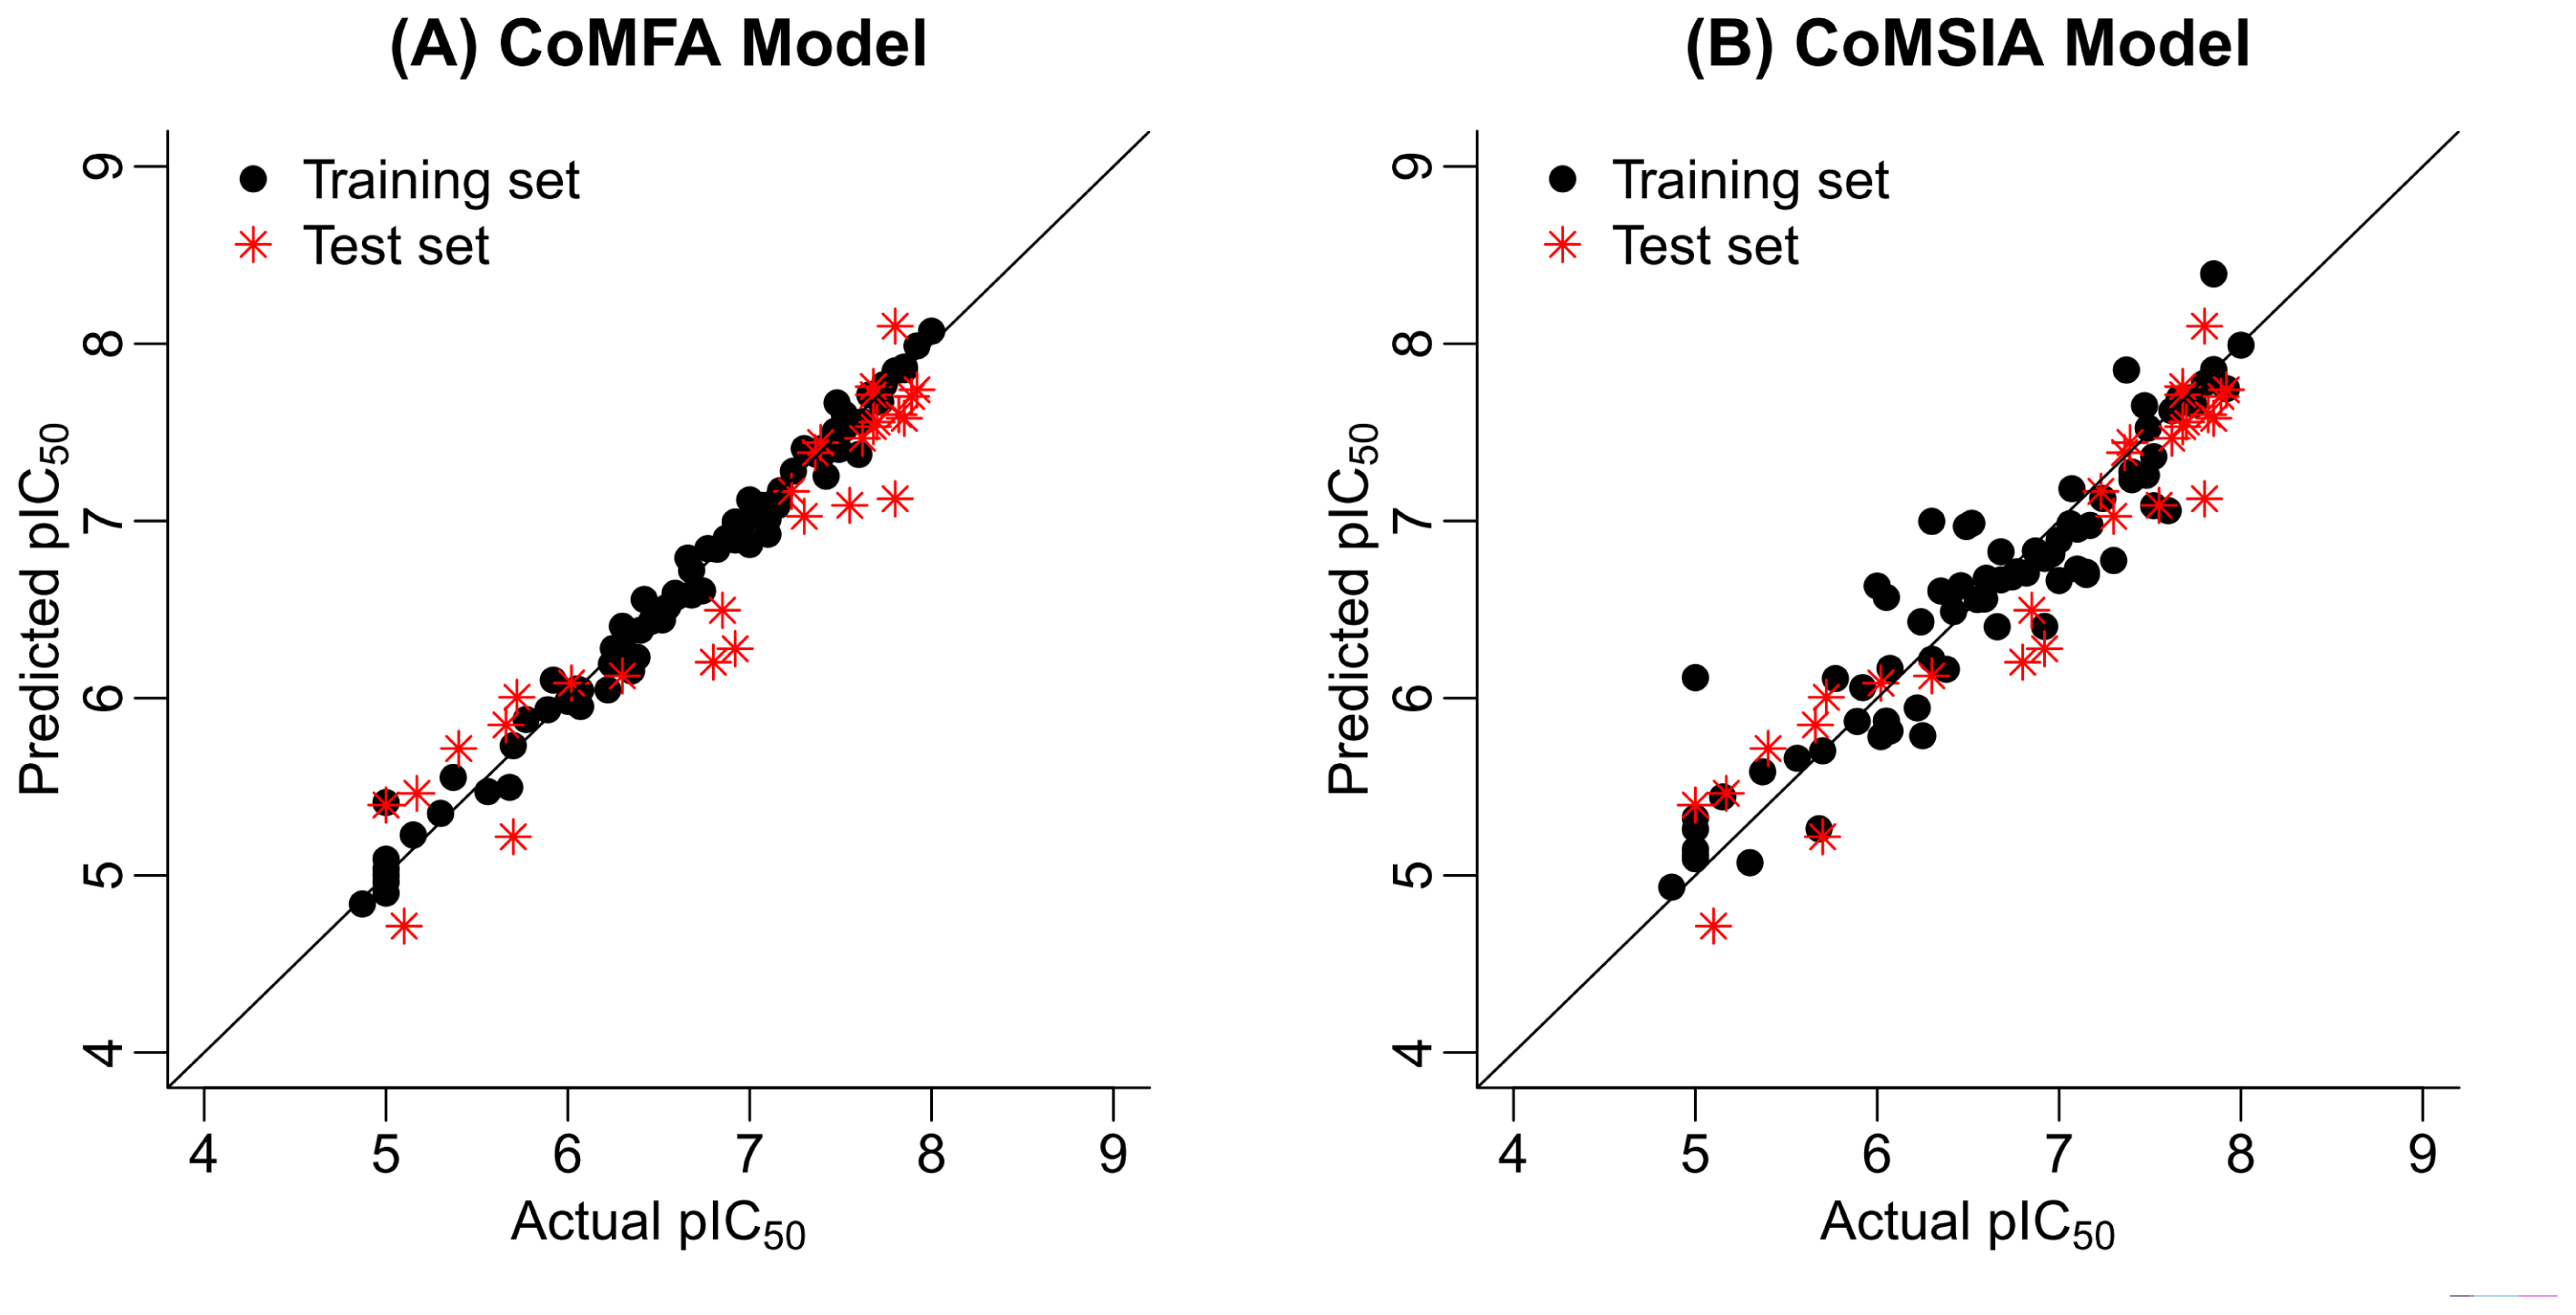
2.2. 3D-QSAR Statistical Results
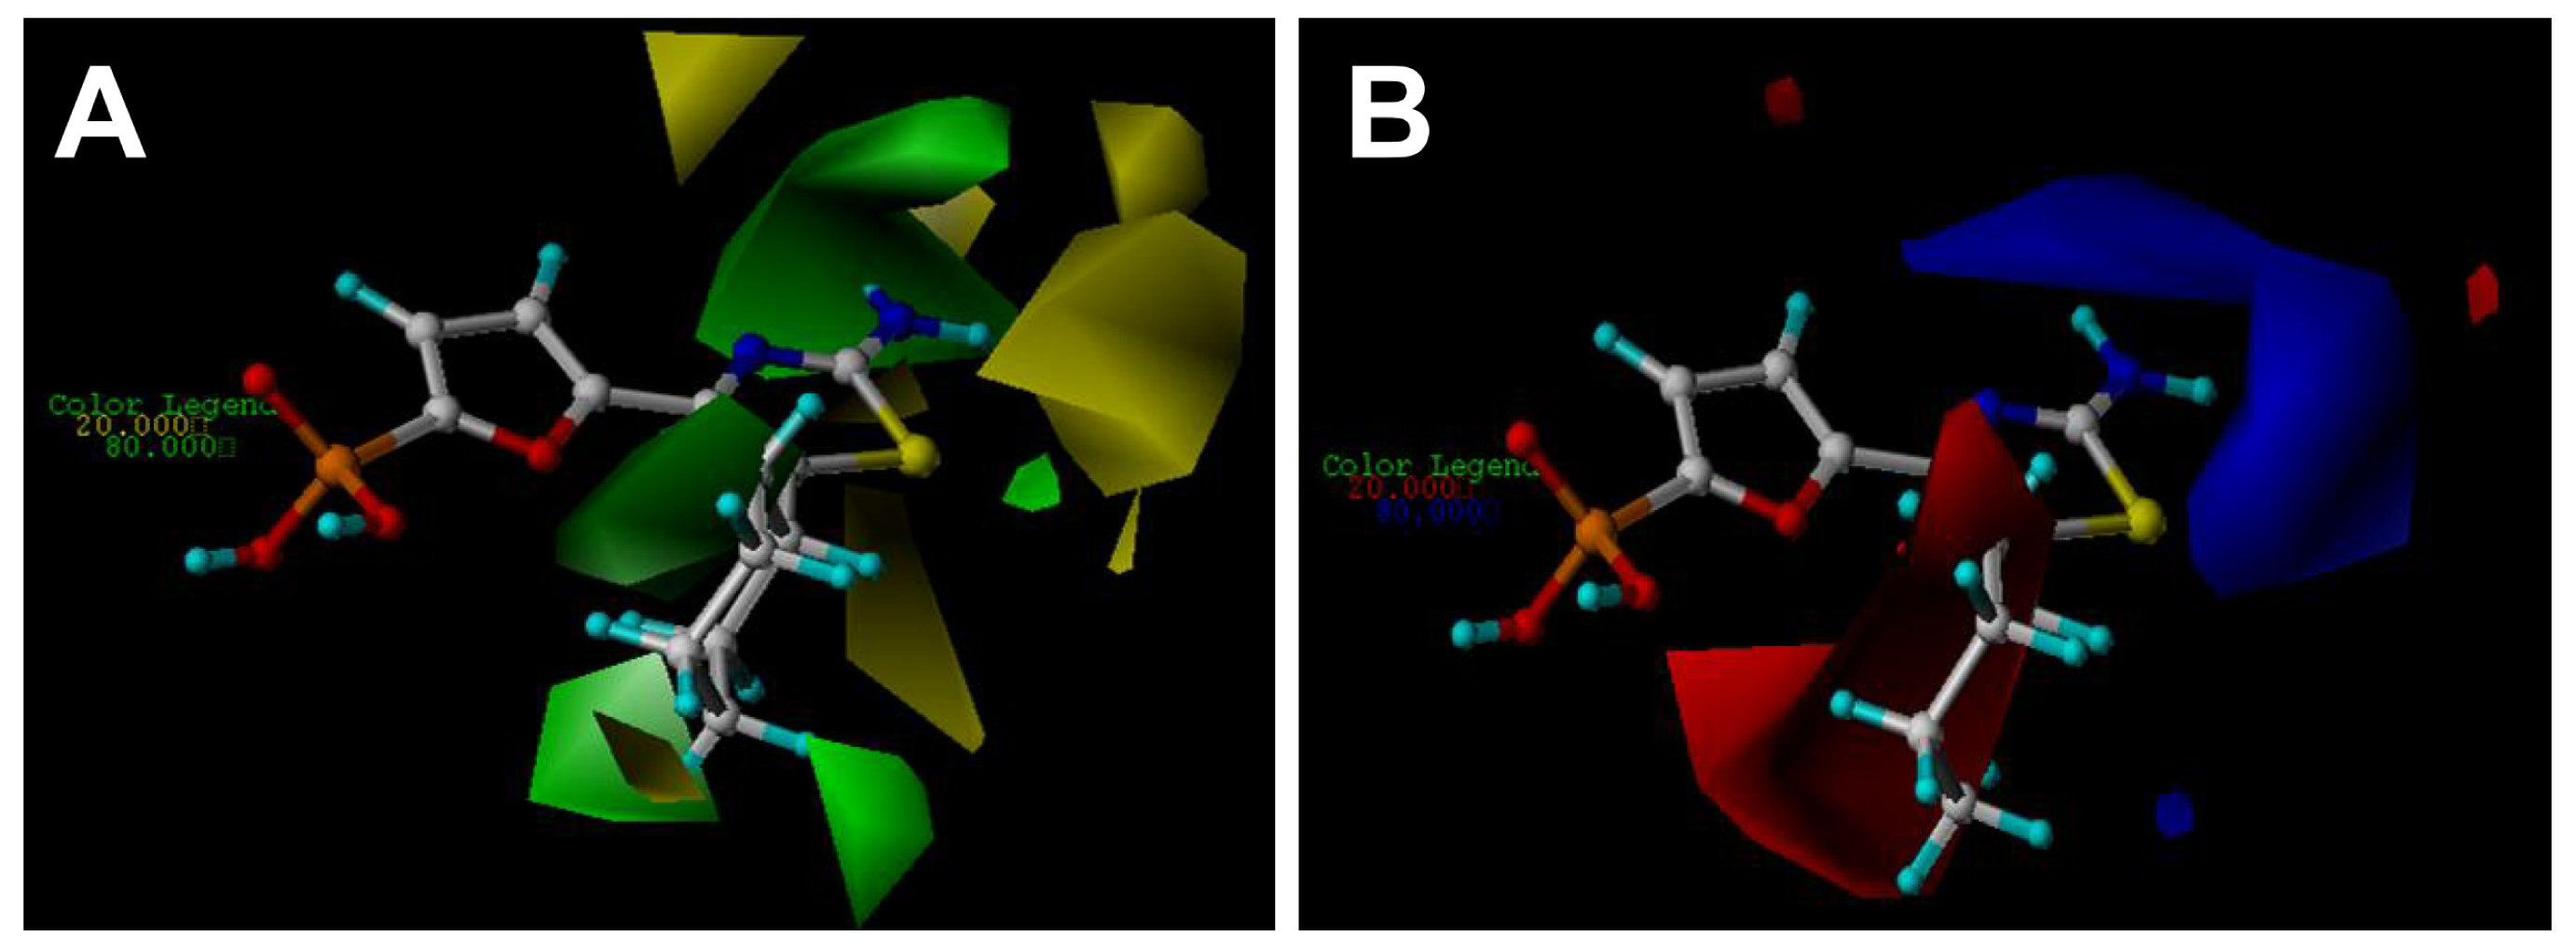
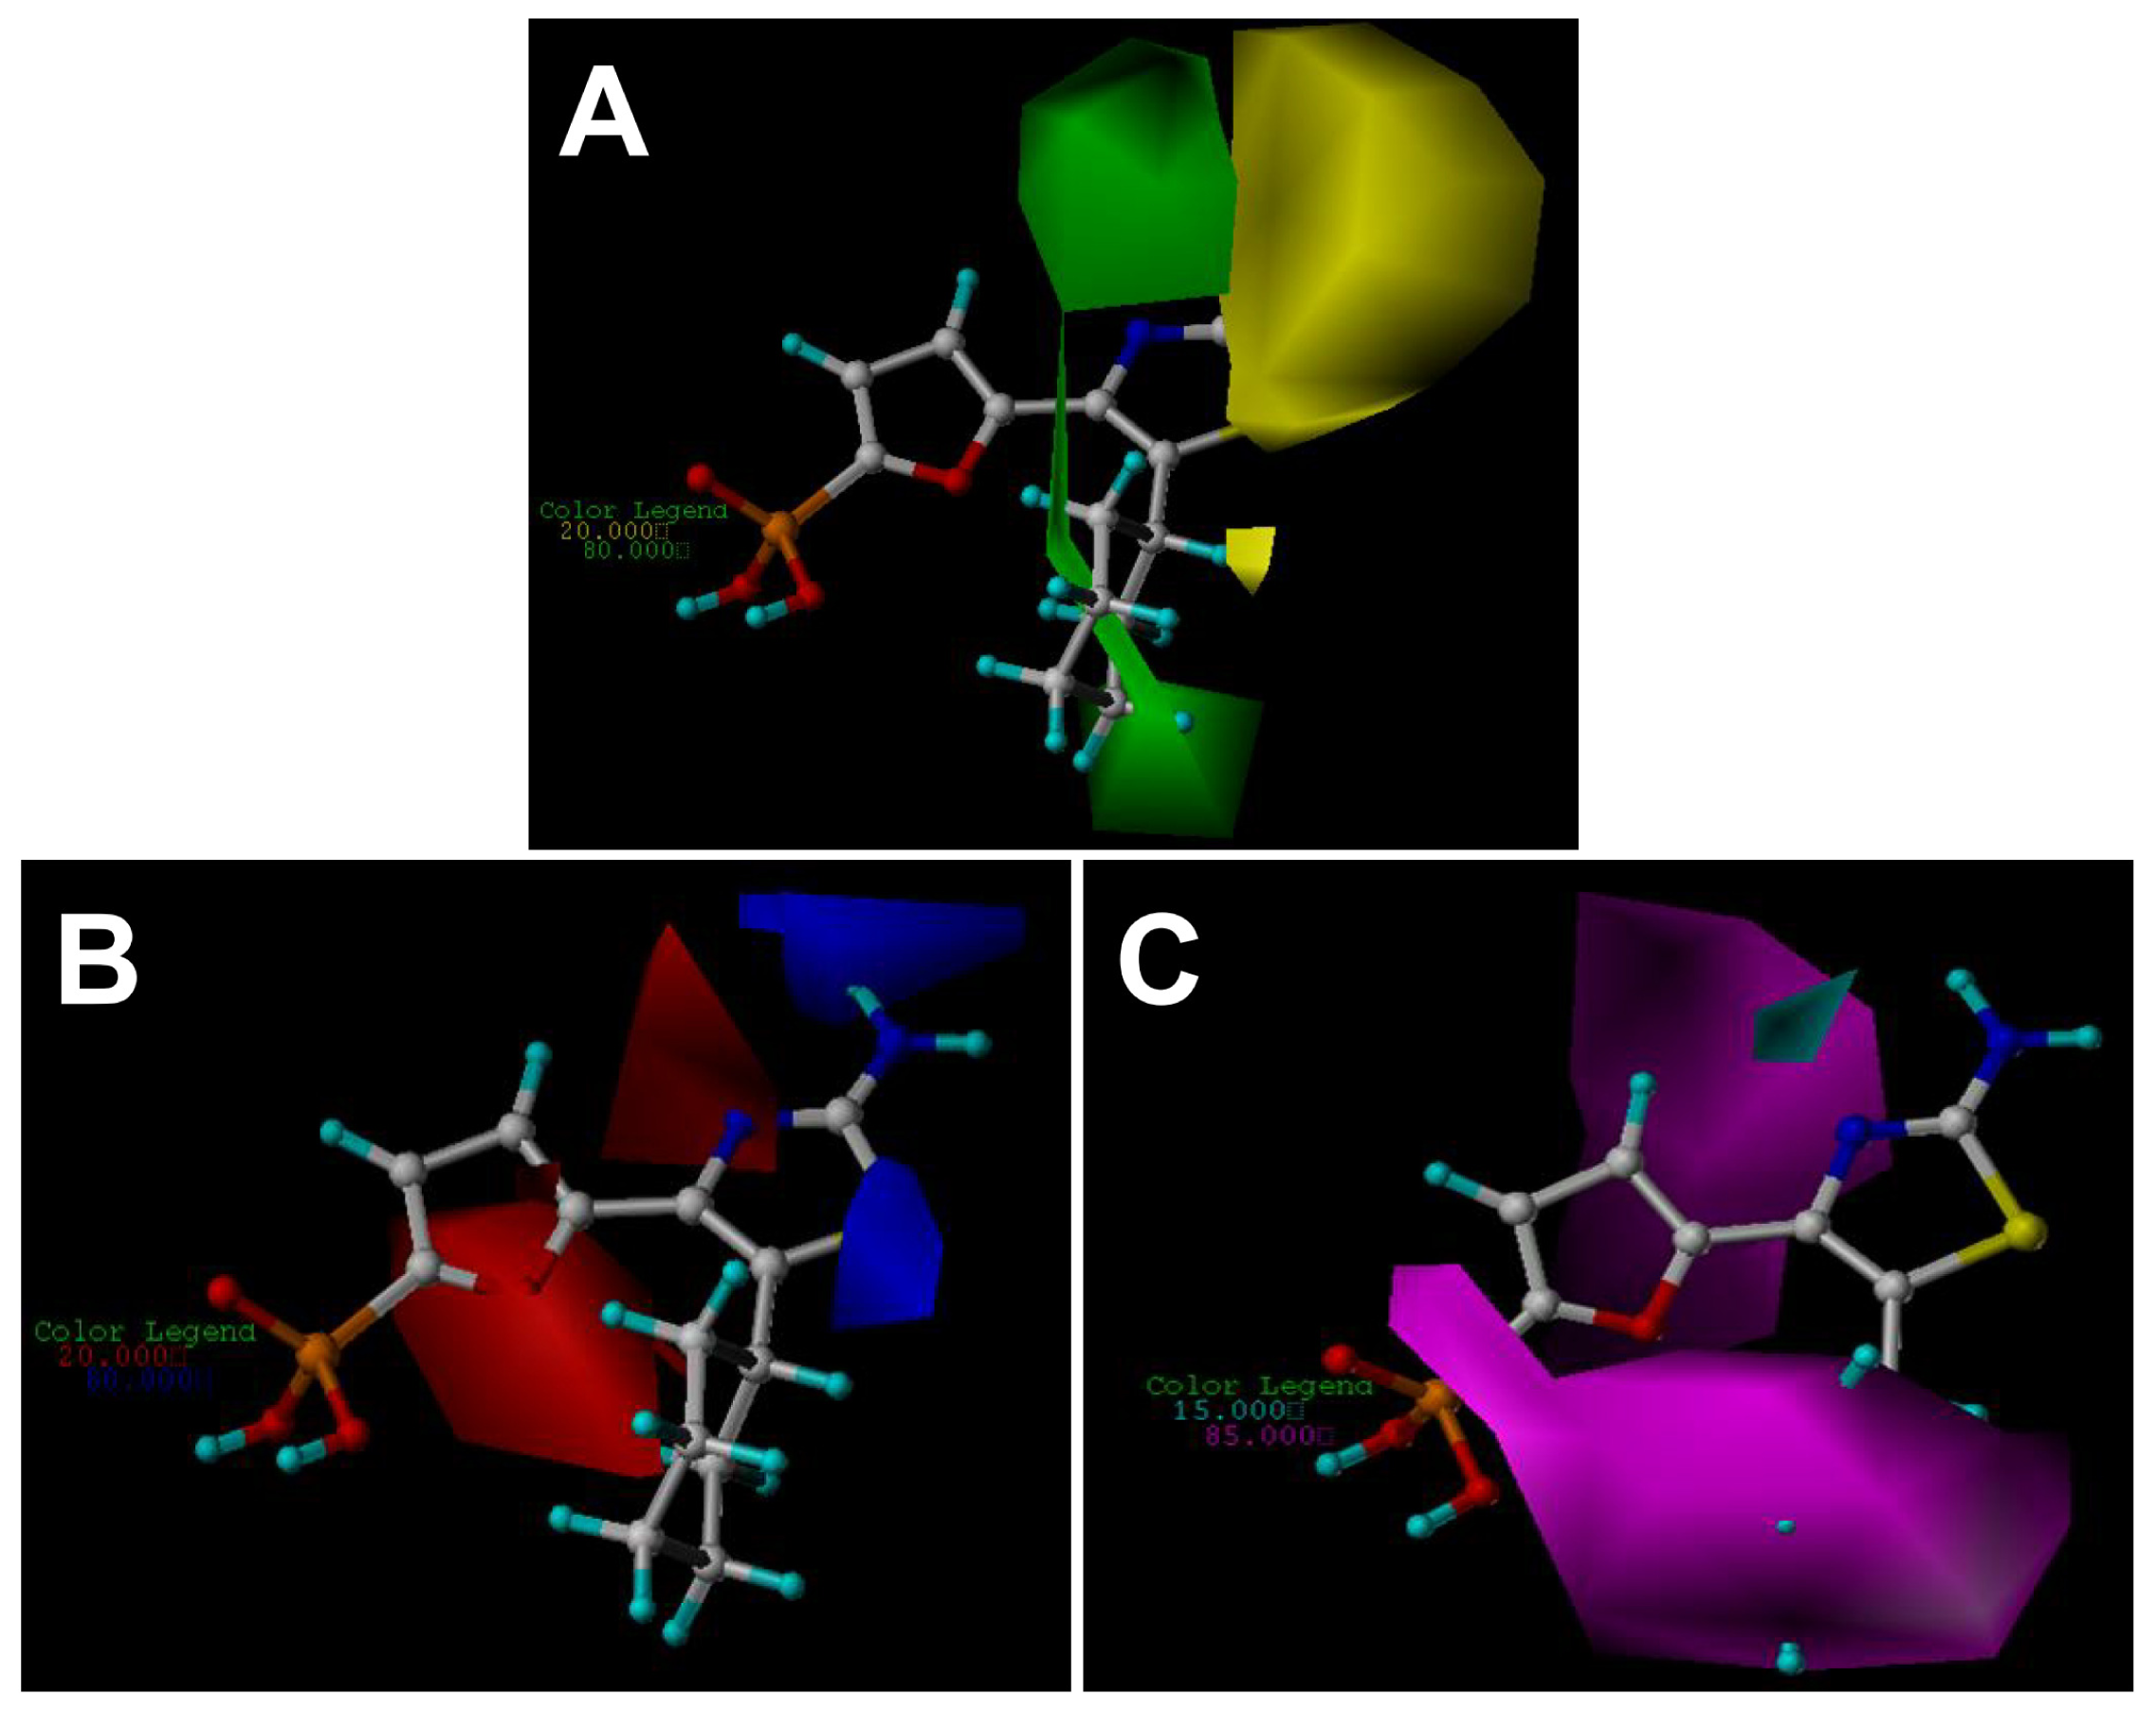
2.3. Contour Maps
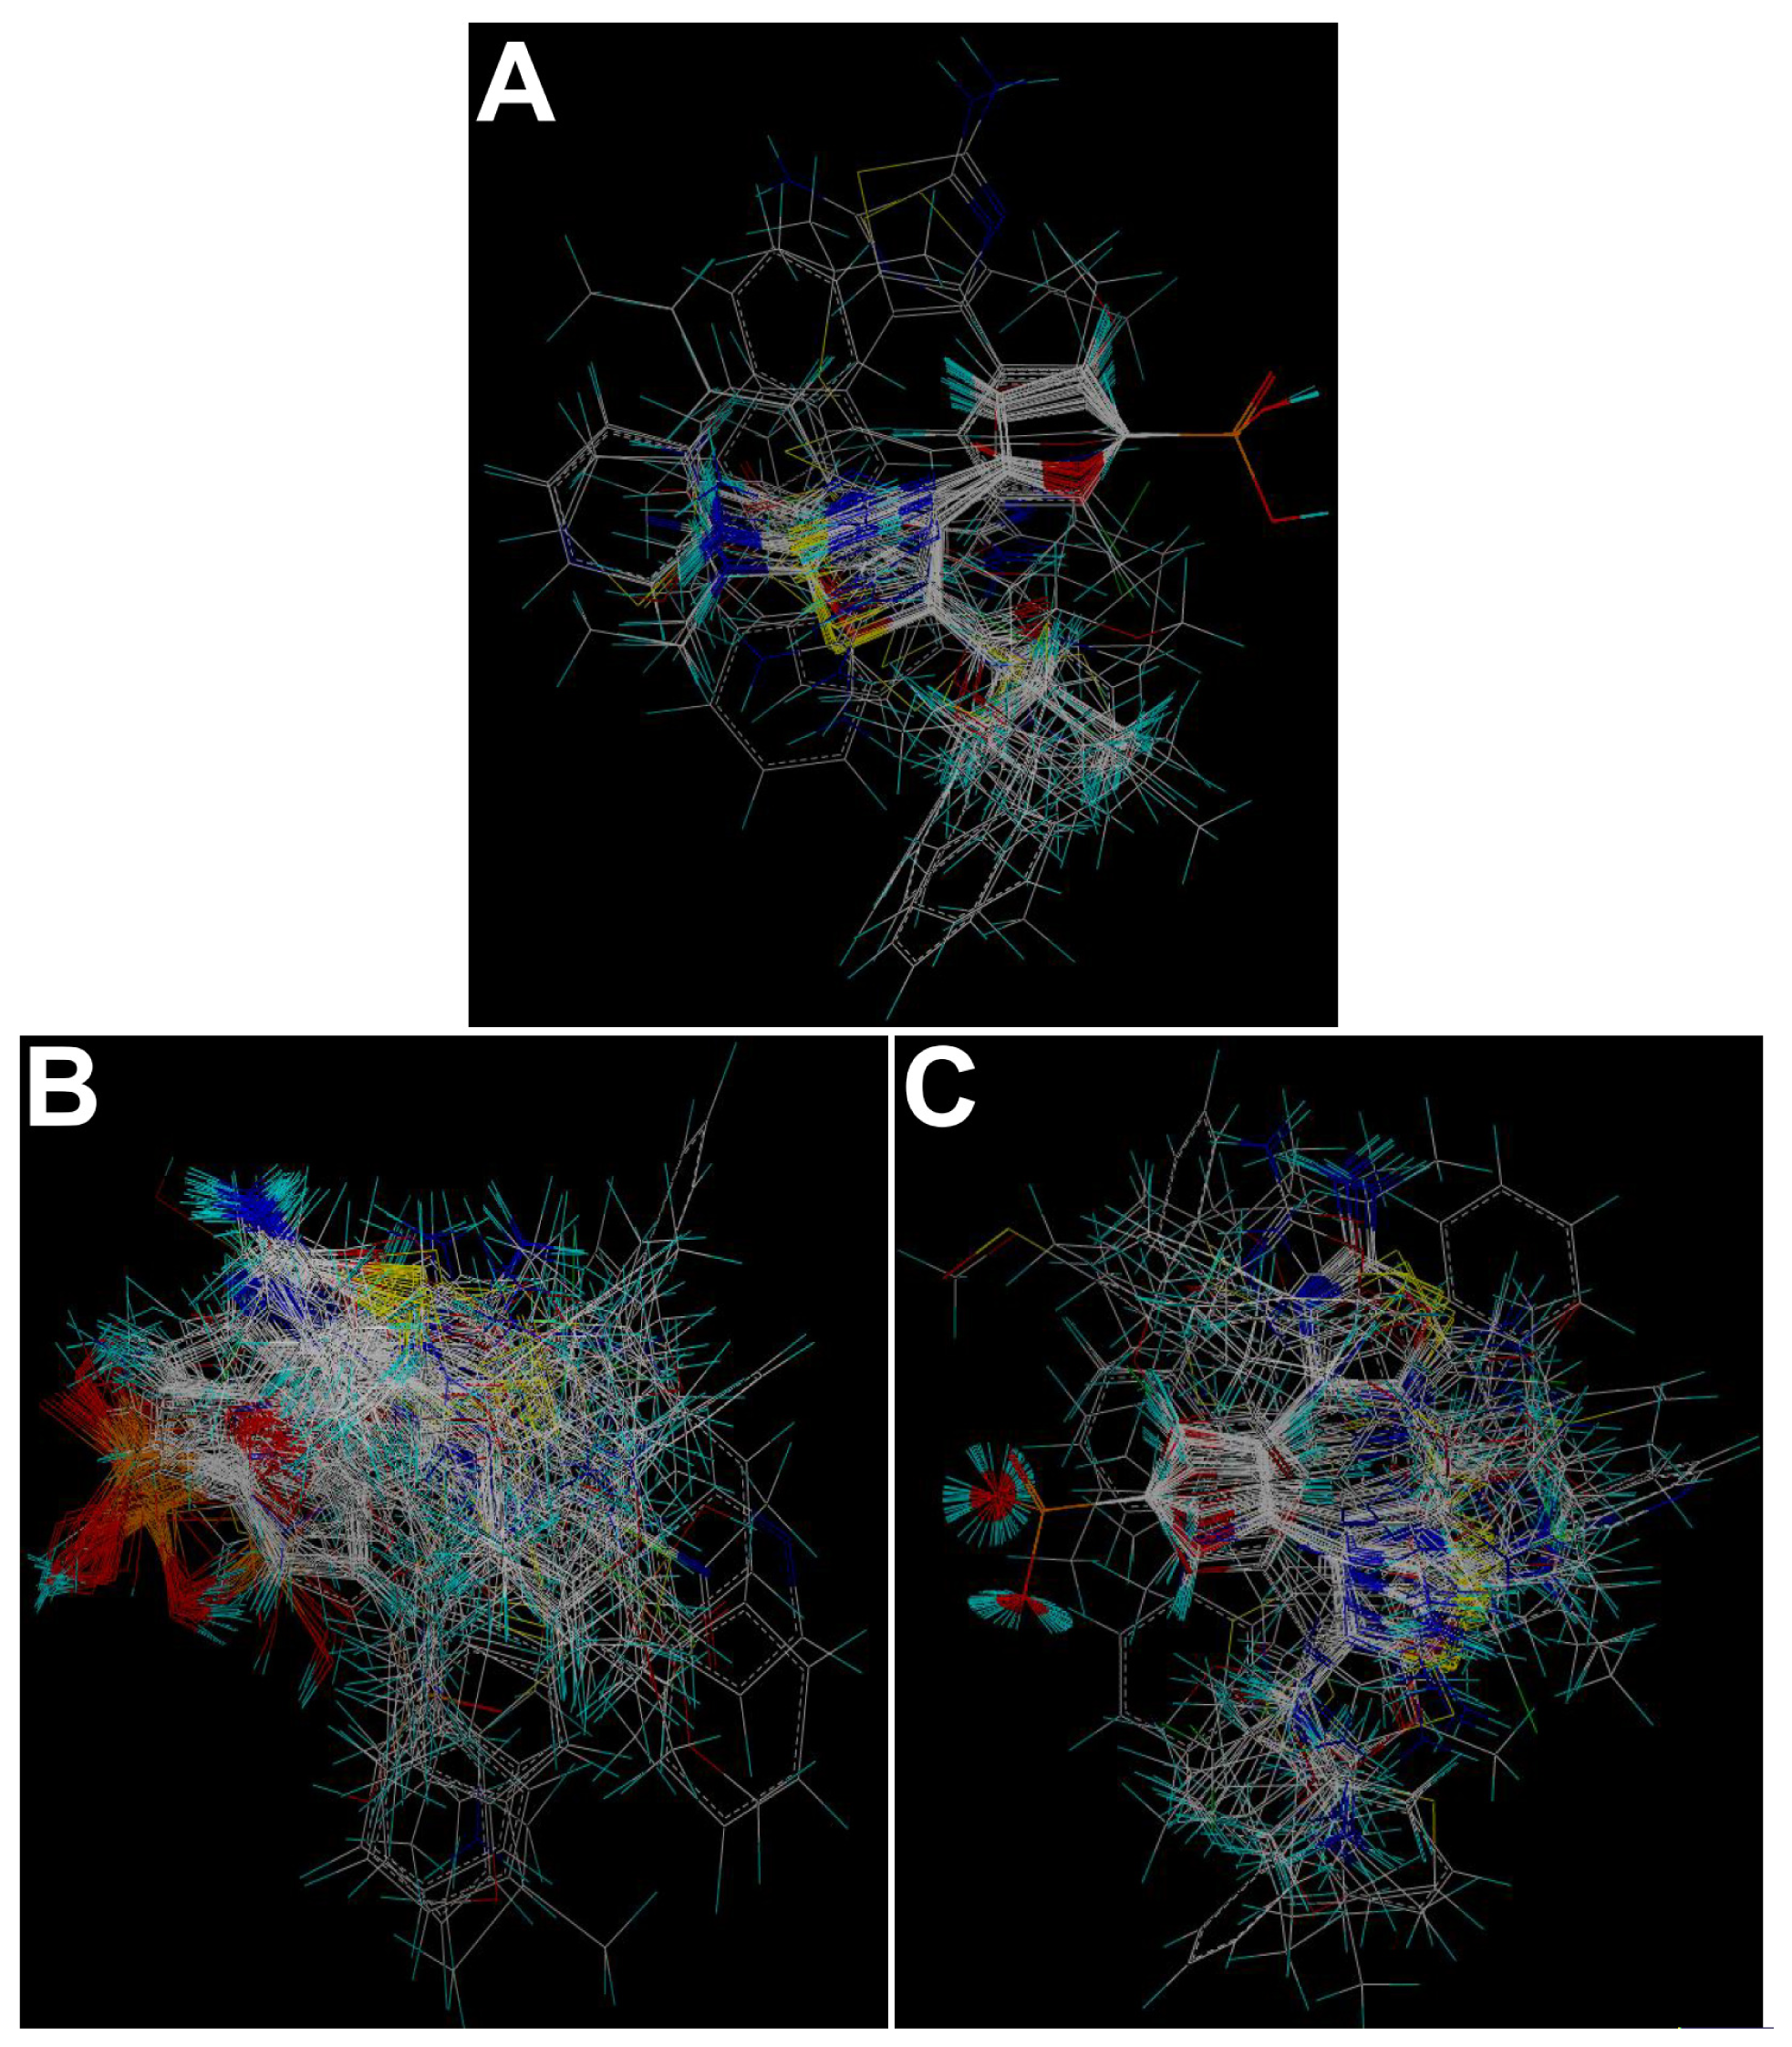
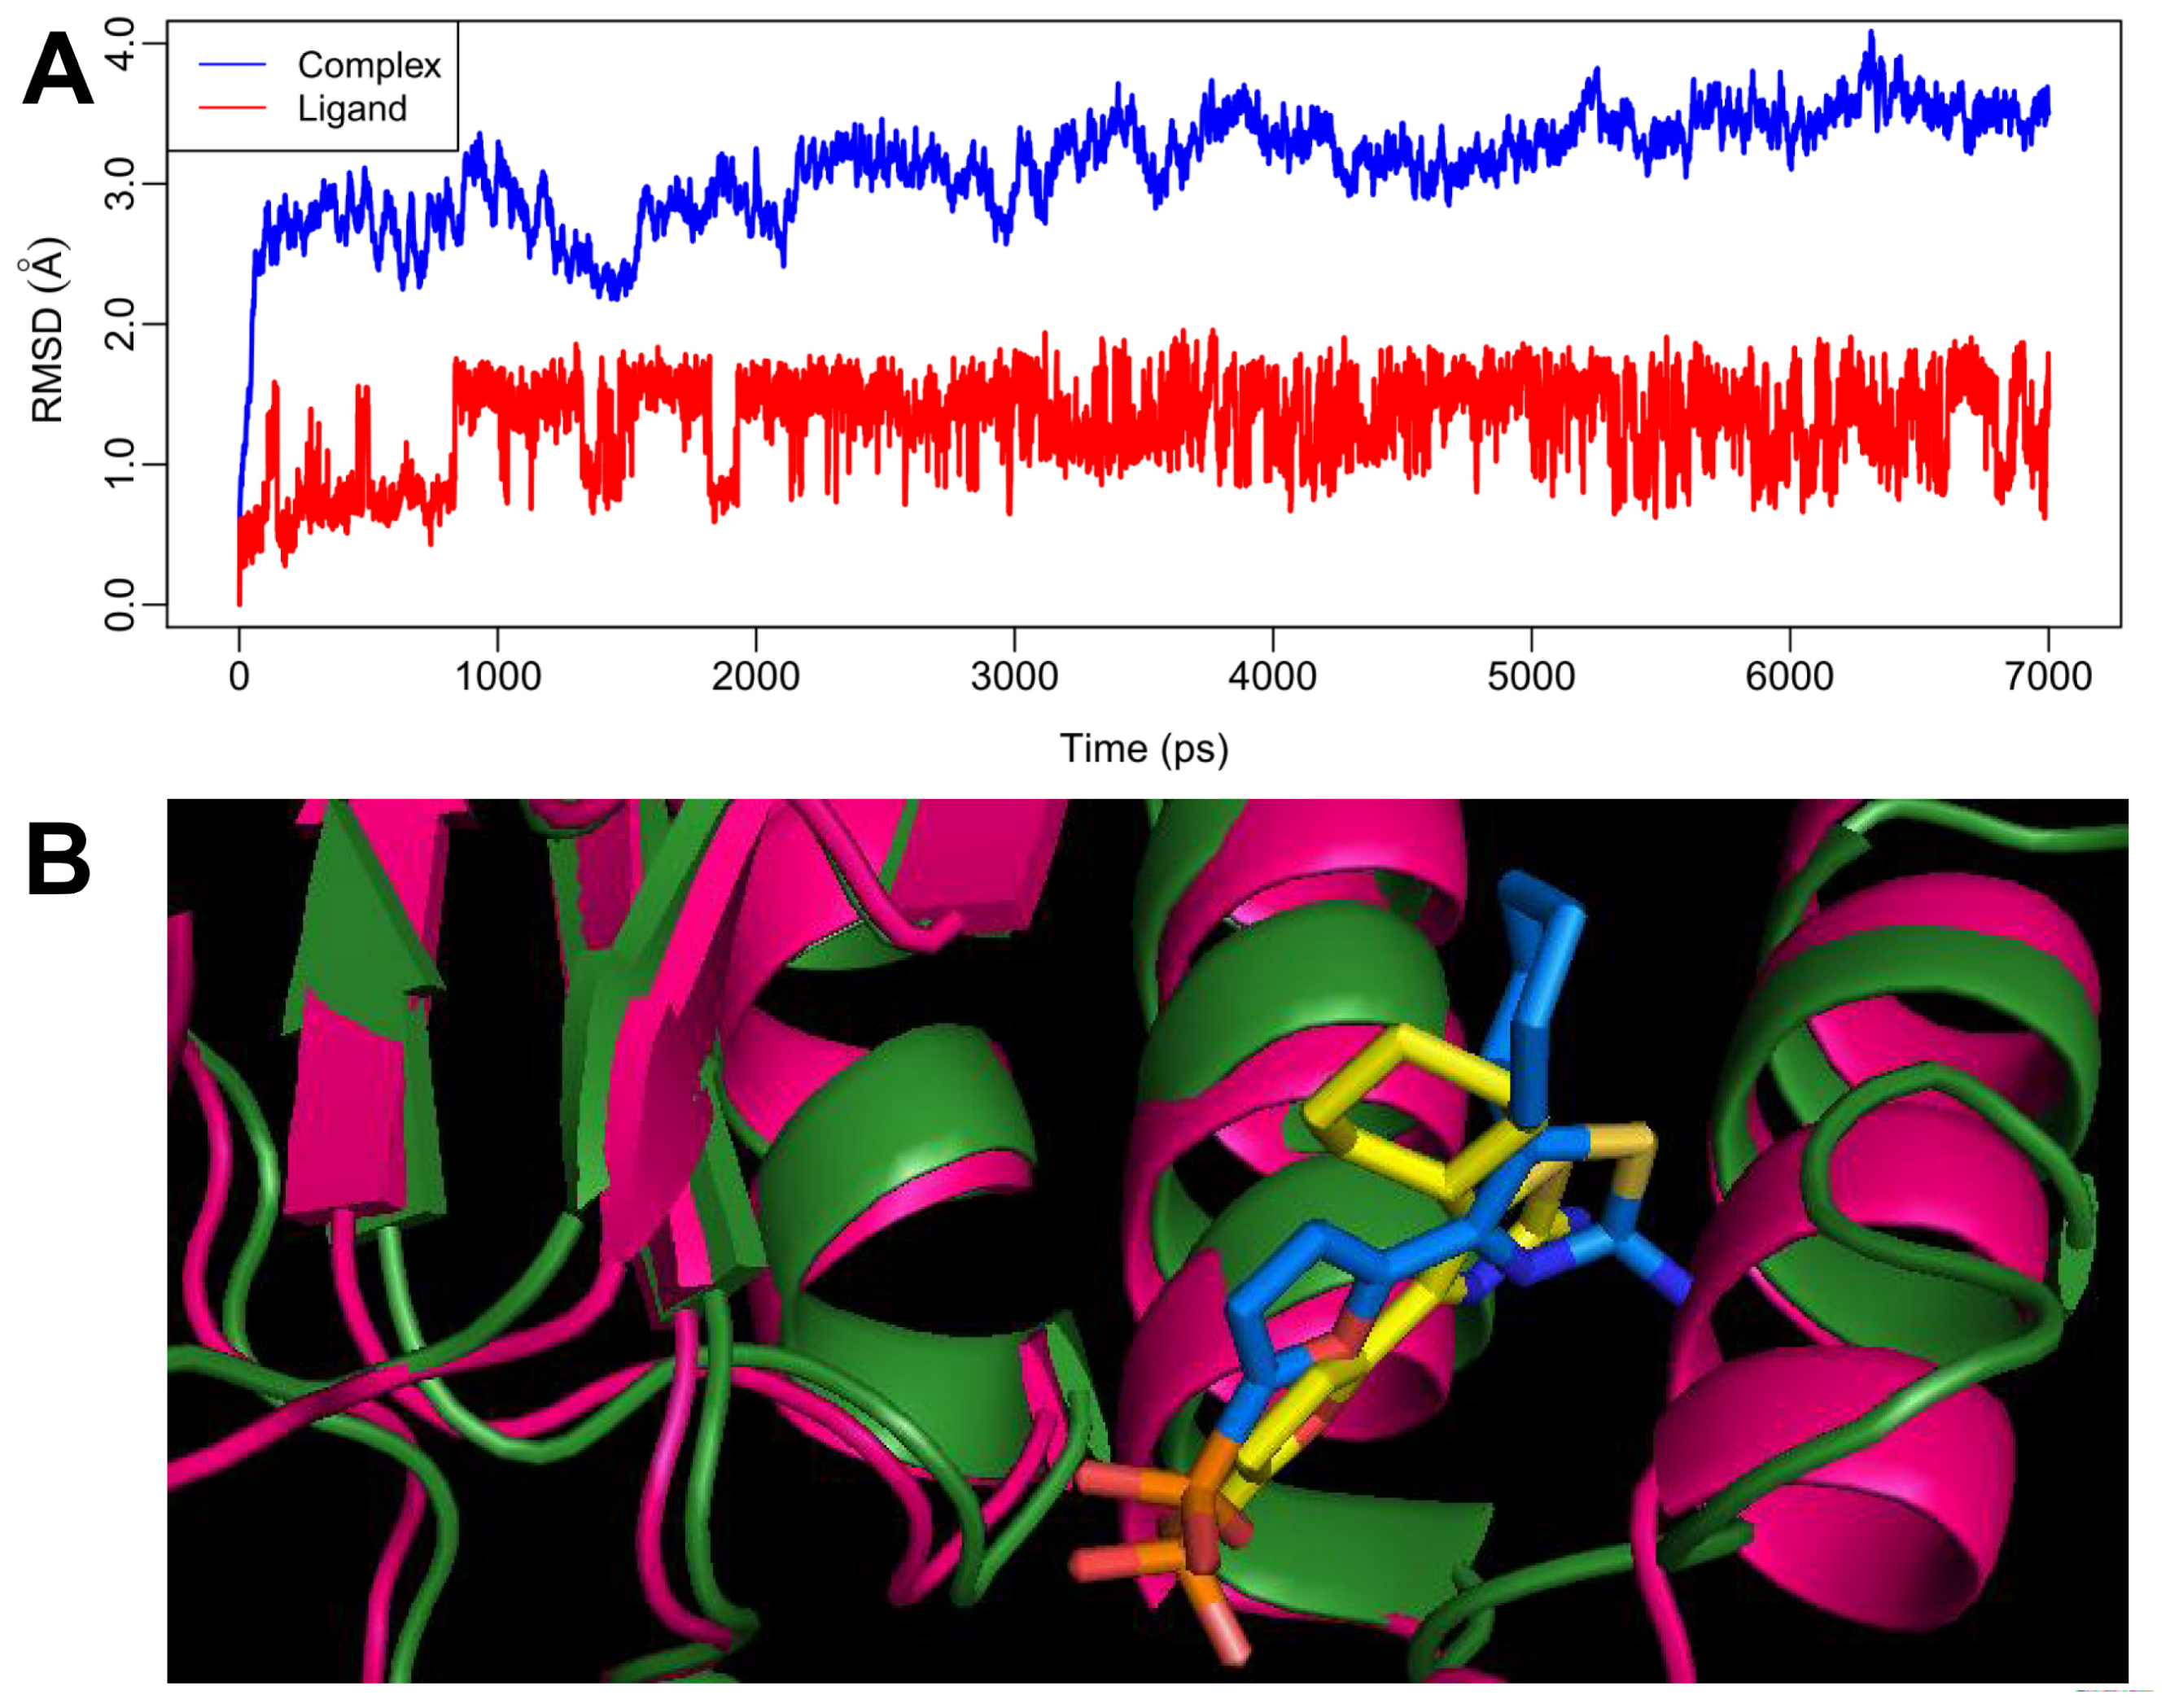
2.4. MD Simulations
3. Materials and Experimental Methods
3.1. Dataset
3.2. Molecular Modeling and Alignment
3.3. Docking Simulation
3.4. CoMFA and CoMSIA Interaction Energy Calculations
3.5. Partial Lleast Square (PLS) Analysis and Statistical Validation
3.6. Molecular Dynamics Simulations
4. Conclusions
Supplementary Material
ijms-12-08161-s001.pdfAcknowledgement
References
- DeFronzo, R.A. Pharmacologic therapy for type 2 diabetes mellitus. Ann. Intern. Med 1999, 131, 281–303. [Google Scholar]
- Klein, R. Hyperglycemia and microvascular and macrovascular disease in diabetes. Diabet. Care 1995, 18, 258–268. [Google Scholar]
- Kelley, D.E. Effects of weight loss on glucose homeostasis in NIDDM. Diabet. Rev 1995, 3, 366–377. [Google Scholar]
- Schneider, S.H.; Morgado, A. Effects of fitness and physical training on carbohydrate metabolism and associated cardiovascular risk factors in patients with diabetes. Diabet. Rev 1995, 3, 378–407. [Google Scholar]
- Siconolfi-Baez, L.; Banerji, M.; Lebovitz, H. Characterization and significance of sulfonylurea receptors. Diabet. Care 1990, 13, 2–8. [Google Scholar]
- Bailey, C.J.; Turner, R.C. Metformin. N. Engl. J. Med 1996, 334, 574–579. [Google Scholar]
- Fuhlendorff, J.; Rorsman, P.; Kofod, H.; Brand, C.L.; Rolin, B.; MacKay, P.; Shymko, R.; Carr, R.D. Stimulation of insulin release by repaglinide and glibenclamide involves both common and distinct processes. Diabetes 1998, 47, 345–351. [Google Scholar]
- Saltiel, A.; Olefsky, J. Thiazolidinediones in the treatment of insulin resistance and type II diabetes. Diabetes 1996, 45, 1661–1669. [Google Scholar]
- Gastaldelli, A.; Baldi, S.; Pettiti, M.; Toschi, E.; Camastra, S.; Natali, A.; Landau, B.R.; Ferrannini, E. Influence of obesity and type 2 diabetes on gluconeogenesis and glucose output in humans: a quantitative study. Diabetes 2000, 49, 1367–1373. [Google Scholar]
- Pilkis, S.; Claus, T. Hepatic gluconeogenesis/glycolysis: Regulation and structure/function relationships of substrate cycle enzymes. Annu. Rev. Nutr 1991, 11, 465–515. [Google Scholar]
- Erion, M.D.; van Poelje, P.D.; Dang, Q.; Kasibhatla, S.R.; Potter, S.C.; Reddy, M.R.; Reddy, K.R.; Jiang, T.; Lipscomb, W.N. MB06322 (CS-917): A potent and selective inhibitor of fructose 1,6-bisphosphatase for controlling gluconeogenesis in type 2 diabetes. Proc. Natl. Acad. Sci. USA 2005, 102, 7970–7975. [Google Scholar]
- Dang, Q.; Kasibhatla, S.R.; Reddy, K.R.; Jiang, T.; Reddy, M.R.; Potter, S.C.; Fujitaki, J.M.; van Poelje, P.D.; Huang, J.; Lipscomb, W.N.; Erion, M.D. Discovery of potent and specific fructose-1,6-bisphosphatase inhibitors and a series of orally-bioavailable phosphoramidase-sensitive prodrugs for the treatment of type 2 diabetes. J. Am. Chem. Soc 2007, 129, 15491–15502. [Google Scholar]
- Wright, S.W.; Anthony, A.; Carty, M.D.; Danley, D.E.; Hageman, D.L.; Karam, G.A.; Levy, C.B.; Mansour, M.N.; Mathiowetz, A.M.; McClure, L.D. Anilinoquinazoline inhibitors of fructose 1,6-bisphosphatase bind at a novel allosteric site: Synthesis, in vitro characterization, and X-ray crystallography. J. Med. Chem 2002, 45, 3865–3877. [Google Scholar]
- Lai, C.; Gum, R.J.; Daly, M.; Fry, E.H.; Hutchins, C.; Abad-Zapatero, C.; von Geldern, T.W. Benzoxazole benzenesulfonamides as allosteric inhibitors of fructose-1,6-bisphosphatase. Bioorg. Med. Chem. Lett 2006, 16, 1807–1810. [Google Scholar]
- Wright, S.W.; Carlo, A.A.; Danley, D.E.; Hageman, D.L.; Karam, G.A.; Mansour, M.N.; McClure, L.D.; Pandit, J.; Schulte, G.K.; Treadway, J.L.; Wang, I.-K.; Bauer, P.H. 3-(2-Carboxy-ethyl)-4,6-dichloro-1H-indole-2-carboxylic acid: An allosteric inhibitor of fructose-1,6-bisphosphatase at the AMP site. Bioorg. Med. Chem. Lett 2003, 13, 2055–2058. [Google Scholar]
- Erion, M.D.; Dang, Q.; Reddy, M.R.; Kasibhatla, S.R.; Huang, J.; Lipscomb, W.N.; van Poelje, P.D. Structure-guided design of AMP mimics that inhibit fructose-1,6-bisphosphatase with high affinity and specificity. J. Am. Chem. Soc 2007, 129, 15480–15490. [Google Scholar]
- Dang, Q.; Brown, B.S.; Liu, Y.; Rydzewski, R.M.; Robinson, E.D.; Poelje, P.D.v.; Reddy, M.R.; Erion, M.D. Fructose-1,6-bisphosphatase inhibitors. 1. Purine phosphonic acids as novel AMP mimics. J. Med. Chem 2009, 52, 2880–2898. [Google Scholar]
- Dang, Q.; Kasibhatla, S.R.; Xiao, W.; Liu, Y.; DaRe, J.; Taplin, F.; Reddy, K.R.; Scarlato, G.R.; Gibson, T.; van Poelje, P.D.; Potter, S.C.; Erion, M.D. Fructose-1,6-bisphosphatase inhibitors. 2. Design, synthesis, and structure–activity relationship of a series of phosphonic acid containing benzimidazoles that function as 5′-adenosinemonophosphate (AMP) mimics. J. Med. Chem 2010, 53, 441–451. [Google Scholar]
- Wang, Y.; Li, Y.; Yang, S.; Yang, L. Classification of substrates and inhibitors of P-glycoprotein using unsupervised machine learning approach. J. Chem. Inf. Model 2005, 45, 750–757. [Google Scholar]
- Wang, G.; Li, Y.; Liu, X.; Wang, Y. Understanding the aquatic toxicity of pesticide: Structure-activity relationship and molecular descriptors to distinguish the ratings of toxicity. QSAR Comb. Sci 2009, 28, 1418–1431. [Google Scholar]
- Xu, X.; Yang, W.; Wang, X.; Li, Y.; Wang, Y.; Ai, C. Dynamic communication between androgen and coactivator: Mutually induced conformational perturbations in androgen receptor ligand-binding domain. Proteins 2011, 79, 1154–1171. [Google Scholar]
- Wang, Y.; Li, Y.; Ma, Z.; Yang, W.; Ai, C. Mechanism of microRNA-target interaction: Molecular dynamics simulations and thermodynamics analysis. PLoS Comput. Biol 2010, 6. [Google Scholar] [CrossRef]
- Wang, X.; Yang, W.; Xu, X.; Zhang, H.; Li, Y.; Wang, Y. Studies of benzothiadiazine derivatives as hepatitis C virus NS5B polymerase inhibitors using 3D-QSAR, molecular docking and molecular dynamics. Curr. Med. Chem 2010, 17, 2788–2803. [Google Scholar]
- Wang, Y.H.; Li, Y.; Yang, S.L.; Yang, L. An in silico approach for screening flavonoids as P-glycoprotein inhibitors based on a Bayesian-regularized neural network. J. Comput. Aided Mol. Des 2005, 19, 137–147. [Google Scholar]
- Sun, H. A universal molecular descriptor system for prediction of logP, logS, logBB, and absorption. J. Chem. Inf. Comput. Sci 2004, 44, 748–757. [Google Scholar]
- Sun, H. Prediction of chemical carcinogenicity from molecular structure. J. Chem. Inf. Comput. Sci 2004, 44, 1506–1514. [Google Scholar]
- Sun, H. Pharmacophore-based virtual screening. Curr. Med. Chem 2008, 15, 1018–1024. [Google Scholar]
- Lan, P.; Wu, Z.-W.; Chen, W.-N.; Sun, P.-H.; Chen, W.-M. Molecular modeling studies on phosphonic acid-containing thiazole derivatives: design for fructose-1,6-bisphosphatase inhibitors. J. Mol. Model 2011. [Google Scholar] [CrossRef]
- Richard, D.; David, E.; Jeffrey, D. Comparative molecular field analysis (CoMFA). 1. Effect of shape on binding of steroids to carrier proteins. J. Am. Chem. Soc 1988, 110, 5959–5967. [Google Scholar]
- Klebe, G.; Abraham, U.; Mietzner, T. Molecular similarity indices in a comparative analysis (CoMSIA) of drug molecules to correlate and predict their biological activity. J. Med. Chem 1994, 37, 4130–4146. [Google Scholar]
- Gidh-Jain, M.; Zhang, Y.; van Poelje, P.D.; Liang, J.Y.; Huang, S.; Kim, J.; Elliott, J.T.; Erion, M.D.; Pilkis, S.J.; Raafat el-Maghrabi, M. The allosteric site of human liver fructose-1,6-bisphosphatase. Analysis of six AMP site mutants based on the crystal structure. J. Biol. Chem 1994, 269, 27732–27738. [Google Scholar]
- Golbraikh, A.; Tropsha, A. Beware of q2! J. Mol. Graphics Modell 2002, 20, 269–276. [Google Scholar]
- Golbraikh, A.; Shen, M.; Xiao, Z.Y.; Xiao, Y.D.; Lee, K.H.; Tropsha, A. Rational selection of training and test sets for the development of validated QSAR models. J. Comput. Aided Mol. Des 2003, 17, 241–253. [Google Scholar]
- Golbraikh, A.; Tropsha, A. Predictive QSAR modeling based on diversity sampling of experimental datasets for the training and test set selection. J. Comput. Aided Mol. Des 2002, 16, 357–369. [Google Scholar]
- Tropsha, A.; Gramatica, P.; Gombar, V. The importance of being earnest: validation is the absolute essential for successful application and interpretation of QSPR models. QSAR Comb. Sci 2003, 22, 69–77. [Google Scholar]
- Roy, K.; Mandal, A. Predictive QSAR modeling of CCR5 antagonist piperidine derivatives using chemometric tools. J. Enzym. Inhib. Med. Chem 2009, 24, 205–223. [Google Scholar]
- Roy, P.; Roy, K. On some aspects of variable selection for partial least squares regression models. QSAR Comb. Sci 2008, 27, 302–313. [Google Scholar]
- Dang, Q.; Liu, Y.; Cashion, D.K.; Kasibhatla, S.R.; Jiang, T.; Taplin, F.; Jacintho, J.D.; Li, H.; Sun, Z.; Fan, Y.; et al. Discovery of a series of phosphonic acid-containing thiazoles and orally bioavailable diamide prodrugs that lower glucose in diabetic animals through inhibition of fructose-1,6-bisphosphatase. J. Med. Chem 2010, 54, 153–165. [Google Scholar]
- Dang, Q.; Kasibthatla, S.R.; Jiang, T.; Taplin, F.; Gibson, T.; Potter, S.C.; van Poelje, P.D.; Erion, M.D. Oxazole phosphonic acids as fructose 1,6-bisphosphatase inhibitors with potent glucose-lowering activity. Med. Chem. Commun 2011, 2, 287–290. [Google Scholar]
- AbdulHameed, M.D.M.; Hamza, A.; Liu, J.J.; Zhan, C.G. Combined 3D-QSAR modeling and molecular docking study on indolinone derivatives as inhibitors of 3-phosphoinositide-dependent protein kinase-1. J. Chem. Inf. Model 2008, 48, 1760–1772. [Google Scholar]
- Jain, A.N. Surflex: Fully automatic flexible molecular docking using a molecular similarity-based search engine. J. Med. Chem 2003, 46, 499–511. [Google Scholar]
- Jain, A. Surflex-Dock 2.1: Robust performance from ligand energetic modeling, ring flexibility, and knowledge-based search. J. Comput. Aided Mol. Des 2007, 21, 281–306. [Google Scholar]
- Cramer, R.D.; Bunce, J.D.; Patterson, D.E.; Frank, I.E. Cross-validation, bootstrapping, and partial least-squares compared with multiple-regression in conventional QSAR studies. Quant. Struct. Act. Relatsh 1988, 7, 18–25. [Google Scholar]
- Wold, S. Cross-validatory estimation of the number of components in factor and principal components models. Technometrics 1978, 20, 397–405. [Google Scholar]
- Case, D.; Darden, T.; Cheatham, T., III; Simmerling, C.; Wang, J.; Duke, R.; Luo, R.; Walker, R.; Zhang, W.; Merz, K.; et al. AMBER 11; University of California: San Francisco, CA, USA, 2010. [Google Scholar]
- Frisch, M.J.; Trucks, G.; Schlegel, H.; Scuseria, G.; Robb, M.; Cheeseman, J.; Montgomery, J., Jr.; Vreven, T.; Kudin, K.; Burant, J.; et al. Gaussian 03, revision C.02; Gaussian: Wallingford, CT, USA, 2003. [Google Scholar]
- Wang, J.; Morin, P.; Wang, W.; Kollman, P. Use of MM-PBSA in reproducing the binding free energies to HIV-1 RT of TIBO derivatives and predicting the binding mode to HIV-1 RT of efavirenz by docking and MM-PBSA. J. Am. Chem. Soc 2001, 123, 5221–5230. [Google Scholar]
- Jorgensen, W.; Chandrasekhar, J.; Madura, J.; Impey, R.; Klein, M. Comparison of simple potential functions for simulating liquid water. J. Chem. Phys 1983, 79, 926–935. [Google Scholar]
- Essmann, U.; Perera, L.; Berkowitz, M.; Darden, T.; Lee, H.; Pedersen, L. A smooth particle mesh Ewald method. J. Chem. Phys 1995, 103, 8577–8593. [Google Scholar]
- Darden, T.; York, D.; Pedersen, L. Particle mesh Ewald: An N·log(N) method for Ewald sums in large systems. J. Chem. Phys 1993, 98, 10089–10092. [Google Scholar]
- Ryckaert, J.-P.; Ciccotti, G.; Berendsen, H.J.C. Numerical integration of the cartesian equations of motion of a system with constraints: molecular dynamics of n-alkanes. J. Comput. Phys 1977, 23, 327–341. [Google Scholar]


| PLS analysis | Superimposition Methods | |||||
|---|---|---|---|---|---|---|
| I | II | III | ||||
| CoMFA | CoMSIA | CoMFA | CoMSIA | CoMFA | CoMSIA | |
| q2 | 0.514 | 0.443 | 0.047 | 0.191 | 0.121 | 0.147 |
| PCs | 10 | 6 | 2 | 2 | 4 | 2 |
| rncv2 | 0.986 | 0.874 | 0.486 | 0.485 | 0.796 | 0.540 |
| SEE | 0.108 | 0.314 | 0.617 | 0.618 | 0.394 | 0.584 |
| F value | 462.072 | 80.809 | 35.010 | 34.859 | 70.348 | 43.425 |
| rbs2 | 0.992 | 0.905 | 0.635 | 0.601 | 0.875 | 0.630 |
| SEEbs | 0.082 | 0.267 | 0.520 | 0.544 | 0.304 | 0.519 |
| rpred2 | 0.902 | 0.756 | 0.364 | 0.559 | 0.352 | 0.473 |
| Relative Contribution (%) | ||||||
| S | 0.563 | 0.379 | 0.398 | - | 0.581 | - |
| E | 0.437 | 0.453 | 0.602 | 0.479 | 0.419 | - |
| H | - | - | - | - | - | - |
| D | - | - | - | 0.521 | - | 0.822 |
| A | - | 0.168 | - | - | - | 0.178 |
| Model | rtest2 | rpred2 | r02 | (rtest2 − r02)/rtest2 | r2m | k | k′ |
|---|---|---|---|---|---|---|---|
| CoMFA | 0.909 | 0.902 | 0.901 | 0.009 | 0.828 | 0.981 | 1.018 |
| CoMSIA | 0.741 | 0.756 | 0.693 | 0.065 | 0.579 | 0.990 | 1.005 |
© 2011 by the authors; licensee MDPI, Basel, Switzerland. This article is an open-access article distributed under the terms and conditions of the Creative Commons Attribution license (http://creativecommons.org/licenses/by/3.0/).
Share and Cite
Hao, M.; Zhang, X.; Ren, H.; Li, Y.; Zhang, S.; Luo, F.; Ji, M.; Li, G.; Yang, L. In Silico Identification of Structure Requirement for Novel Thiazole and Oxazole Derivatives as Potent Fructose 1,6-Bisphosphatase Inhibitors. Int. J. Mol. Sci. 2011, 12, 8161-8180. https://doi.org/10.3390/ijms12118161
Hao M, Zhang X, Ren H, Li Y, Zhang S, Luo F, Ji M, Li G, Yang L. In Silico Identification of Structure Requirement for Novel Thiazole and Oxazole Derivatives as Potent Fructose 1,6-Bisphosphatase Inhibitors. International Journal of Molecular Sciences. 2011; 12(11):8161-8180. https://doi.org/10.3390/ijms12118161
Chicago/Turabian StyleHao, Ming, Xiaole Zhang, Hong Ren, Yan Li, Shuwei Zhang, Fang Luo, Mingjuan Ji, Guohui Li, and Ling Yang. 2011. "In Silico Identification of Structure Requirement for Novel Thiazole and Oxazole Derivatives as Potent Fructose 1,6-Bisphosphatase Inhibitors" International Journal of Molecular Sciences 12, no. 11: 8161-8180. https://doi.org/10.3390/ijms12118161
APA StyleHao, M., Zhang, X., Ren, H., Li, Y., Zhang, S., Luo, F., Ji, M., Li, G., & Yang, L. (2011). In Silico Identification of Structure Requirement for Novel Thiazole and Oxazole Derivatives as Potent Fructose 1,6-Bisphosphatase Inhibitors. International Journal of Molecular Sciences, 12(11), 8161-8180. https://doi.org/10.3390/ijms12118161