Crystallization Study and Comparative in Vitro–in Vivo Hydrolysis of PLA Reinforcement Ligament


Abstract
:1. Introduction
2. Materials and Methods
2.1. Materials
2.2. Measurements
2.2.1. Intrinsic Viscosity
2.2.2. Gel Permeation Chromatography (GPC)
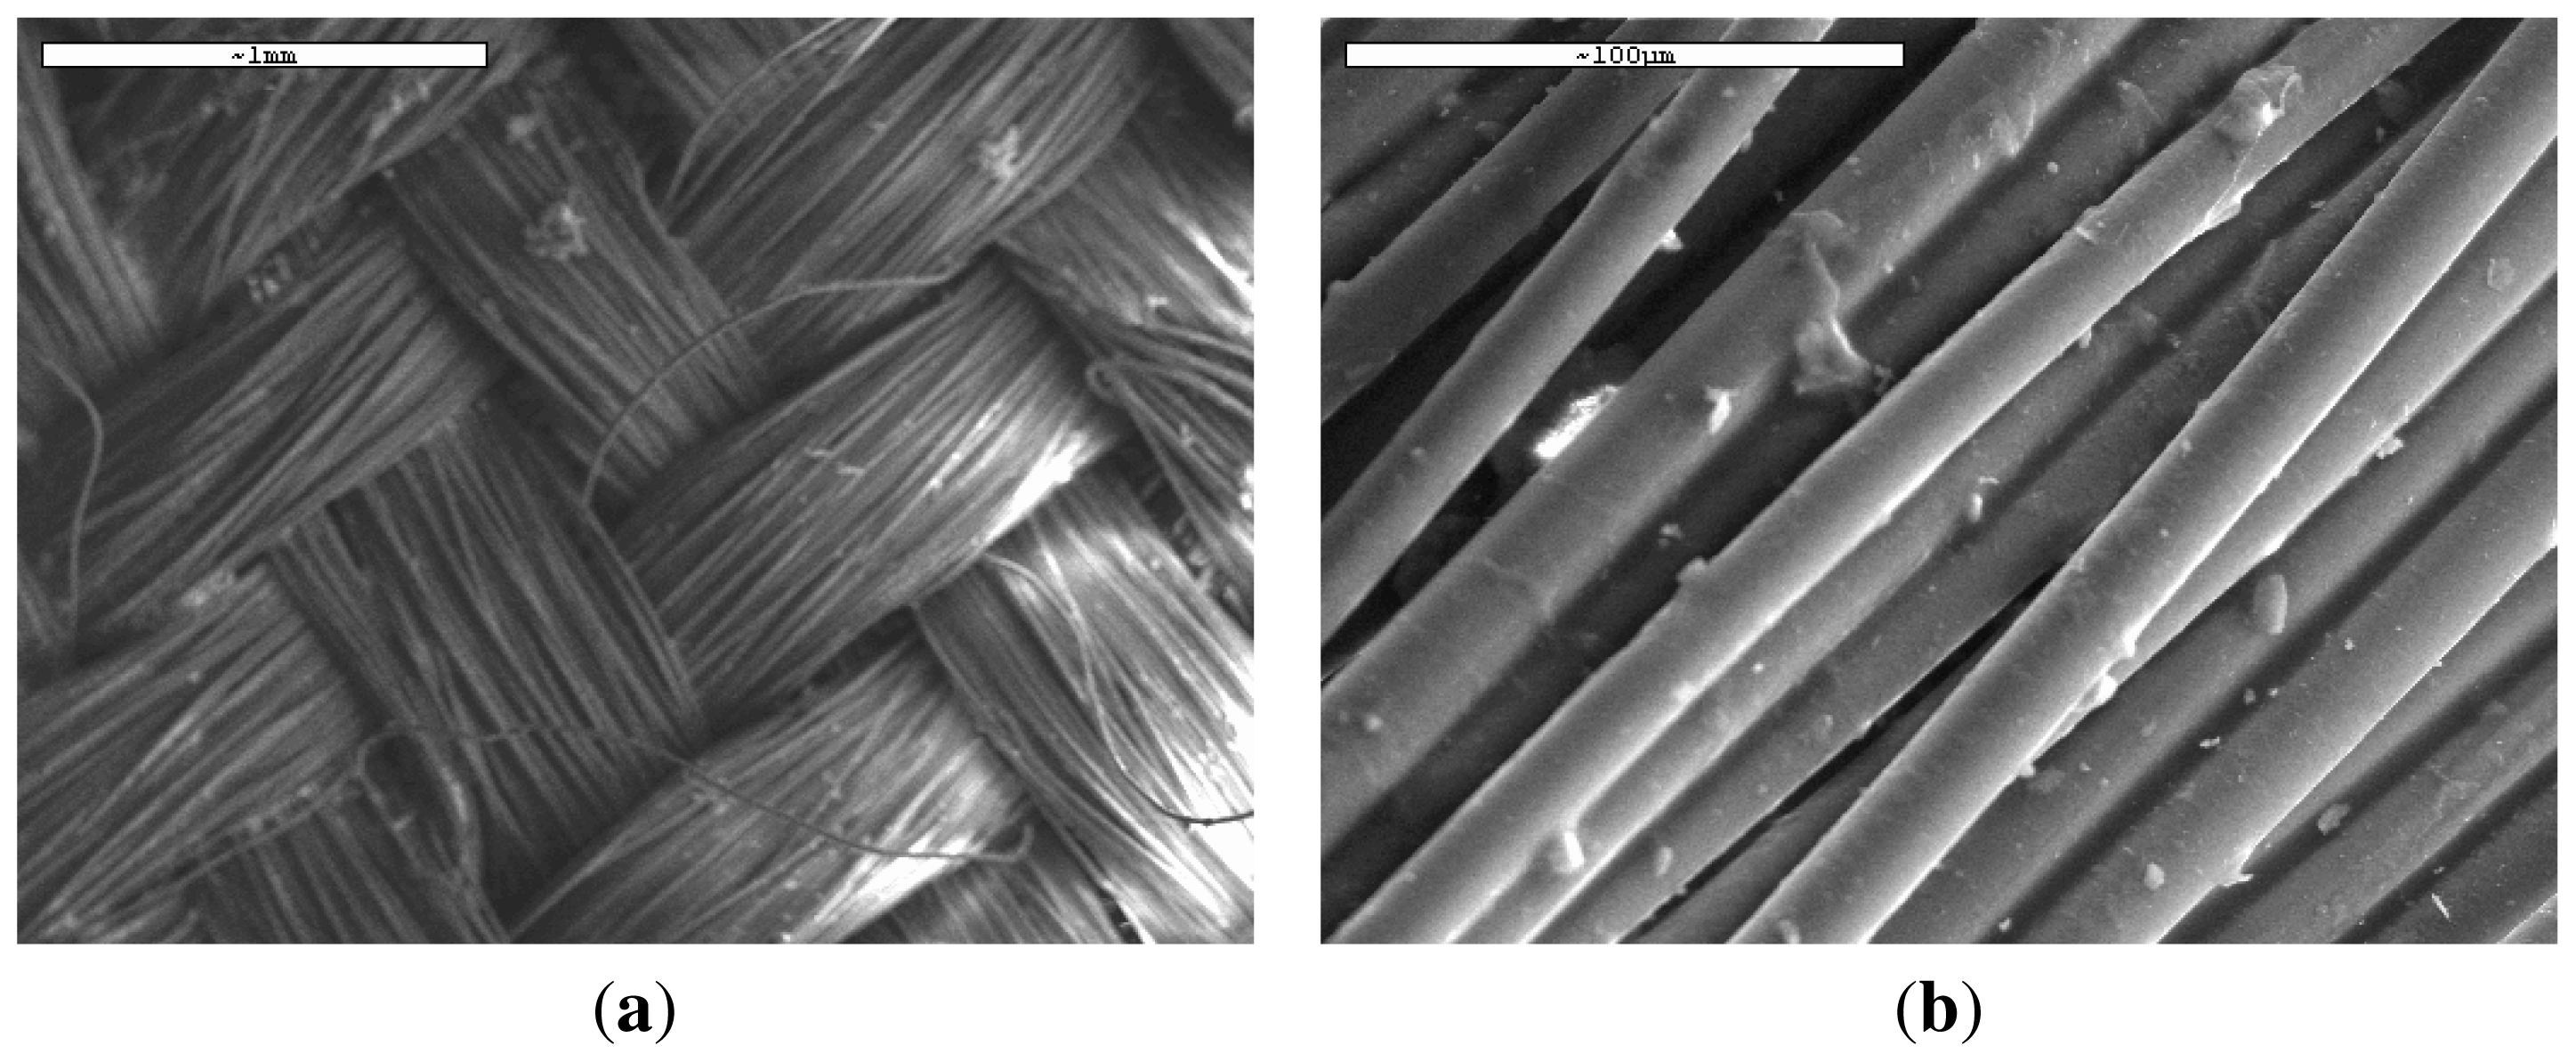
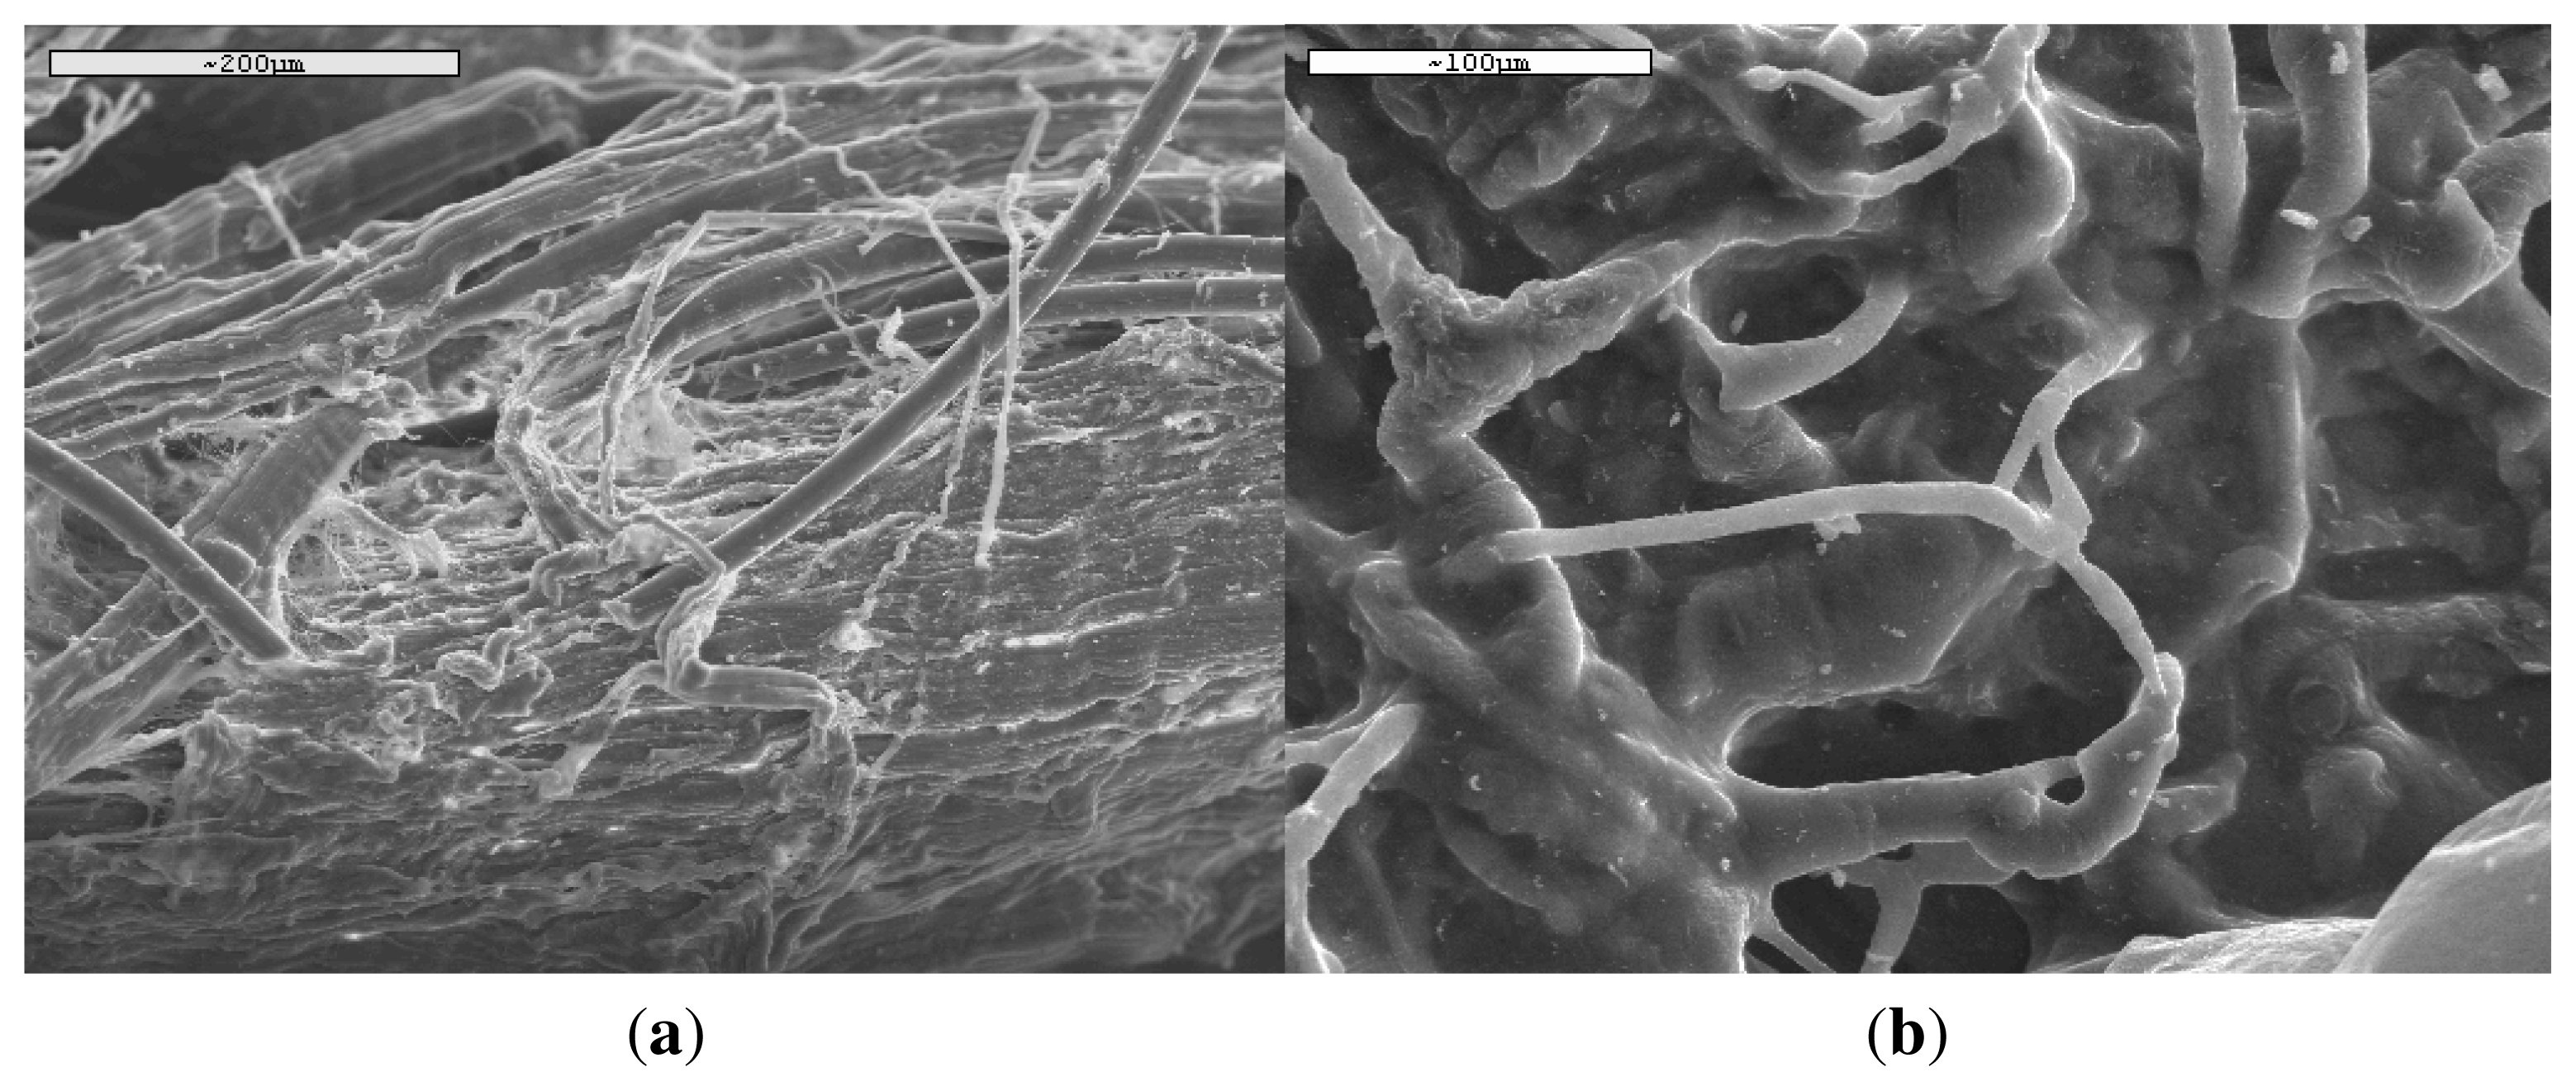
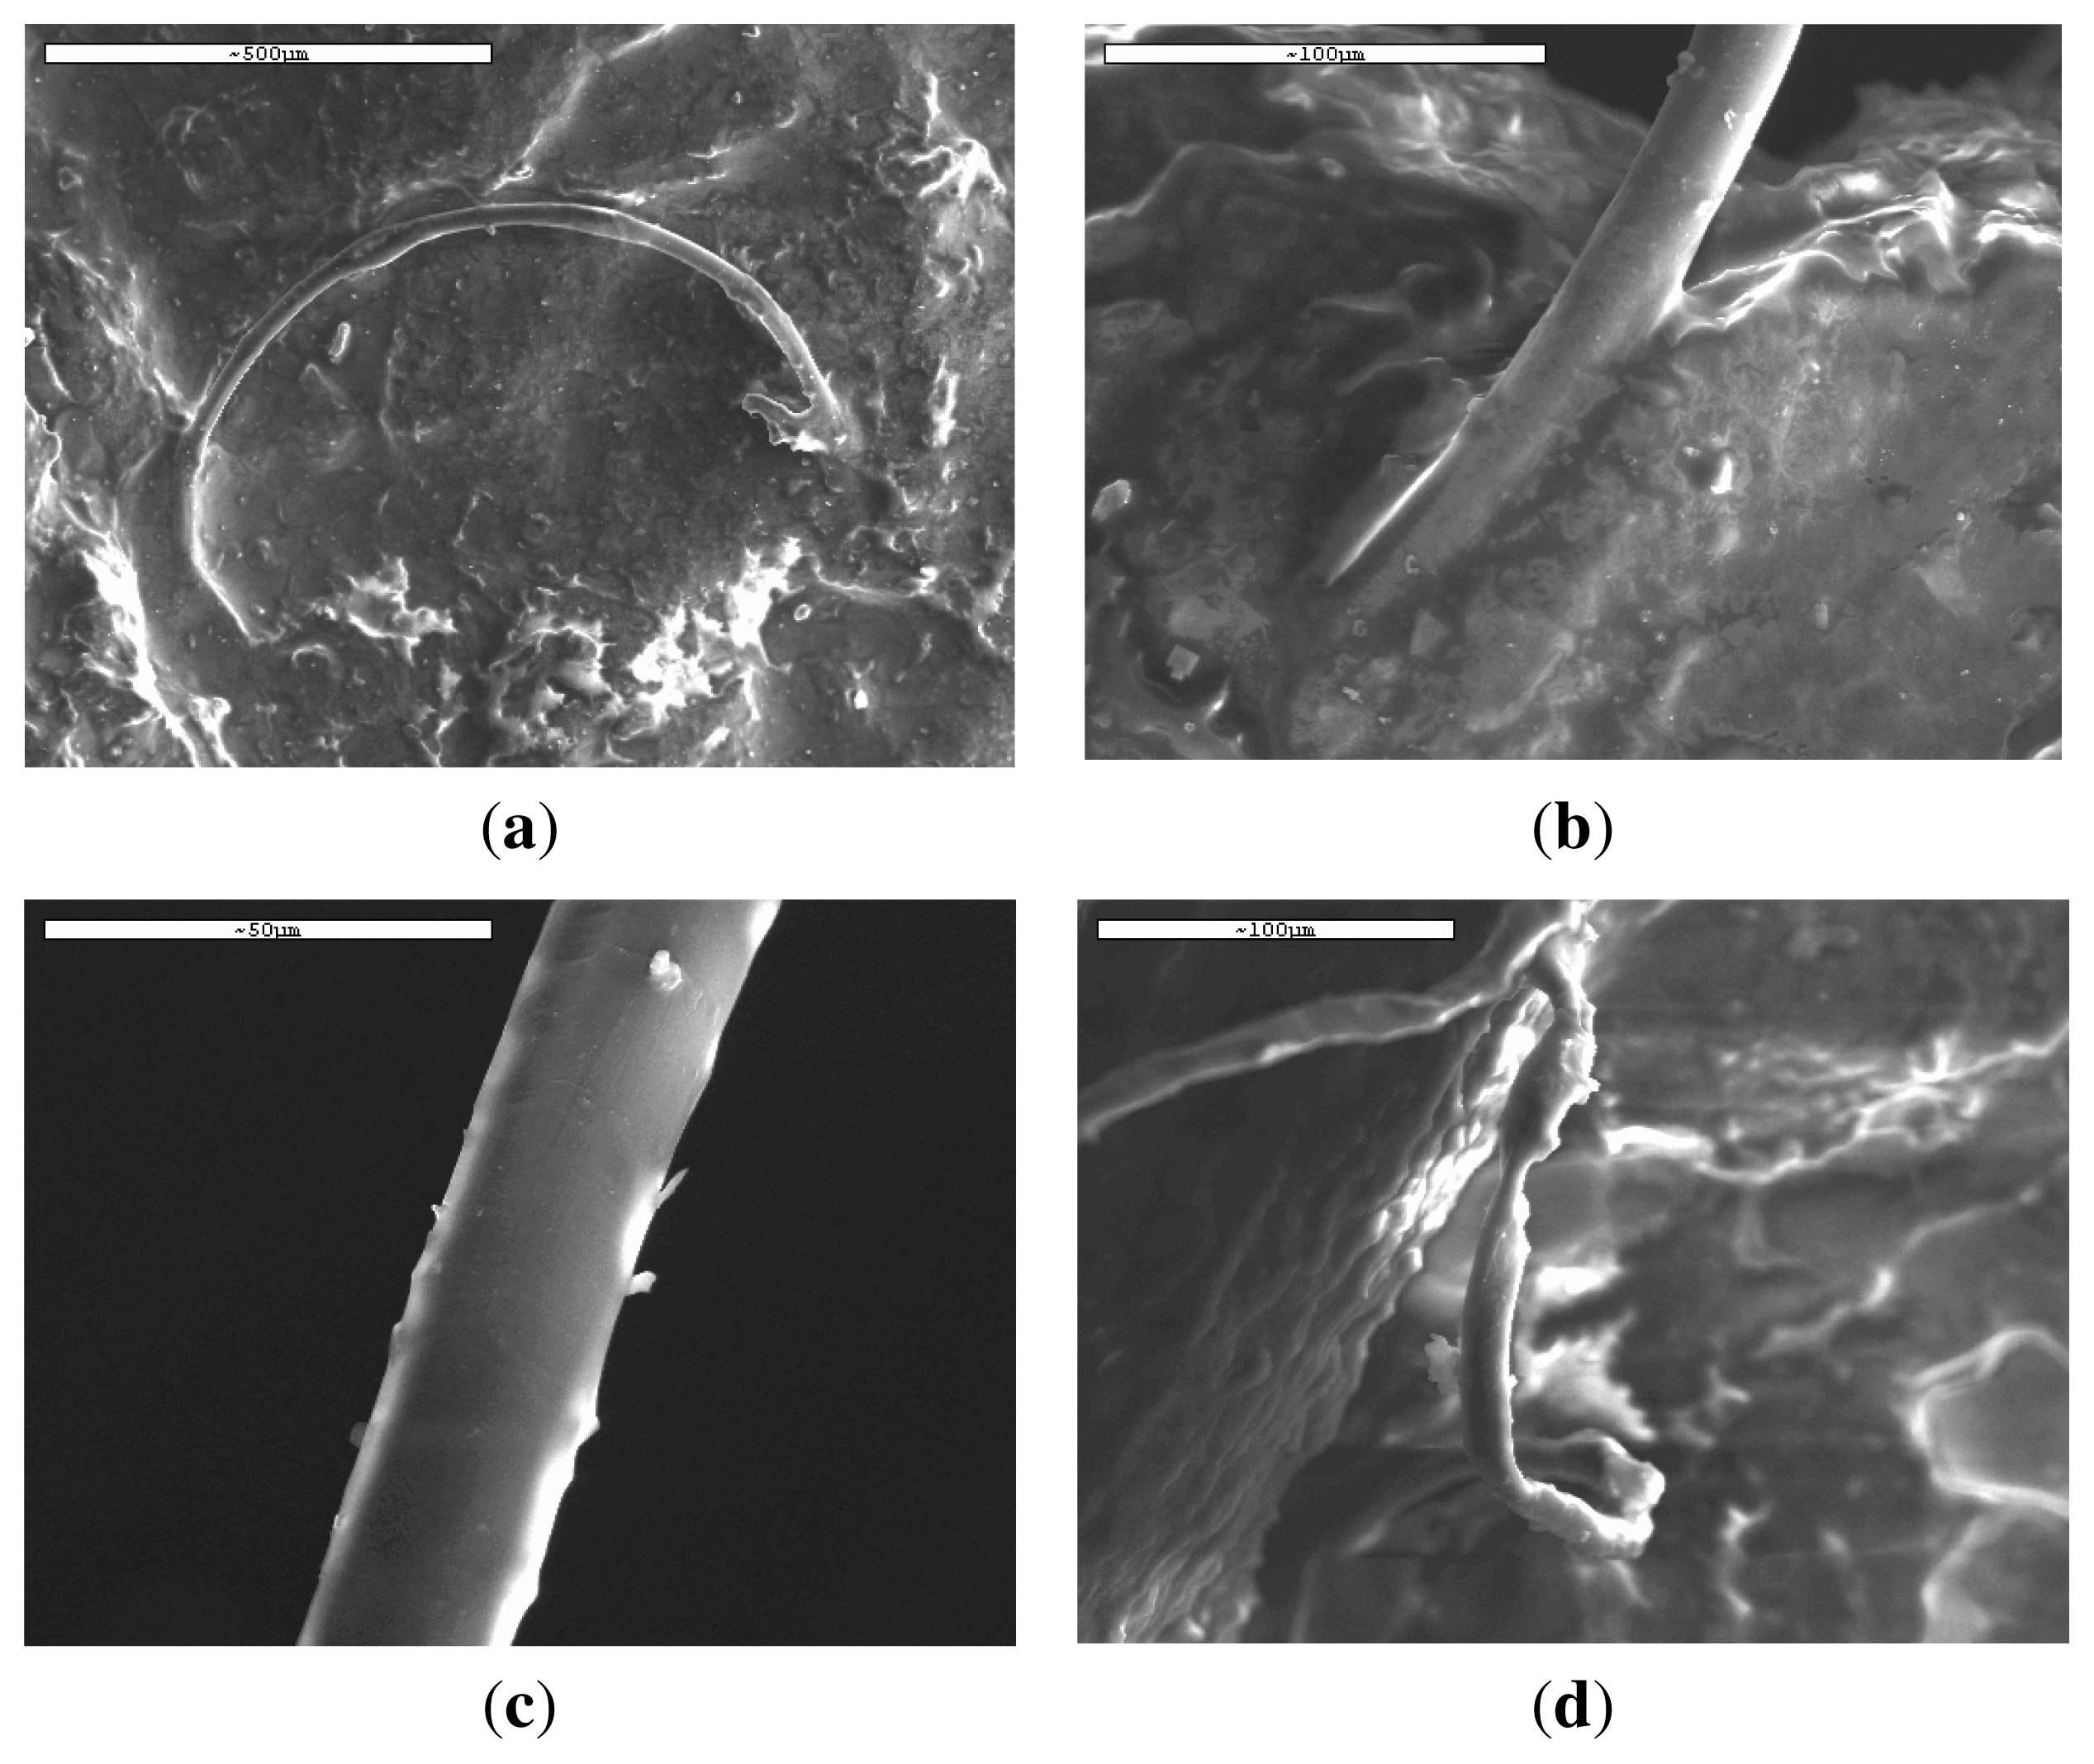
2.2.3. Scanning Electron Microscopy (SEM)
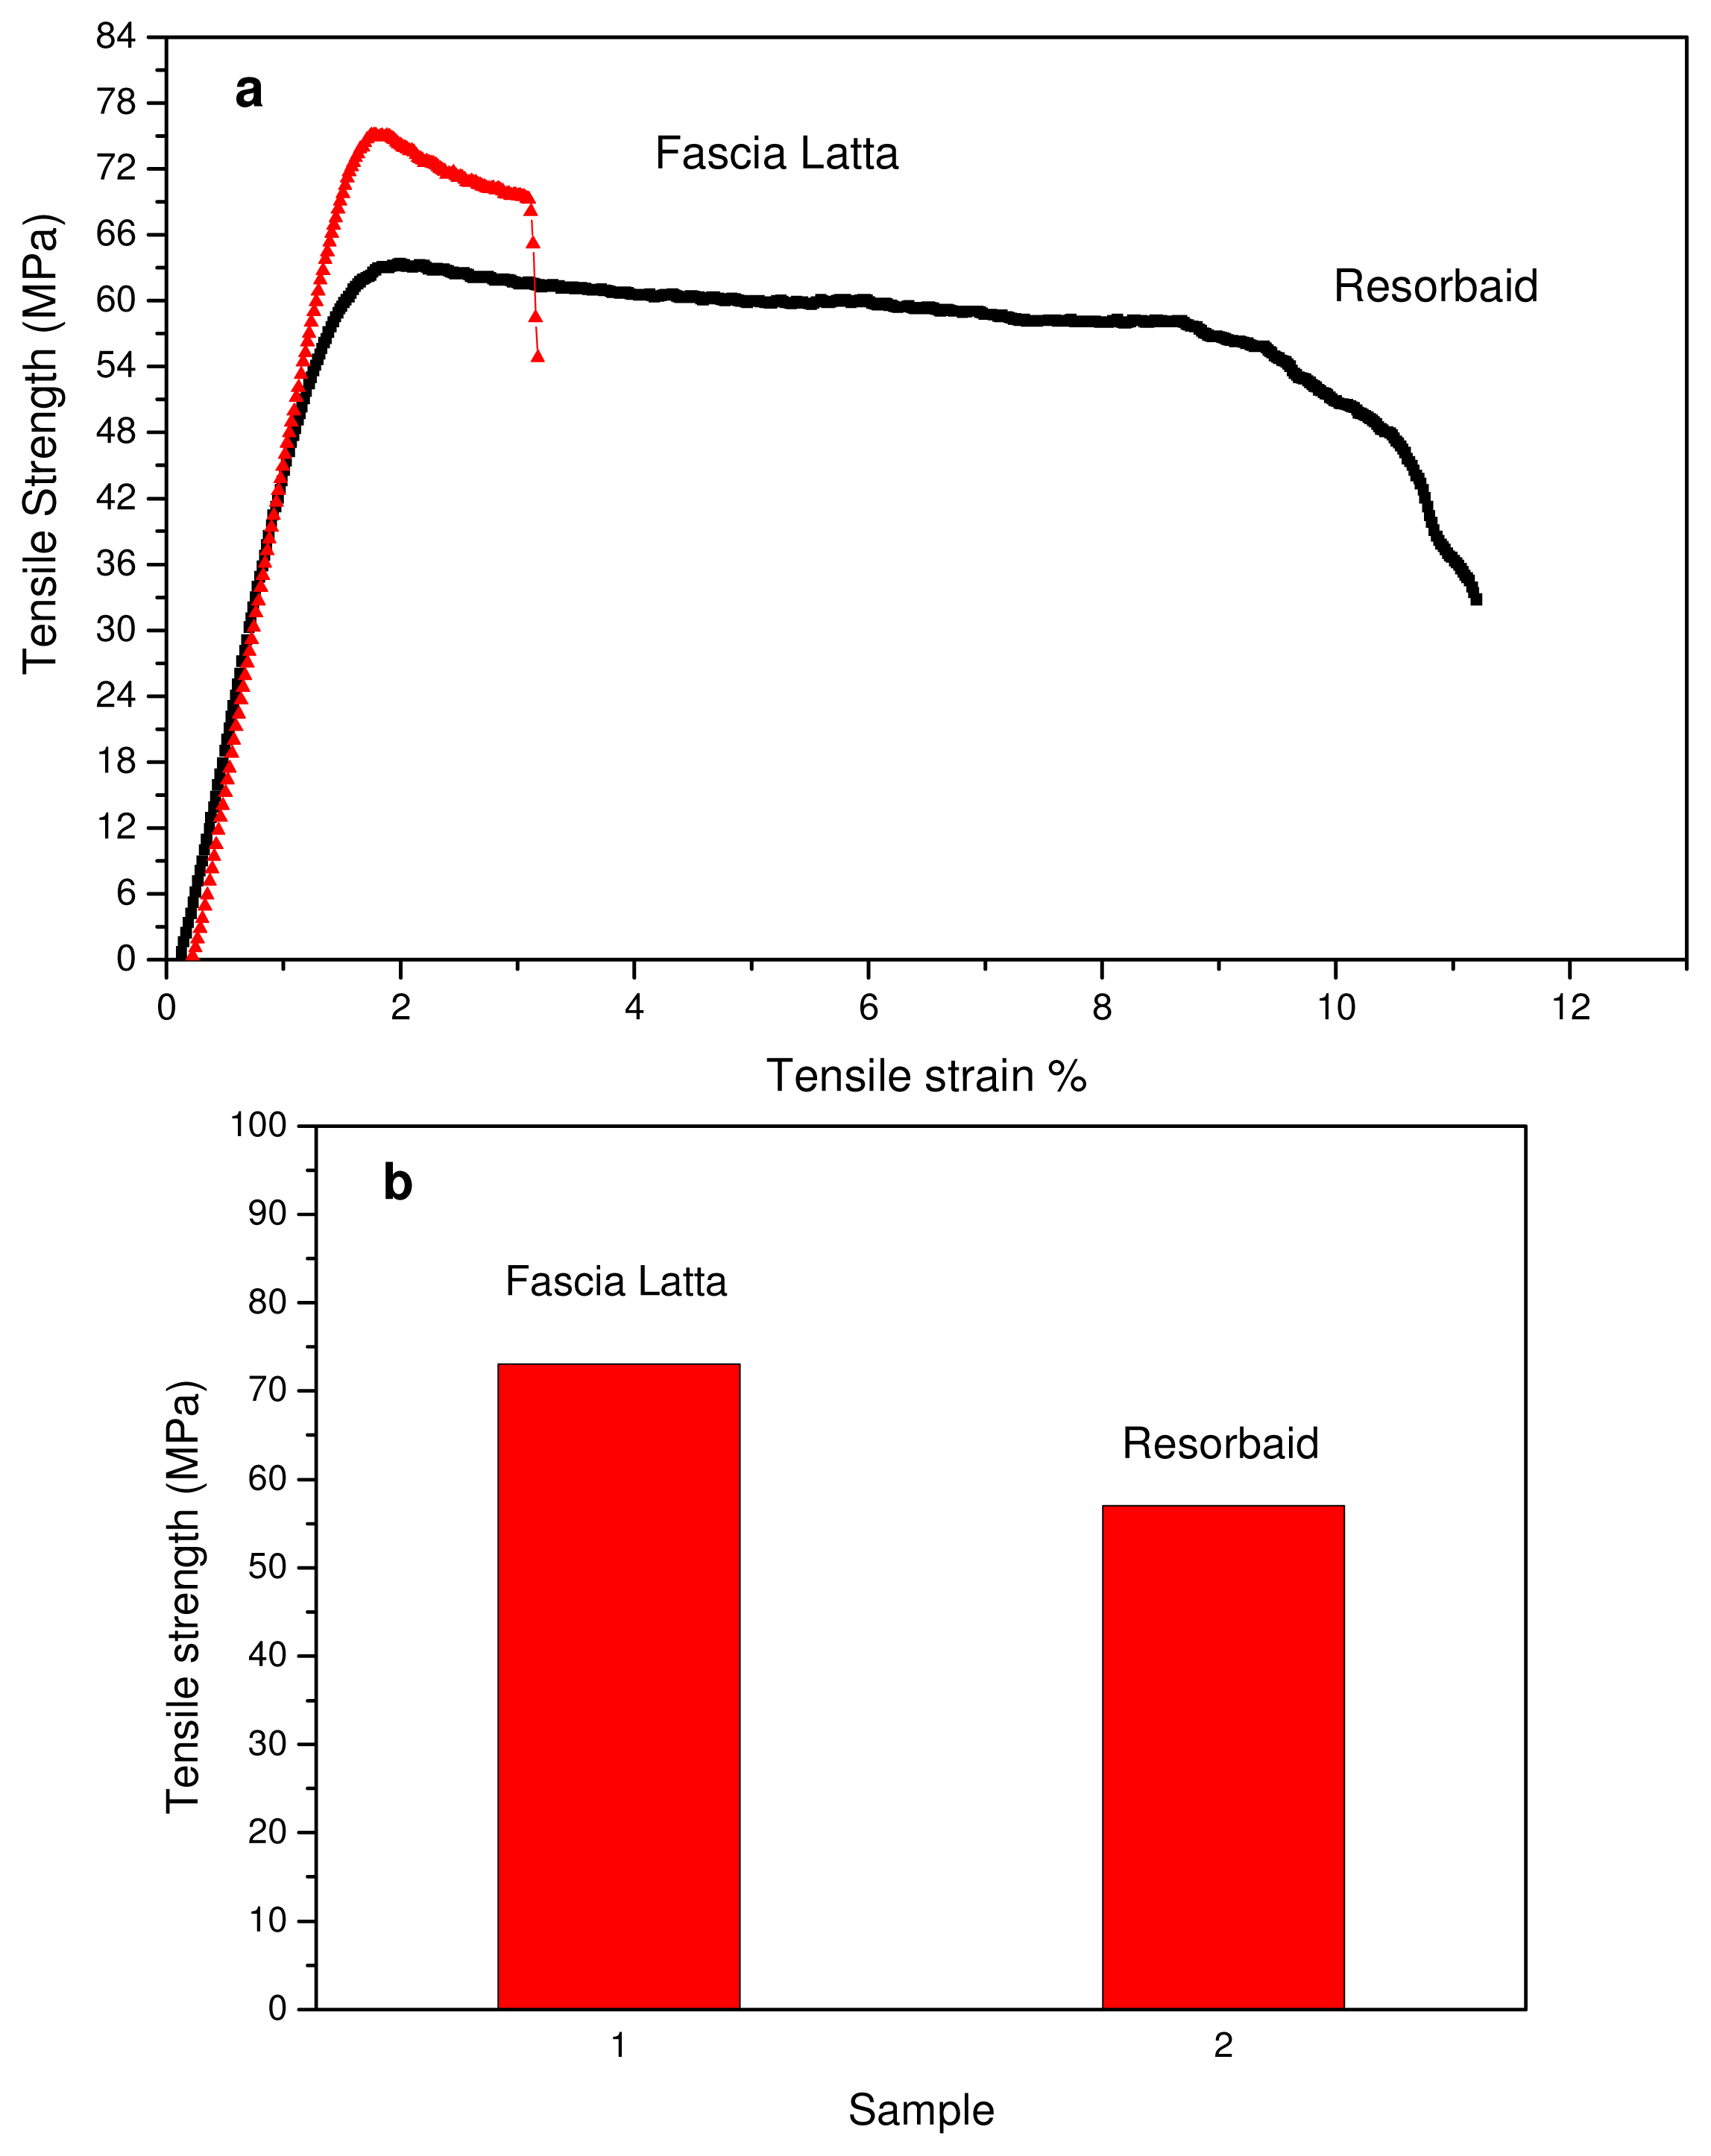
2.2.4. Mechanical Properties
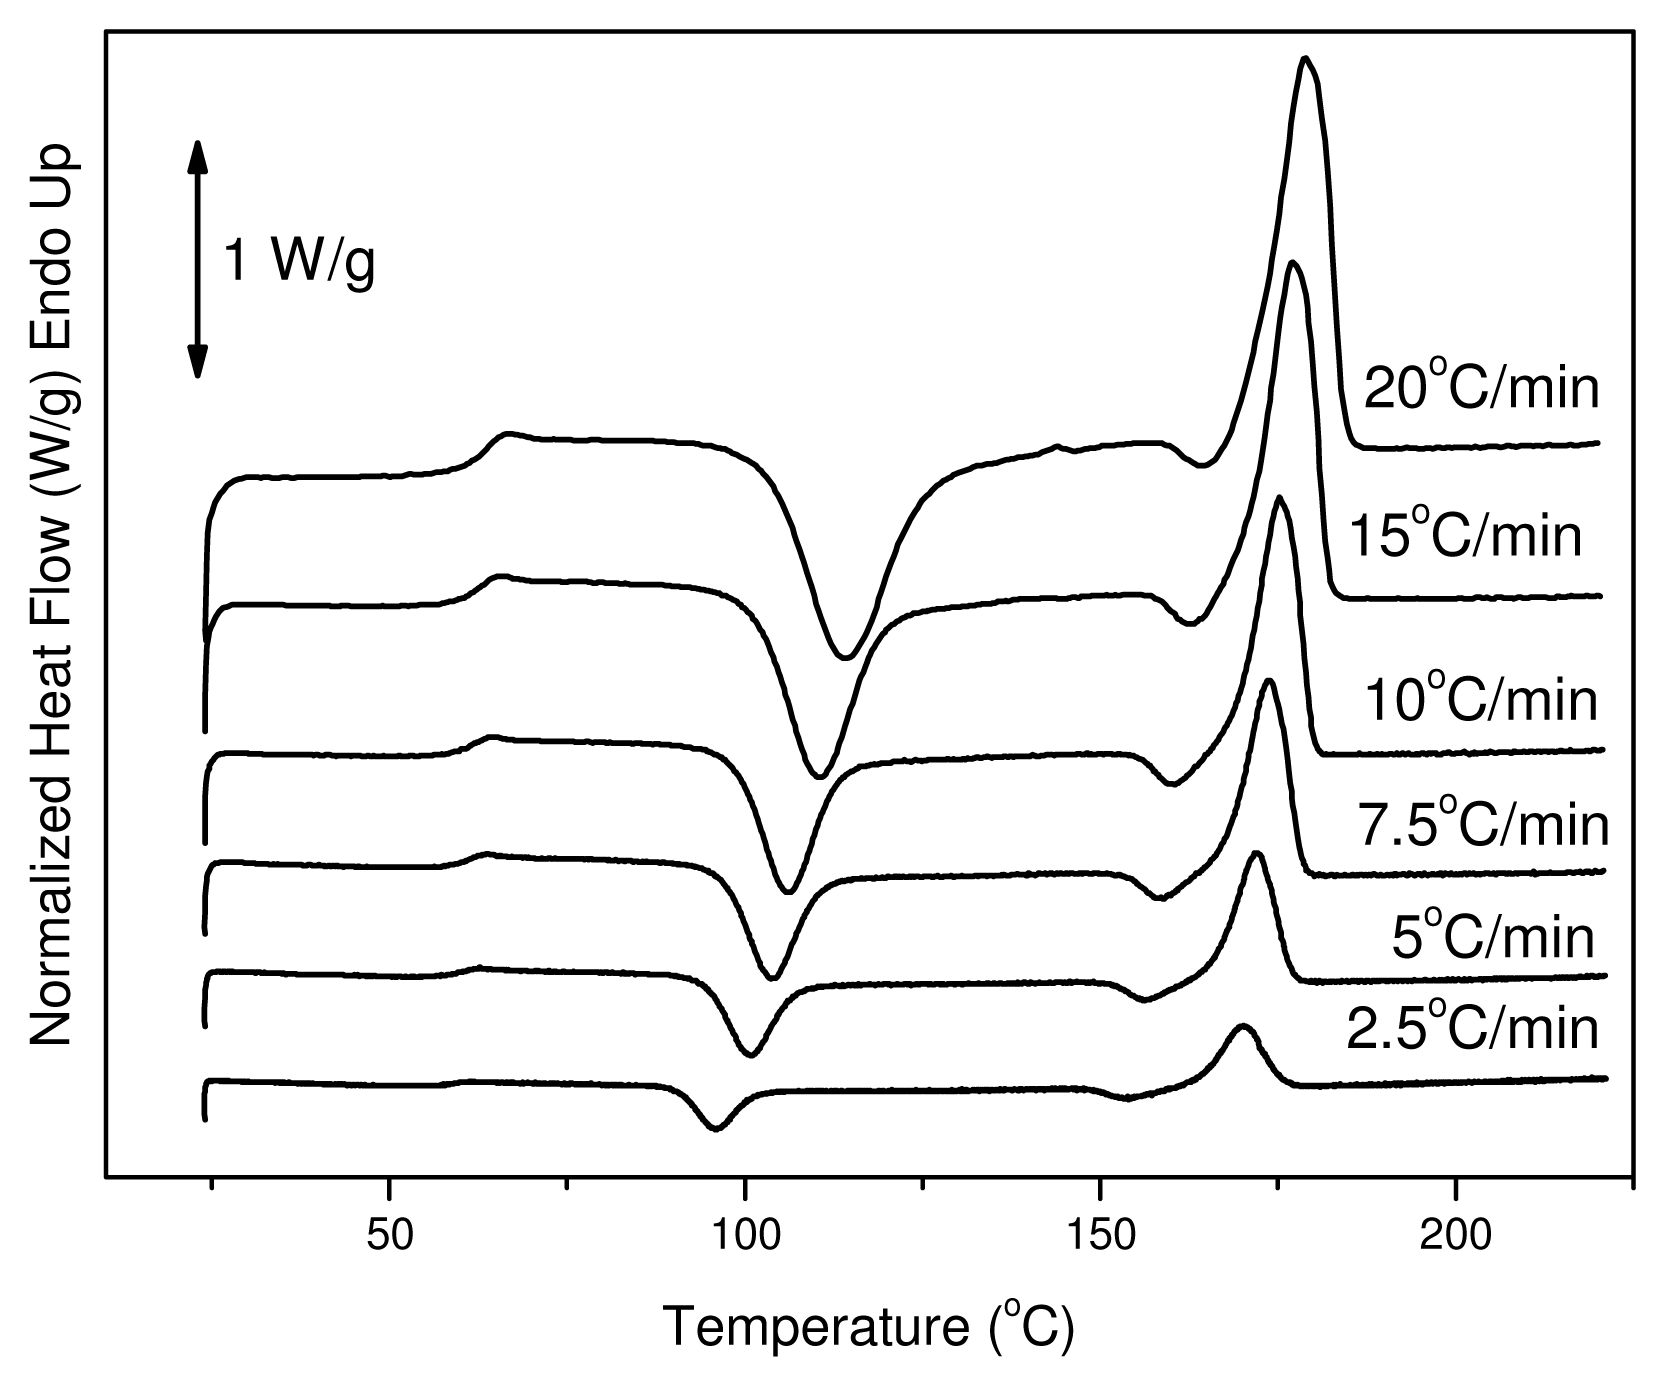
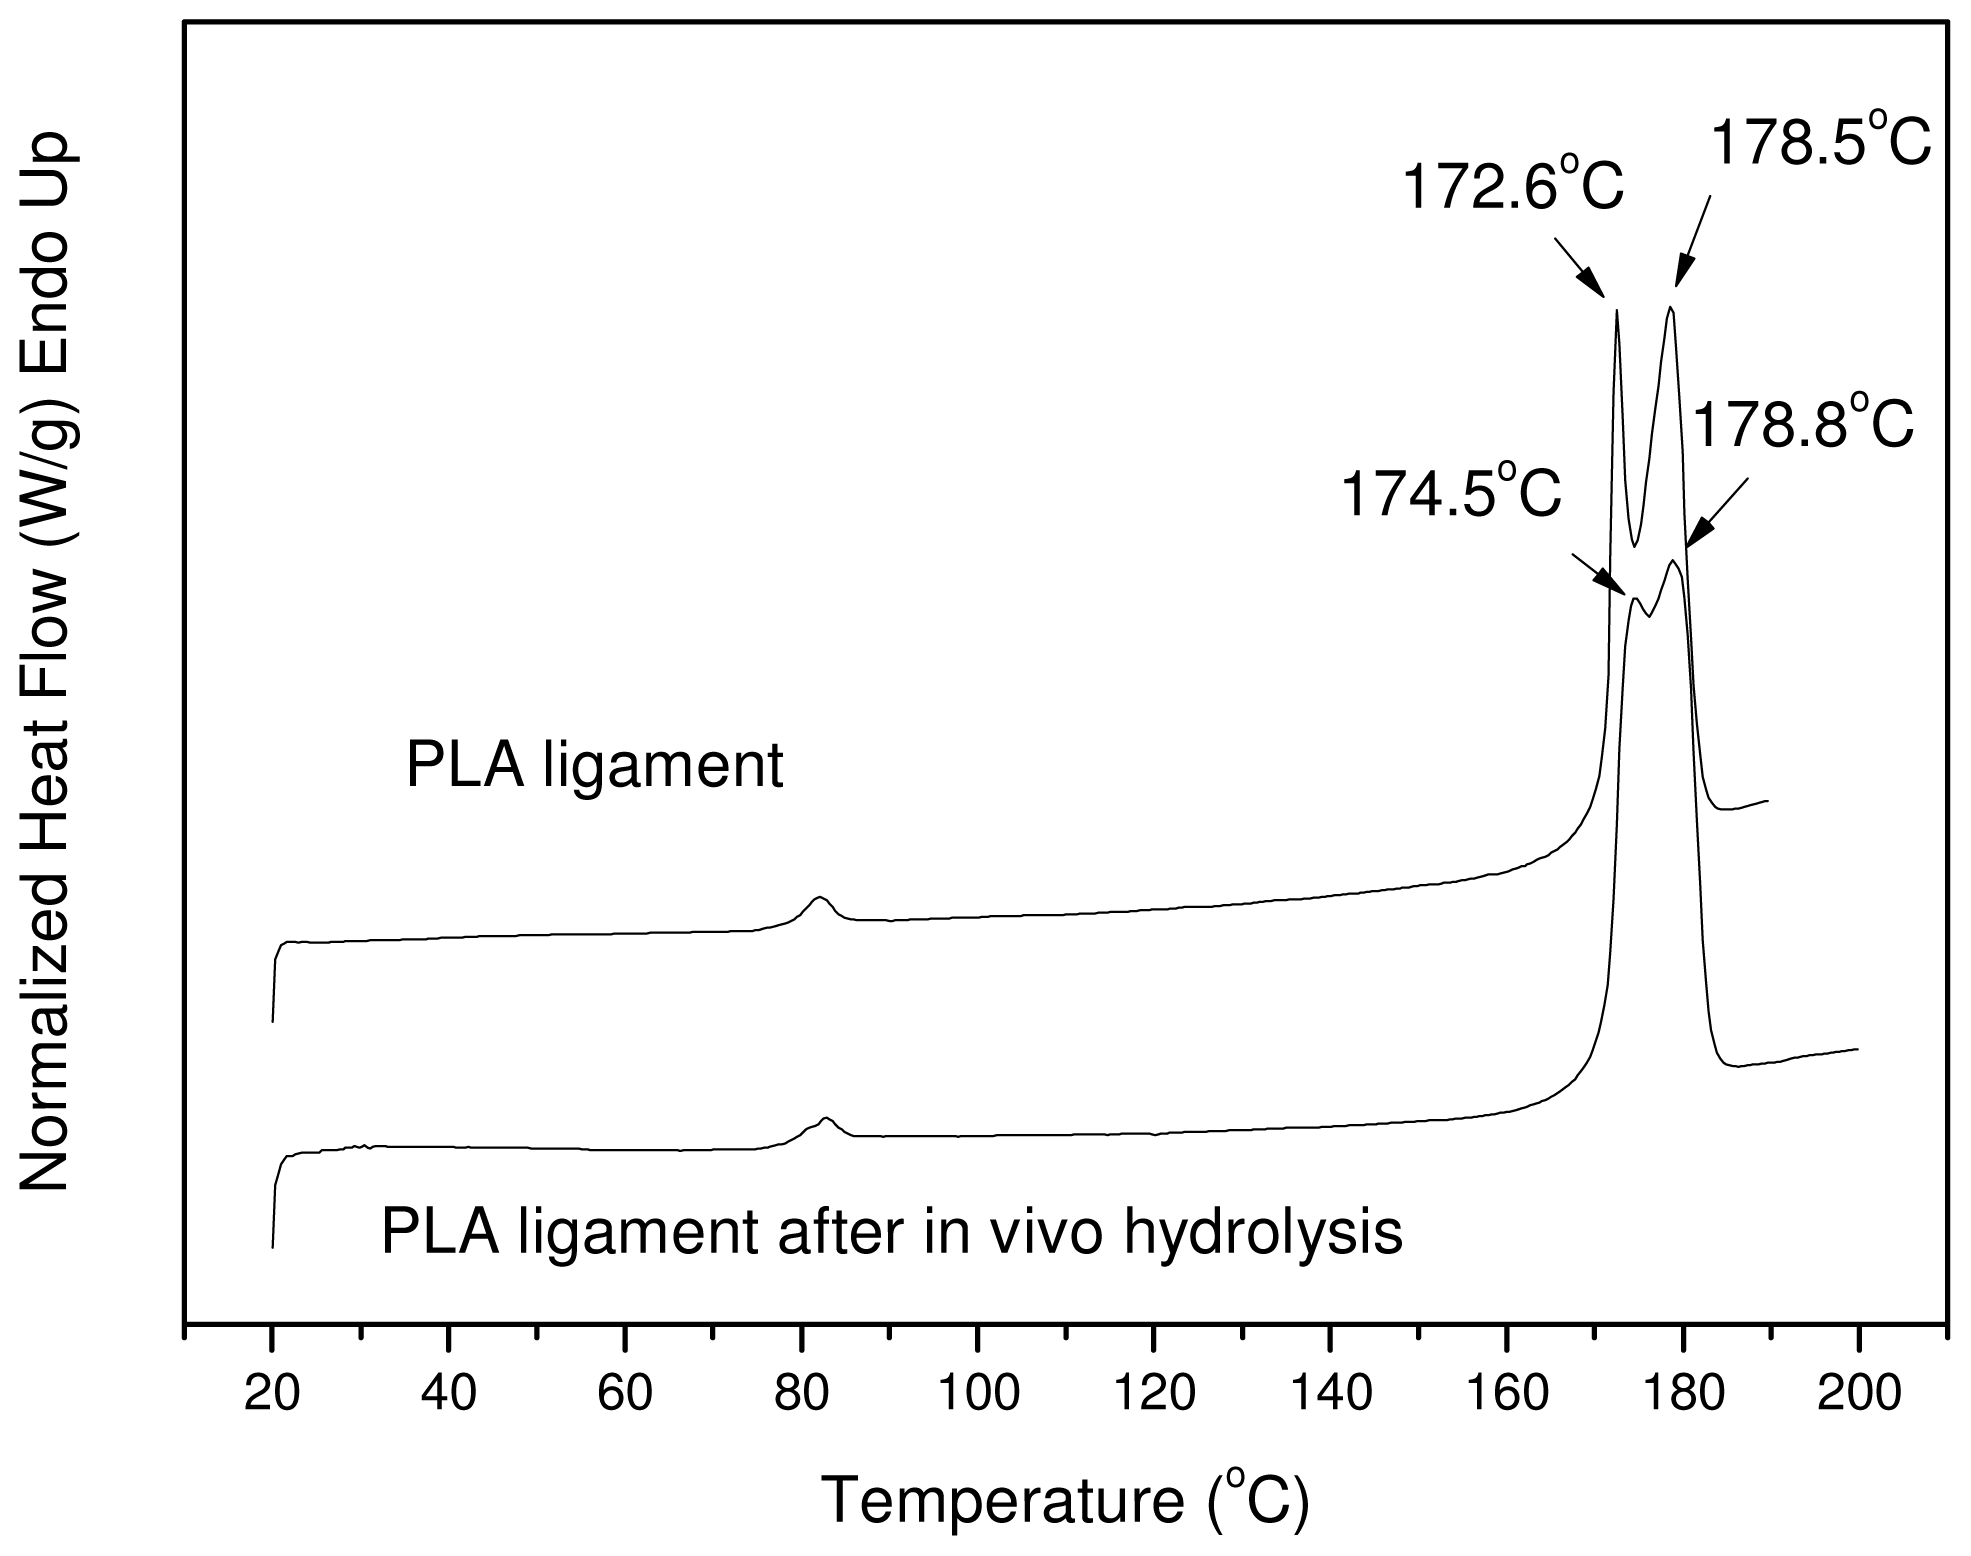
2.2.5. Differential Scanning Calorimetry (DSC)
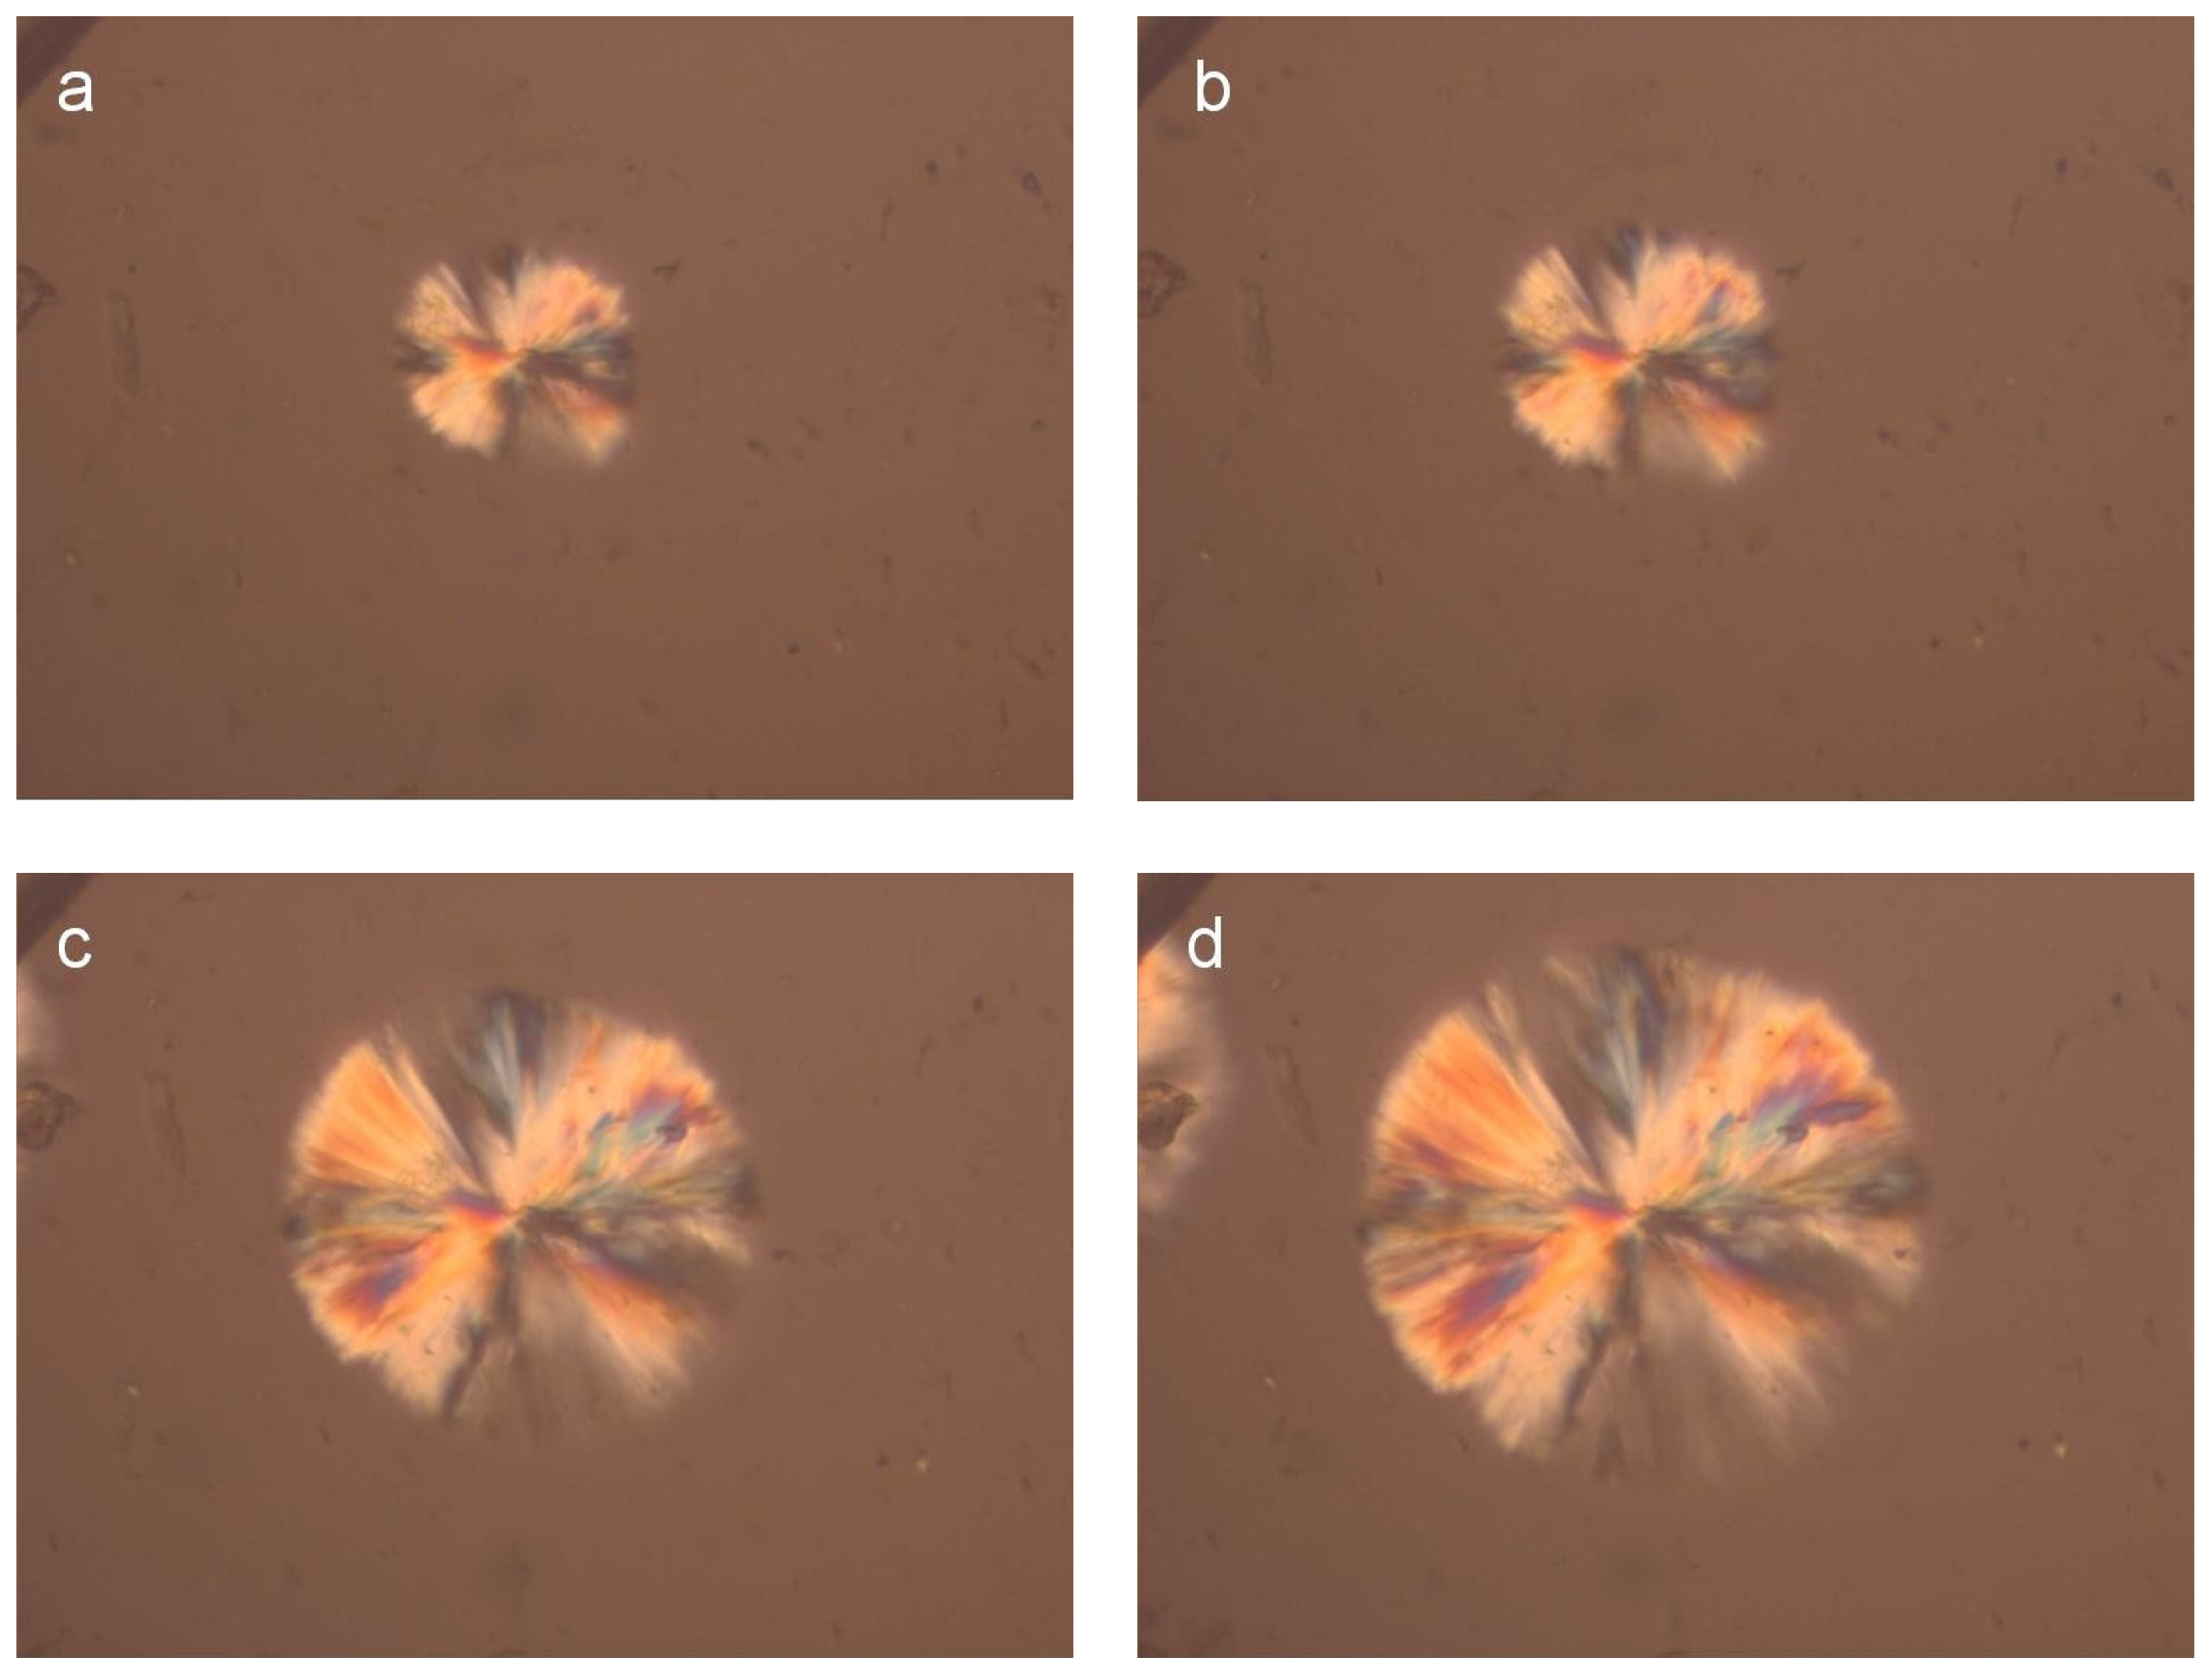
2.2.6. Polarizing Light Microscopy (PLM)
2.2.7. In Vitro Hydrolysis
2.2.8. In Vivo Hydrolysis
3. Results and Discussion
3.1. Characterization of PLA Reinforcement Ligament
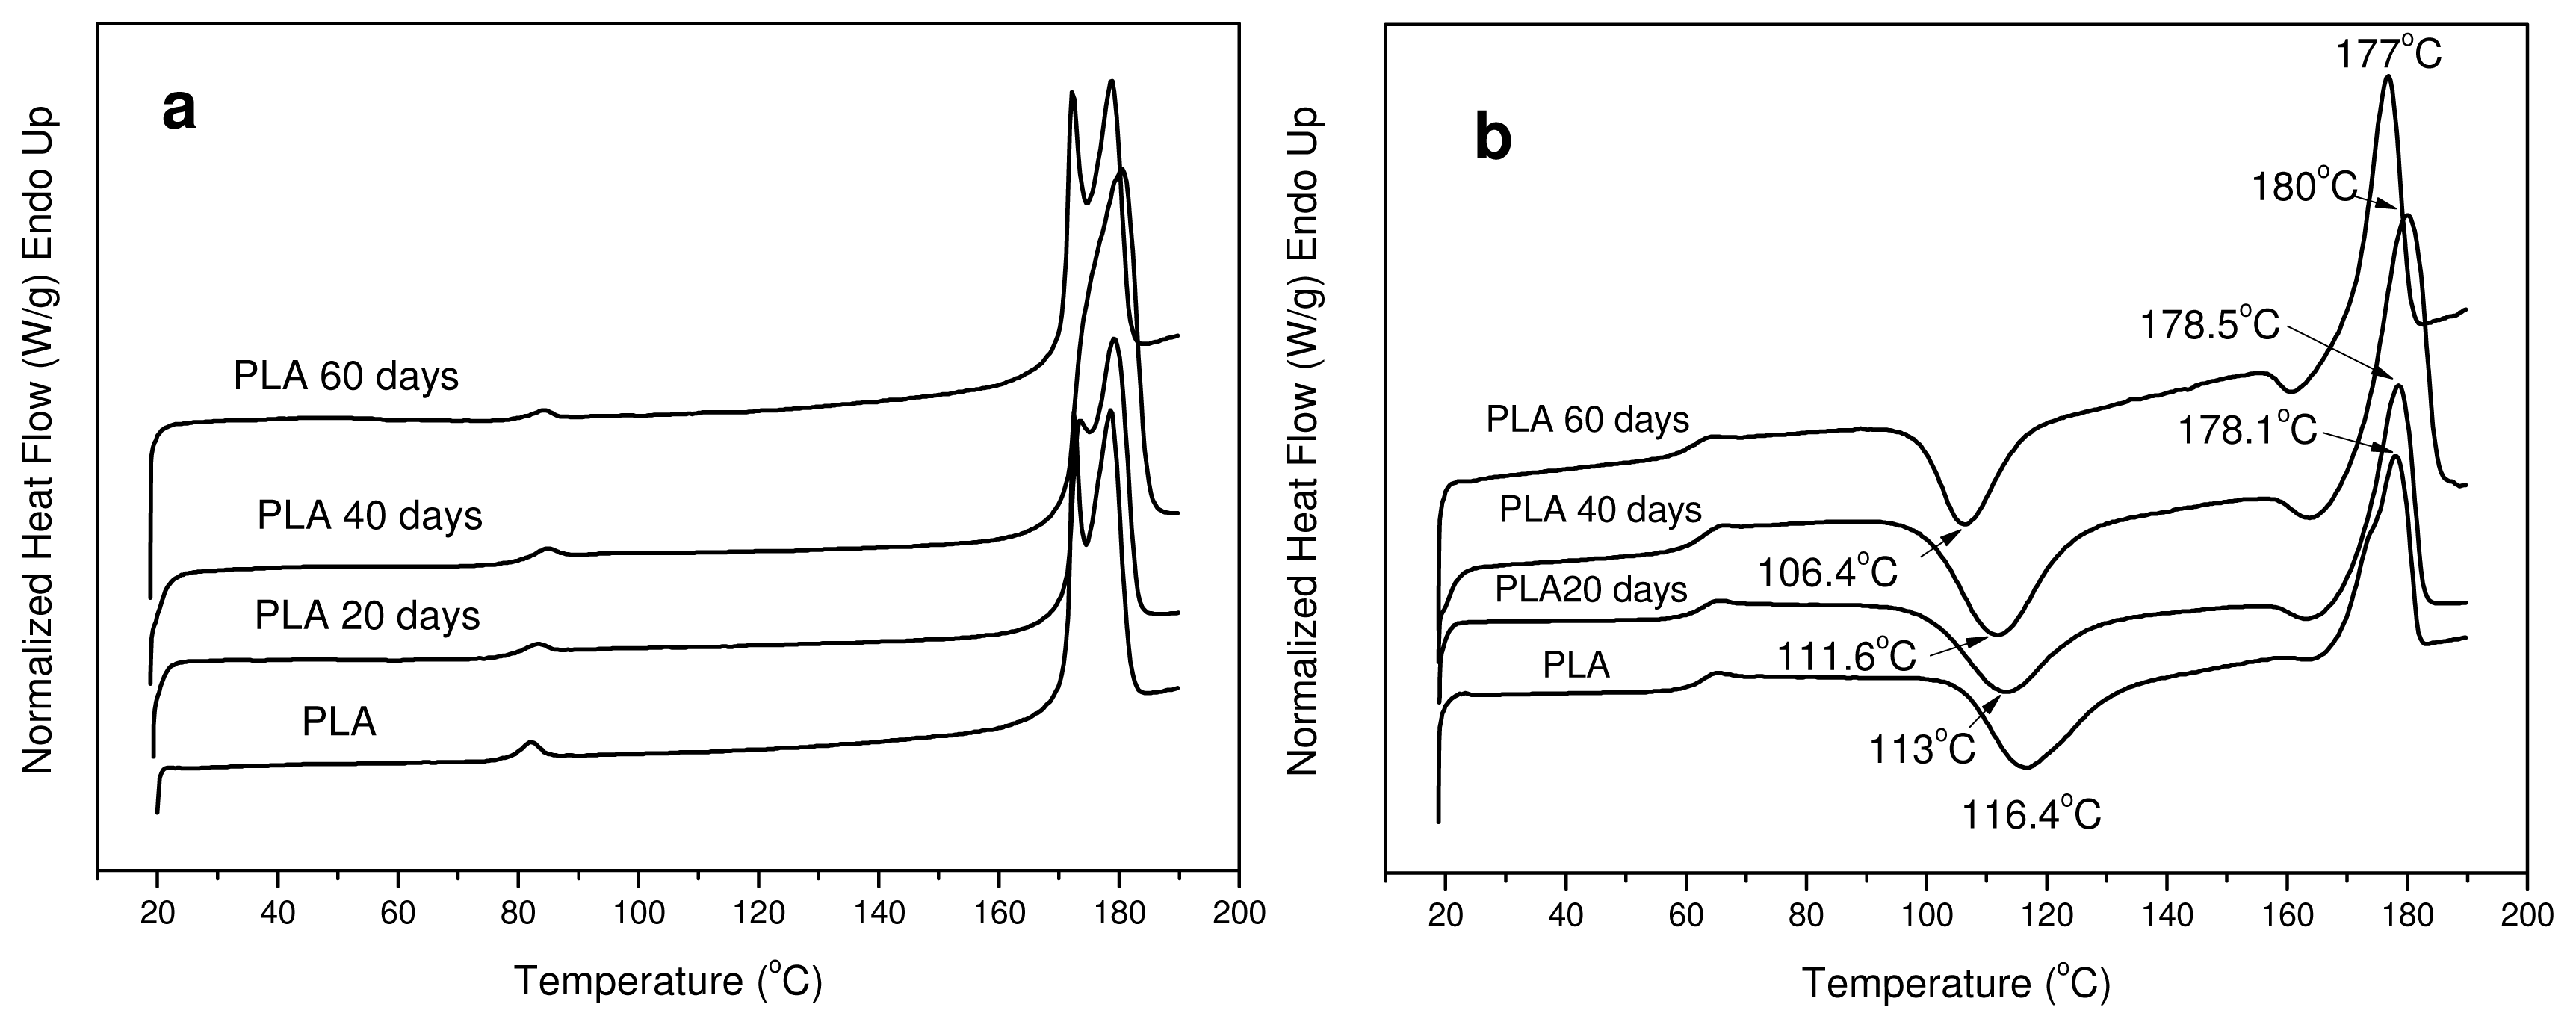
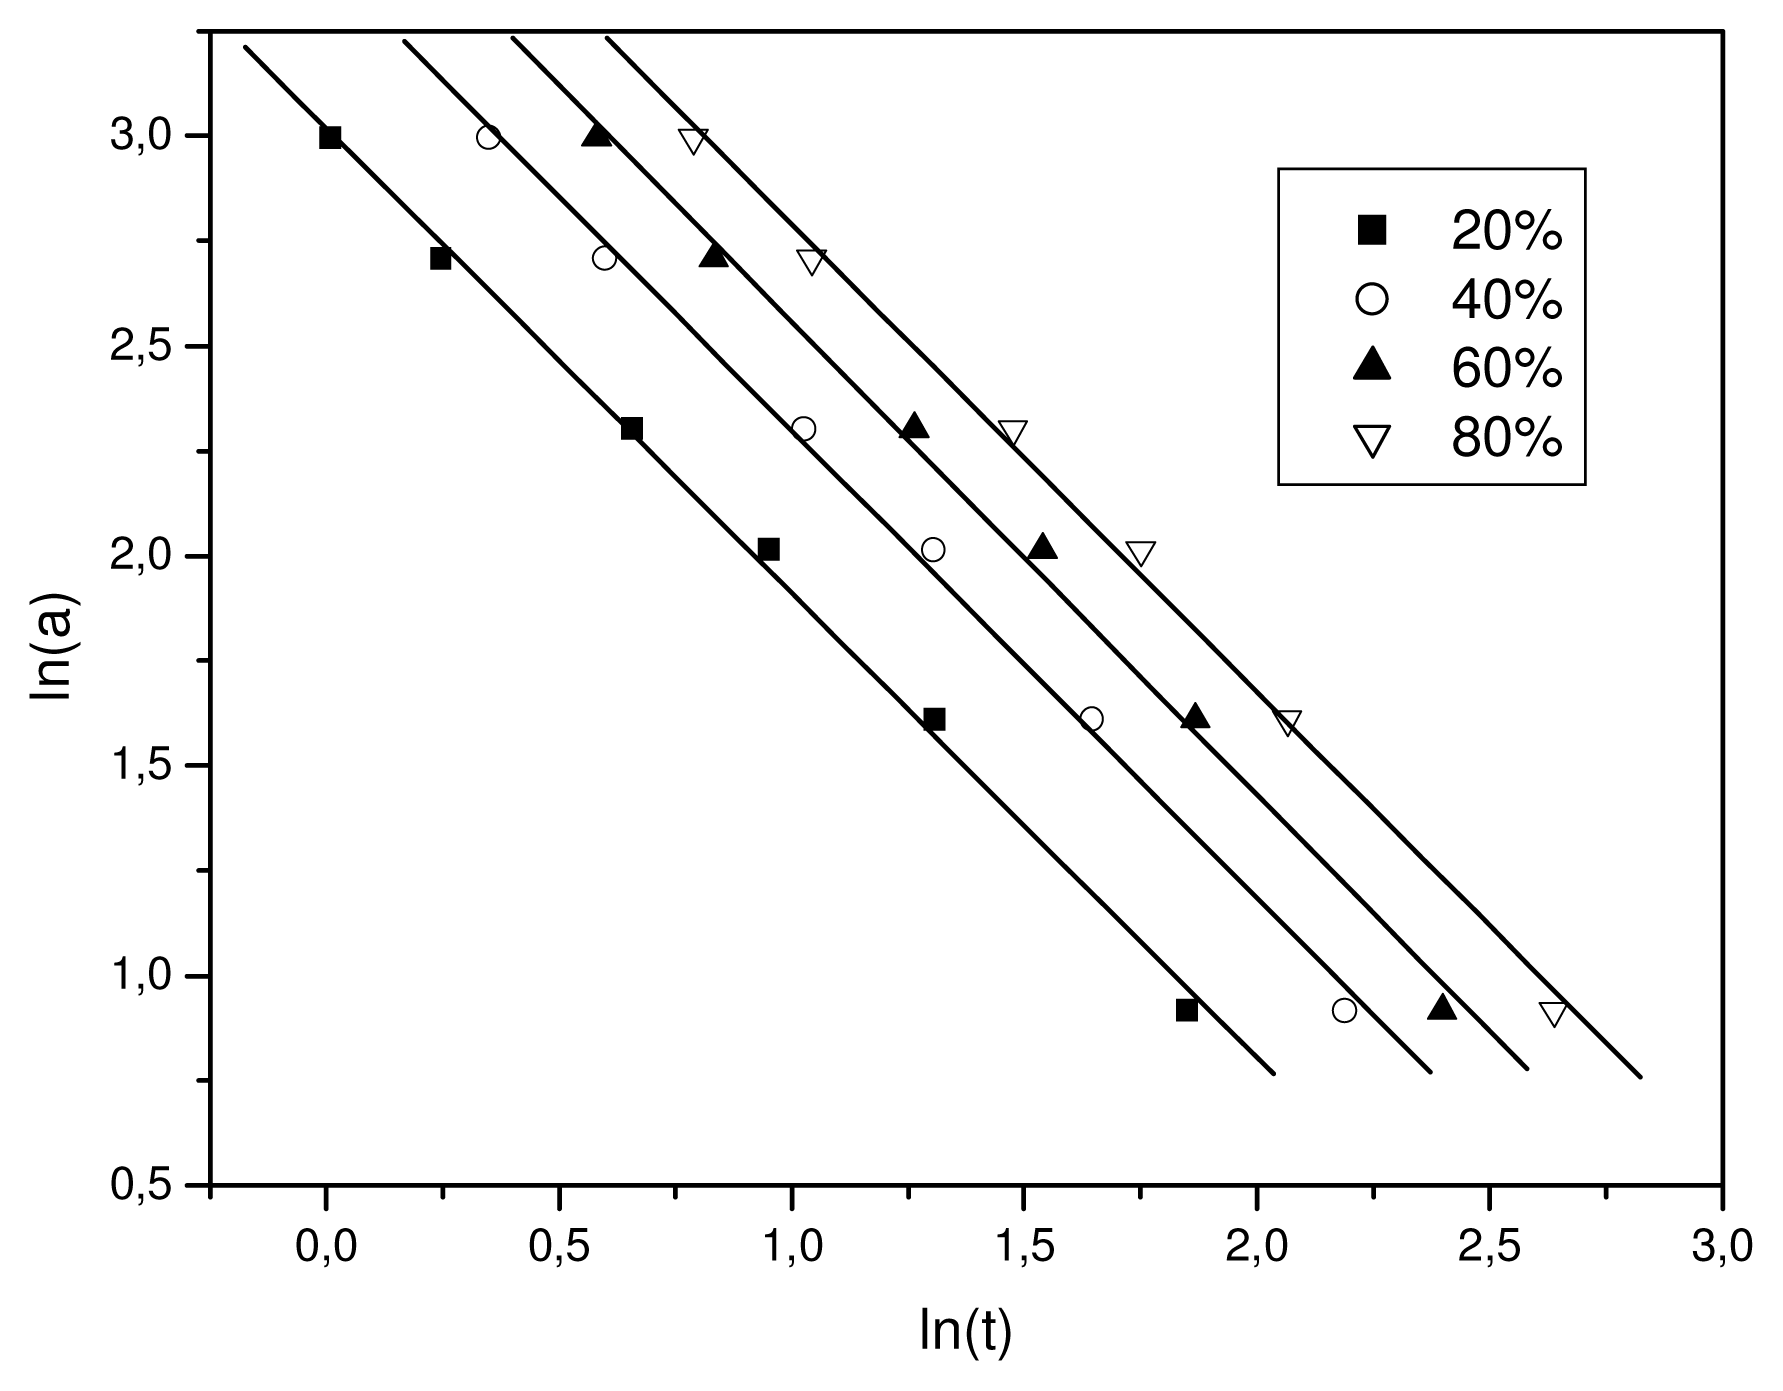
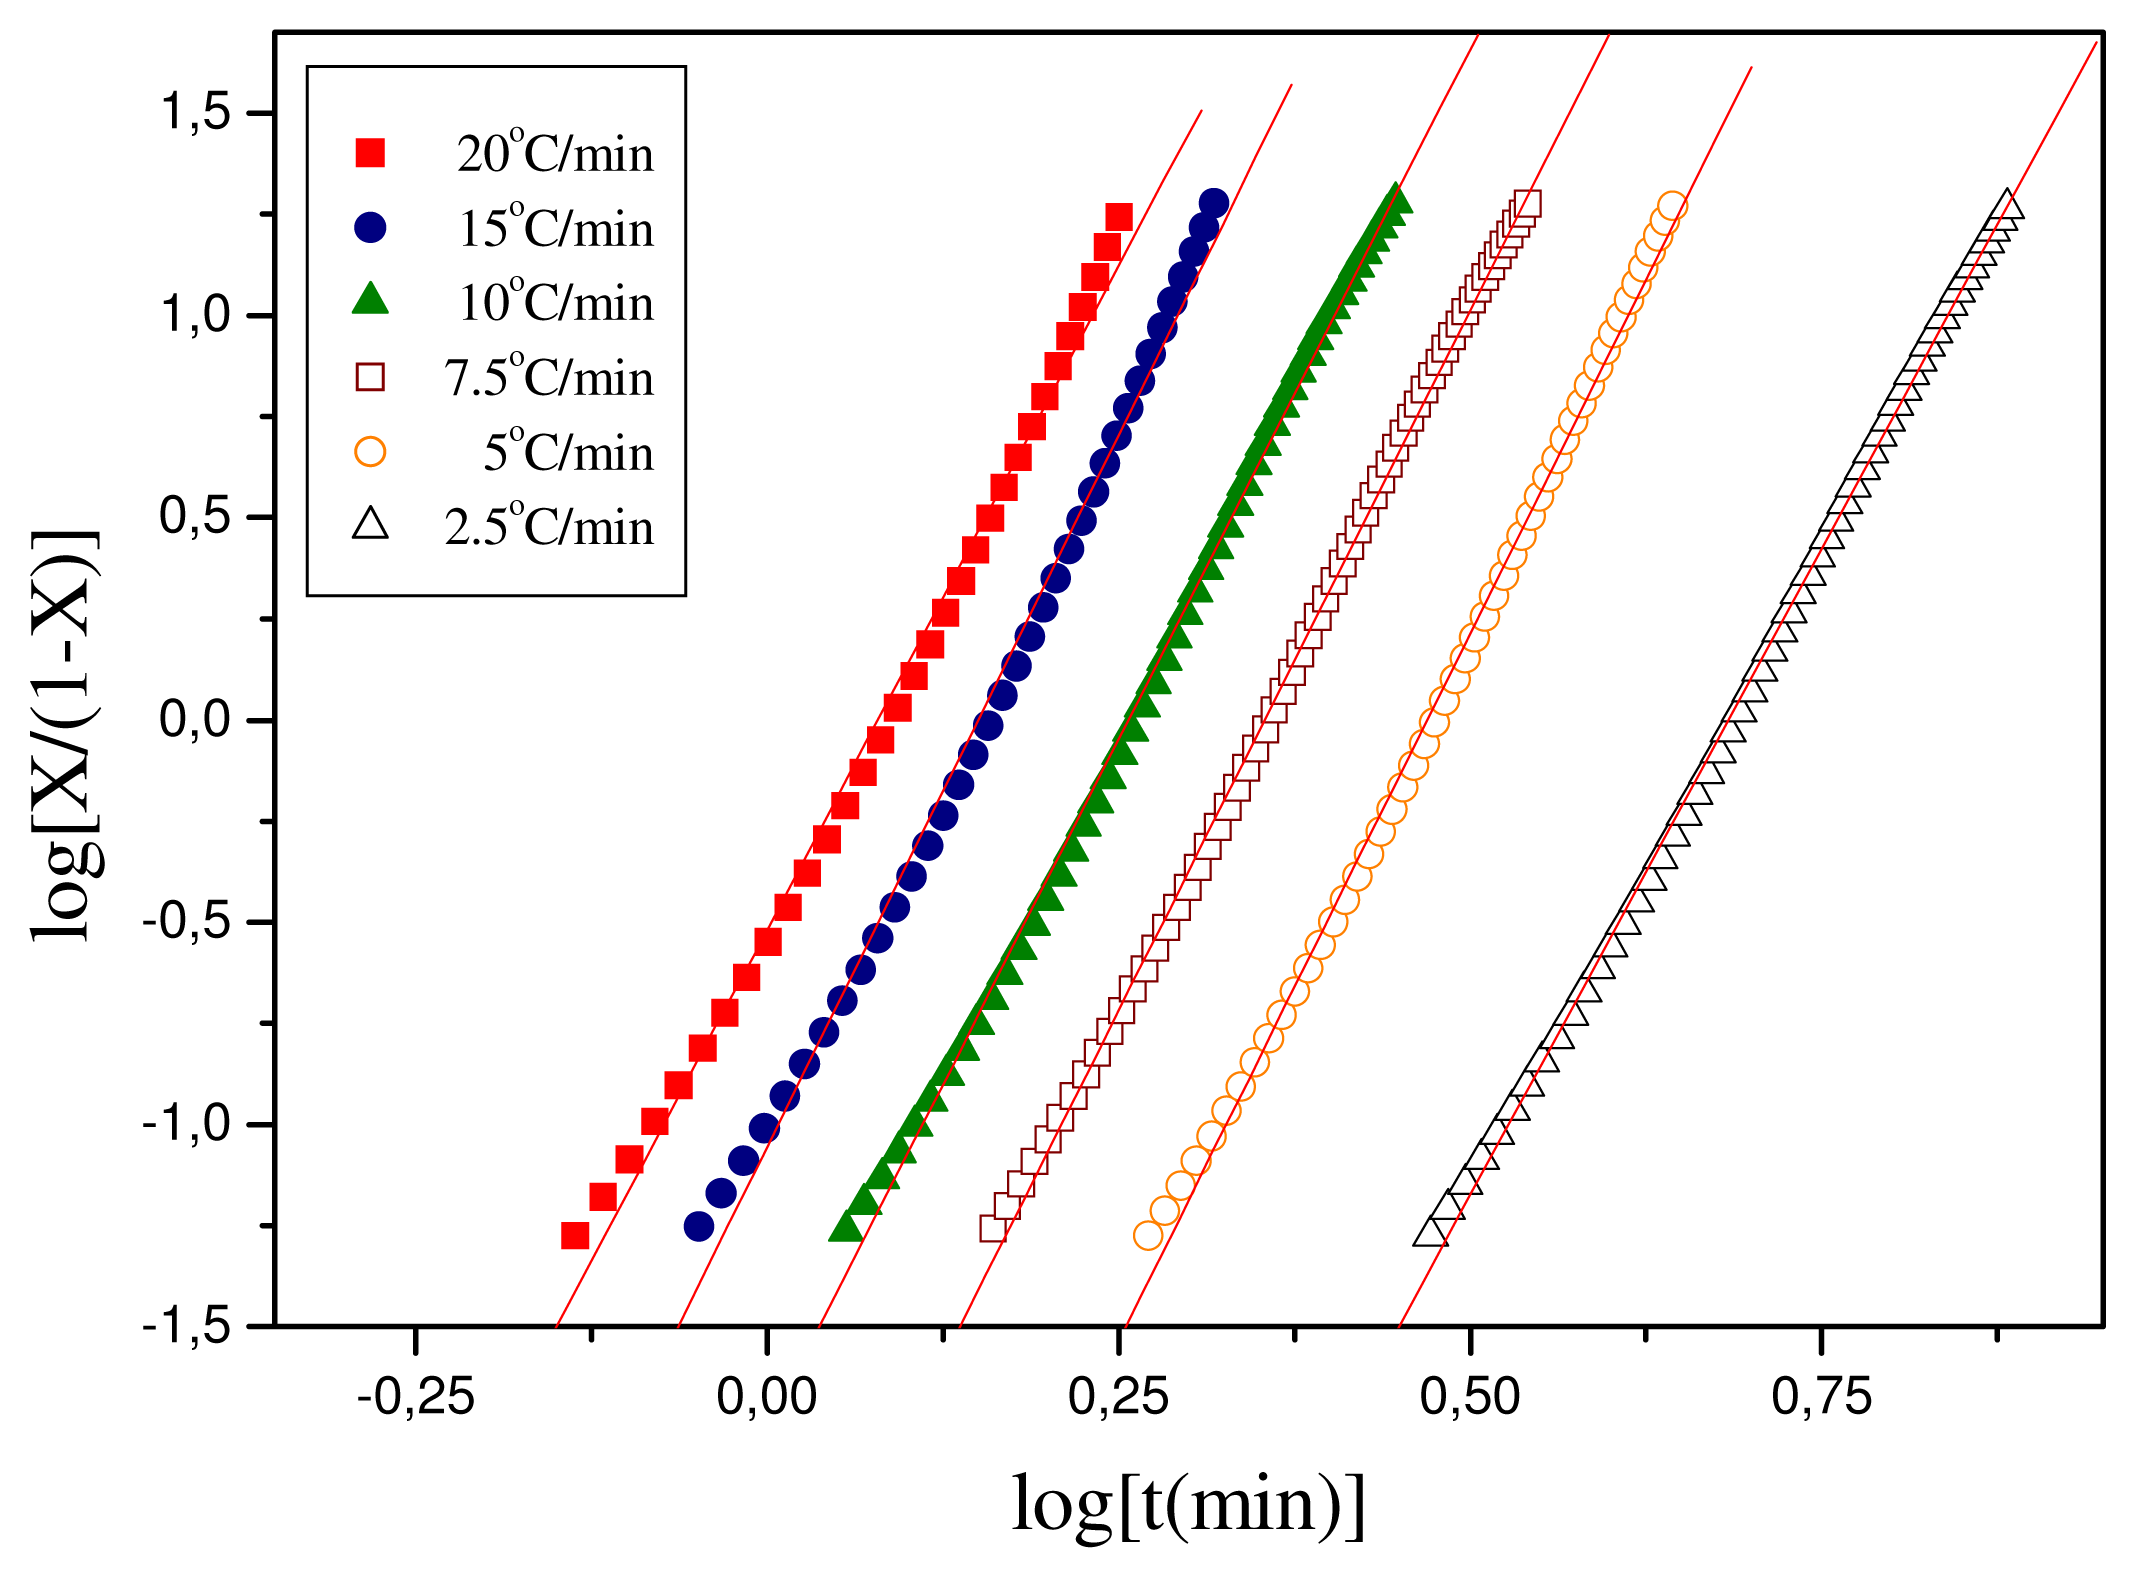
3.2. Crystallization Studies
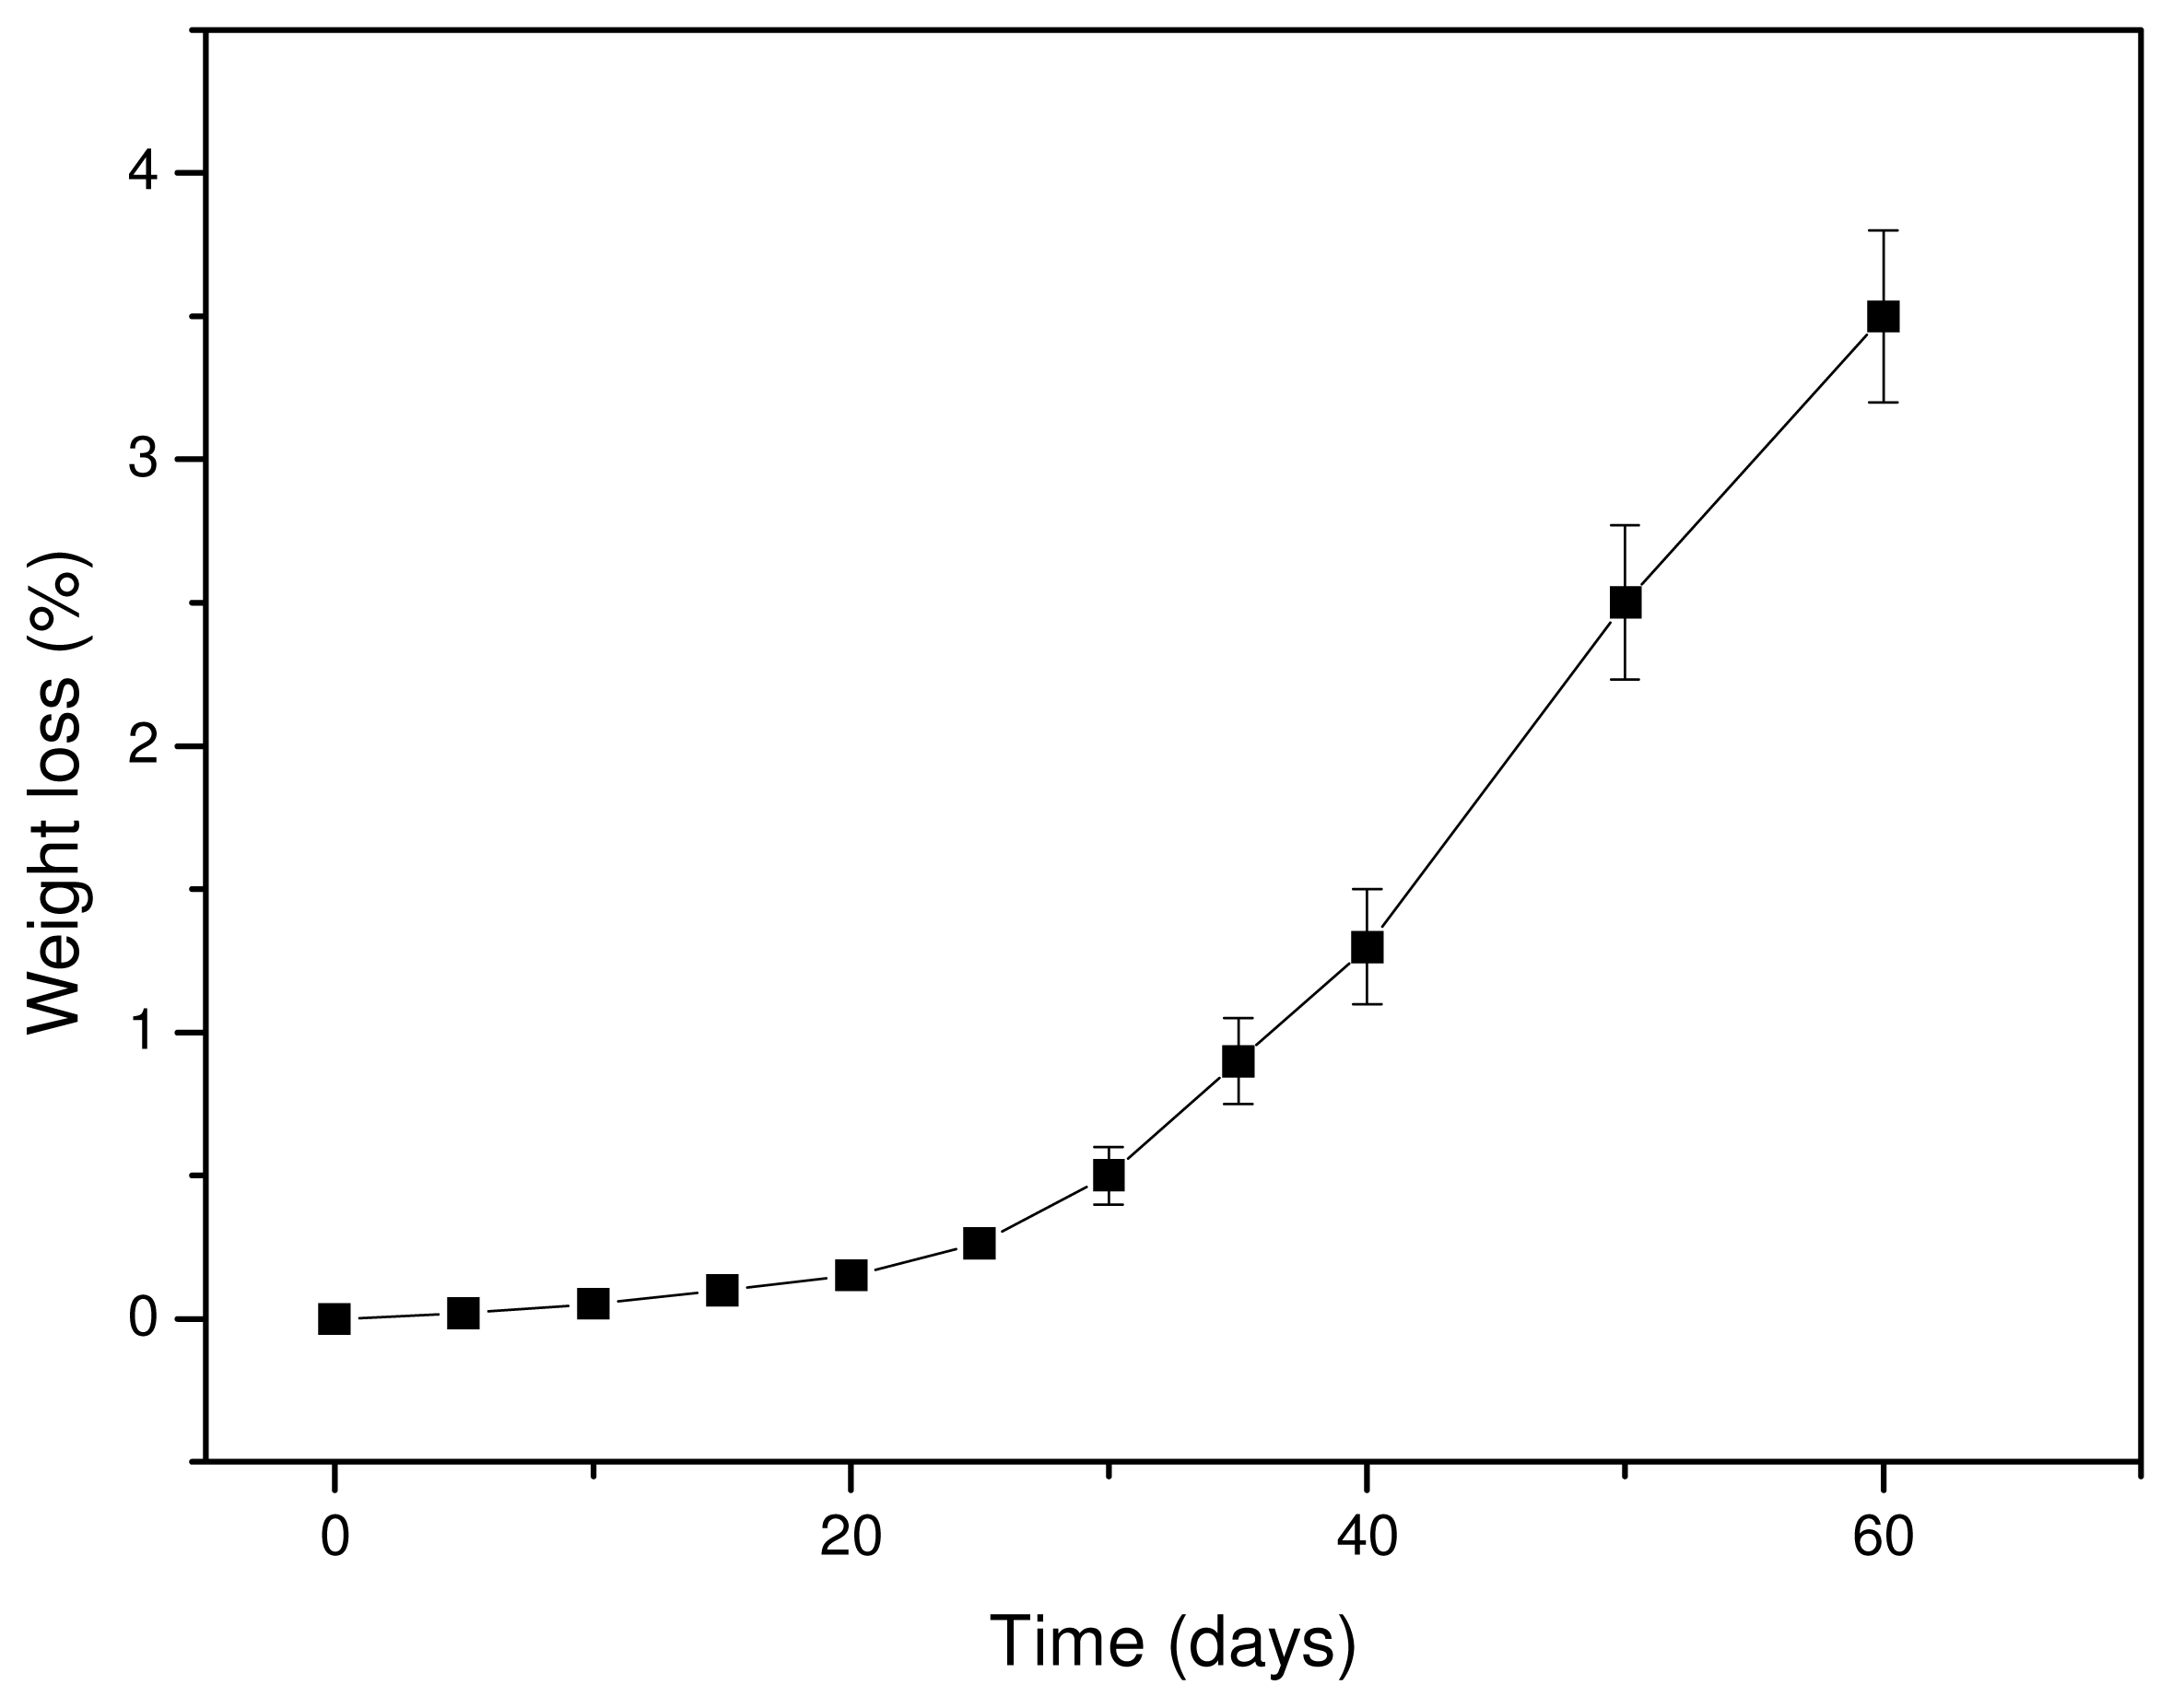
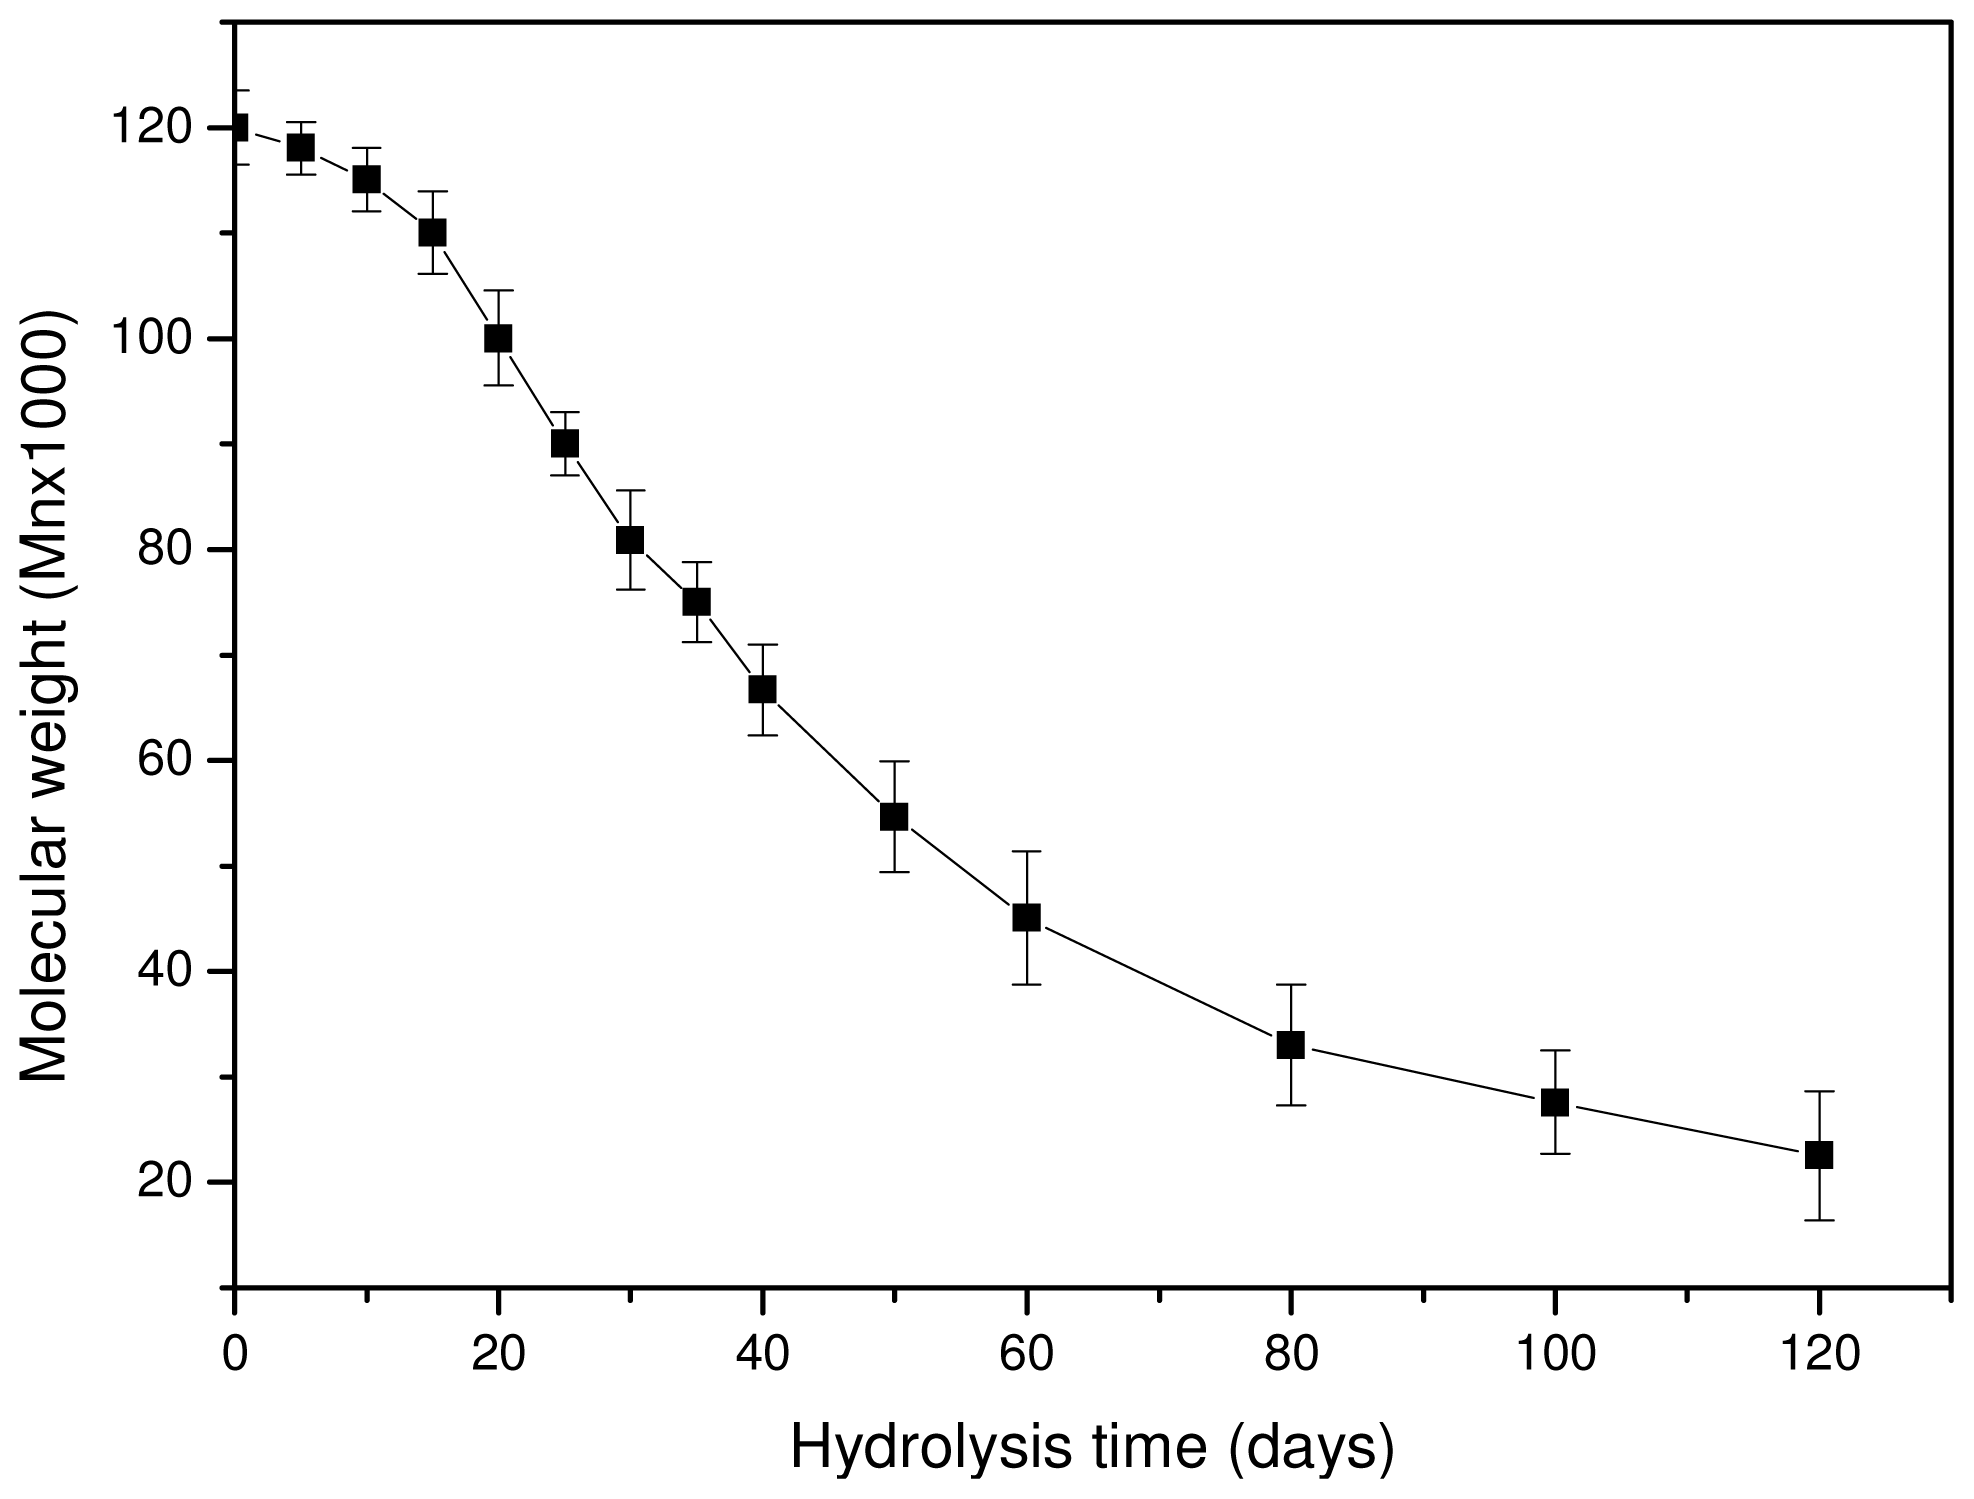
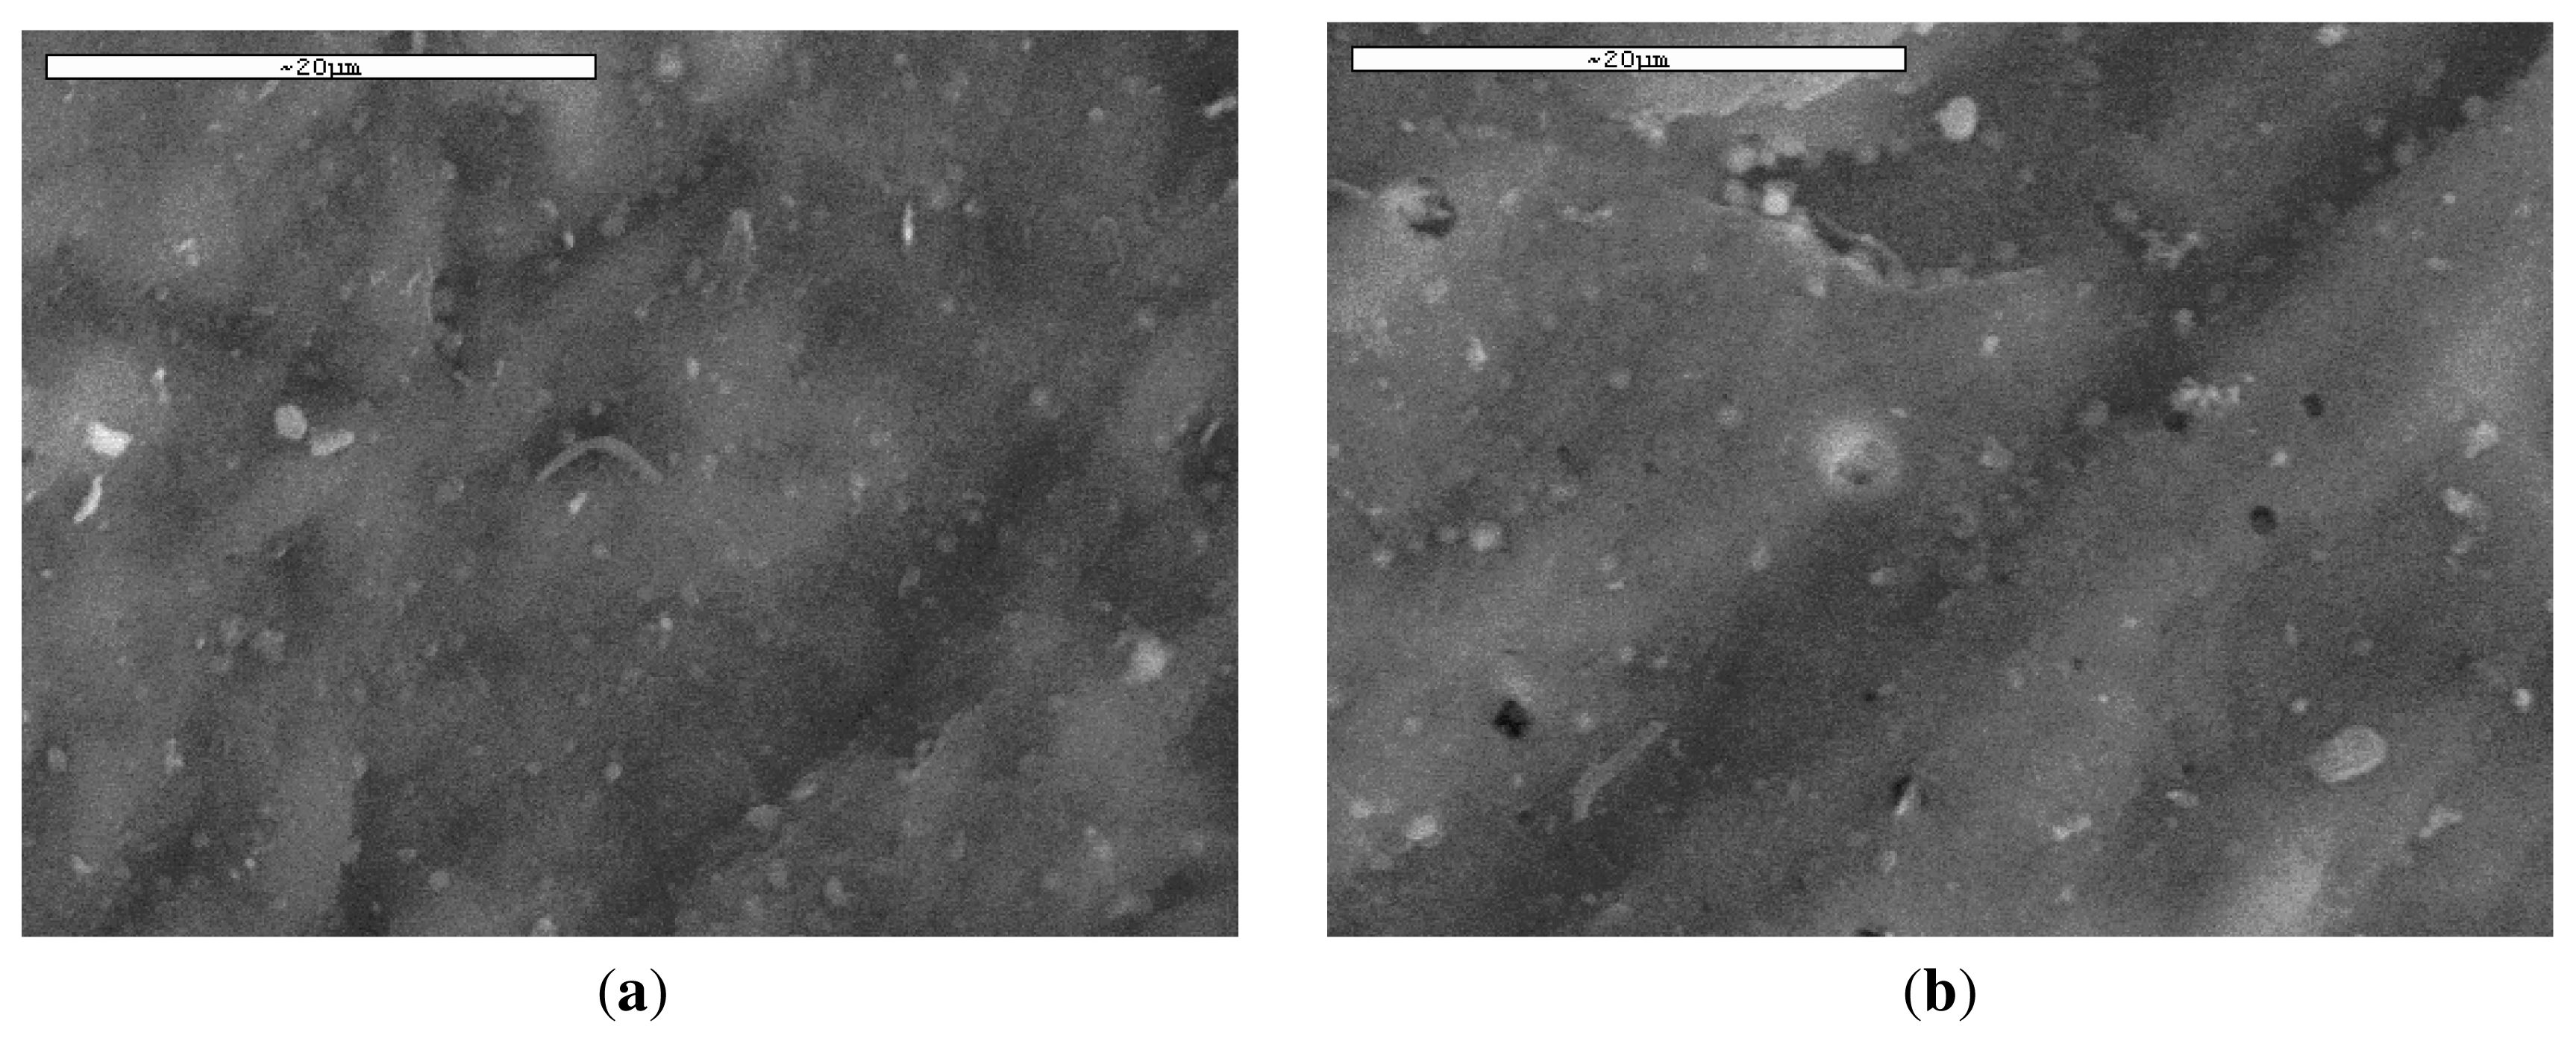
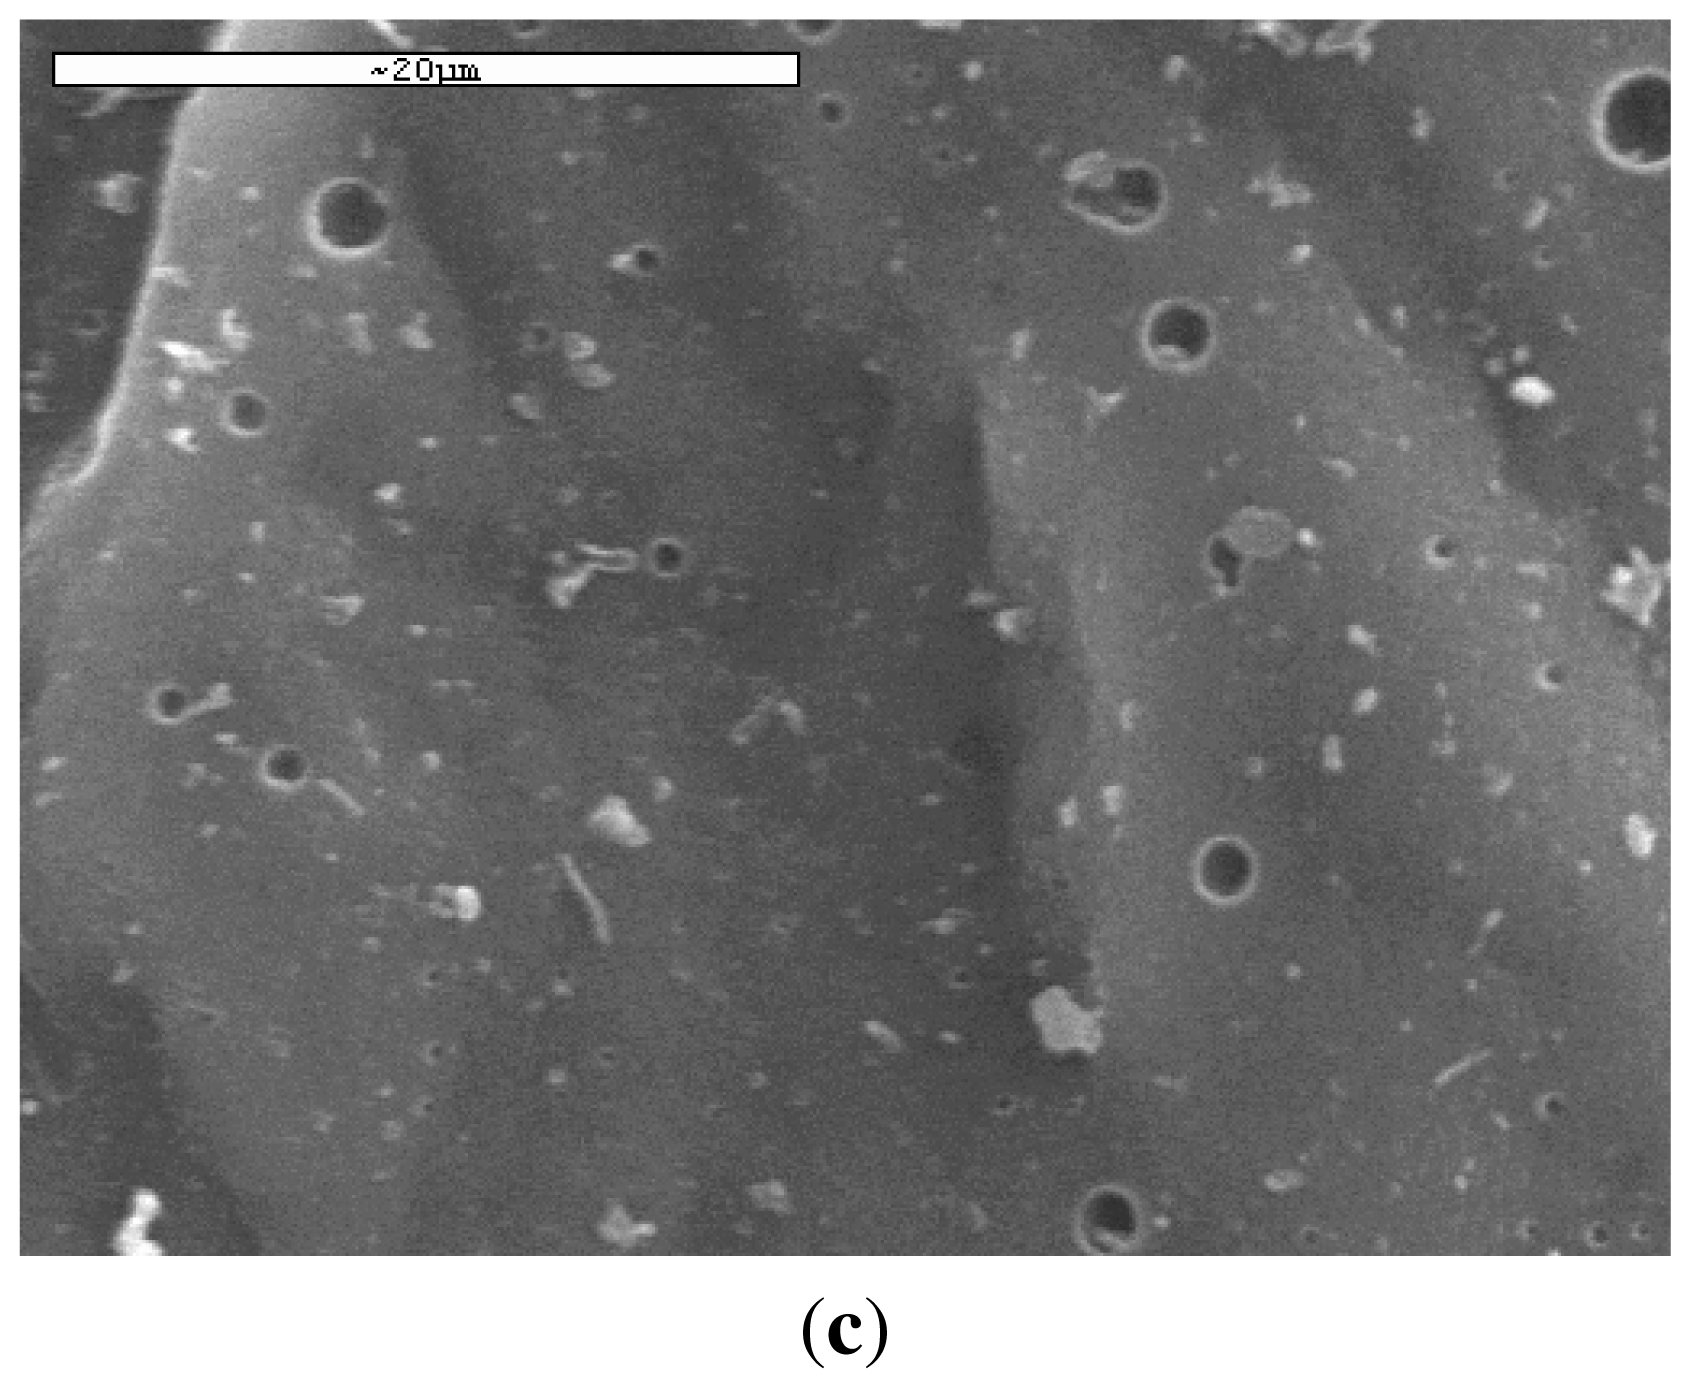
3.3. In Vitro Hydrolysis
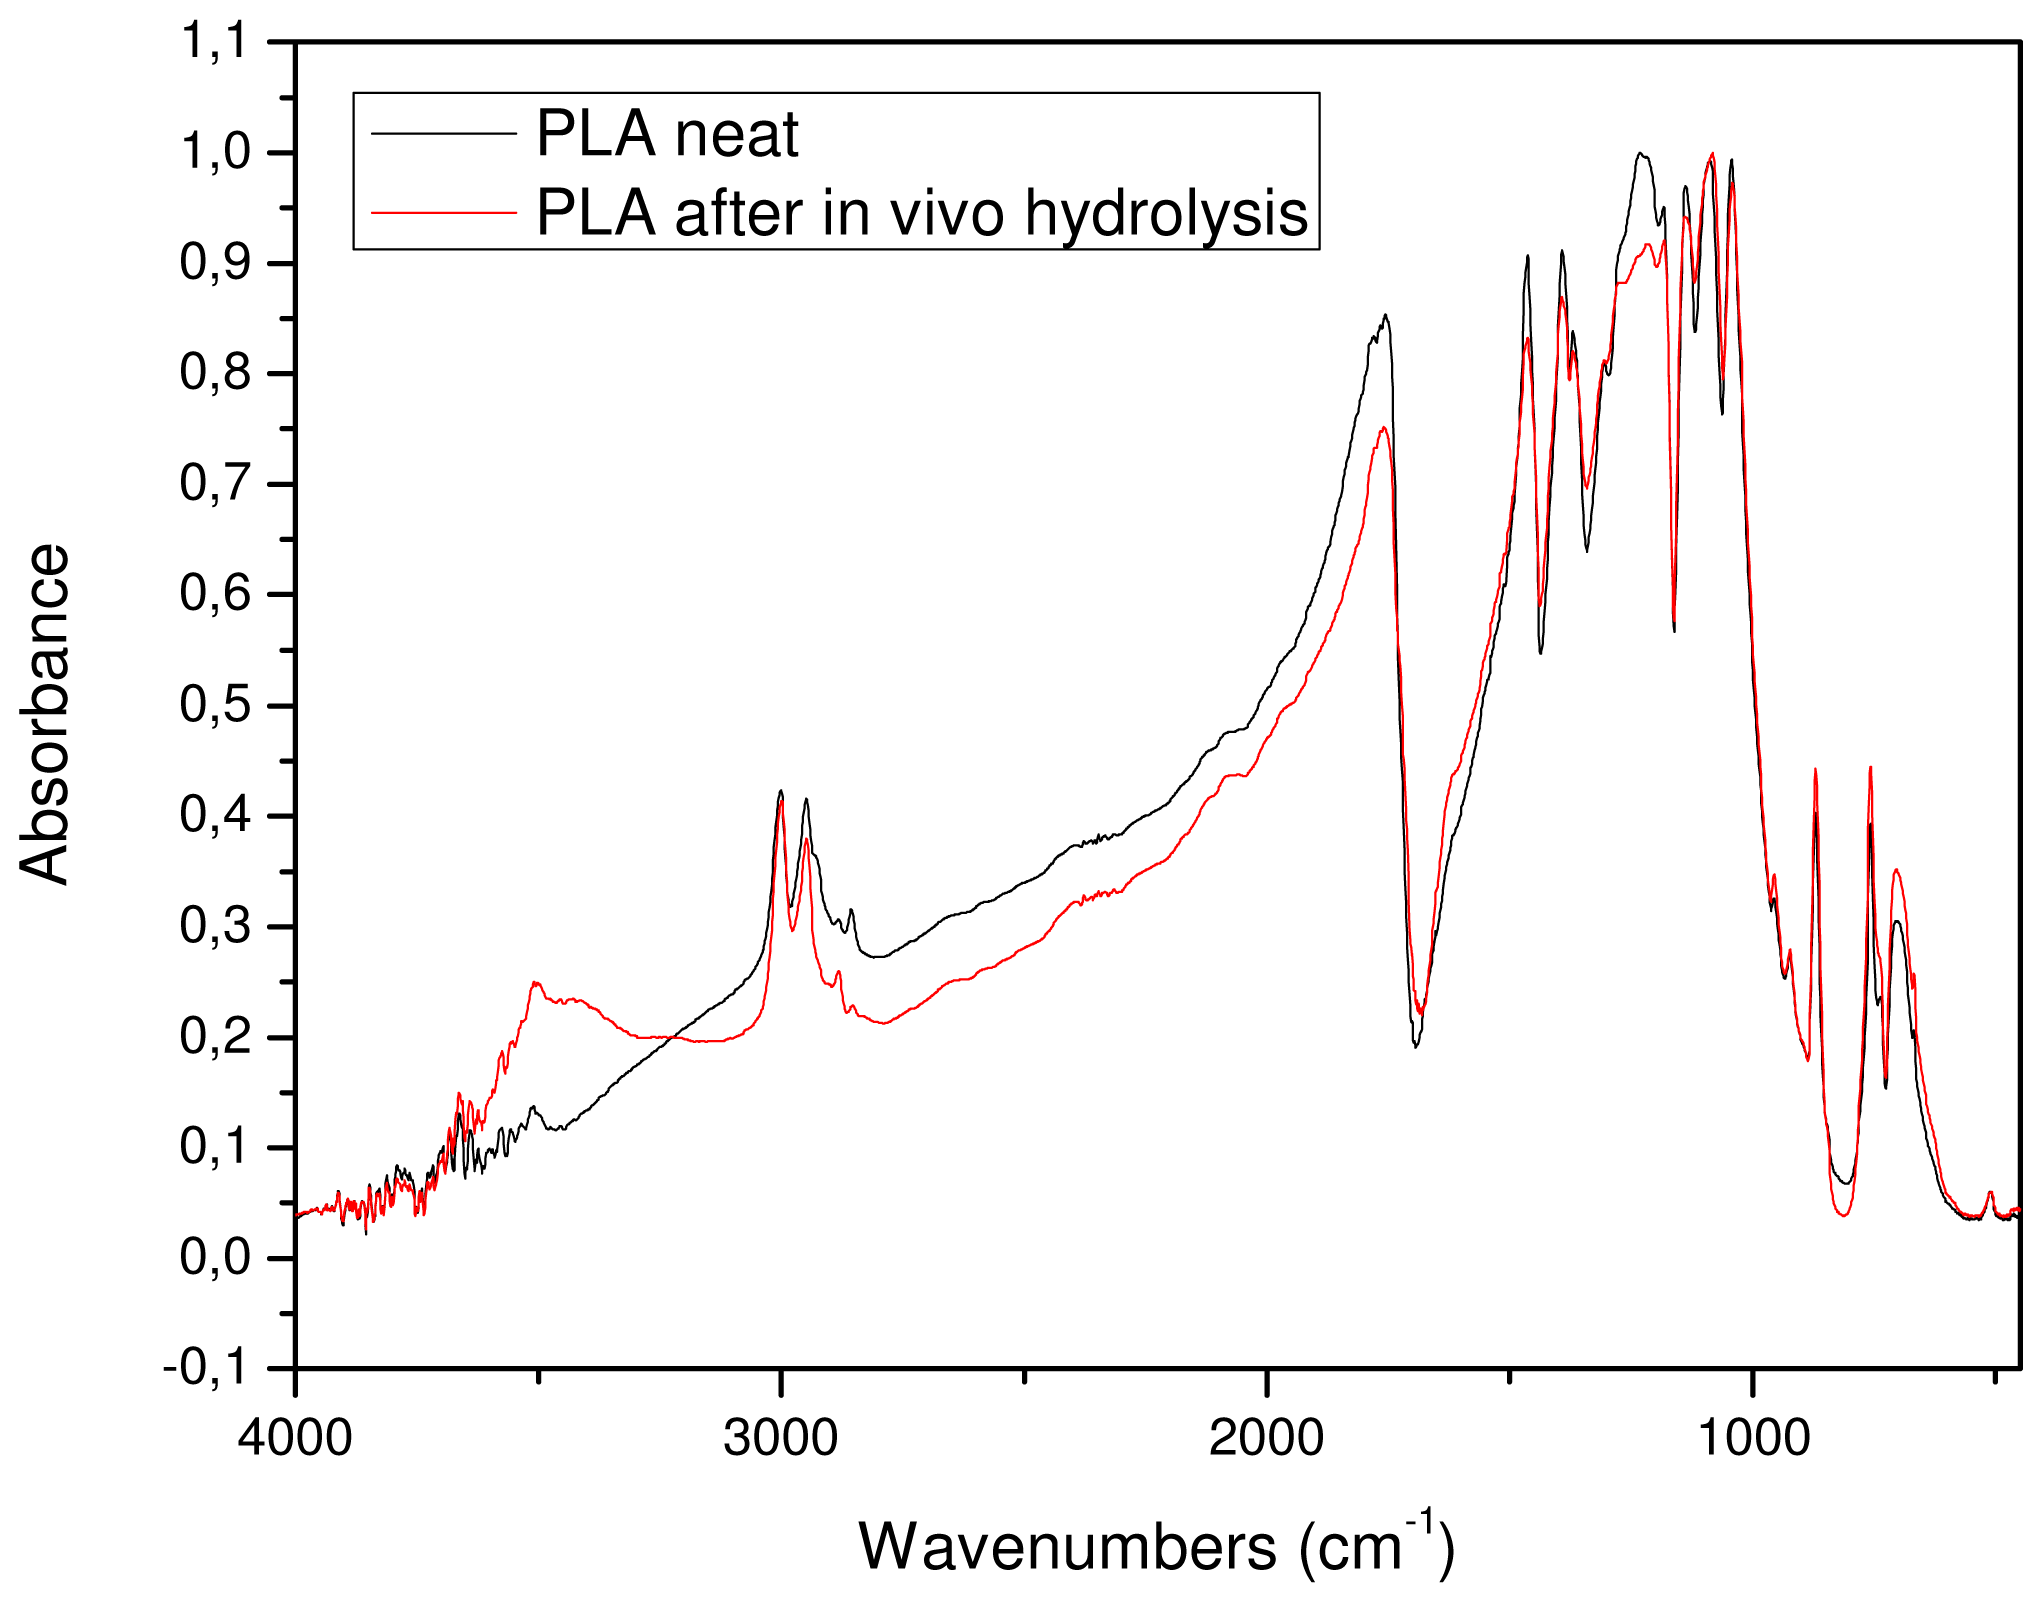
3.4. In Vivo Hydrolysis
4. Conclusions
References
- Proikakis, CS; Mamouzelos, NJ; Tarantili, PA; Andreopoulos, AG. Swelling and hydrolytic degradation of poly(d,l-lactic acid) in aqueous solutions. Polym. Degrad. Stab 2006, 91, 614–619. [Google Scholar]
- Albertsson, A-C; Varma, IK. Recent developments in ring opening polymerization of lactones for biomedical applications. Biomacromolecules 2003, 4, 1466–1486. [Google Scholar]
- Södegrad, A; Stolt, M. Properties of lactic acid based polymers and their correlation with composition. Prog. Polym. Sci 2002, 27, 1123–1163. [Google Scholar]
- Schwach, G; Vert, M. In vitro and in vivo degradation of lactic acid-based interference screws used in cruciate ligament reconstruction. Int. J. Biol. Macrom 1999, 25, 283–291. [Google Scholar]
- Schmack, G; Tandler, B; Vogel, R; Beyreuther, R; Jacobsen, S; Fritz, HG. Biodegradable fibers of poly(l-lactide) produced by high-speed melt spinning and spin drawing. J. Appl. Polym. Sci 1999, 73, 2785–2797. [Google Scholar]
- Satyanarayana, D; Chatterji, PR. Biodegradable polymers: Challenges and strategies. J. Macrom. Sci. Rev. Macromol. Chem. Phys 1993, C33, 349–368. [Google Scholar]
- Griffith, GL. Polymeric biomaterials. Acta Mater 2000, 48, 263–277. [Google Scholar]
- Hutmacher, DW. Scaffolds in tissue engineering bone and cartilage. Biomaterials 2000, 21, 2529–2543. [Google Scholar]
- Hunt, JA; Callaghan, ZJT. Polymer-hydroxyapatite composite versus polymer interference screws in anterior cruciate ligament reconstruction in a large animal model. Knee Surg. Sports Traumatol. Arthrosc 2008, 16, 655–660. [Google Scholar]
- Acocella, F; Brizzola, S; Valtolina, C; Scanziani, E; Marchesi, F; Mantero, S; Garreau, H; Vert, M. Prefabricated tracheal prosthesis with partial biodegradable materials: A surgical and tissue engineering evaluation in vivo. J. Biomater. Sci. Polym. Ed 2007, 18, 579–594. [Google Scholar]
- Molina, I; Li, S; Martinez, MB; Vert, M. Protein release from physically crosslinked hydrogels of the PLA/PEO/PLA triblock copolymer-type. Biomaterials 2001, 22, 363–369. [Google Scholar]
- Athanasiou, KA; Niederauer, GG; Agrawal, CM. Sterilization, toxicity, biocompatibility and clinical applications of polylactic acid/polyglycolic acid copolymers. Biomaterials 1996, 17, 93–102. [Google Scholar]
- Amass, W; Amass, A; Tighe, B. A review of biodegradable polymers: Uses, current developments in the synthesis and characterization of biodegradable polyesters, blends of biodegradable polymers and recent advances in biodegradation studies. Polym. Int 1998, 47, 89–144. [Google Scholar]
- Kallela, I; Iizuka, T; Salo, A; Lindqvist, C. Lag-screw fixation of anterior mandibular fractures using biodegradable polylactide screws: A preliminary report. J. Oral Maxillofac. Surg 1999, 57, 113–118. [Google Scholar]
- Zhang, R; Ma, PX. Biomimetic polymer/apatite composite scaffolds for mineralized tissue engineering. Macromol. Biosci 2004, 4, 100–111. [Google Scholar]
- Kesenci, K; Fambri, L; Migliaresi, C; Piskin, E. Preparation and properties of poly(l-lactide)/hydroxyapatite composites. J. Biomater. Sci. Polym. Ed 2000, 11, 617–632. [Google Scholar]
- Viinikainen, A; Goransson, H; Huovinen, K; Kellomaki, M. Material and knot properties of braided polyester (Ticron®) and bioabsorbable poly-l/d-lactide (PLDLA) 96/4 sutures. J. Mater. Sci. Mater. Med 2006, 17, 169–177. [Google Scholar]
- Baimark, Y; Molloy, R; Molloy, N; Siripitayananon, J; Punyodom, W; Sriyai, M. Synthesis, characterization and melt spinning of a block copolymer of l-lactide and ɛ-caprolactone for potential use as an absorbable monofilament surgical suture. J. Mater. Sci. Mater. Med 2005, 16, 699–707. [Google Scholar]
- Boccaccini, AR; Blaker, JJ; Maquet, V; Day, RM; Jrme, R. Preparation and characterisation of poly(lactide-co-grycolide) (PLGA) and PLGA/Bioglass® composite tubular foam scaffolds for tissue engineering applications. Mater. Sci. Eng C 2005, 25, 23–31. [Google Scholar]
- Grizzi, I; Garreau, H; Li, S; Vert, M. Hydrolytic degradation of devices based on poly(dl-lactic acid) size dependence. Biomaterials 1995, 16, 305–311. [Google Scholar]
- Hakkarainen, M. Aliphatic polyesters: Abiotic and biotic degradation and degradation products. Adv. Polym. Sci 2002, 157, 113–138. [Google Scholar]
- Hakkarainen, M; Albertsson, A-C; Karlsson, S. Weight losses and molecular weight changes correlated with the evolution of hydroxyacids in simulated in vivo degradation of homo- and copolymers of PLA and PGA. Polym. Degrad. Stab 1996, 52, 283–291. [Google Scholar]
- Li, S; Garreau, H; Vert, M. Structure-property relationships in the case of the degradation of massive aliphatic poly-(α-hydroxy acids) in aqueous media—Part 1: Poly(dl-lactic acid). J. Mater. Sci. Mater. Med 1990, 1, 123–130. [Google Scholar]
- Antheunis, H; van der Meer, J-C; de Geus, M; Kingma, W; Koning, CE. Koning: Improved mathematical model for the hydrolytic degradation of aliphatic polyesters. Macromolecules 2009, 42, 2462–2471. [Google Scholar]
- Lyu, S; Schley, J; Loy, B; Lind, D; Hobot, C; Sparer, R; Untereker, D. Kinetics and time-temperature equivalence of polymer degradation. Biomacromolecules 2007, 8, 2301–2310. [Google Scholar]
- Therin, M; Christel, P; Li, S; Garreau, H; Vert, M. In vivo degradation of massive poly(α-hydroxy acids): Validation of in vitro findings. Biomaterials 1992, 13, 594–600. [Google Scholar]
- Qu, XH; Wu, Q; Zhang, KY; Chen, GQ. In vivo studies of poly(3-hydroxybutyrate-co-3- hydroxyhexanoate) based polymers: Biodegradation and tissue reactions. Biomaterials 2006, 27, 3540–3548. [Google Scholar]
- Solomon, OF; Ciuta, IZ. Determination de la viscosite intrinseque de solutions de polymeres par une simple determination de la viscosite. J. Appl. Polym. Sci 1962, 6, 683–686. [Google Scholar]
- Engelberg, I; Kohn, J. Physico-mechanical properties of degradable polymers used in medical applications: A comparative study. Biomaterials 1991, 12, 292–304. [Google Scholar]
- Eling, B; Gogolewski, S; Pennings, AJ. Biodegradable materials of poly(l-lactic acid): 1. Melt-spun and solution spun fibres. Polymer 1982, 23, 1587–1593. [Google Scholar]
- Papageorgiou, GZ; Beslikas, T; Gigis, J; Christoforides, J; Bikiaris, DN. Crystallization and enzymatic hydrolysis of PLA grade for orthopedics. Adv. Polym. Techn 2010, 29, 280–299. [Google Scholar]
- Di Lorenzo, ML; Silvestre, C. Non-isothermal crystallization of polymers. Prog. Polym. Sci 1999, 24, 917–950. [Google Scholar]
- Jeziorny, A. Parameters characterizing the kinetics of the non-isothermal crystallization of poly(ethylene terephthalate) determined by d.s.c. Polymer 1978, 19, 1142–1144. [Google Scholar]
- Ozawa, T. Kinetics of non-isothermal crystallization. Polymer 1971, 12, 150–158. [Google Scholar]
- Liu, T; Mo, Z; Wang, S; Zhang, H. Nonisothermal melt and cold crystallization kinetics of poly(aryl ether ether ketone ketone). Polym. Eng. Sci 1997, 37, 568–575. [Google Scholar]
- Tobin, MC. Theory of phase transition kinetics with growth site impingement. I. Homogeneous nucleation. J. Polym. Sci. Part B Polym. Phys 1974, 12, 399–406. [Google Scholar]
- Tobin, MC. The theory of phase transition kinetics with growth site impingement. II. Heterogeneous nucleation. J. Polym. Sci. Part B Polym. Phys 1976, 14, 2253–2257. [Google Scholar]
- Tobin, MC. Theory of phase transition kinetics with growth site impingement. III. Mixed heterogeneous–homogeneous nucleation and nonintegral exponents of the time. J. Polym. Sci. Part B Polym. Phys 1977, 15, 2269–2270. [Google Scholar]
- Fukuzaki, H; Yoshida, M; Asano, M; Kumakura, M. In vivo characteristics of high molecular weight copoly(l-lactide/glycolide) with S-type degradation pattern for application in drug delivery systems. Biomaterials 1991, 12, 433–437. [Google Scholar]
- Bucholz, B. Accelerated degradation test on resorbable polymers. In Degradation Phenomena on Polymeric Biomaterials; Plank, H, Dauner, M, Renardy, M, Eds.; Springer Verlag: New York, NY, USA, 1992; pp. 67–76. [Google Scholar]
- Höglund, A; Hakkarainen, M; Albertsson, AC. Migration and hydrolysis of hydrophobic polylactide plasticizer. Biomacromolecules 2010, 11, 277–283. [Google Scholar]
- Shih, C. Chain-end scission in acid catalyzed hydrolysis of poly(d, Lactide) in solution. J. Control. Release 1995, 34, 9–15. [Google Scholar]
- Höglund, A; Hakkarainen, M; Edlund, U; Albertsson, AC. Surface modification changes the degradation process and degradation product pattern of polylactide. Langmuir 2010, 26, 378–383. [Google Scholar]
- Dånmark, S; Finne-Wistrand, A; Schander, K; Hakkarainen, M; Arvidson, K; Mustafa, K; Albertsson, A-C. In vitro and in vivo degradation profile of aliphatic polyesters subjected to electron beam sterilization. Acta Biomater 2011. In Press. [Google Scholar]
- Migliaresi, CD; Cohn, D; De Lollis, A; Fambri, L. Dynamic mechanical and calorimetric analysis of compression-molded PLLA of different molecular weights. Effect of thermal treatments. J. Appl. Polym. Sci 1991, 43, 83–89. [Google Scholar]
- Pitt, CG; Gratzl, MM; Kimmel, GL; Surles, J; Schindler, A. Aliphatic polyesters II: The degradation of poly(dl-lactide), poly(E-caprolactone), and their copolymers in vivo. Biomaterials 1981, 2, 215–220. [Google Scholar]


| X (%) | b | ln F(T) |
|---|---|---|
| 20 | 1.508 | 2.954 |
| 40 | 1.491 | 3.164 |
| 60 | 1.488 | 3.333 |
| 80 | 1.473 | 3.516 |
| Heating Rate (°C/min) | KT | nT |
|---|---|---|
| 20 | 0.30409 | 6.65 |
| 15 | 0.0881 | 7.04 |
| 7.5 | 0.0177 | 6.82 |
| 10 | 0.00356 | 6.92 |
| 7.5 | 5.19996 × 10⁻⁴ | 6.99 |
| 2.5 | 4.21697 × 10⁻⁵ | 6.4 |
| Sample | Tm1 (°C) | Tm2 (°C) | Tg * (°C) | Tcc * (°C) | ΔHm(J/g) | Xc(%) |
|---|---|---|---|---|---|---|
| PLA | 172.5 | 178.5 | 61.5 | 116.4 | 52.5 | 56.45 |
| PLA 20 days | 173.4 | 179.2 | 62.2 | 113.0 | 55.3 | 59.46 |
| PLA 40 days | 174.3 | 180.5 | 62.1 | 111.6 | 59.6 | 64.08 |
| PLA 60 days | 172.2 | 178.8 | 61.1 | 106.4 | 61.2 | 65.80 |
| PLA 120 days | 172.0 | 178.2 | 61.0 | 102.5 | 60.7 | 65.26 |
© 2011 by the authors; licensee MDPI, Basel, Switzerland. This article is an open-access article distributed under the terms and conditions of the Creative Commons Attribution license (http://creativecommons.org/licenses/by/3.0/).
Share and Cite
Beslikas, T.; Gigis, I.; Goulios, V.; Christoforides, J.; Papageorgiou, G.Z.; Bikiaris, D.N. Crystallization Study and Comparative in Vitro–in Vivo Hydrolysis of PLA Reinforcement Ligament. Int. J. Mol. Sci. 2011, 12, 6597-6618. https://doi.org/10.3390/ijms12106597
Beslikas T, Gigis I, Goulios V, Christoforides J, Papageorgiou GZ, Bikiaris DN. Crystallization Study and Comparative in Vitro–in Vivo Hydrolysis of PLA Reinforcement Ligament. International Journal of Molecular Sciences. 2011; 12(10):6597-6618. https://doi.org/10.3390/ijms12106597
Chicago/Turabian StyleBeslikas, Theodore, Ioannis Gigis, Vasilios Goulios, John Christoforides, George Z. Papageorgiou, and Dimitrios N. Bikiaris. 2011. "Crystallization Study and Comparative in Vitro–in Vivo Hydrolysis of PLA Reinforcement Ligament" International Journal of Molecular Sciences 12, no. 10: 6597-6618. https://doi.org/10.3390/ijms12106597
APA StyleBeslikas, T., Gigis, I., Goulios, V., Christoforides, J., Papageorgiou, G. Z., & Bikiaris, D. N. (2011). Crystallization Study and Comparative in Vitro–in Vivo Hydrolysis of PLA Reinforcement Ligament. International Journal of Molecular Sciences, 12(10), 6597-6618. https://doi.org/10.3390/ijms12106597