1. Introduction
Honey has been around since 7000 BC in the Stone Age [
1]. It contains components such as organic acid, minerals and protein [
2]. Honey products are usually directly consumed, and some of its products are used in the food industry for such things as infant food and ice cream. They also play a role in pharmaceuticals such as in the flavor of medicines [
3]. The International Food Regulations have specified that pure honey must not contain any additives. However, additive sweeteners and water are widely used in honey. This adulteration is intended to increase volume and reduce cost, which is a major issue, since the contamination affects the nutritional value of honey. The color, concentration and viscosity of adulterated honey are quite similar to pure honey, making the adulterated honey even harder to detect by consumers. Consumers typically detect adulteration by sensory observations of the honey’s physical characteristics, which include color, viscosity and crystallization. The contamination can be detected by chemical analysis in the laboratory using methods such as chromatography, optical transmission analysis [
3] and mass spectrometry [
4]. These methods are complex processes. As such, the development of a fast, simple and low-cost method for honey adulteration detection is absolutely necessary.
Based on previous studies, many researchers have measured the complex relative permittivity and physical properties of materials associated with medical, constructional, industrial, or agricultural applications [
5,
6,
7]. In [
8], an open-ended coaxial probe is used to measure the complex relative permittivity of apples in a frequency range of 10–1800 MHz. The obtained relative permittivity can be used to determine properties such as moisture content and pH value of apples. A waveguide and coaxial transmission line technique are applied to measure the complex relative permittivity of eggs to predict the quality index of eggs [
9]. In addition, the dielectric properties of honeydew melons are measured in order to compare it to the quality of honeydew melons [
10]. There are also many other researchers interested in measuring the physical properties of food and agricultural materials [
11,
12,
13,
14,
15].
Water, a main component in agricultural products i.e., honey, is sensitive to applied microwave frequencies and therefore the complex relative permittivity is dominantly influenced by the water content. The complex relative permittivity of a substance in an aqueous solution depends on water content. A water molecule is dipolar, which can be polarized in the range of microwave frequencies, and produce a tetrahedral molecular structure [
4]. However, when other substances dissolve in water, the molecular structure of water changes, affecting polarization properties in the microwave frequency range, leading to a change in complex relative permittivity [
4]. Measurement of the complex relative permittivity of honey sample can be applied to determine water content in honey sample, which is an indicator of honey quality in food industries. Understanding of the complex relative permittivity of honey is necessary to develop a model and thus assess the quality of honey. Although the dielectric properties of some agricultural materials have been studied, not many studies of the agricultural materials investigate the electrical conductivity and the phase constant with different microwave frequencies in the agricultural materials. There is little knowledge of how water content affects the complex relative permittivity, the electrical conductivity, and the phase constant of honey at microwave frequencies.
The complex relative permittivity (
) of materials can be written as shown in Equation (1) [
5]:
where
is the real part of complex relative permittivity, and
is the imaginary part of complex relative permittivity. The
δ is the loss angle of the material. It is also written in the form of loss tangent as in Equation (2) [
5]:
which is the ratio of loss energy and stored energy in the material due to external electric fields [
6]. In addition, the electrical conductivity
can be calculated as in Equation (3) [
5]:
where
is the permittivity of free space and
is the electric frequency (Hz). The phase constant
can be determined as in Equation (4) [
5]:
where
is the speed of light.
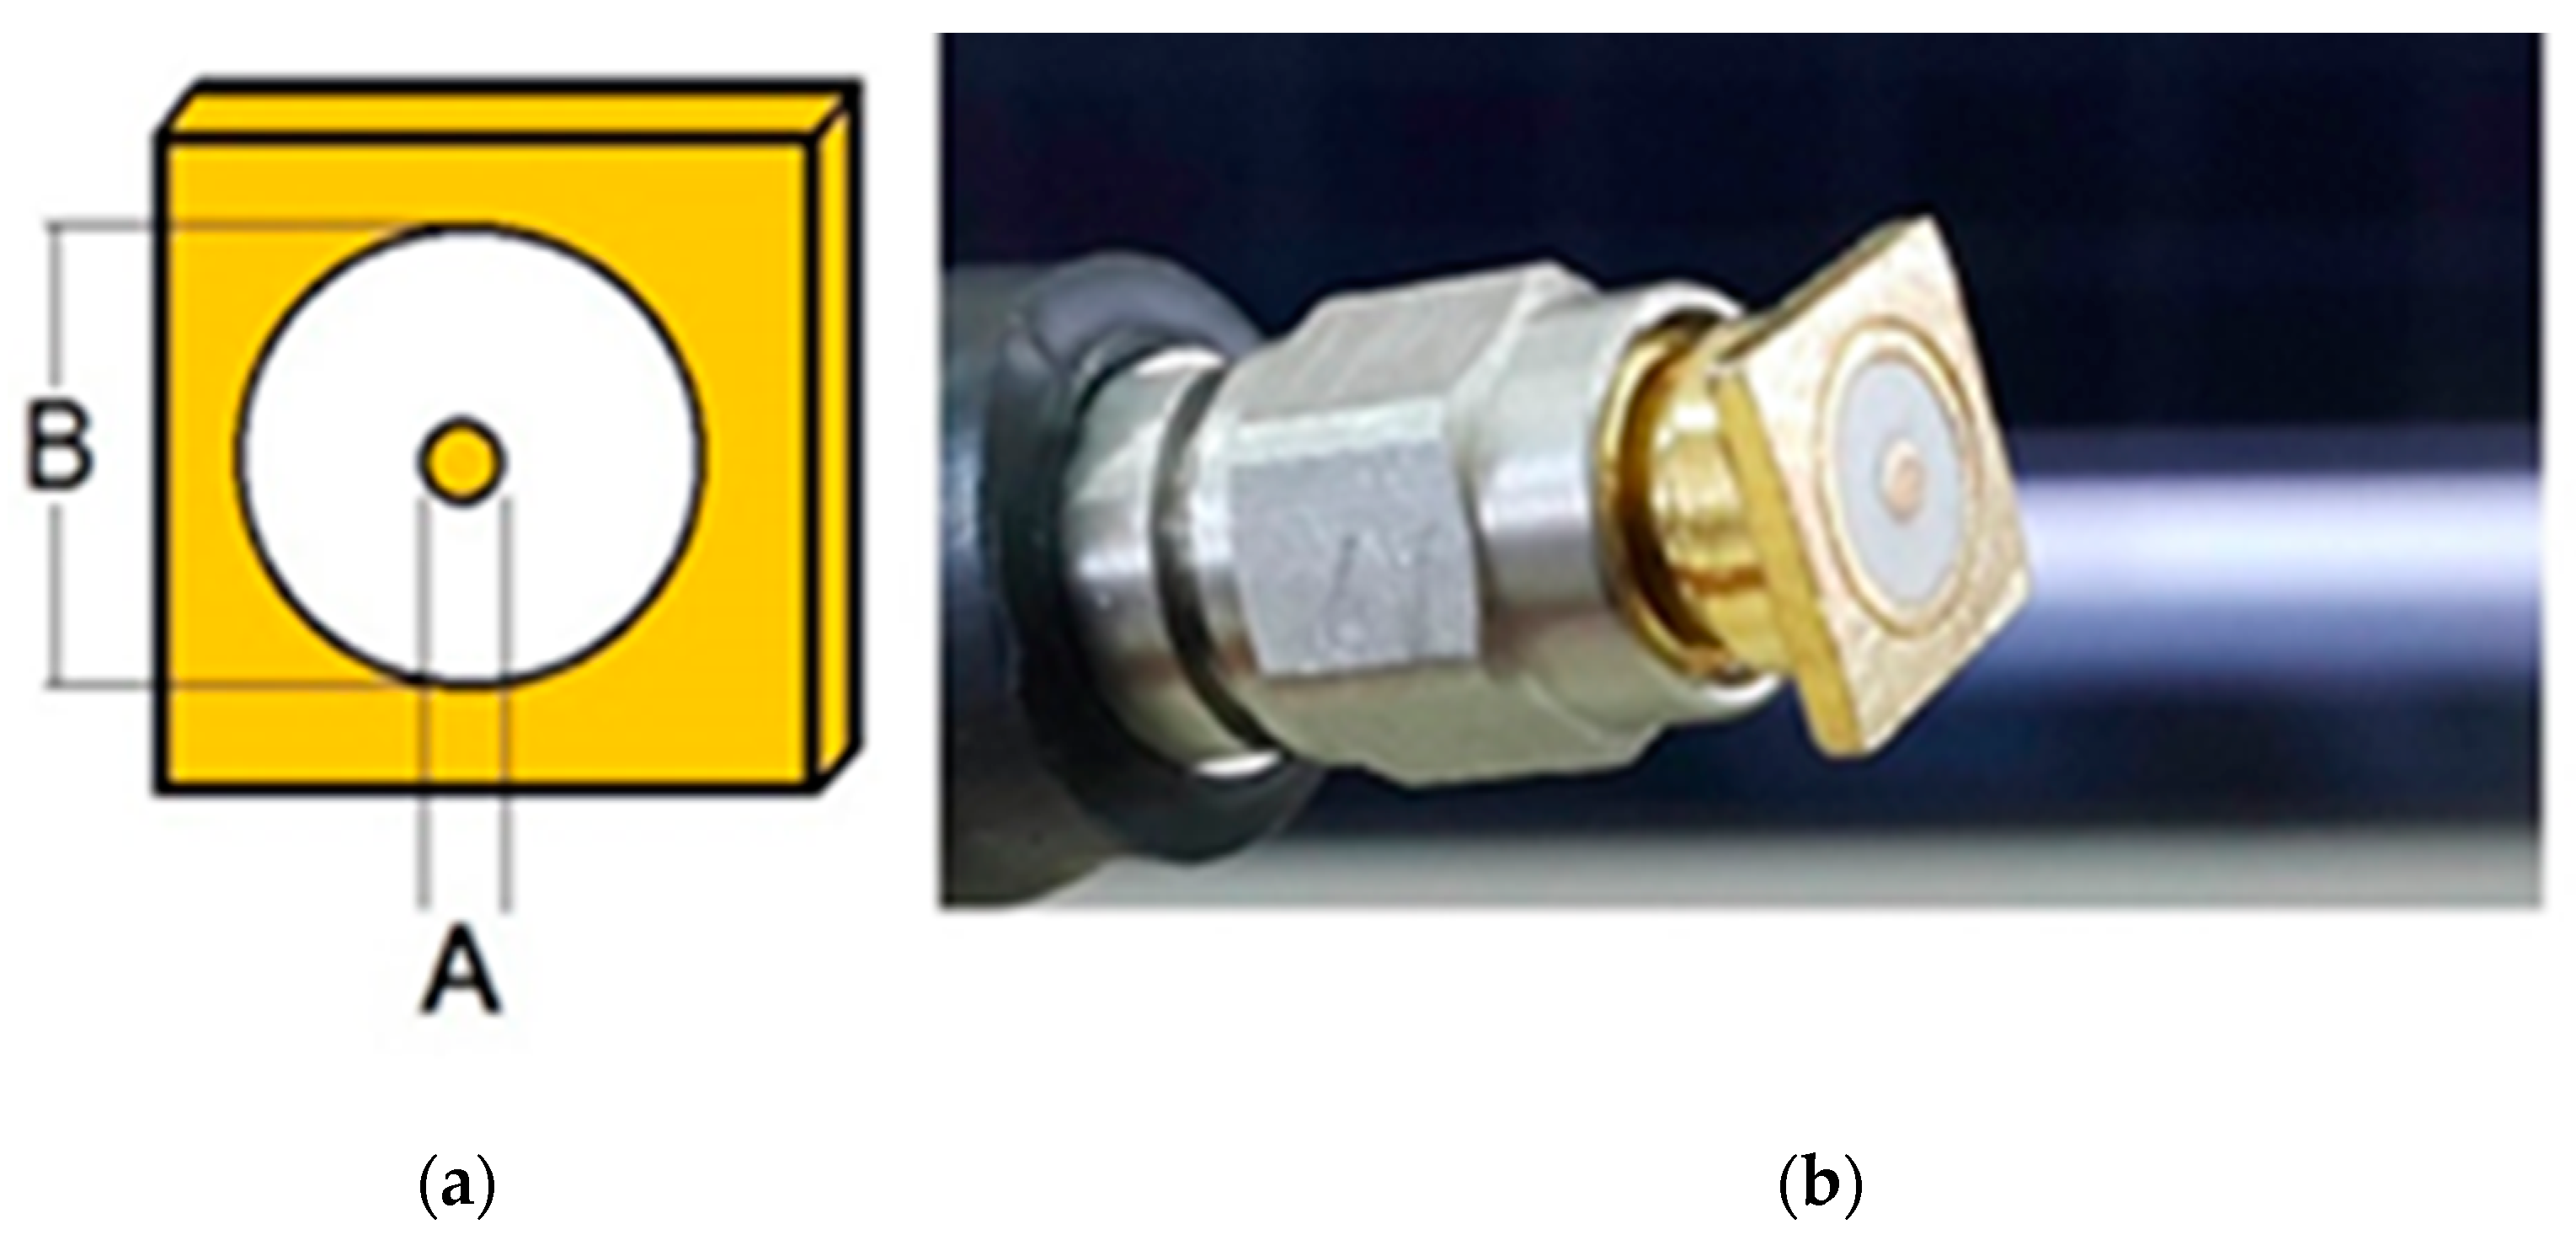
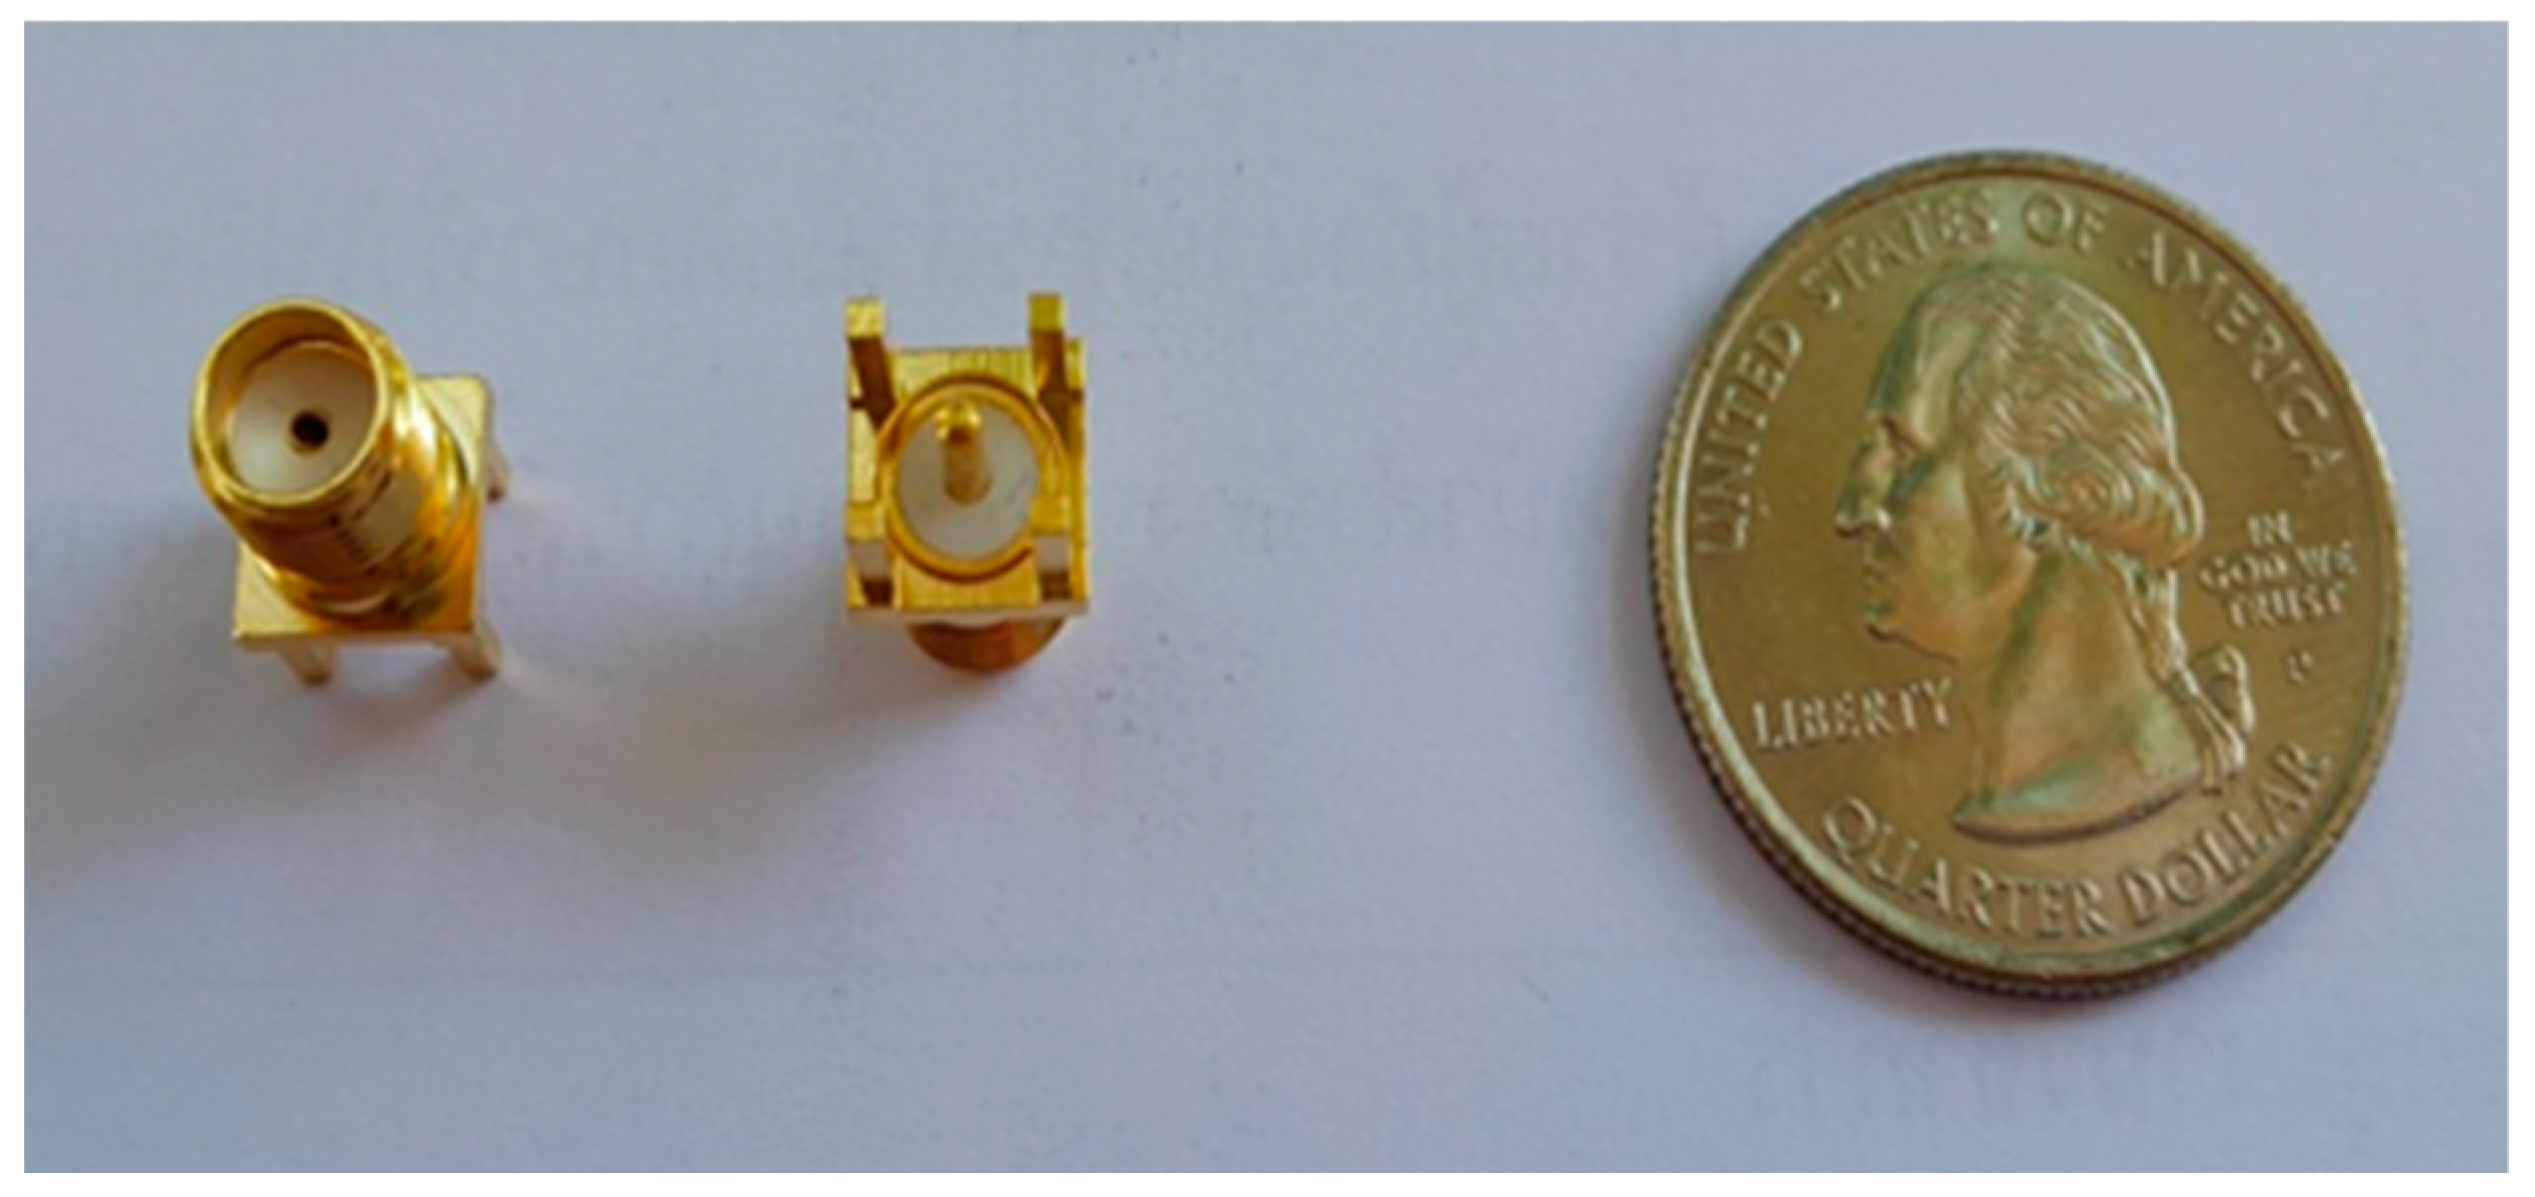
In this paper, the complex relative permittivity, the electrical conductivity, and the phase constant of honey are characterized at the constant temperature (25 °C) over the frequency range of 0.5–4.0 GHz with different water contents using the open-ended transmission line technique. The proposed sensor is newly designed from the modification of a SMA-connector. The benefits of this technique are its compact design, ease of design, ability to be used in a wide range of frequencies, simple measuring process and non-destructive test, relatively high measurement accuracy and low-cost, all of which make this technique suitable for measuring the complex relative permittivity, electrical conductivity, and phase constant of honey. The obtained values are useful in the analysis of the relationship between water adulteration in honey, complex relative permittivity, electrical conductivity, and phase constant of honey. Knowledge of the properties of honey is an important step in the development of microwave sensors to determine the quality of honey for agricultural and food industries.
Section 2 describes the materials and methods. In addition, it explains the experimental setup and the validation of the proposed sensor.
Section 3 demonstrates the experimental results and discussions. Finally, the conclusions are presented in
Section 4.
3. Results and Discussions
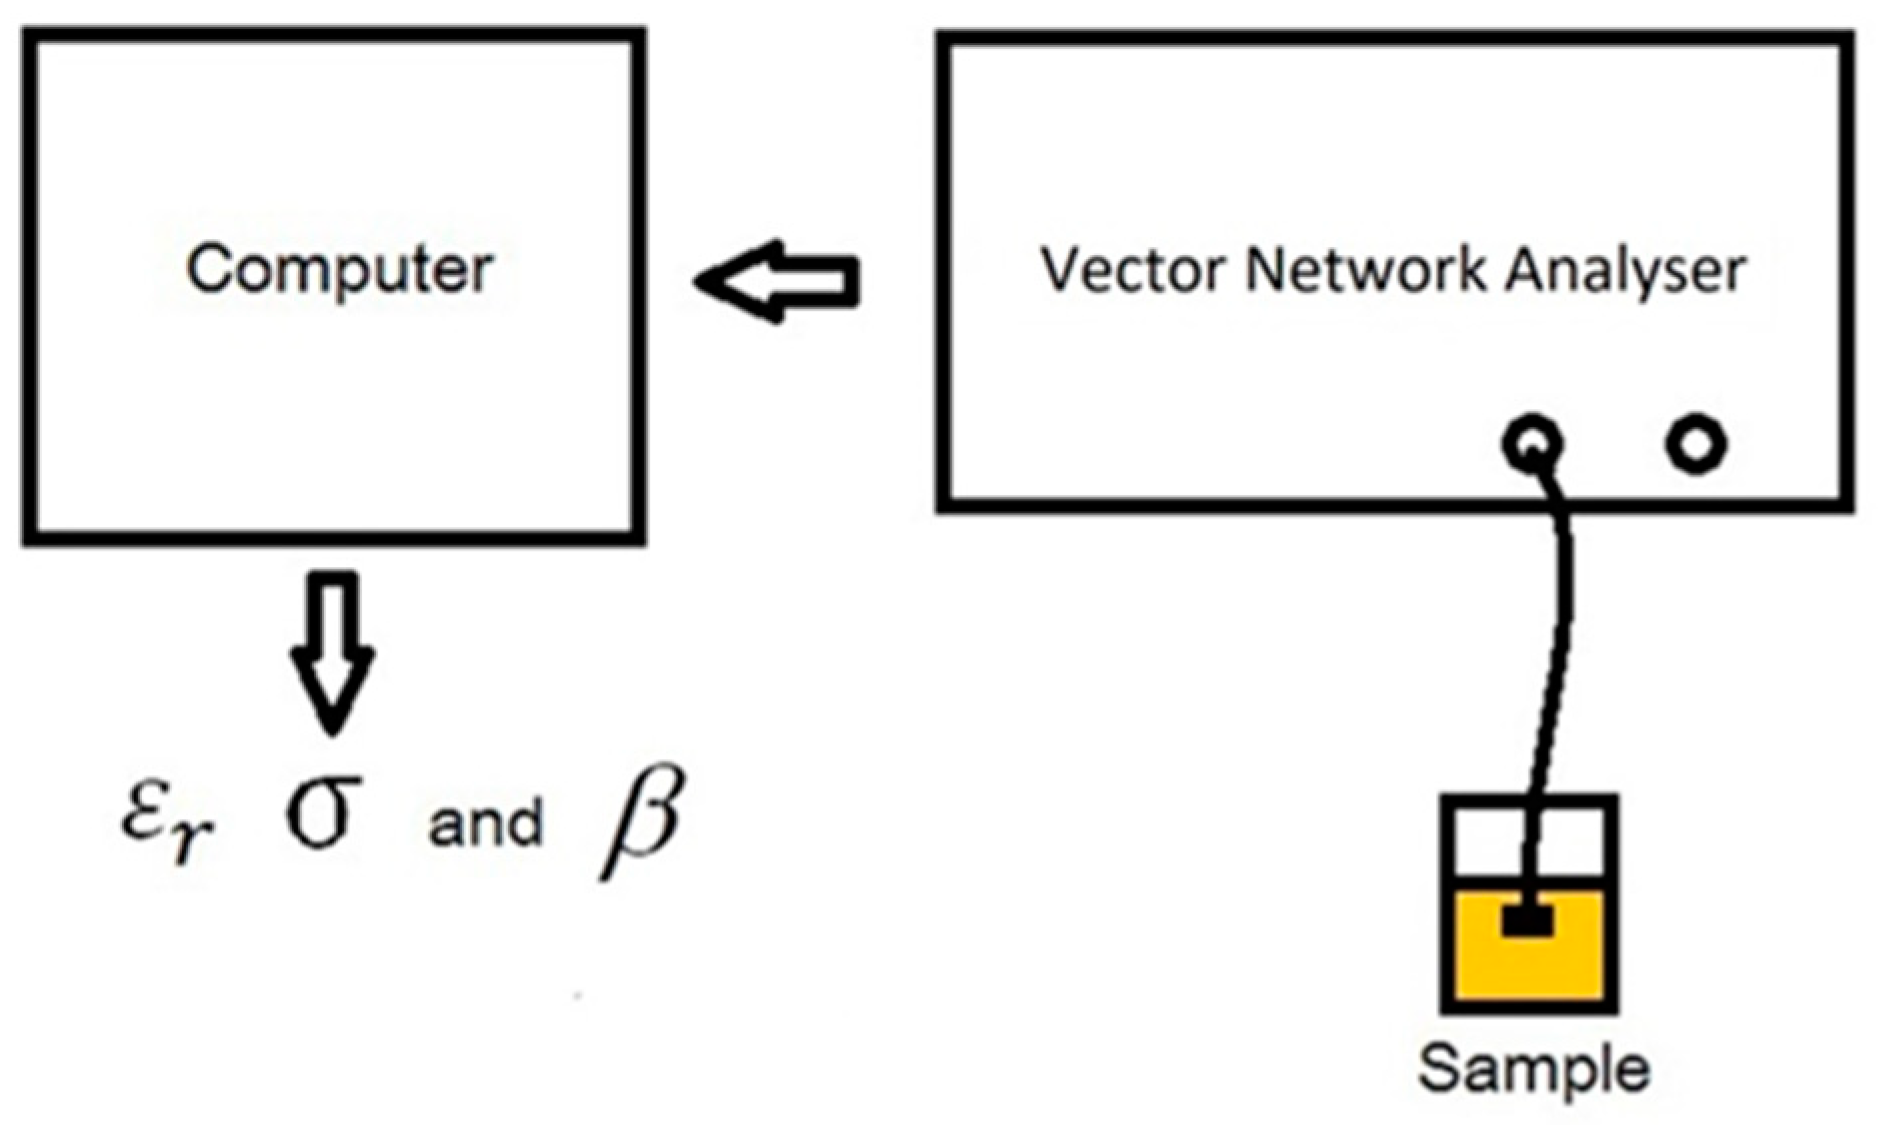
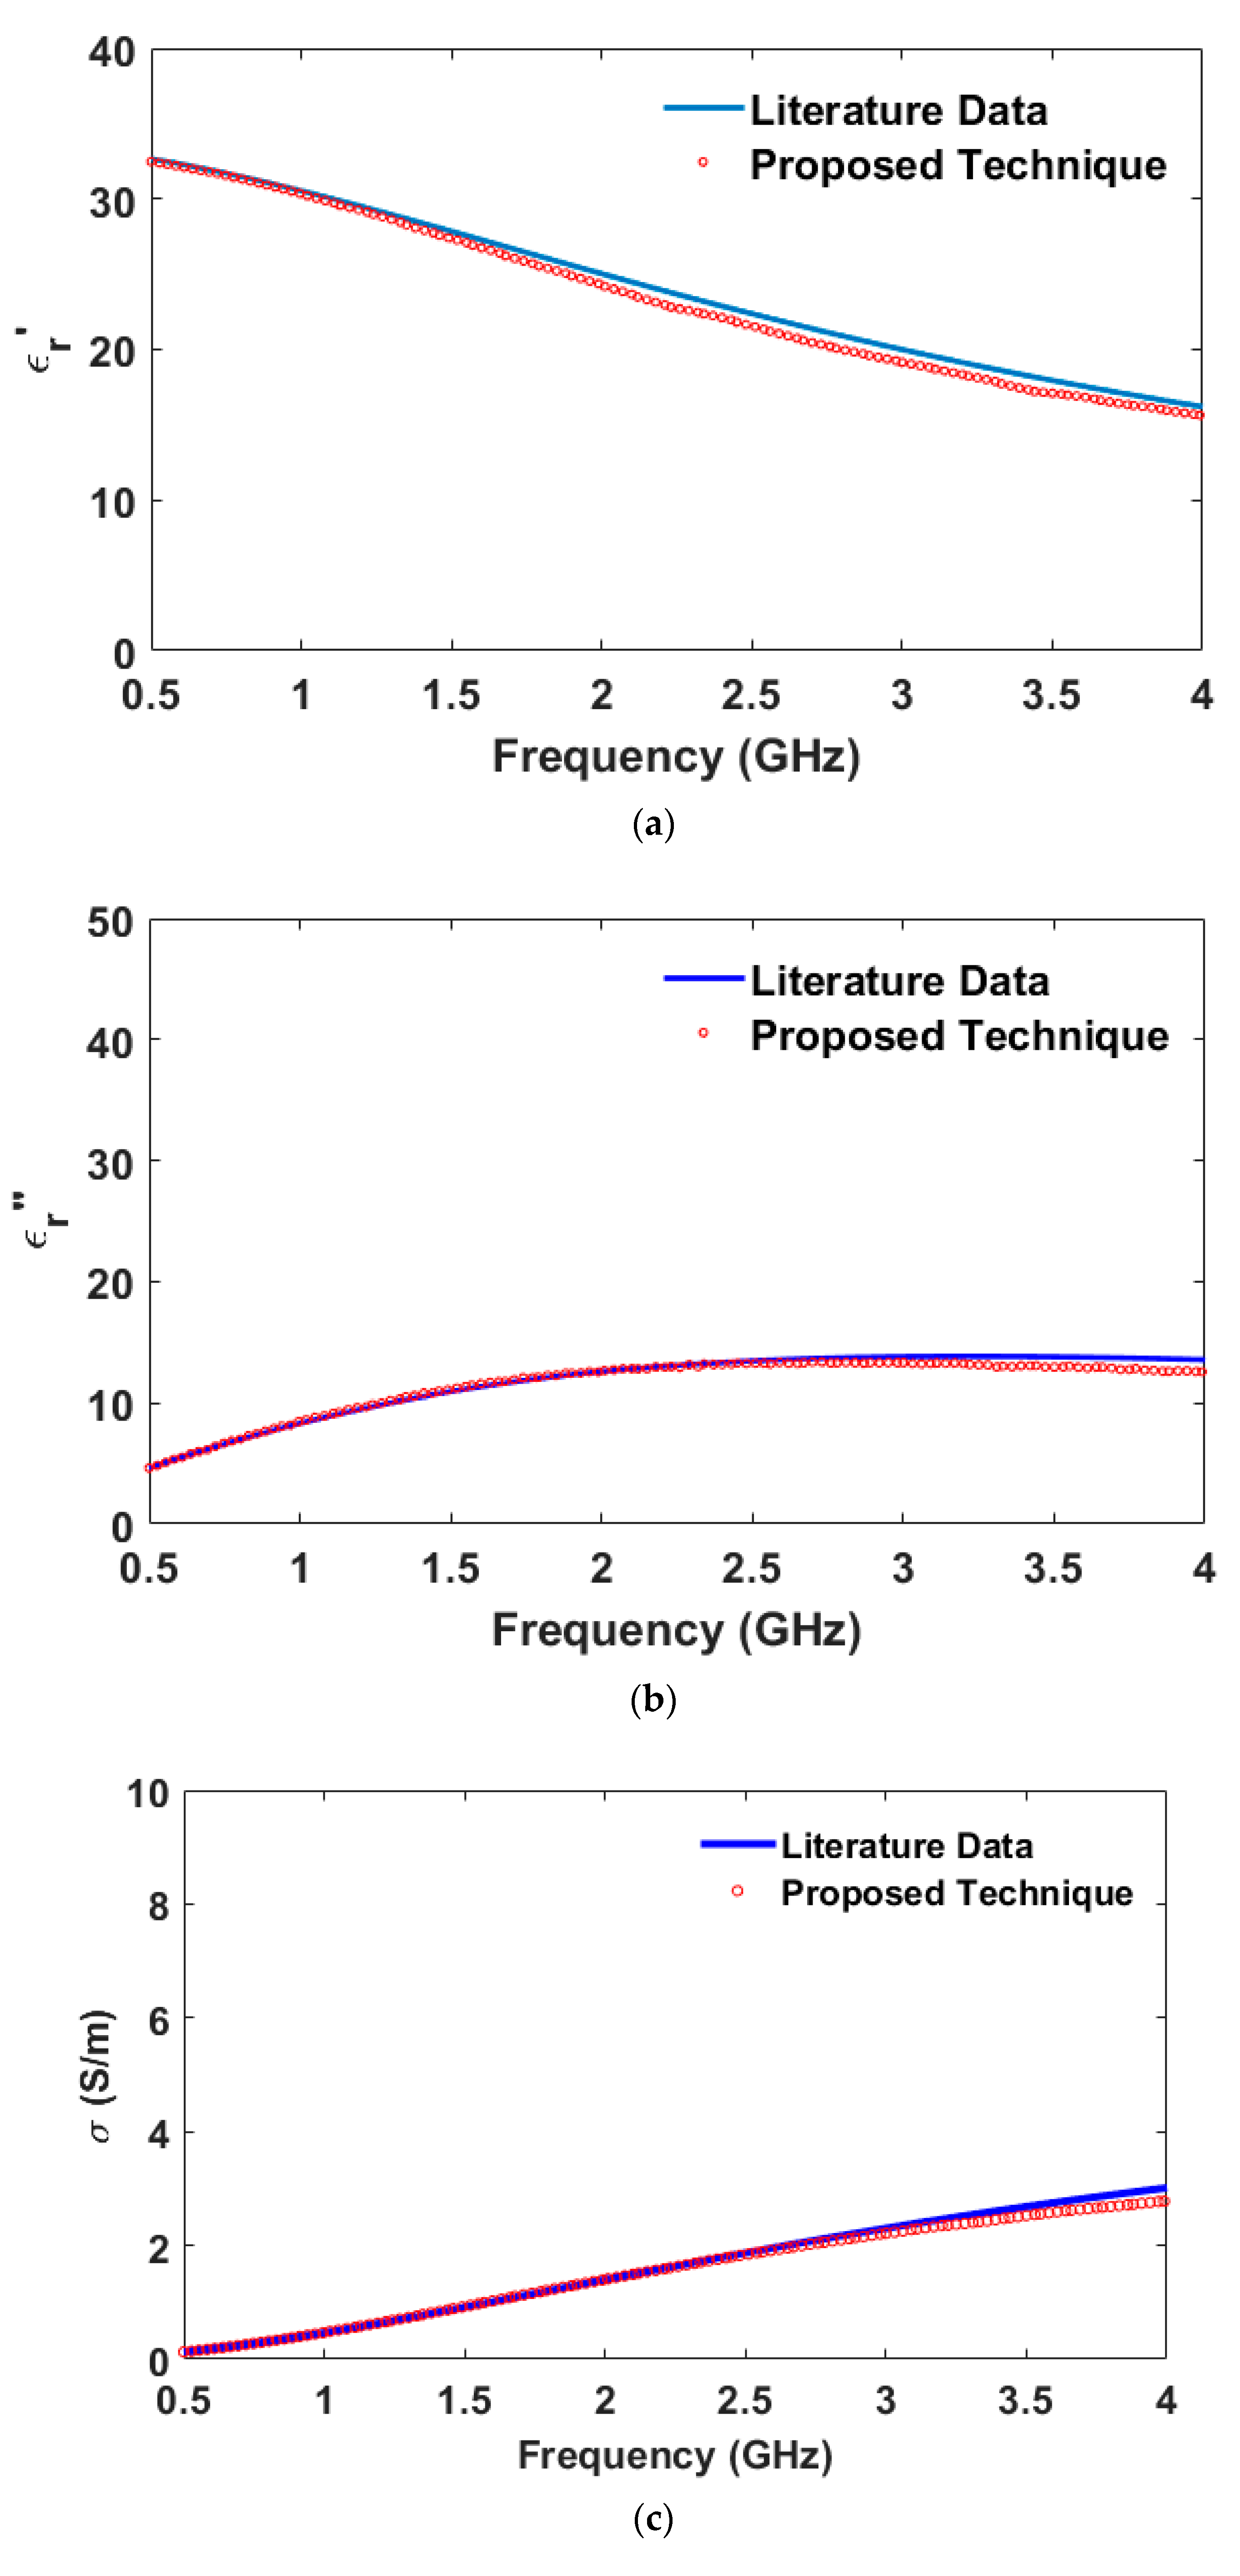
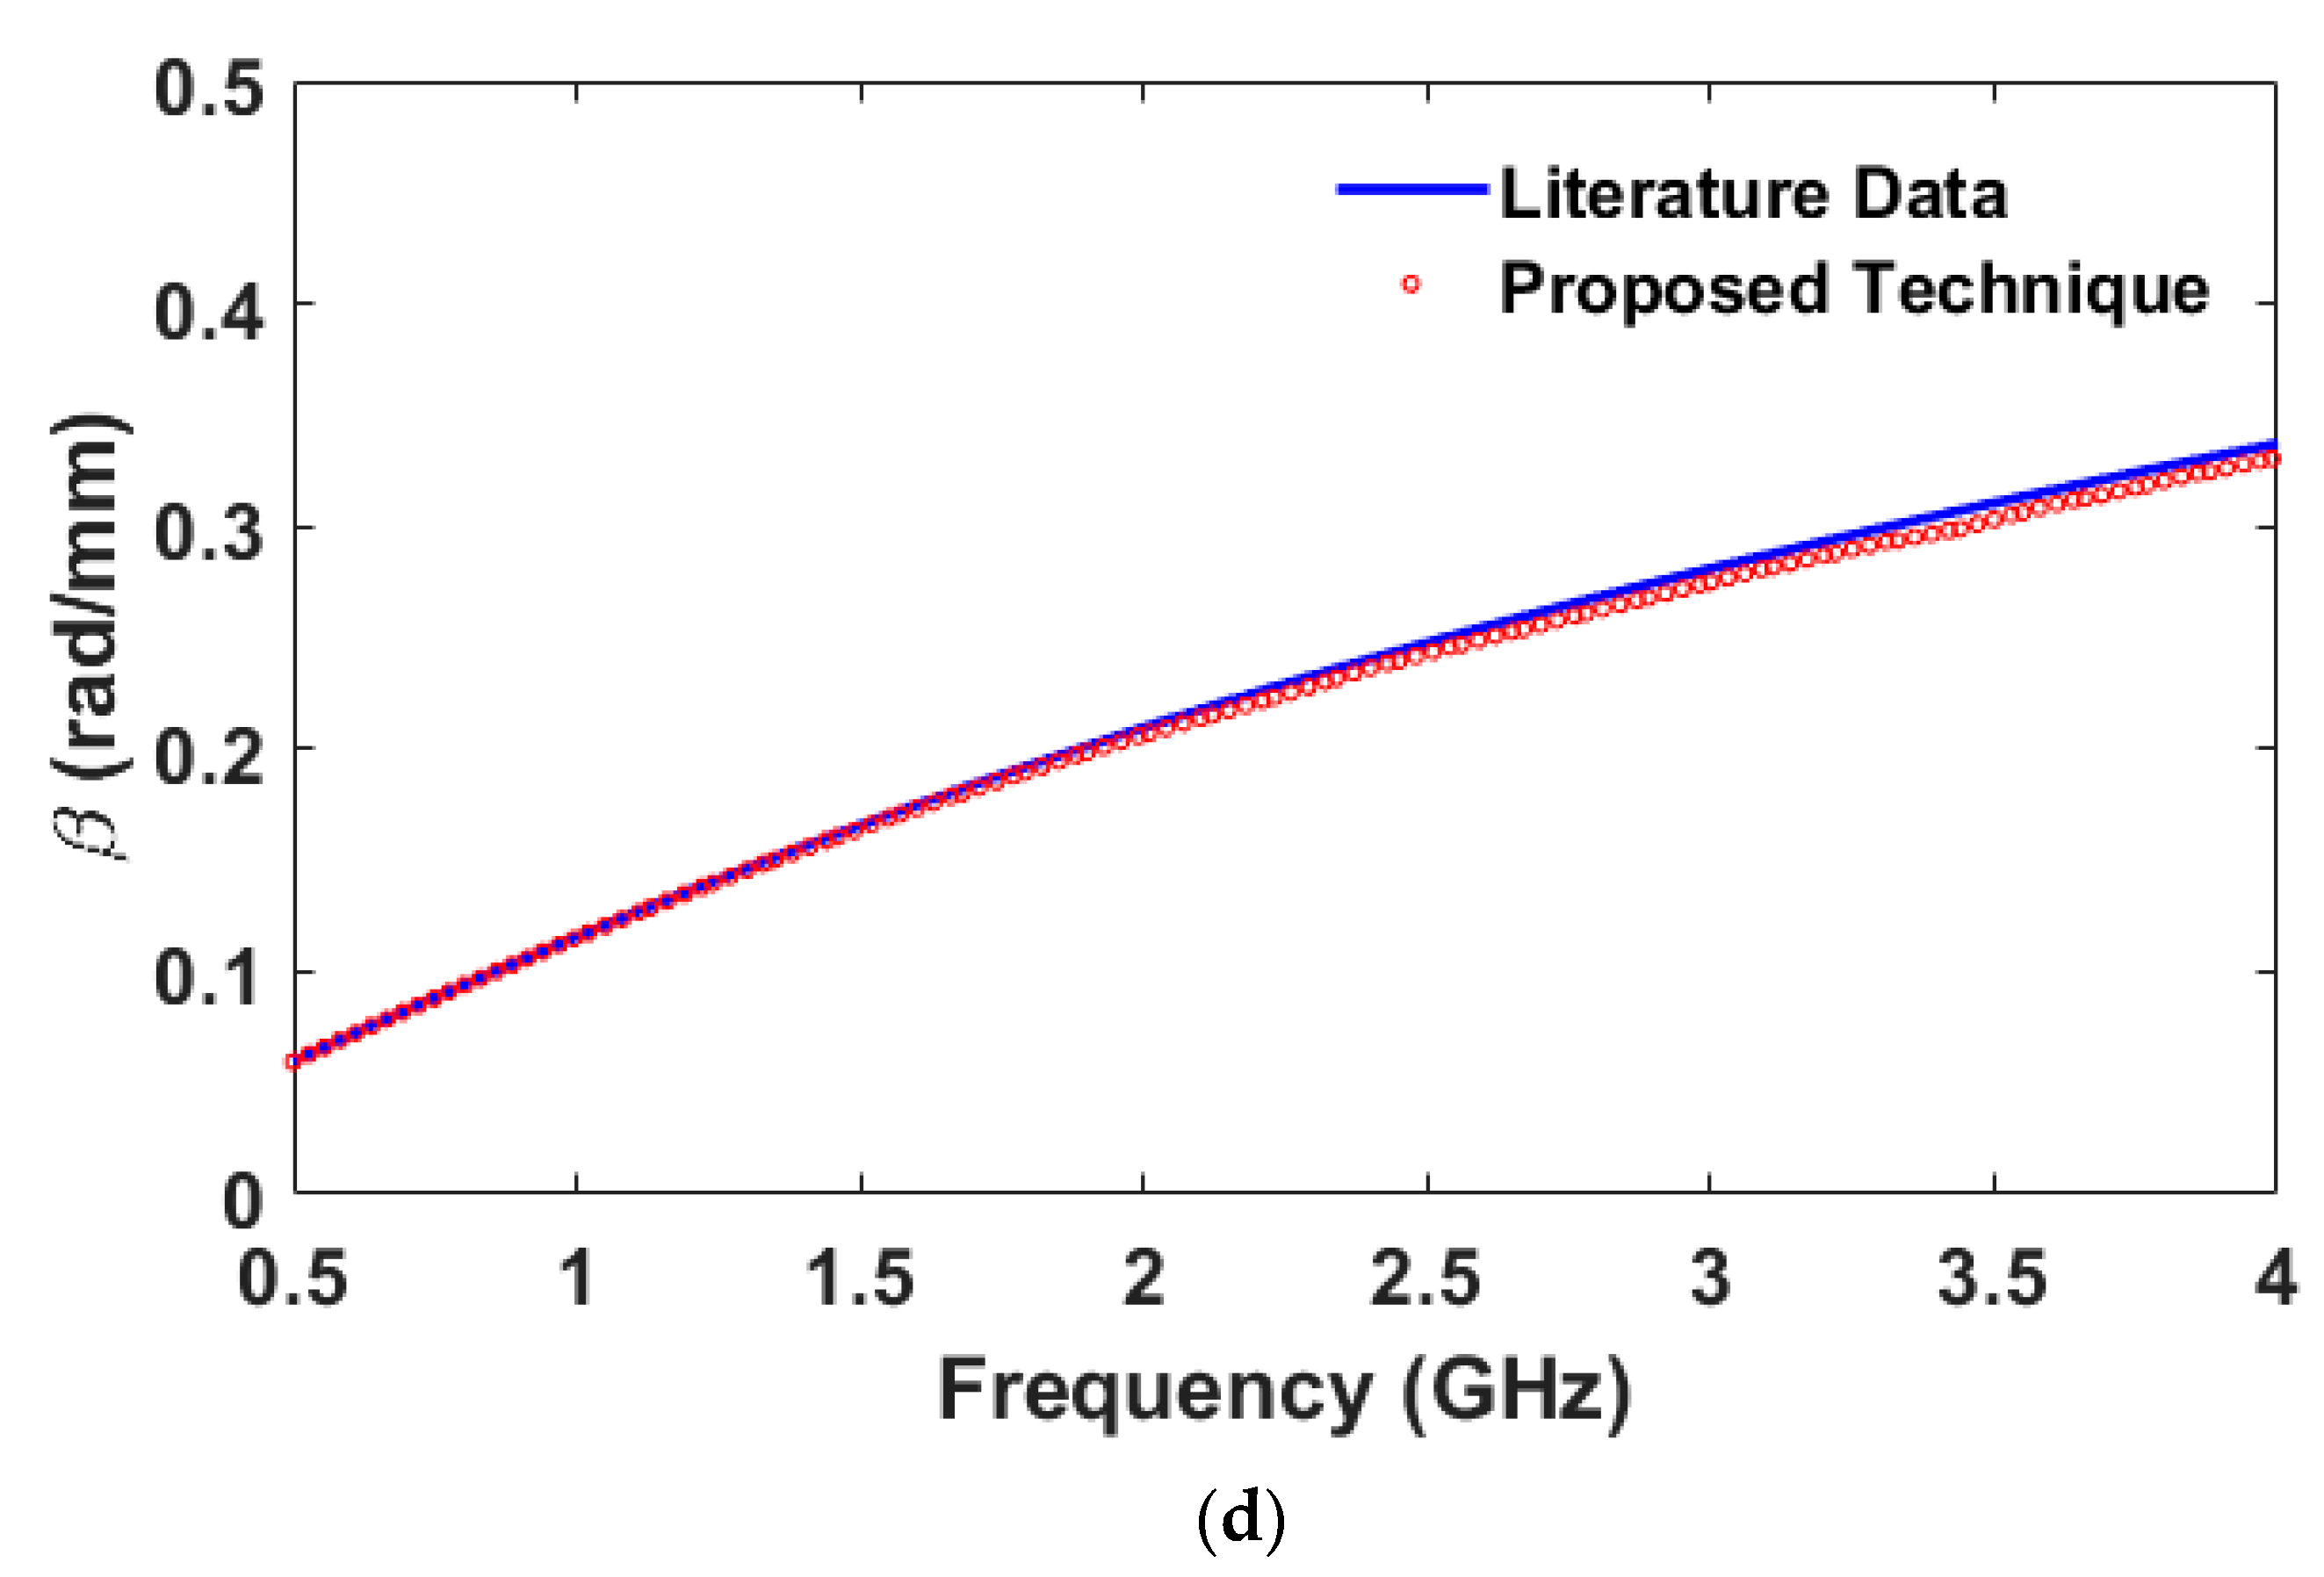
The validation test of the sensor ensures that this sensor can be practically used in the frequency range of 0.5–4.0 GHz at 25 °C to measure the accurate complex relative permittivity, electrical conductivity, and phase constant of material. The measurement test of pure honey can be done by immersing the sensor in pure honey and connecting the other end of the cable to the vector network analyzer and recording the reflection coefficient of the pure honey. In this experiment, three samples with known complex relative permittivity are air (A), distilled water (B), and ethanol (C). Equation (9) is applied to determine the complex relative permittivity of the unknow material. The honey samples are considered the unknown material (UN). The experimental setup is shown in
Figure 5.
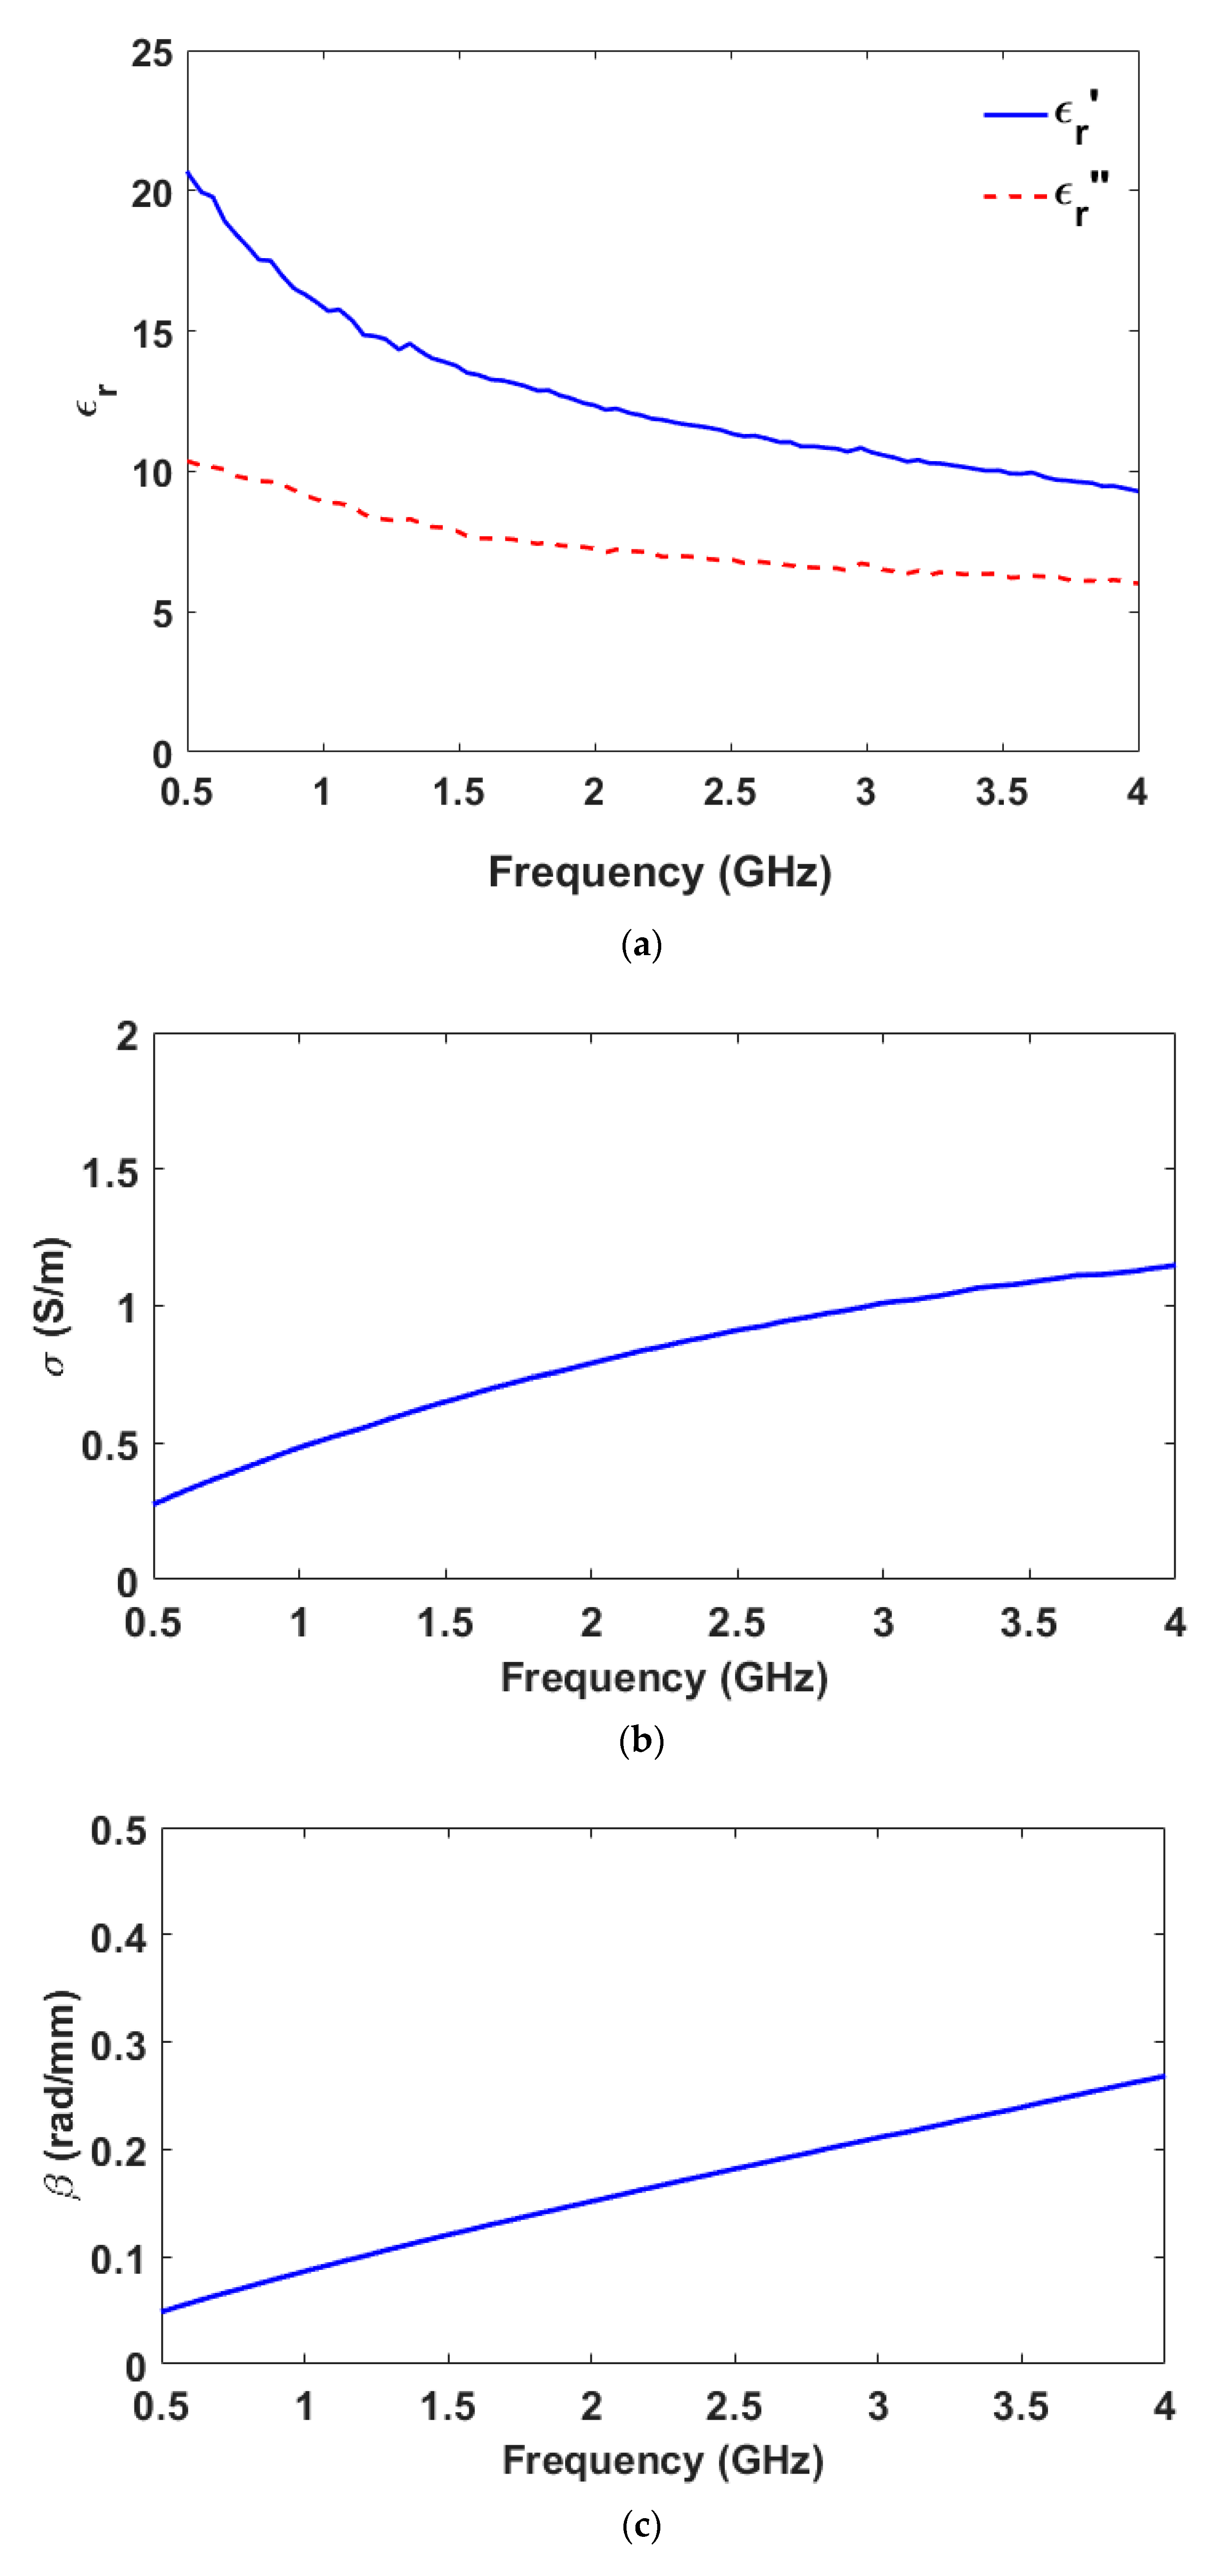
The reflection coefficients are used to determine the complex relative permittivity according to Equation (9). Equations (3) and (4) are used to calculate the electrical conductivity and the phase constant. The results of complex relative permittivity both real part and imaginary part, electrical conductivity, and phase constant in the frequency range of 0.5–4.0 GHz are shown in
Figure 7.
Figure 7a demonstrates the complex relative permittivity in the microwave frequency range of 0.5–4.0 GHz. The complex relative permittivity of pure honey both real part and imaginary part monotonically decreased with increasing frequency. However, in
Figure 7b,c, the electrical conductivity, and the phase constant of pure honey increased with increasing frequency. The real part values of complex relative permittivity range between 9.77 and 20.35 while the imaginary part values lie between 5.20 and 10.10. The electrical conductivity values range between 0.28 and 1.12 S/m while the phase constant values lie between 0.05 and 0.26 rad/mm. The real part of the honey sample decreases with increasing frequency (0.5–4.0 GHz), similar to water [
23], since the honey sample contains up to 15.90%
w/
w moisture content.
The complex relative permittivity, the electrical conductivity, and the phase constant of honey samples in the frequency of 0.5–4.0 GHz are revealed in
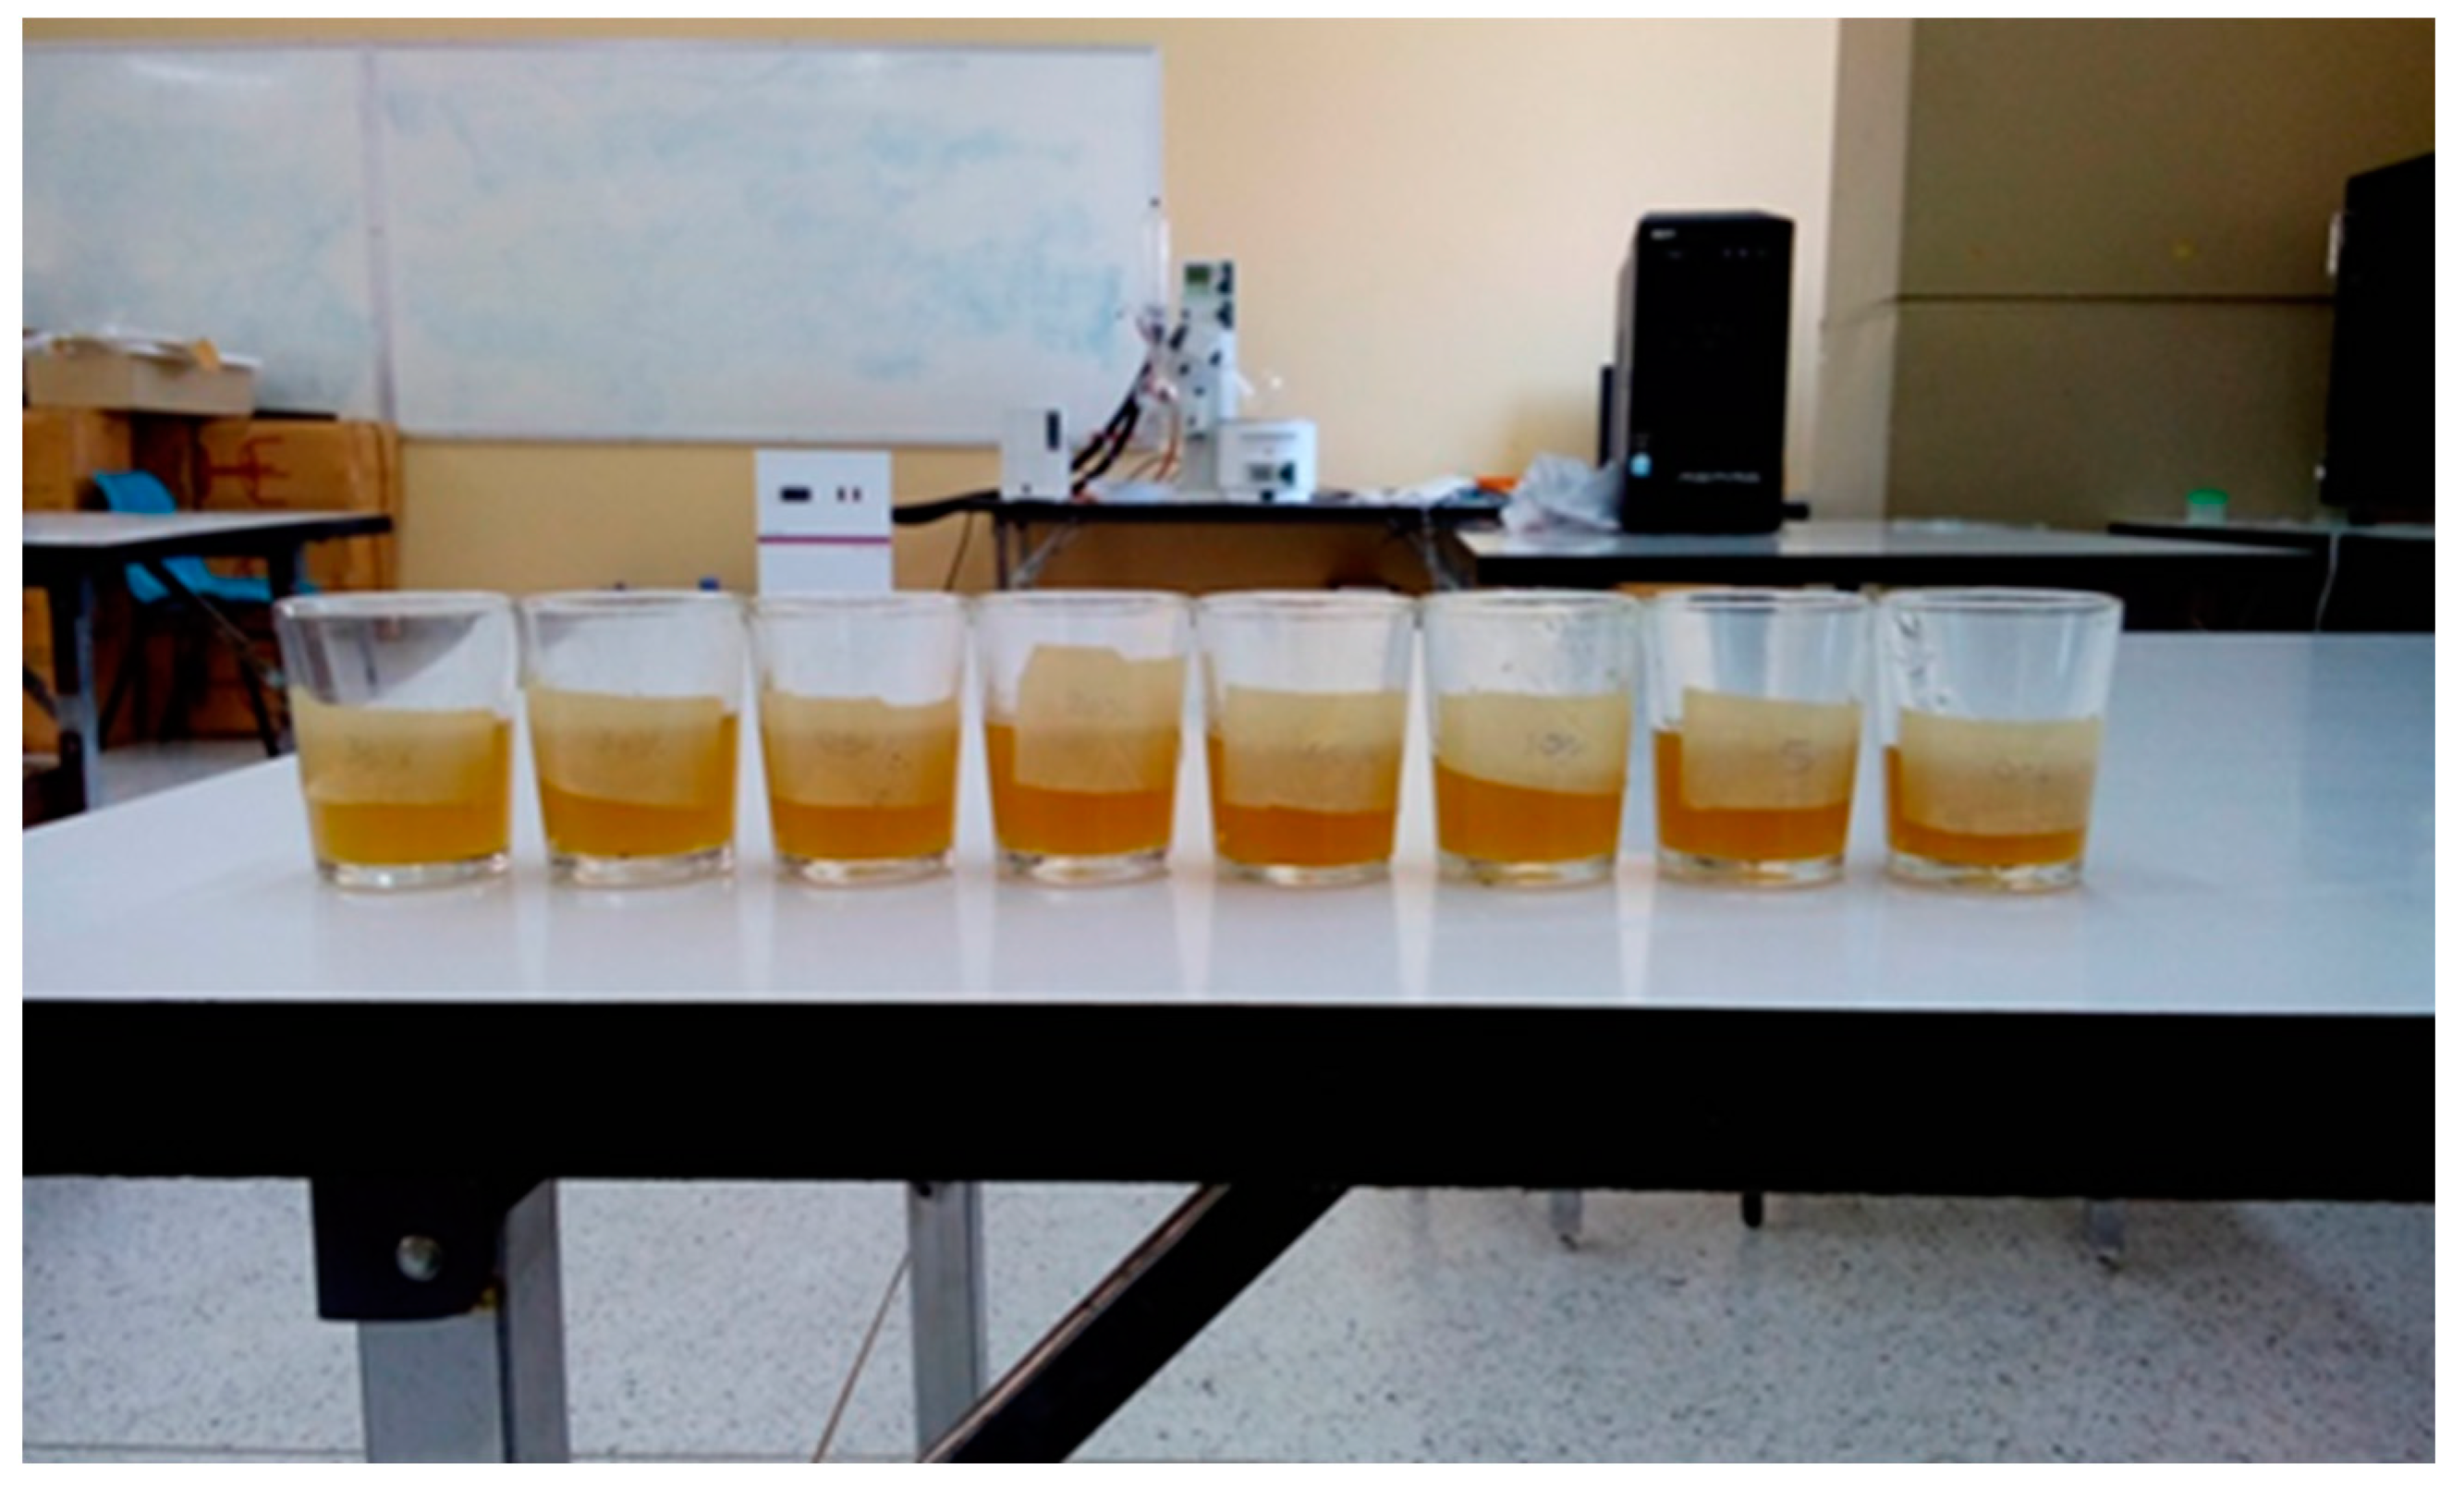
Figure 7. Further study is performed with water adulteration in honey samples. The sample preparation for the detection of water adulteration in honey can be done by preparing seven different adulterated honey samples as follows: pure honey, honey with water adulteration at 5–30%
w/
w. Each adulterated honey sample has five samples to measure for average values. The experiments are performed with the sample temperature of 25 °C.
After the measurement, the complex relative permittivity, the electrical conductivity, and the phase constant of the honey samples at different frequencies are calculated and shown in
Figure 8,
Figure 9 and
Figure 10, respectively.
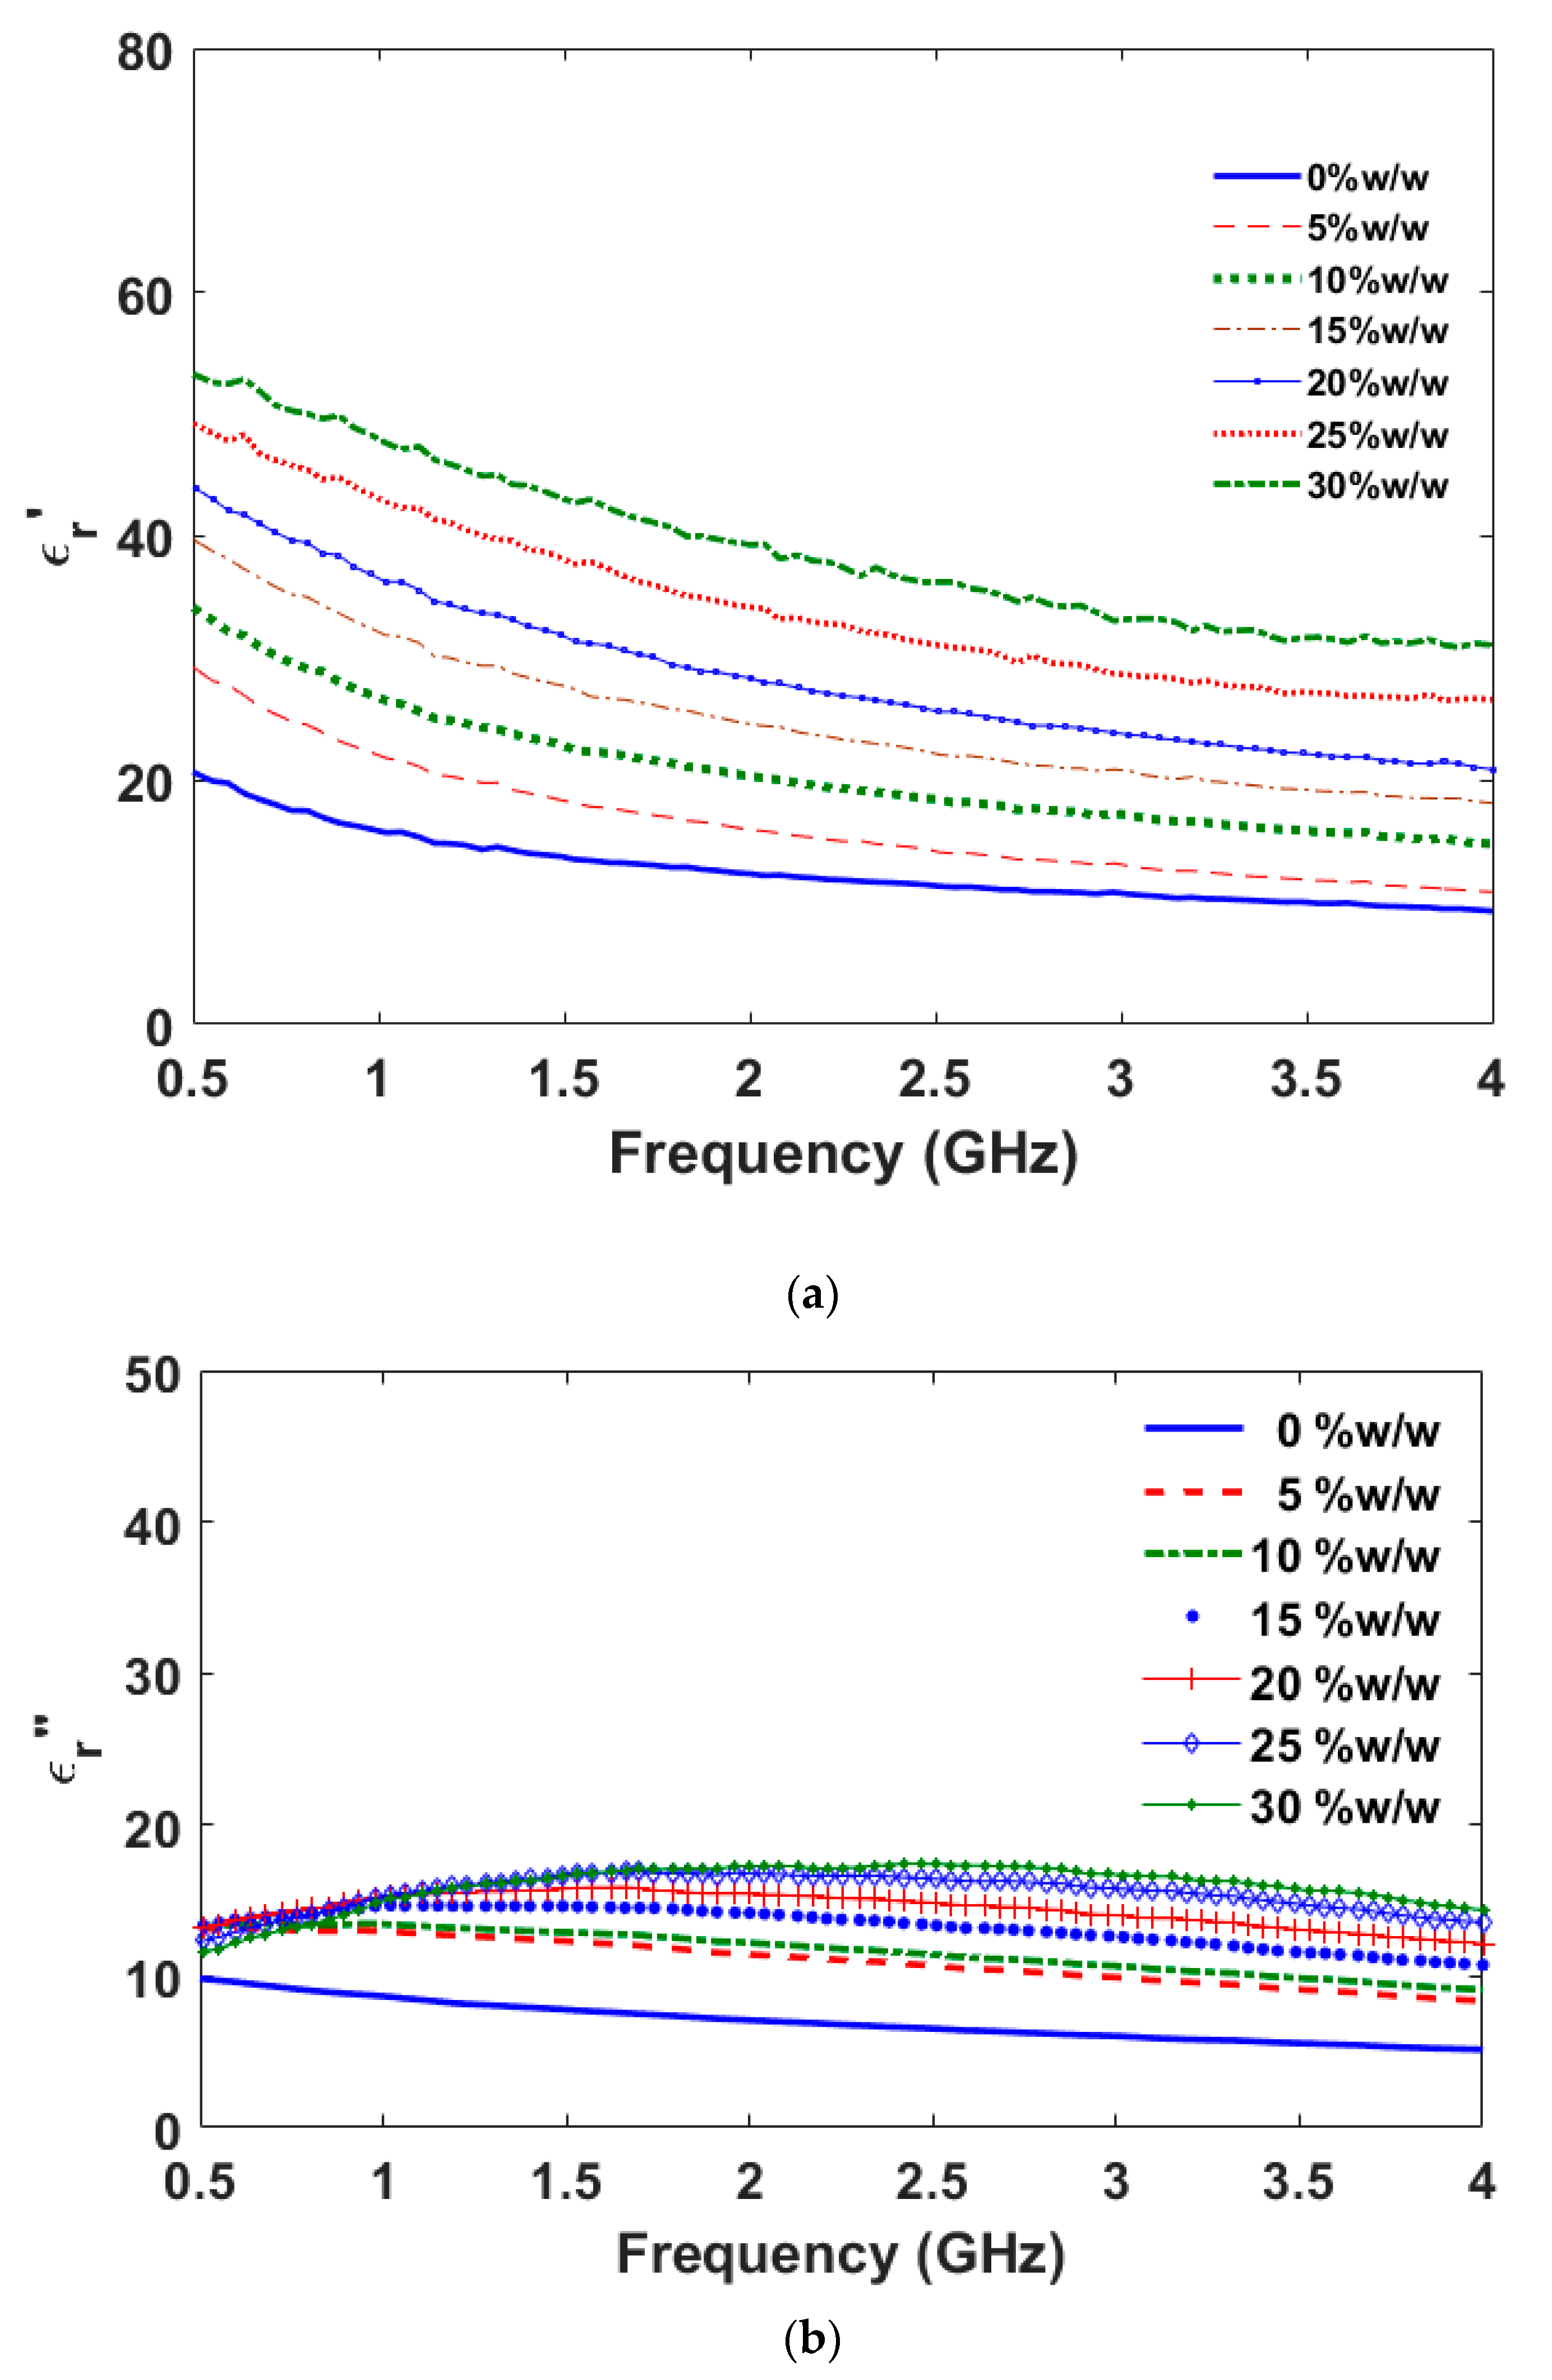
From
Figure 8a, when the water content in the honey increases, the real part of the complex relative permittivity increases throughout the 0.5–4.0 GHz frequency range because the real part of the relative permittivity of water is as high as 78.3 [
23], results in the real part of the complex relative permittivity of adulterated honey increases as well.
Figure 8b shows the imaginary part of complex relative permittivity of the adulterated honey samples with water in the range of 0–30%
w/
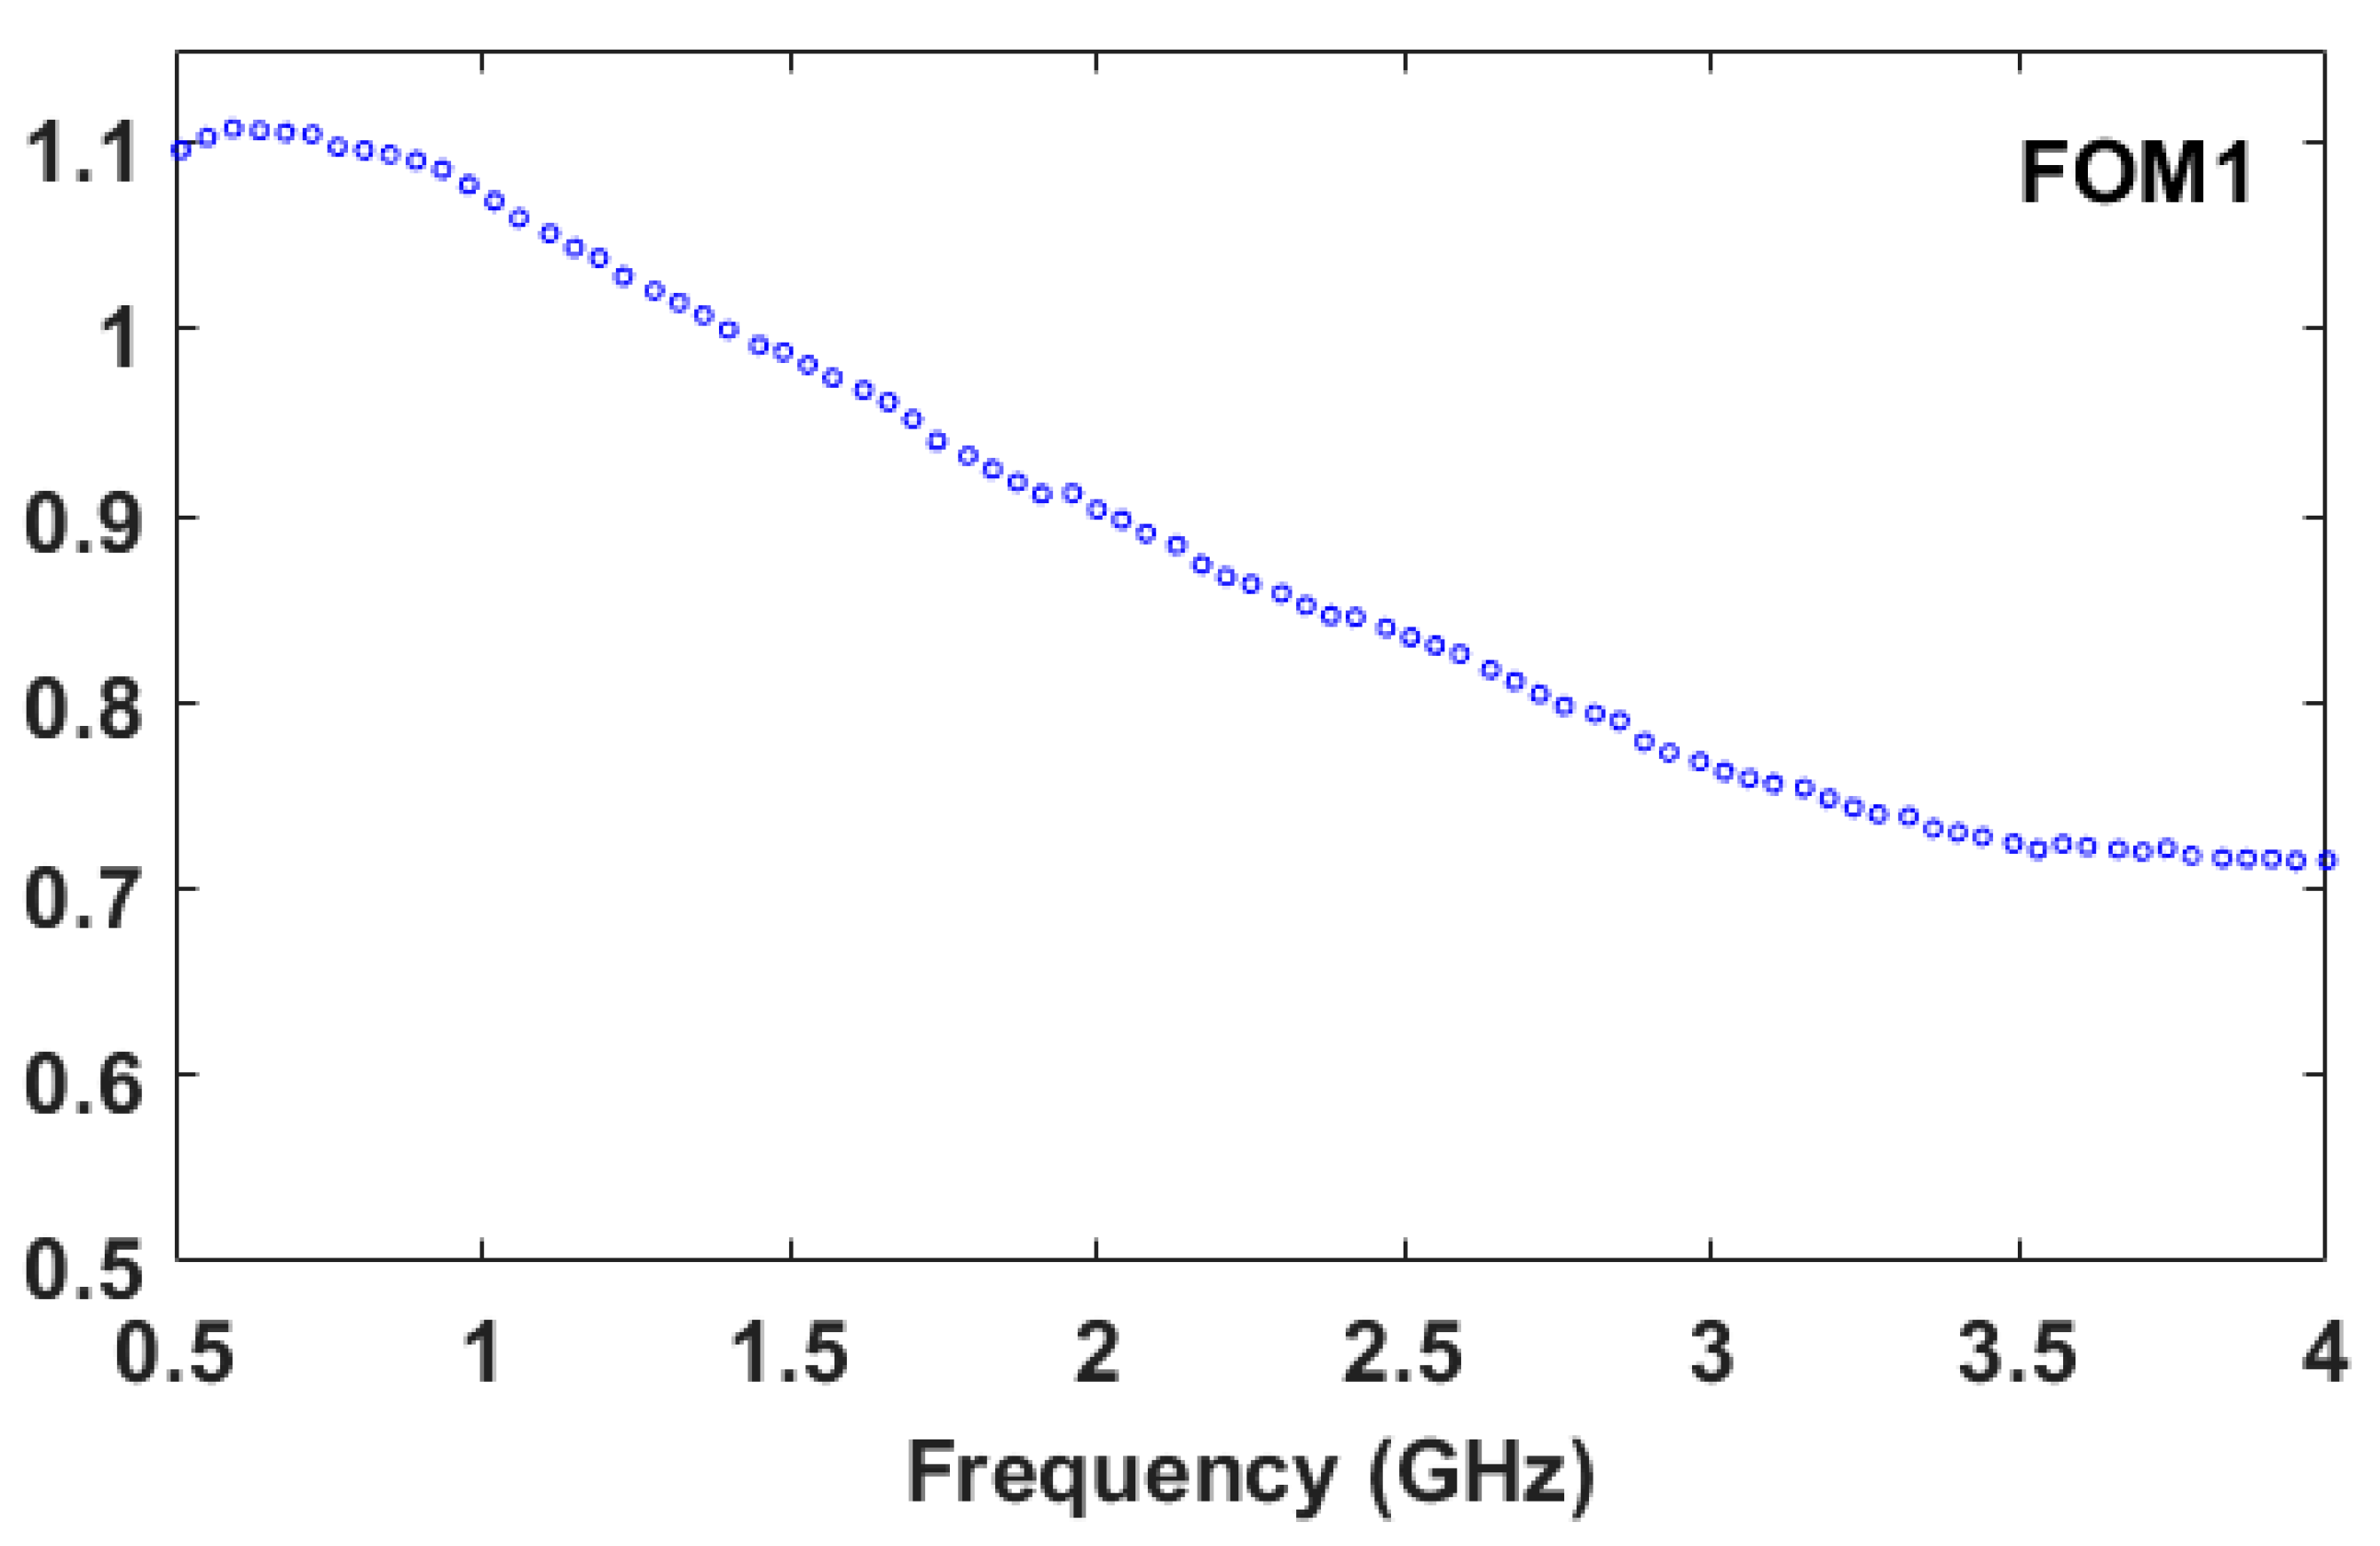
w. The imaginary part of the complex relative permittivity increases when compared to the pure honey sample. However, each adulterated honey sample with different water content shows slight difference in the imaginary part of complex relative permittivity. The difference of the real part of complex relative permittivity of each honey sample is the highest at lower frequencies. A figure of merit (FOM1) for measuring the performance of this technique using the real part of complex relative permittivity is calculated in Equation (10).
The FOM1 can help to judge how well the performance of this technique using the real part of permittivity is. From
Figure 8a, the measured results show that the difference of the real part of complex relative permittivity (
) of pure honey and the honey sample (water adulteration for 30%
w/
w) is 33.24 at the frequency of 0.6 GHz and the temperature of 25 °C while the difference of water content of both samples is 30%
w/
w. Therefore, the FOM1 is equal to 1.108 (%
w/
w)
−1 at the frequency of 0.6 GHz.
Figure 11 shows the FOM1. The FOM1 is performed at the frequency of 4.0 GHz as well. Its FOM1 is equal to 0.715 (%
w/
w)
−1. From the results, it shows that the real part of the complex relative permittivity is the most appropriate indicator in water adulteration detection in honey at 0.6 GHz, and the FOM1 is equal to 1.108 (%
w/
w)
−1.
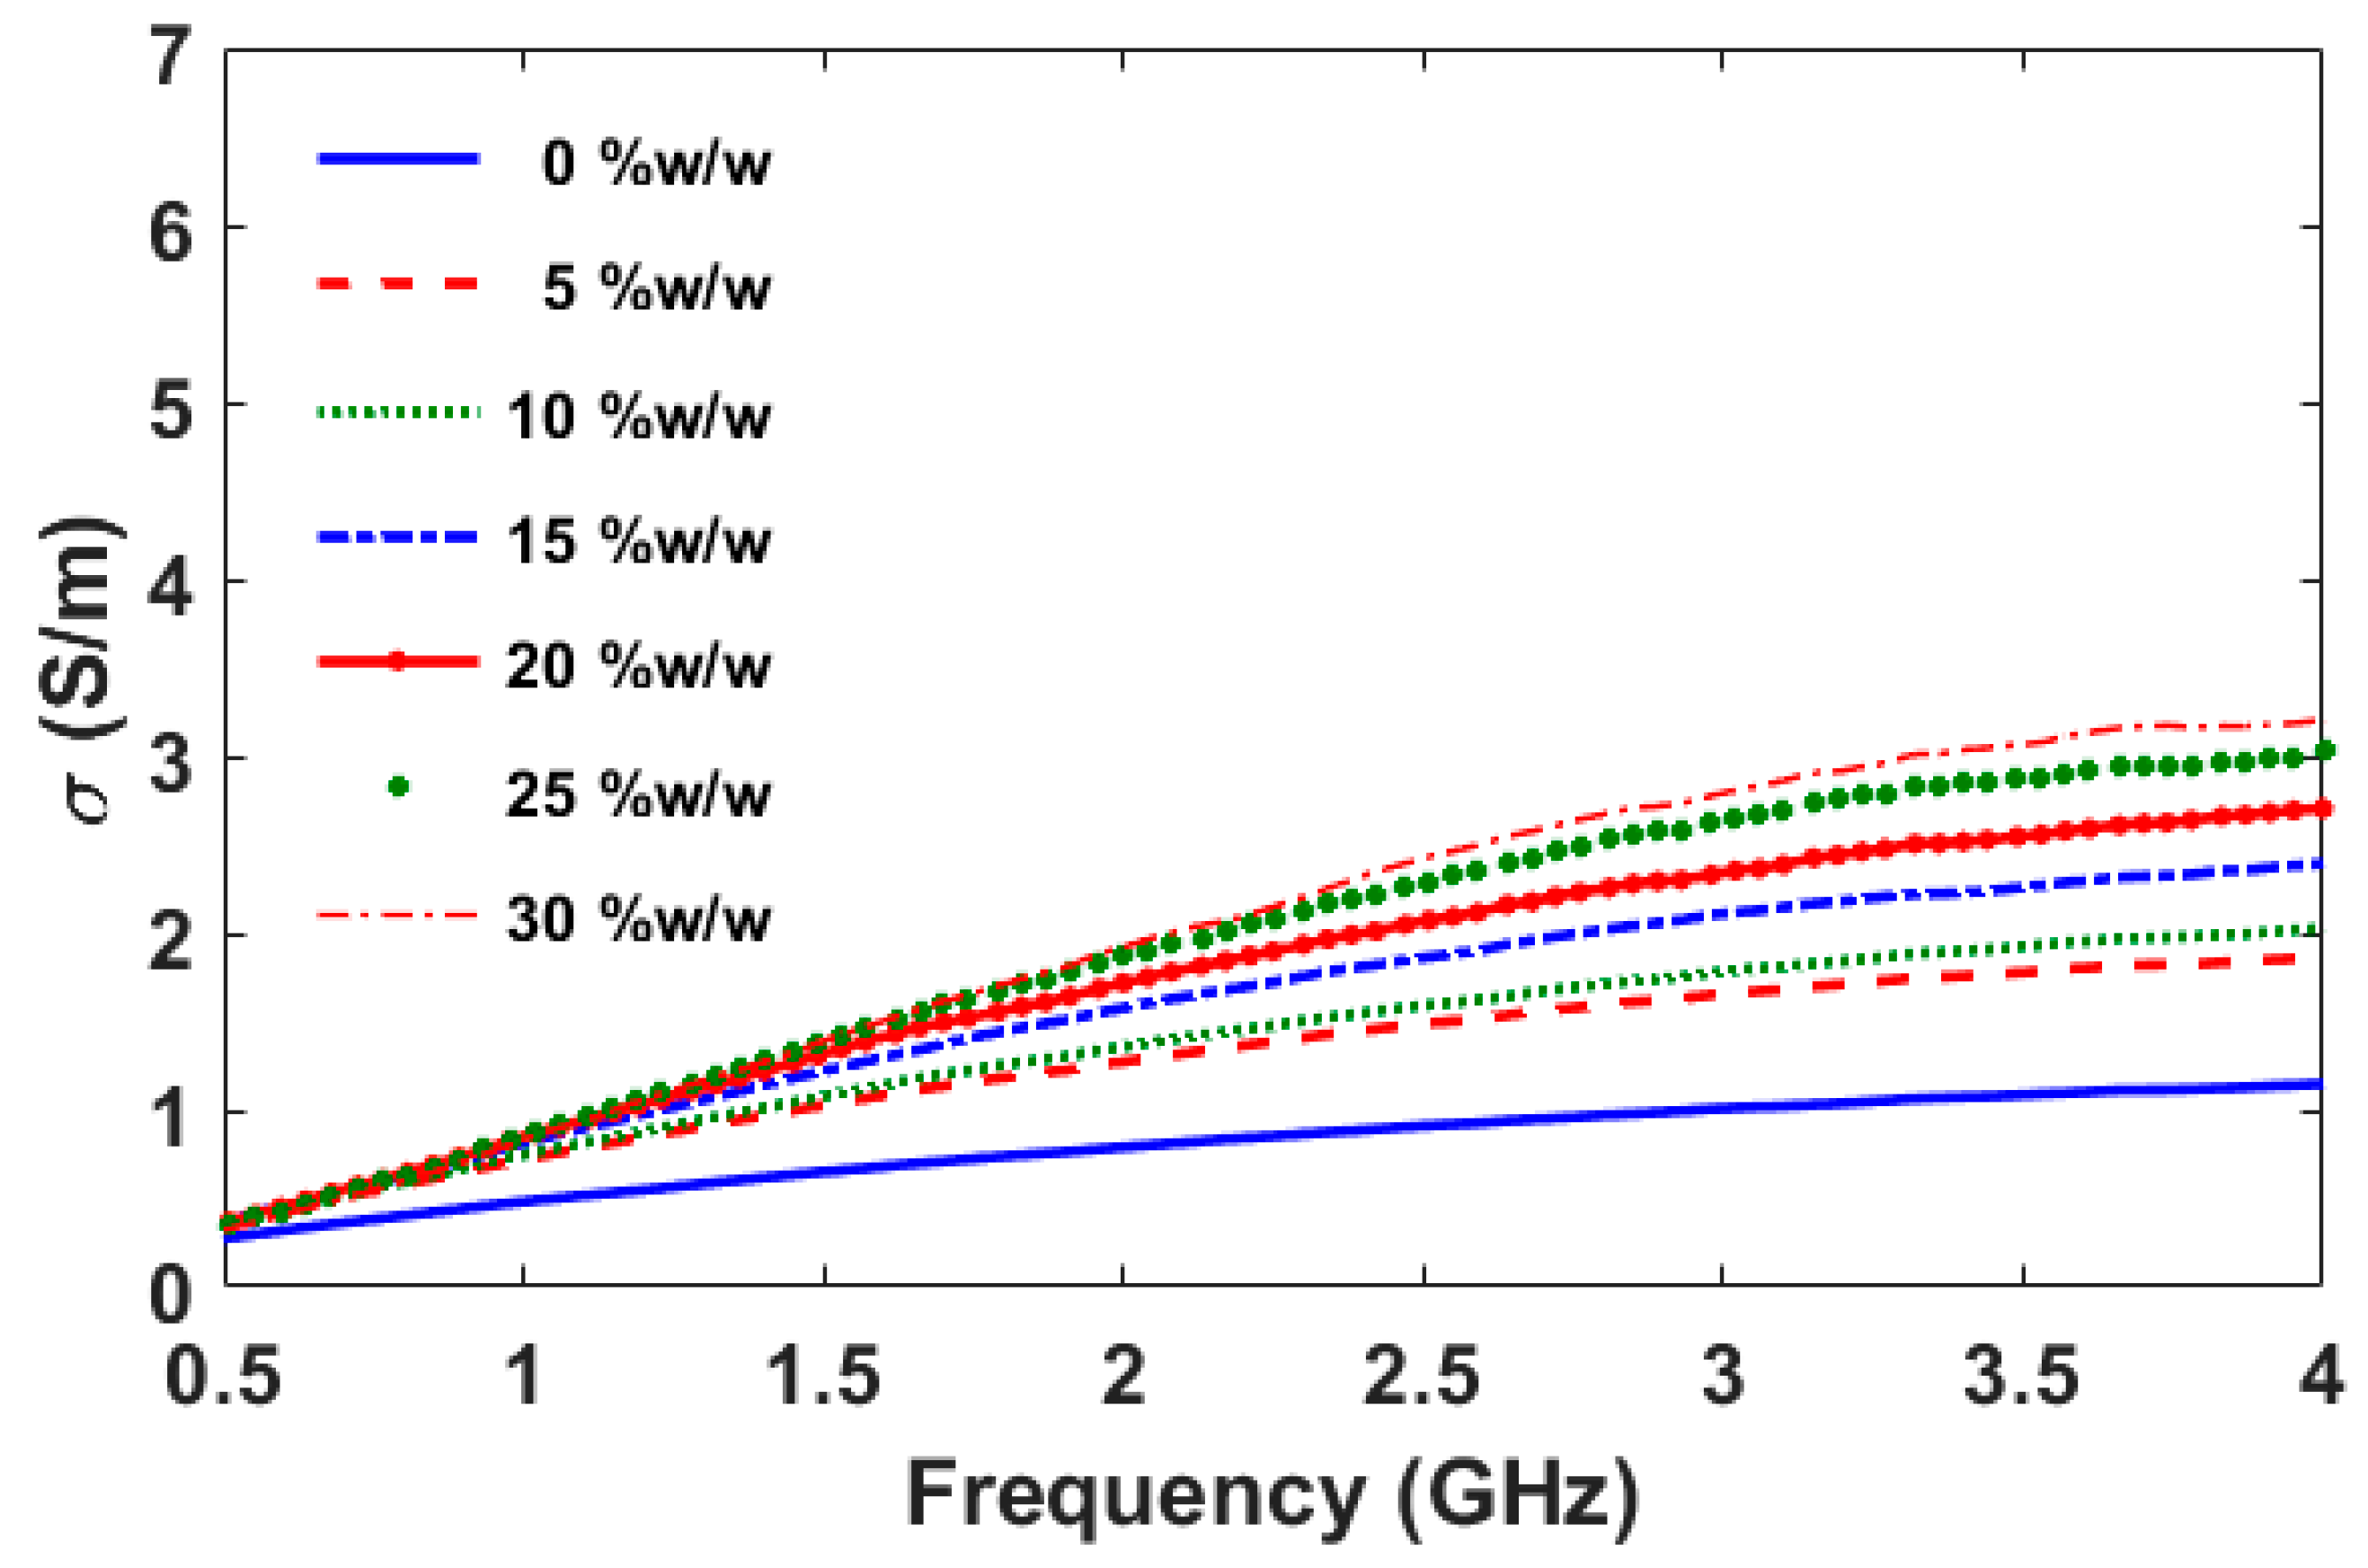
Figure 9 shows the electrical conductivity of the adulterated honey samples with water in the range of 0–30%
w/
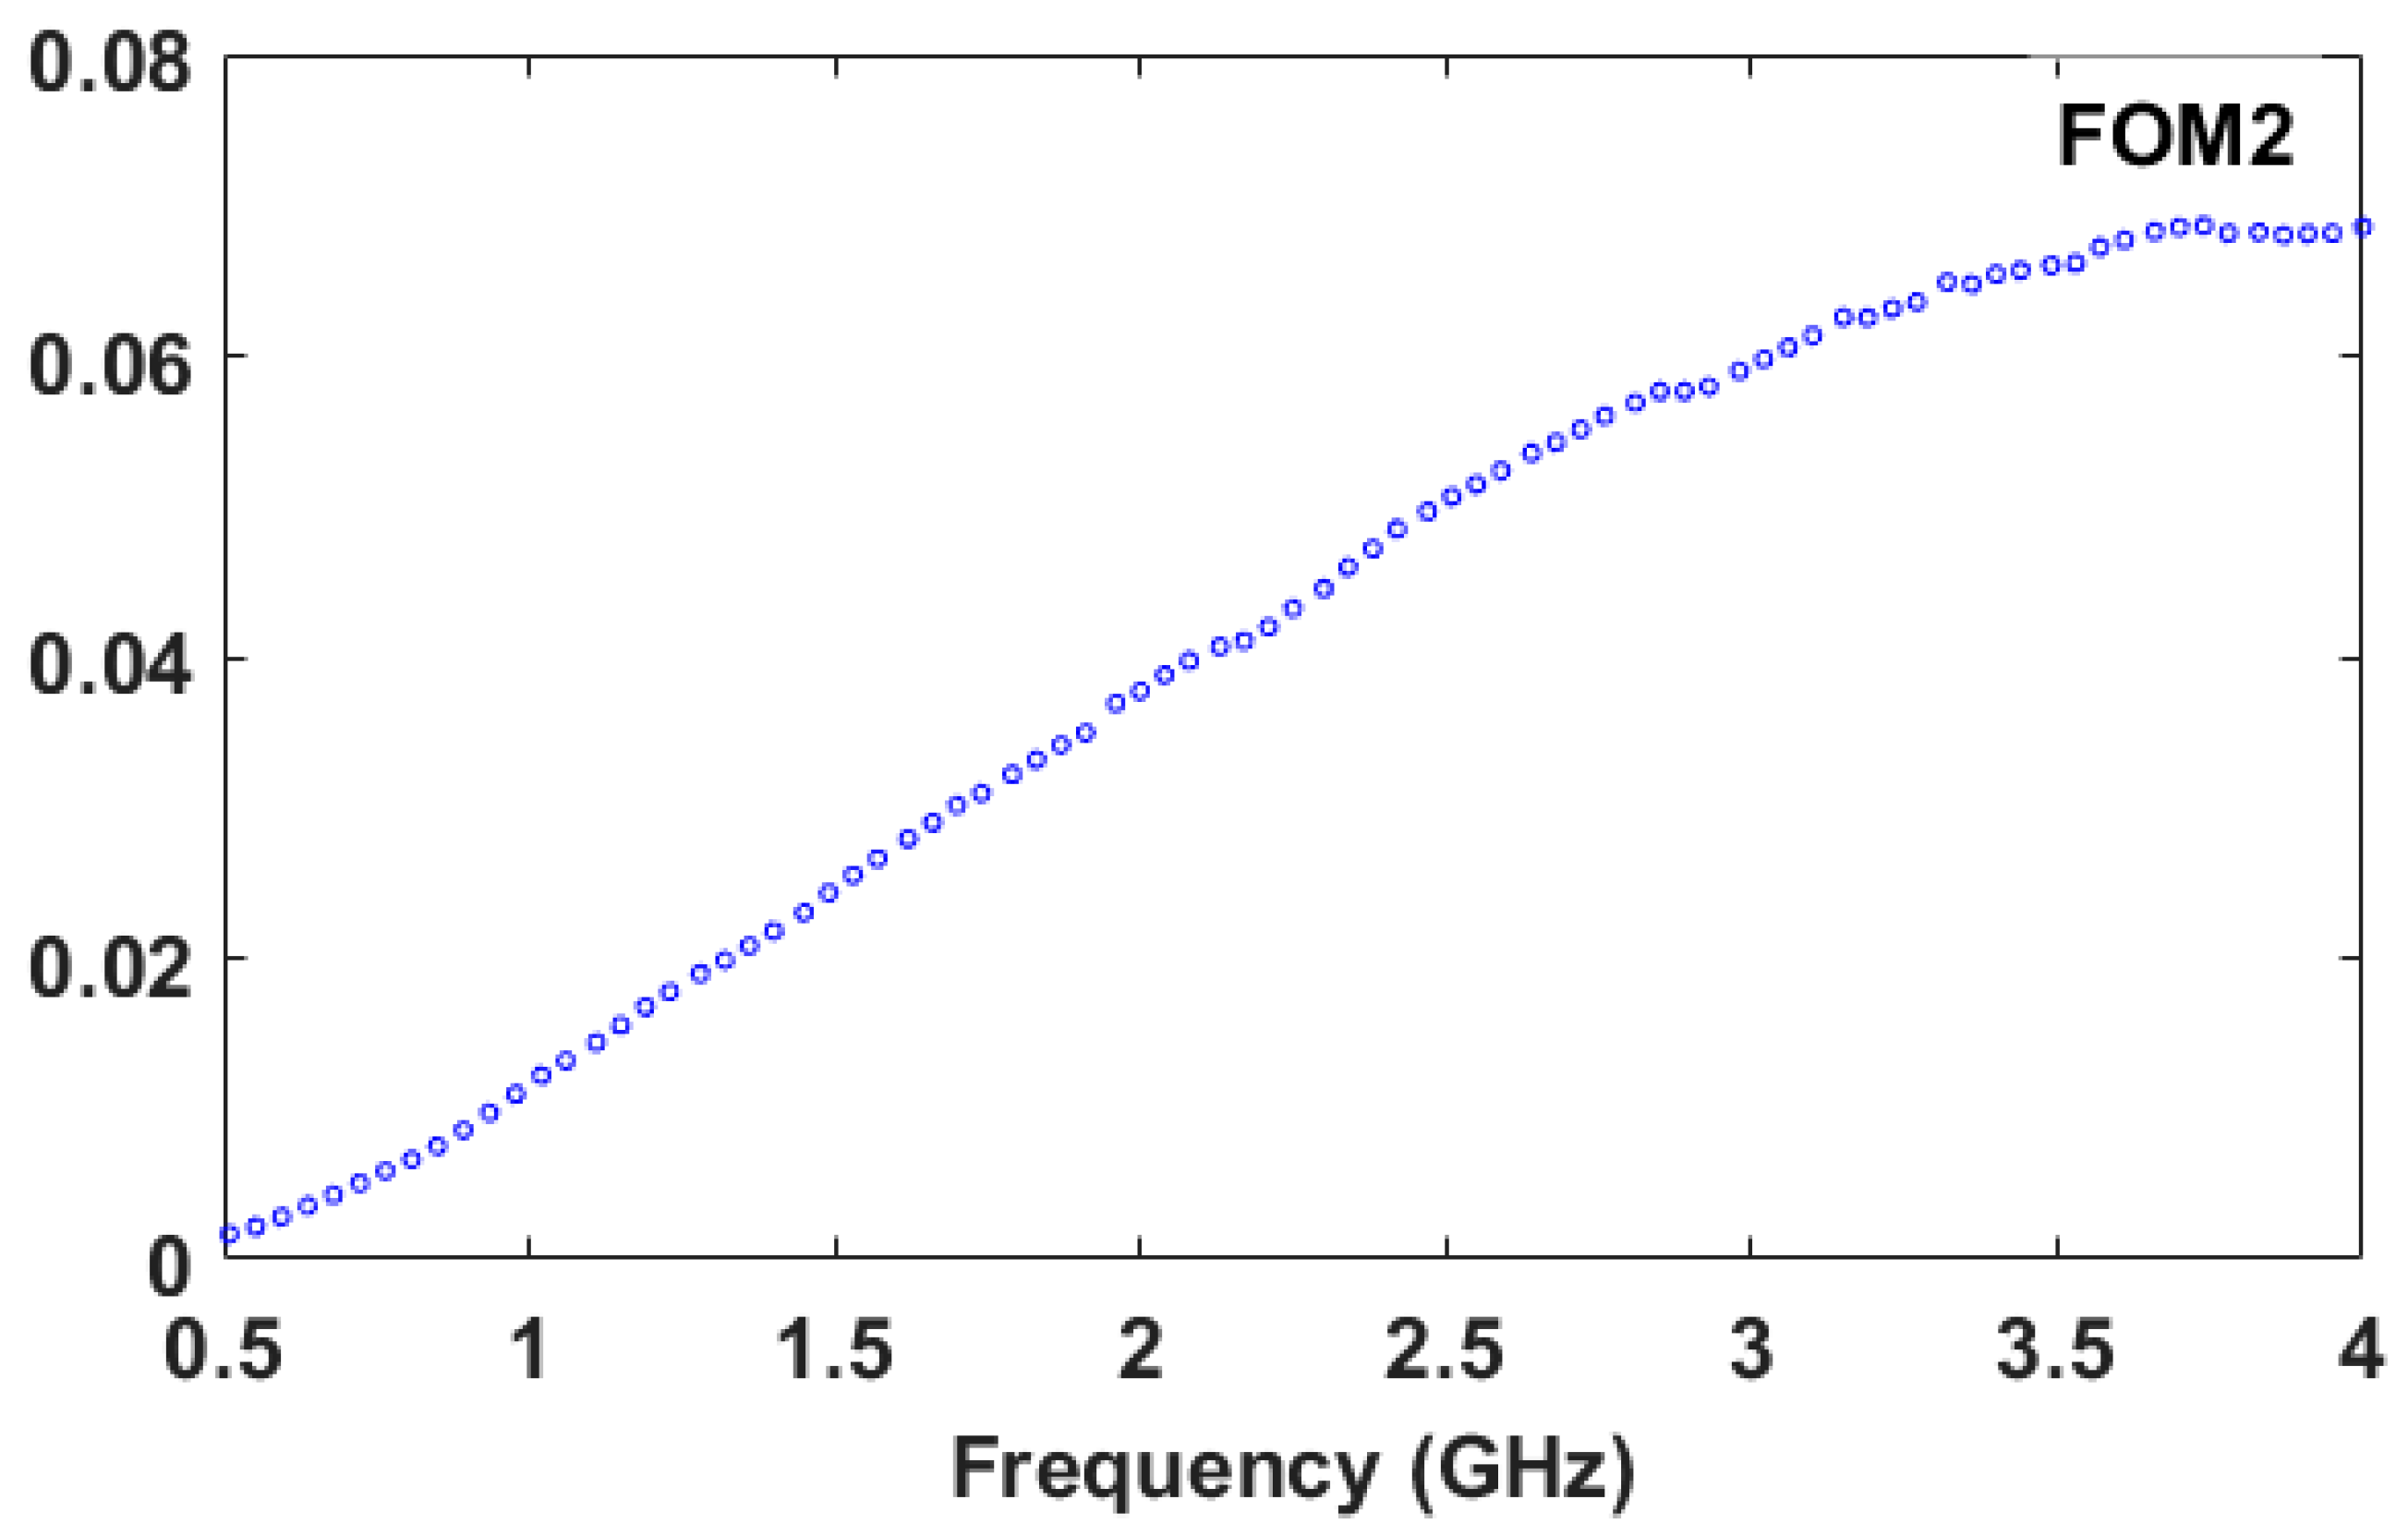
w. The electrical conductivity increases when compared to pure honey. The electrical conductivity is slightly changed in the frequency range of 0.5–1.5 GHz while the significant increase occurs in the higher frequency range of 1.5–4.0 GHz. A figure of merit (FOM2) for measuring the performance of this technique using the electrical conductivity is described in Equation (11).
Figure 12 demonstrates the FOM2 in the frequency range of 0.5–4.0 GHz. The maximum FOM2 is equal to 0.069 S/m * (%
w/
w)
−1 at the frequency of 3.74 GHz. Therefore, the frequency of 3.74 GHz is the most appropriate frequency when the electrical conductivity is considered the indicator.
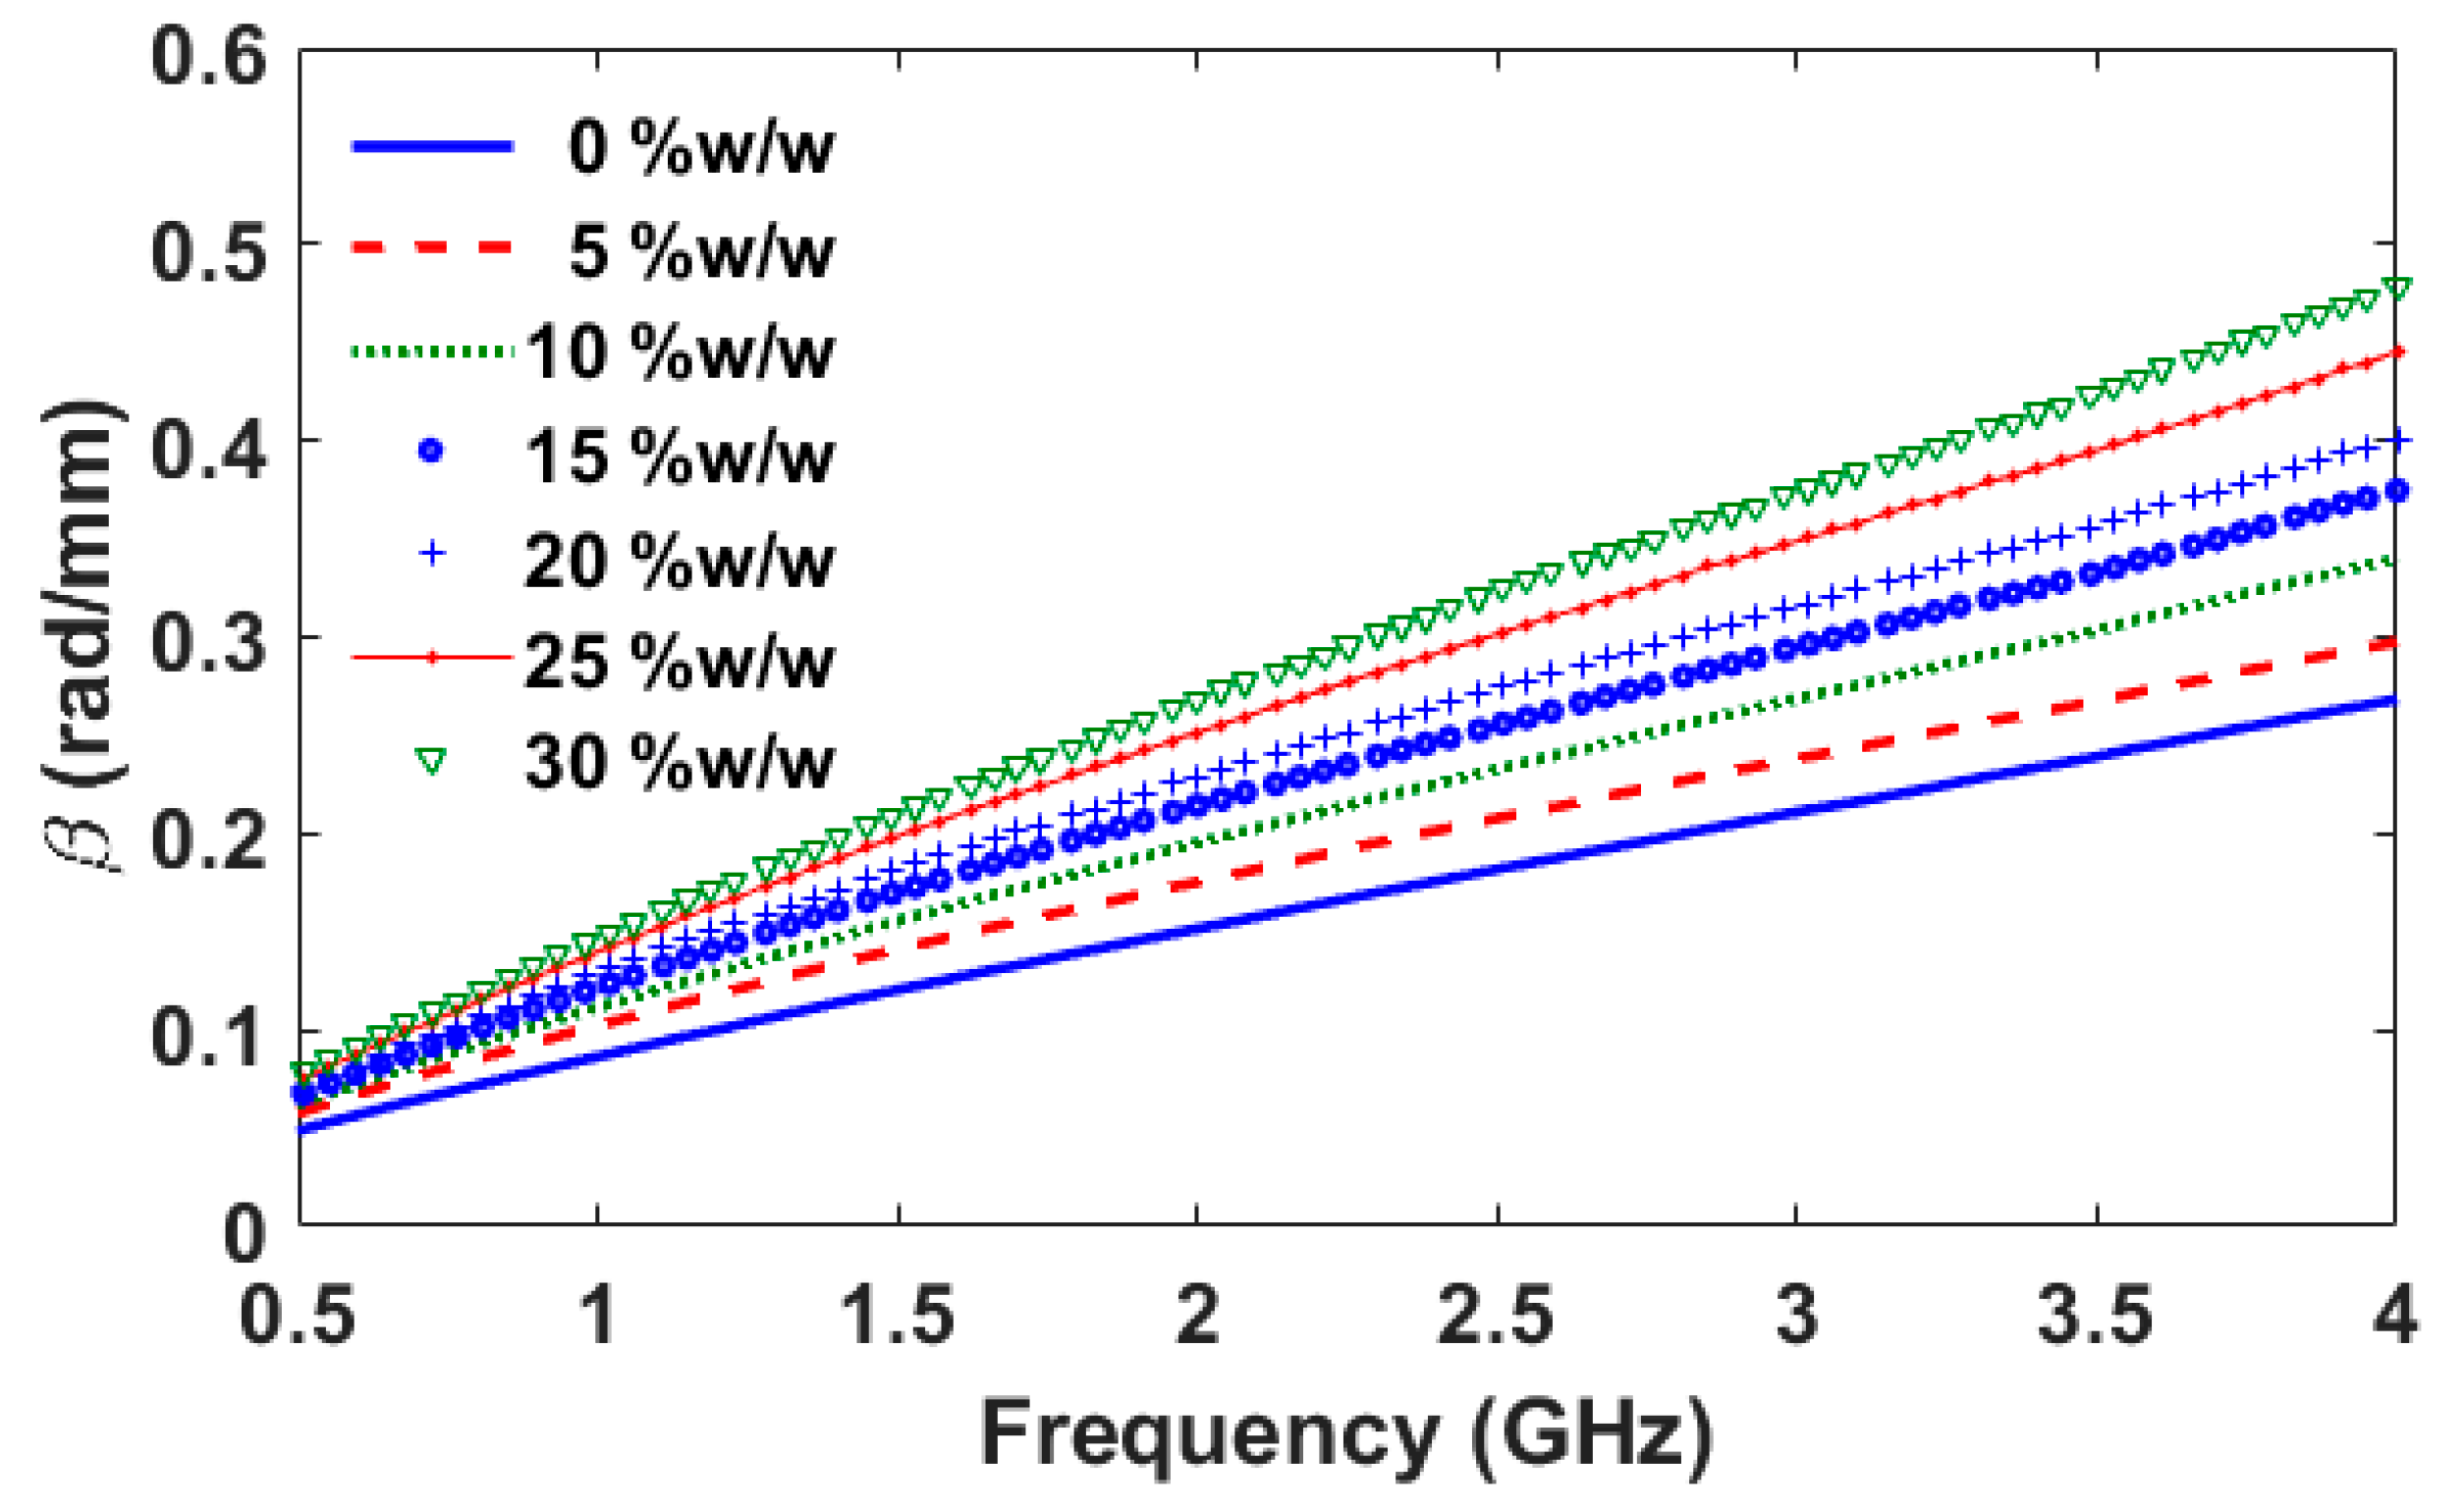
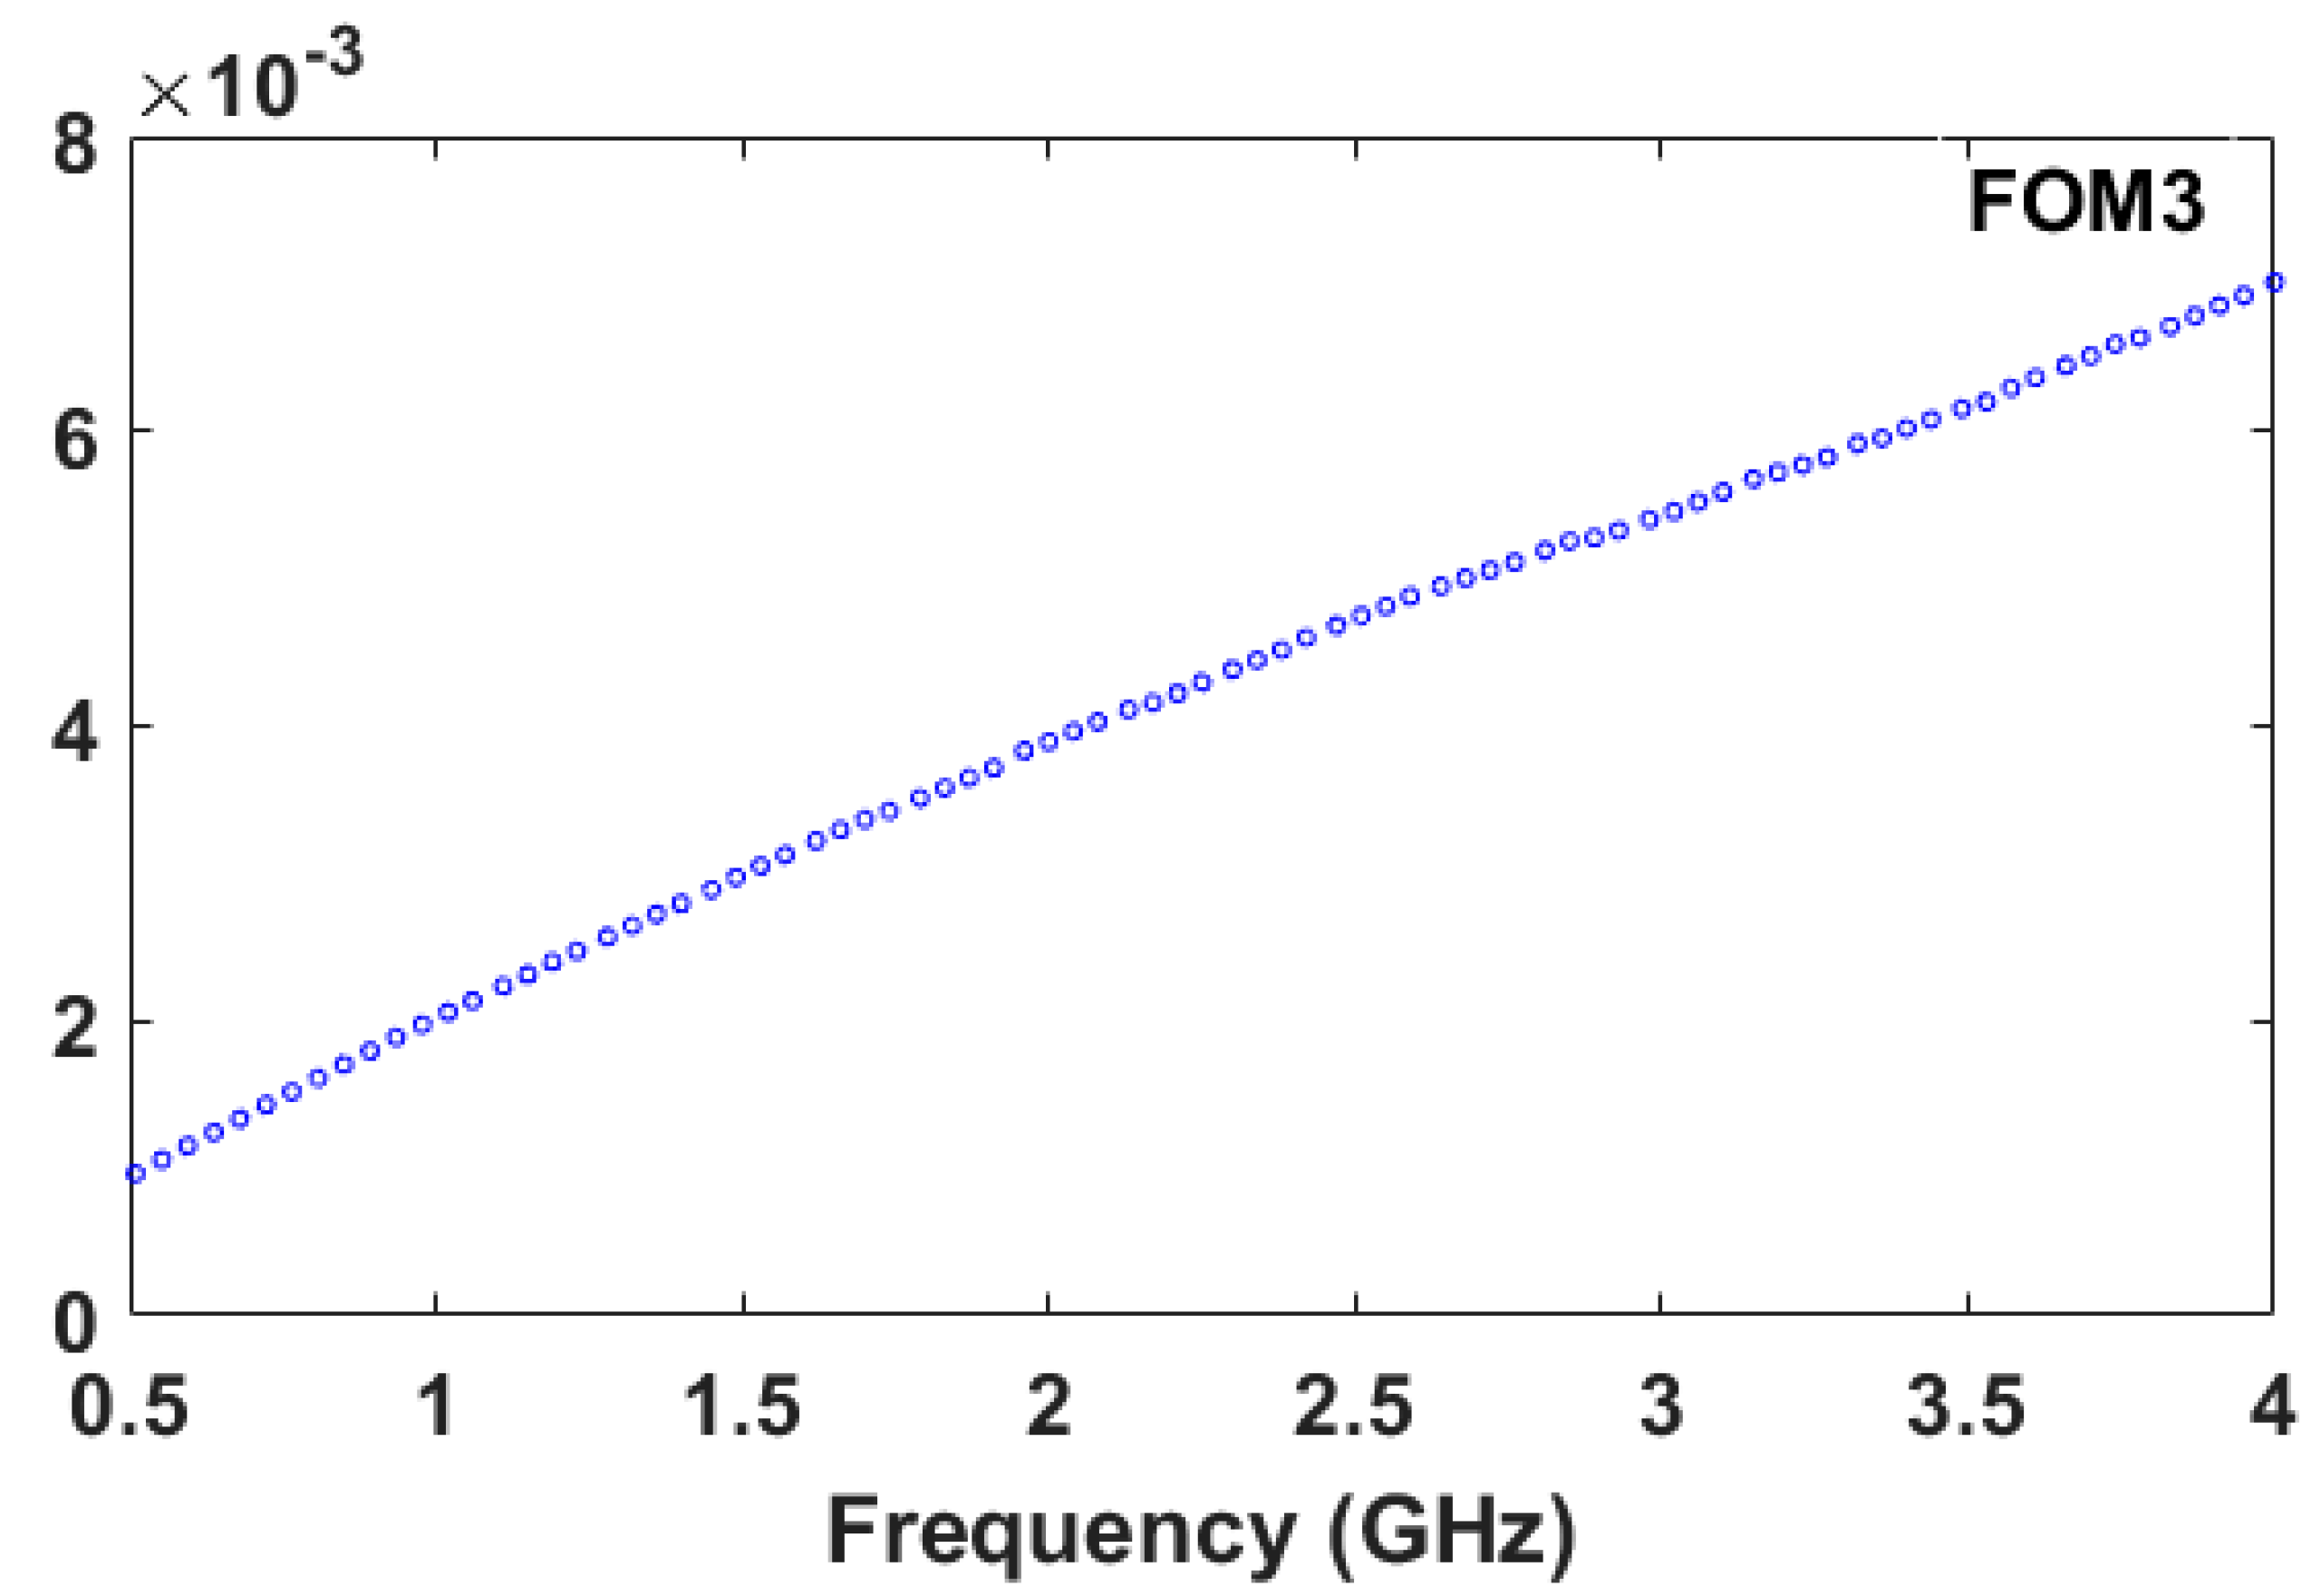
Figure 10 shows the phase constant of the adulterated honey samples with water in the range of 0–30%
w/
w. The phase constant increases when compared to pure honey. The significant change occurs in the frequency range of 1.5–4.0 GHz. A figure of merit (FOM3) for measuring the performance of this technique using the phase constant is given by Equation (12).
Figure 13 depicts the FOM3 in the frequency range of 0.5–4.0 GHz. The maximum FOM3 is equal to 0.007 rad/mm * (%
w/
w)
−1 at the frequency of 4.0 GHz. The frequency of 4.0 GHz is the most suitable frequency when the phase constant is considered the indicator.
From the FOMs, it can be concluded in
Table 2 according to the indicators for measurements.
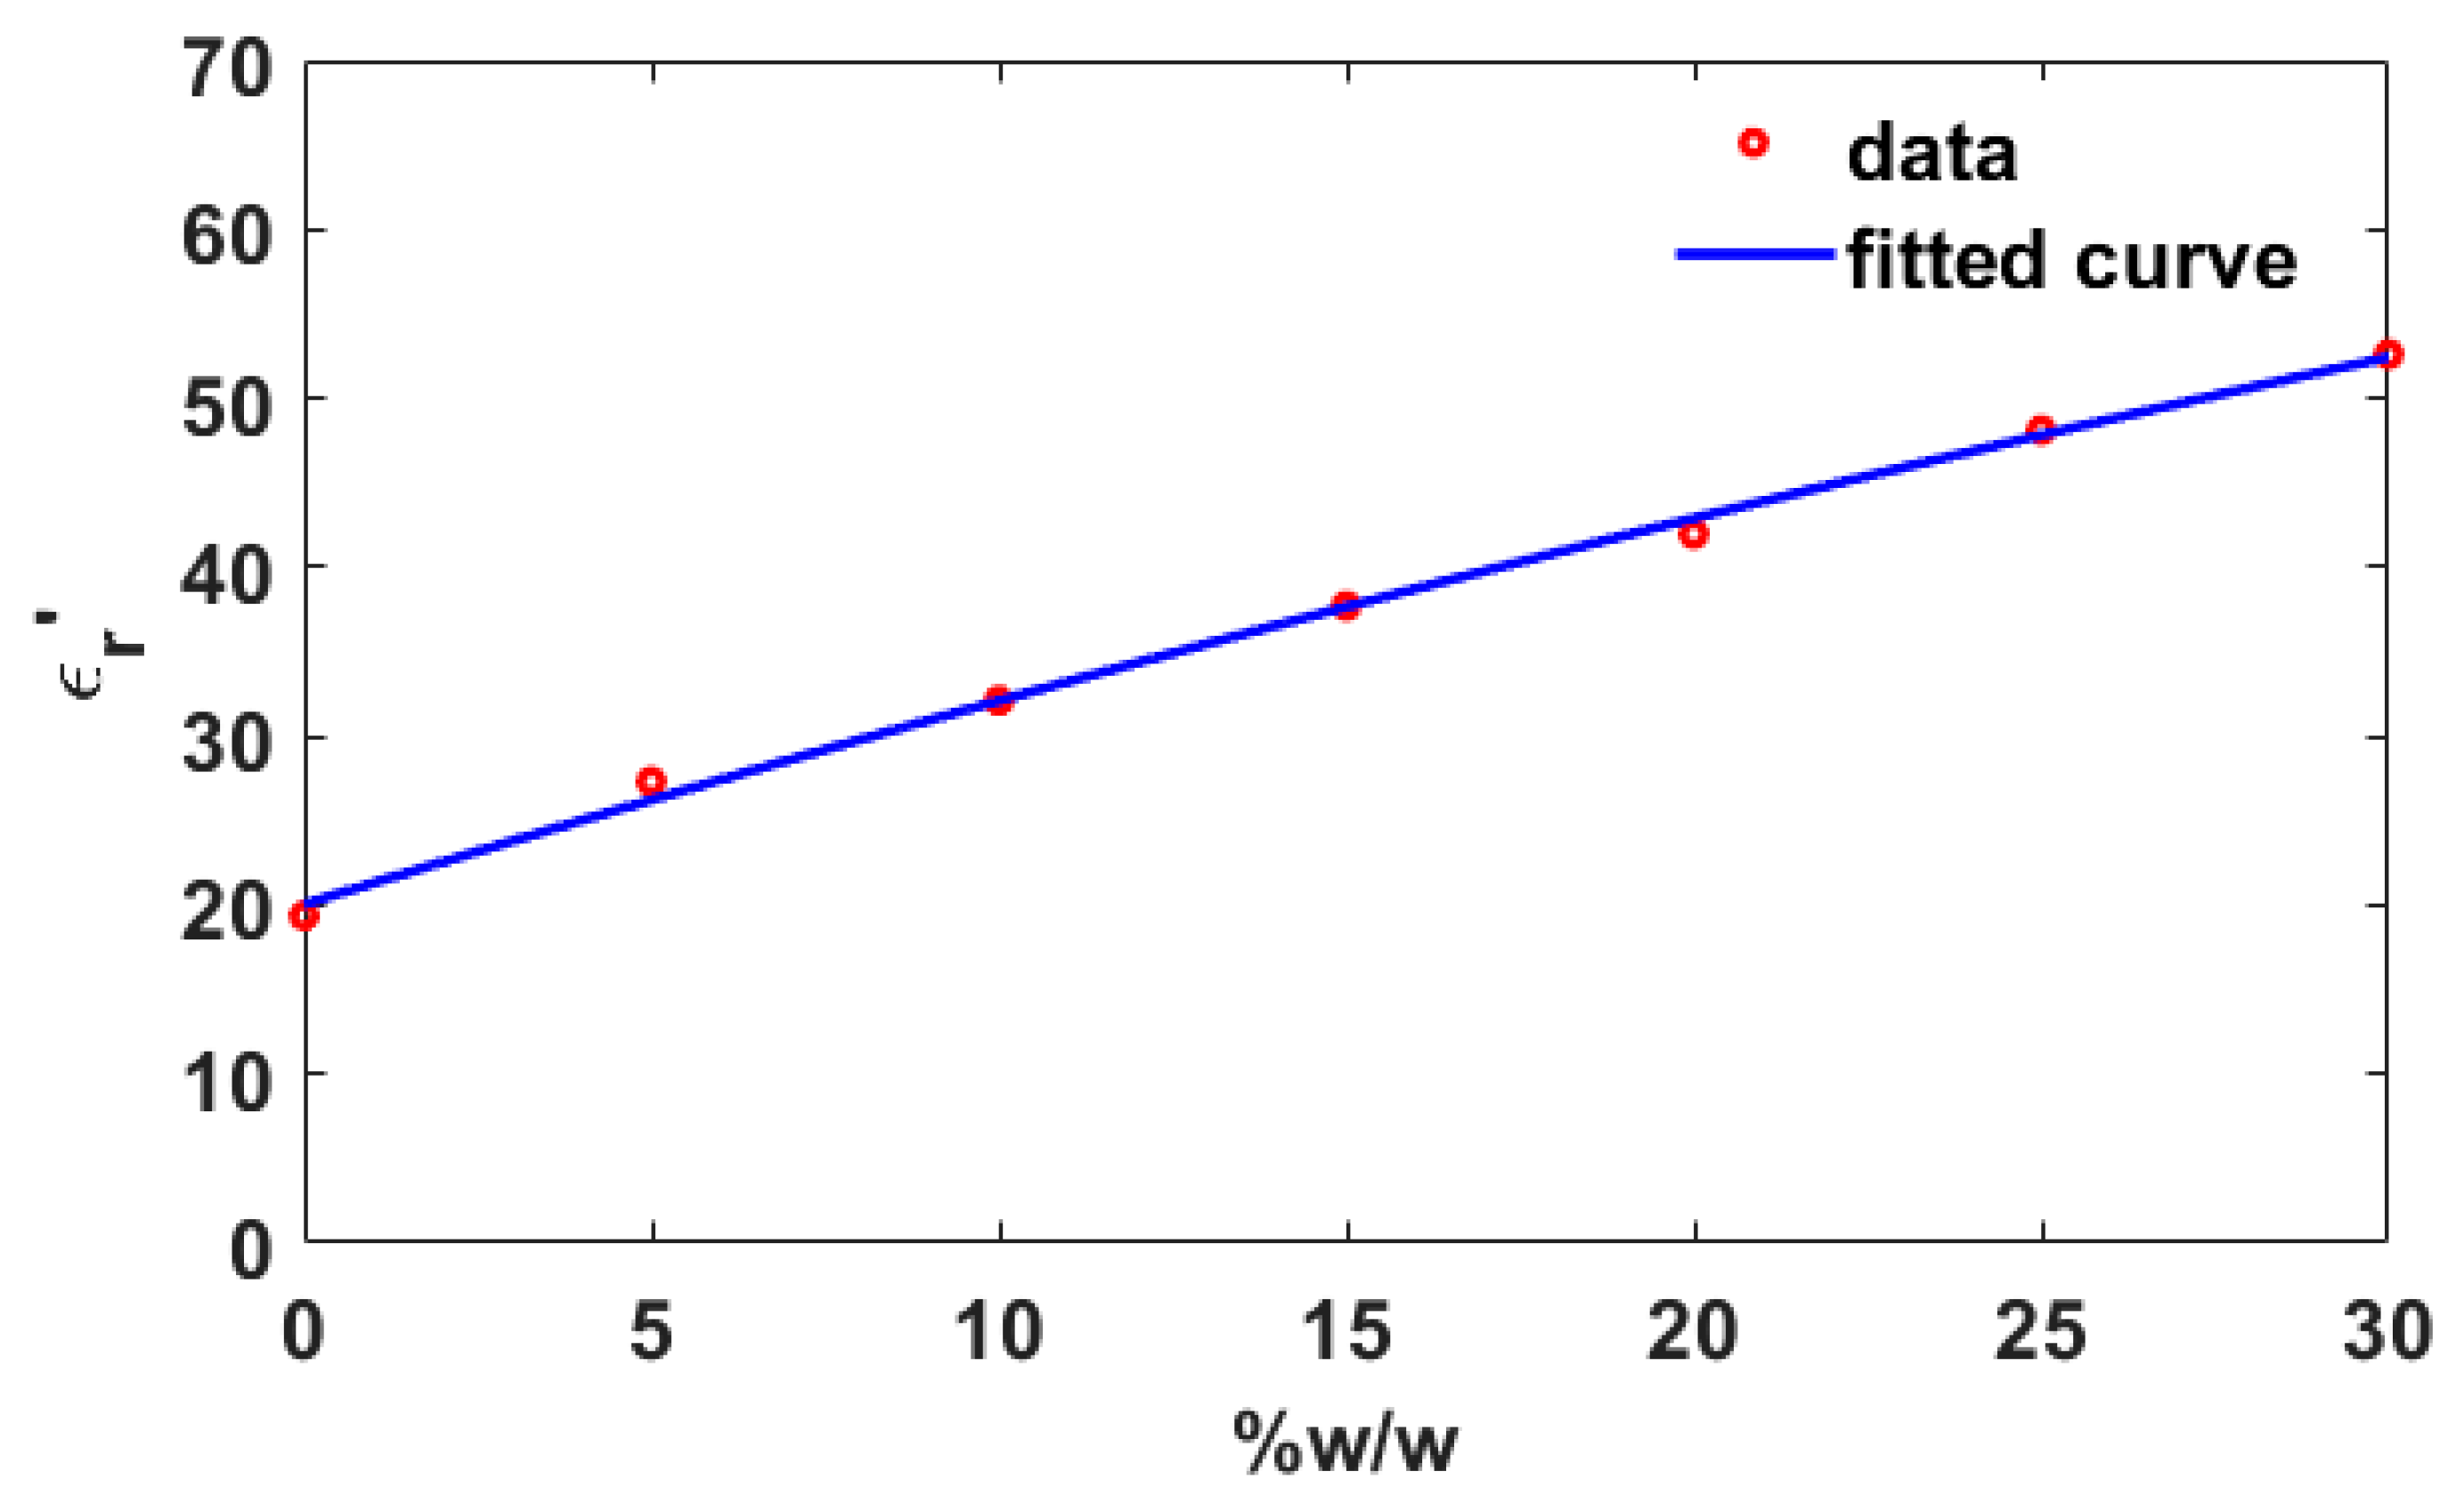
In regression analysis (R
2) for the real part of complex relative permittivity, the electrical conductivity, and the phase constant, curve fitting is the process of determining which model best fits specific curves in the data set. It is found that the real part of complex relative permittivity at the frequency of 0.6 GHz has the polynomial relationship with the adulterations. The relationship is shown in Equation (13) and
Figure 14 shows the curve fitting of real part of relative permittivity at 0.6 GHz on water adulteration in honey samples with R
2 of 0.9968.
where
p1 = −0.006279,
p2 = 1.268,
p3 = 20.05 and x = %
w/
w at 0.6 GHz.
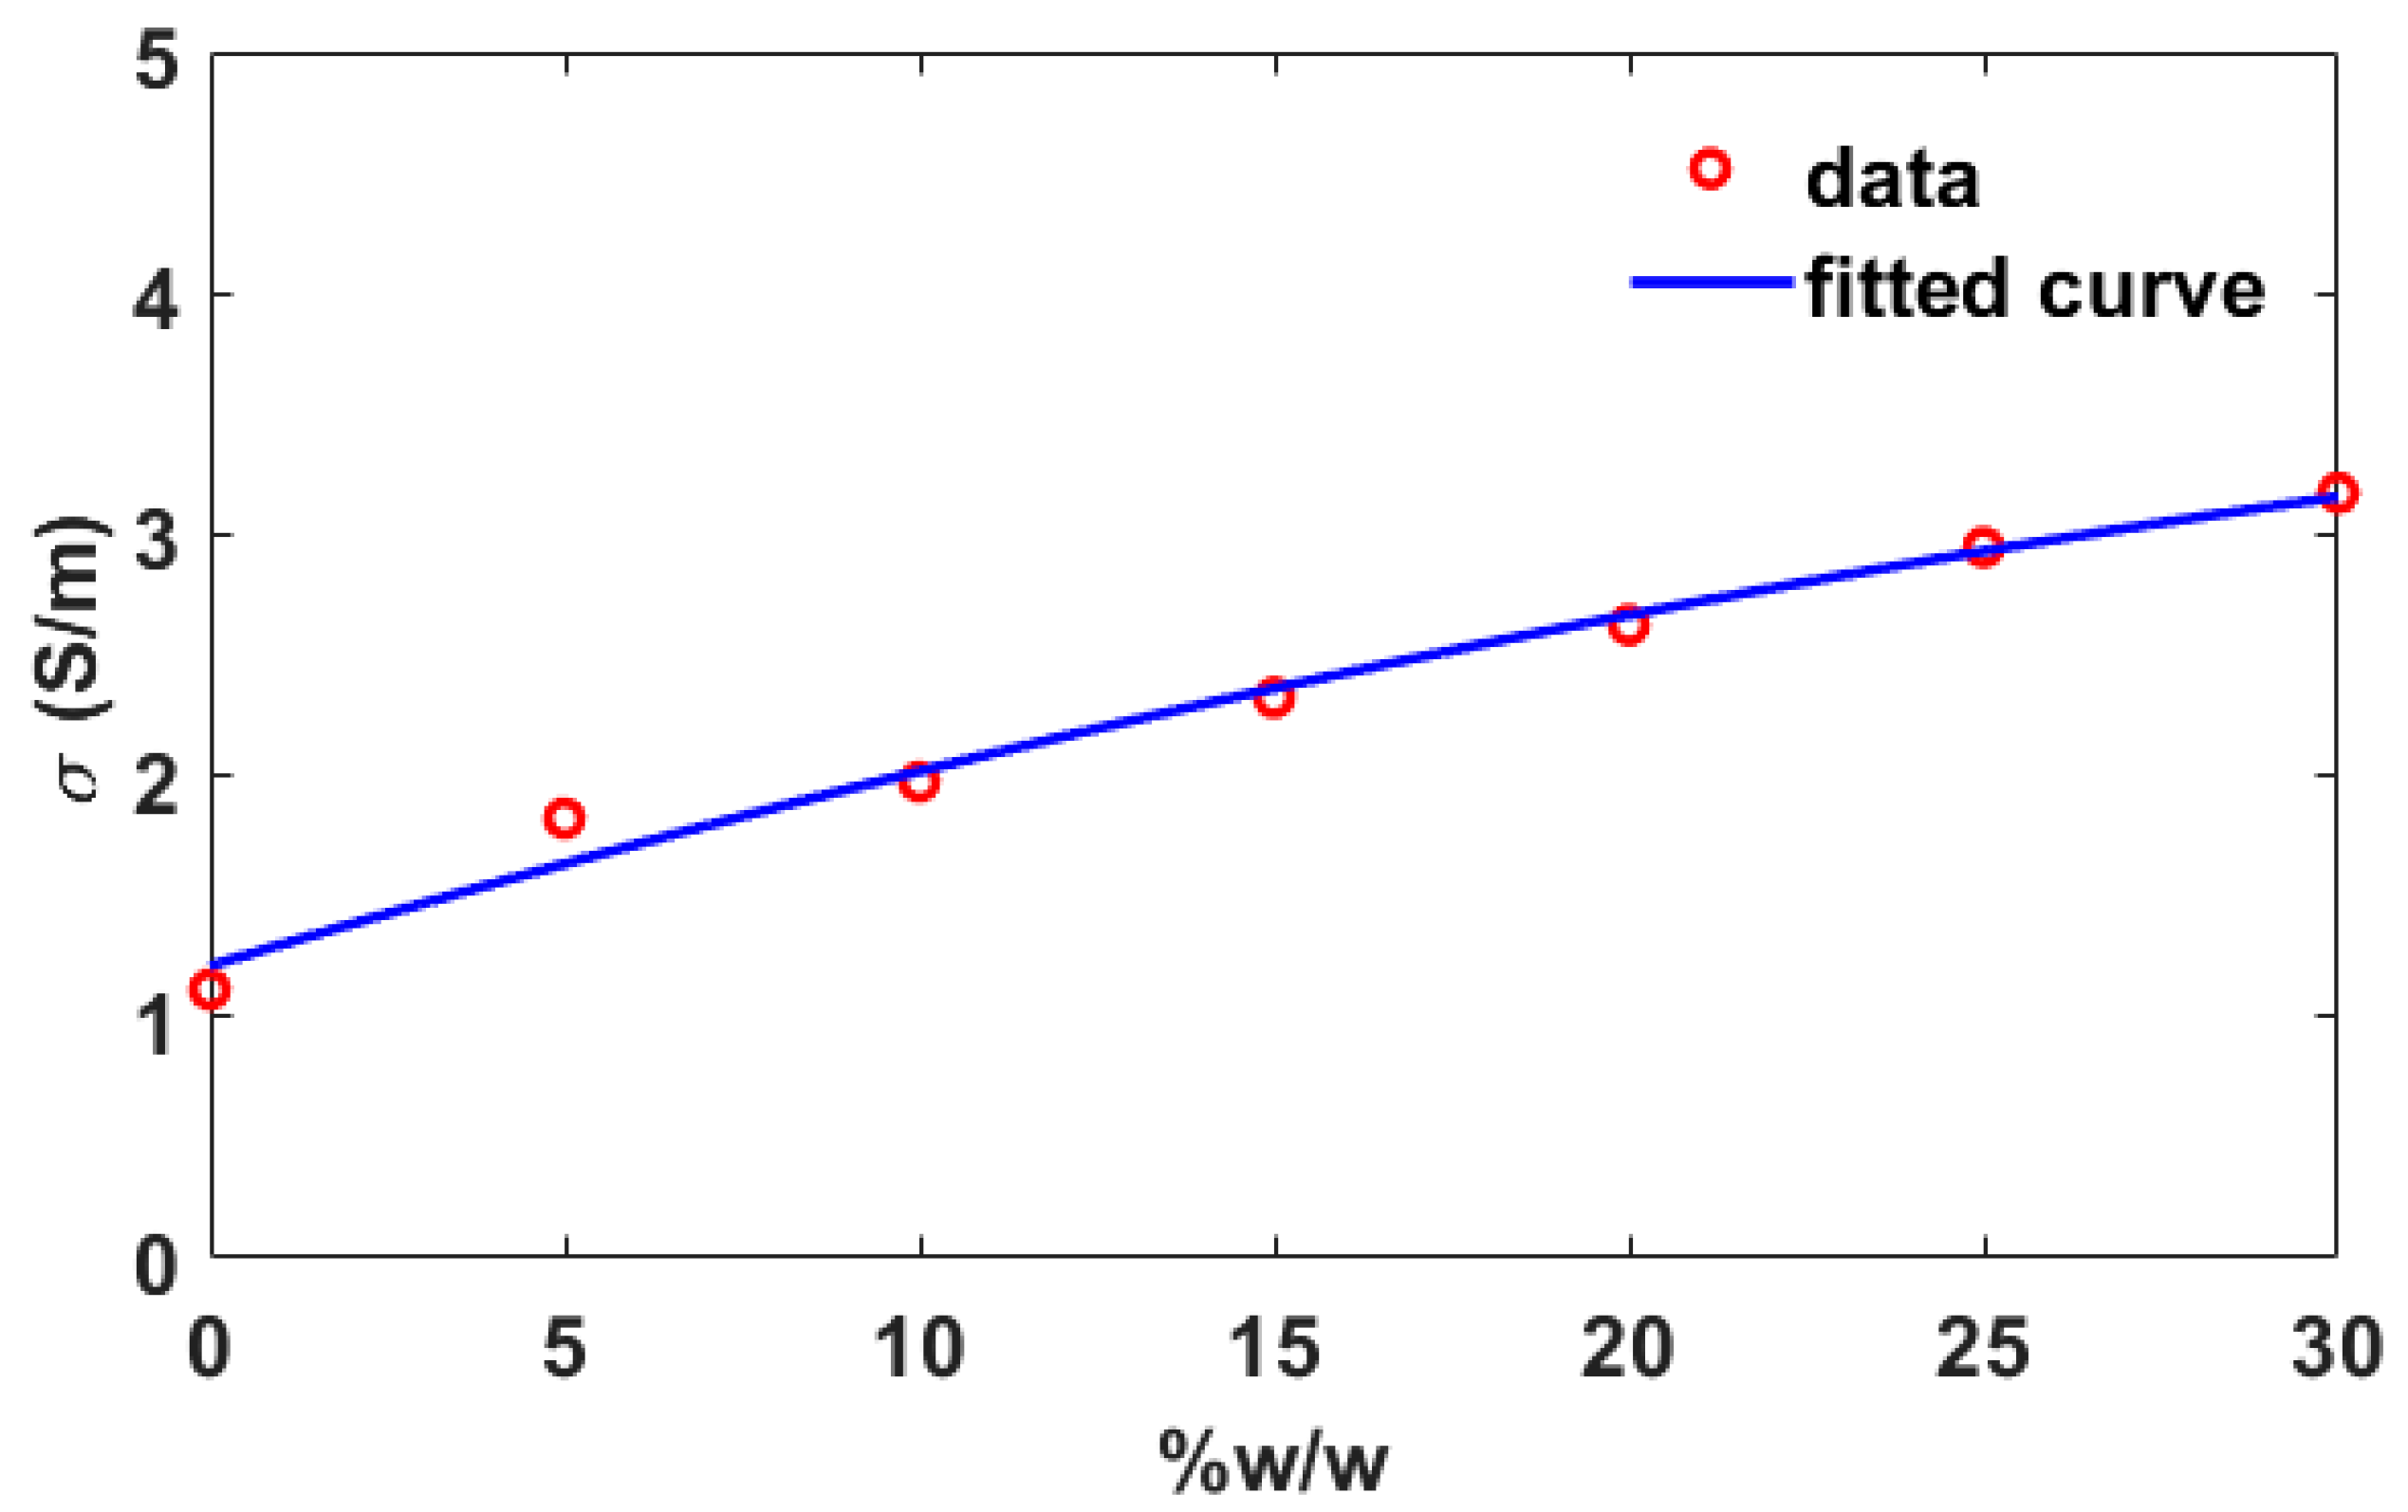
It is found in the regression analysis for electrical conductivity that the electrical conductivity at the frequency of 3.74 GHz has the polynomial relationship with the adulterations. Equation (14) shows the relationship and
Figure 15 shows the curve fitting of electrical conductivity at 3.74 GHz on water adulteration in honey samples with R
2 of 0.9833.
where
p1 = −0.0007925,
p2 = 0.08857,
p3 = 1.212 and x = %
w/
w at 3.74 GHz.
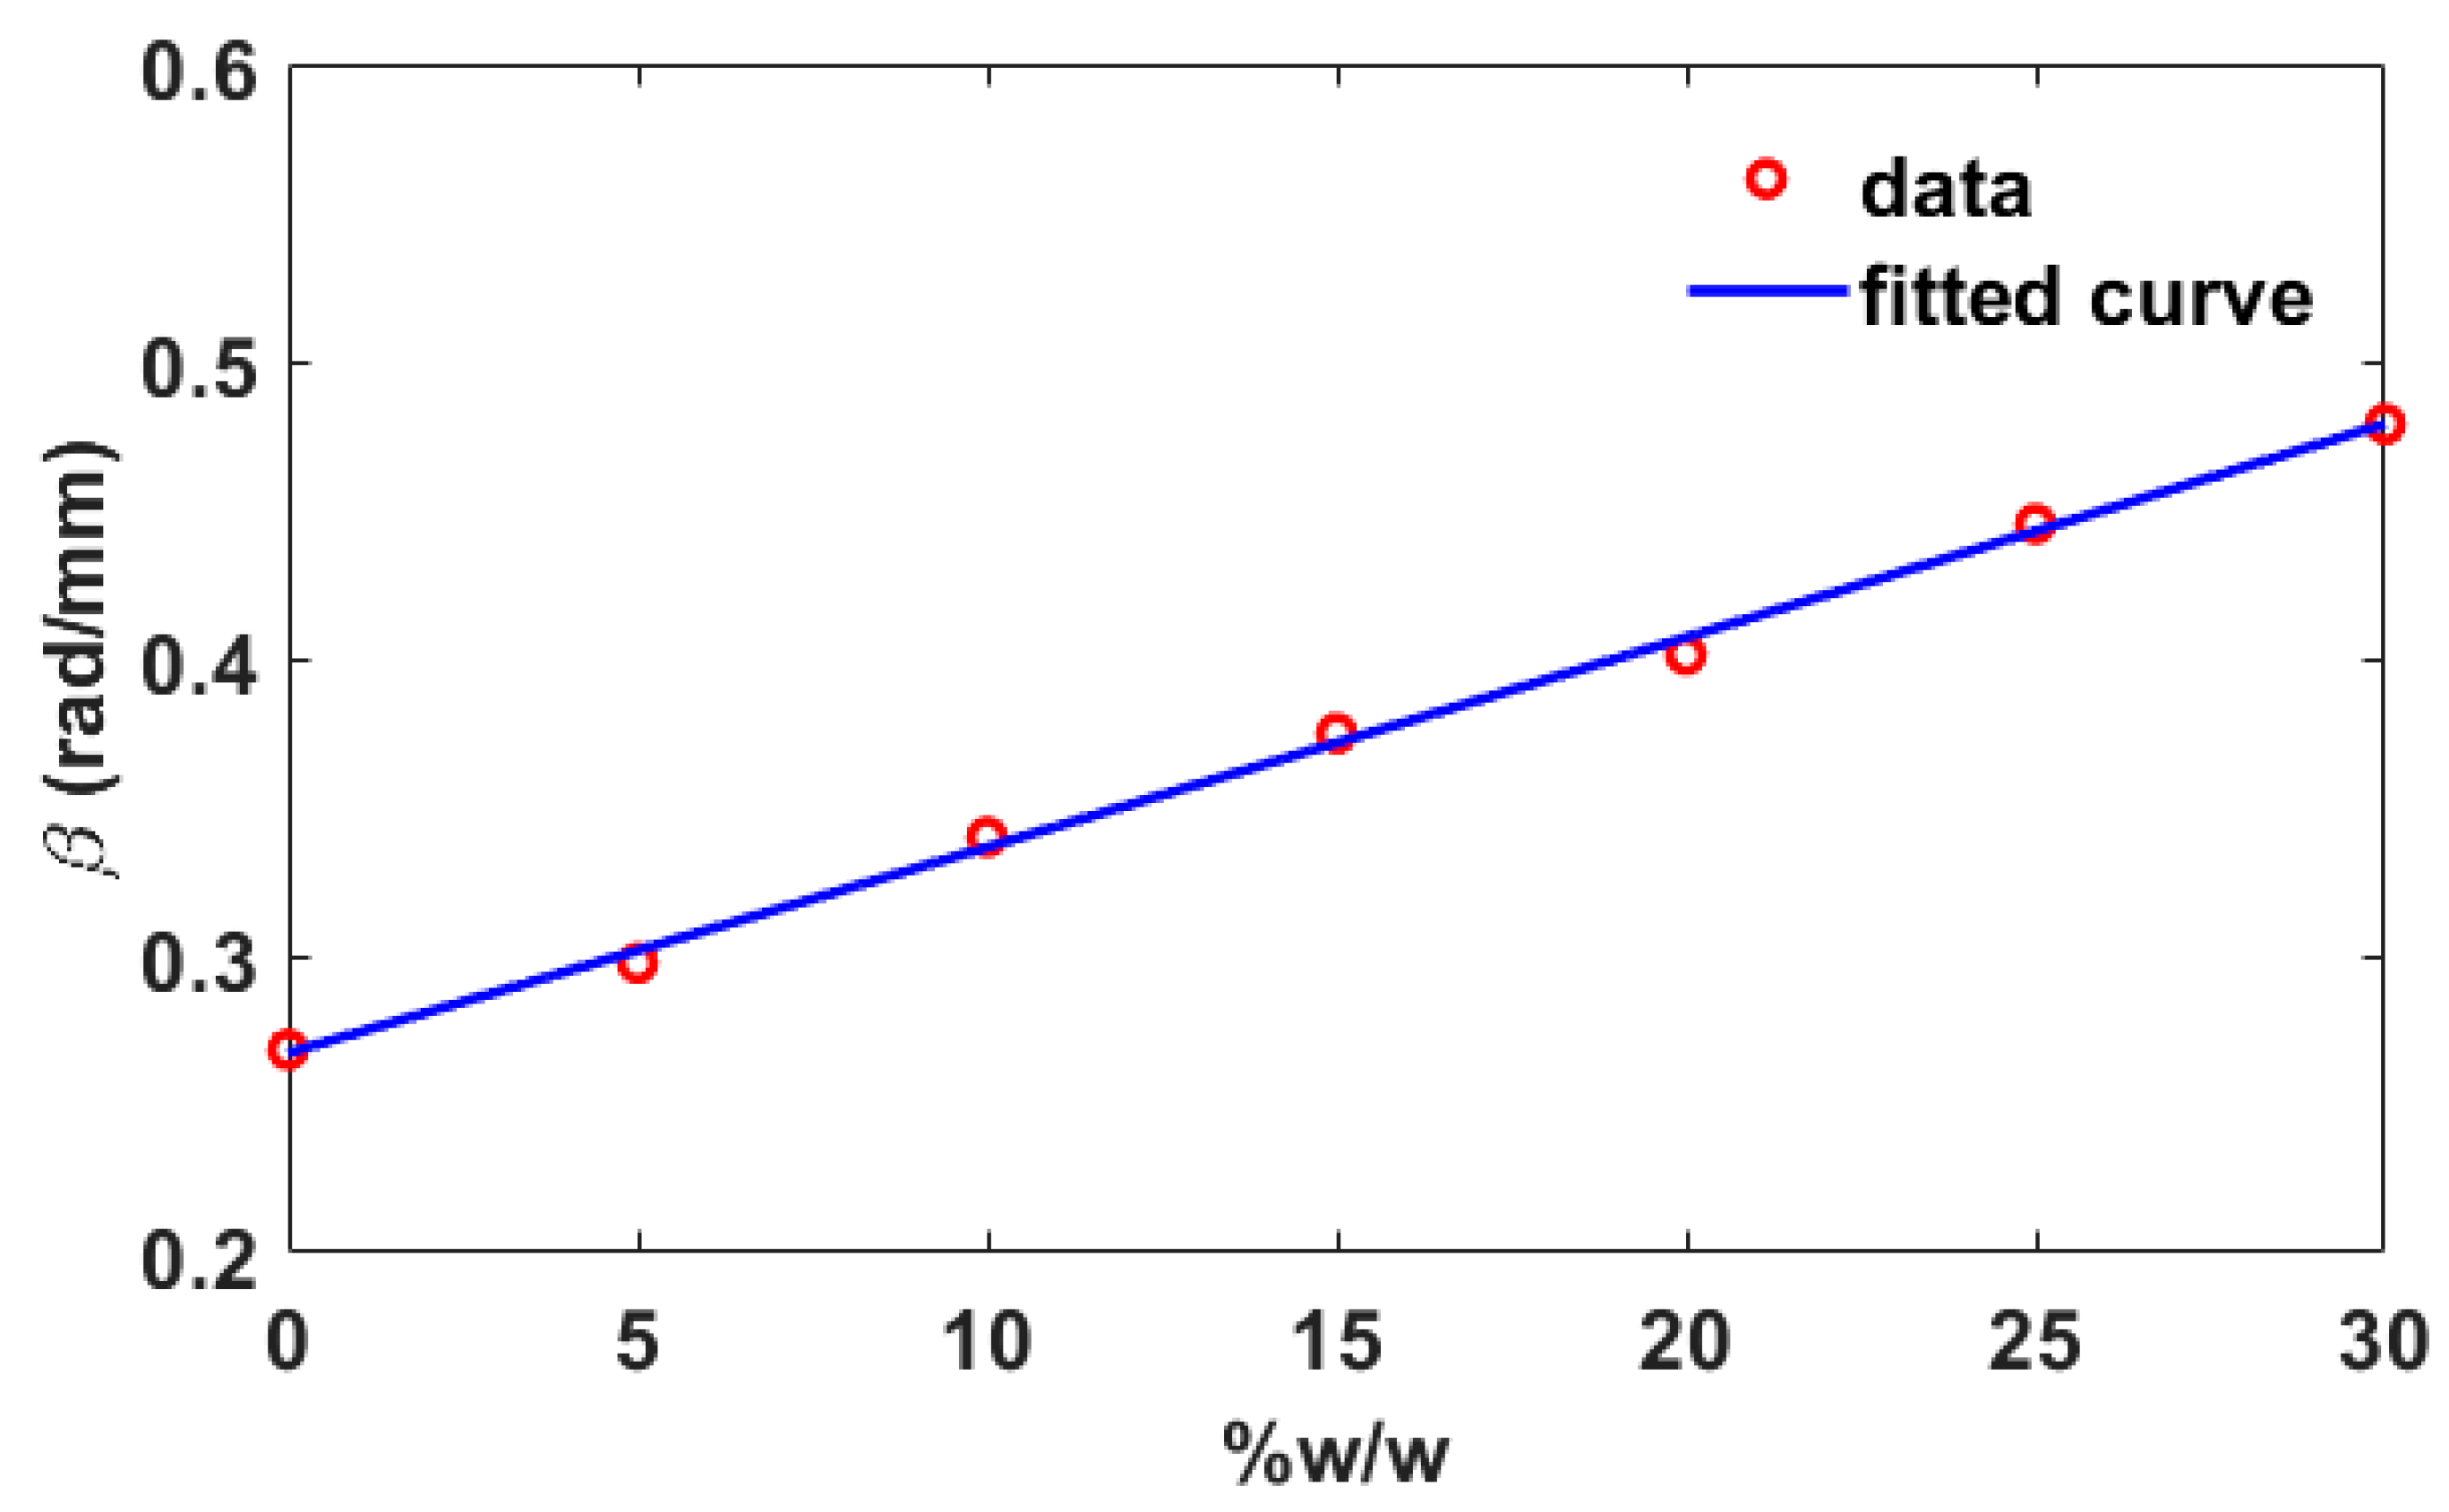
In the regression analysis for phase constant, it is found that the phase constant at the frequency of 4.0 GHz has the polynomial relationship with the adulterations. Equation (15) shows the equation and
Figure 16 shows the regression of phase constant at 4.0 GHz on water adulteration in honey samples with R
2 of 0.9977.
where
p1 = 6.634 × 10
−6,
p2 = 0.006855,
p3 = 0.2673 and x = %
w/
w at 4.0 GHz.
From the curve fittings, it is shown that the real part of complex relative permittivity, the electrical conductivity, and the phase constant models given in Equations (13)–(15) could accurately describe the real part of permittivity (0.6 GHz), the electrical conductivity (3.74 GHz), and the phase constant (4.0 GHz) with the water adulteration in honey samples, respectively.
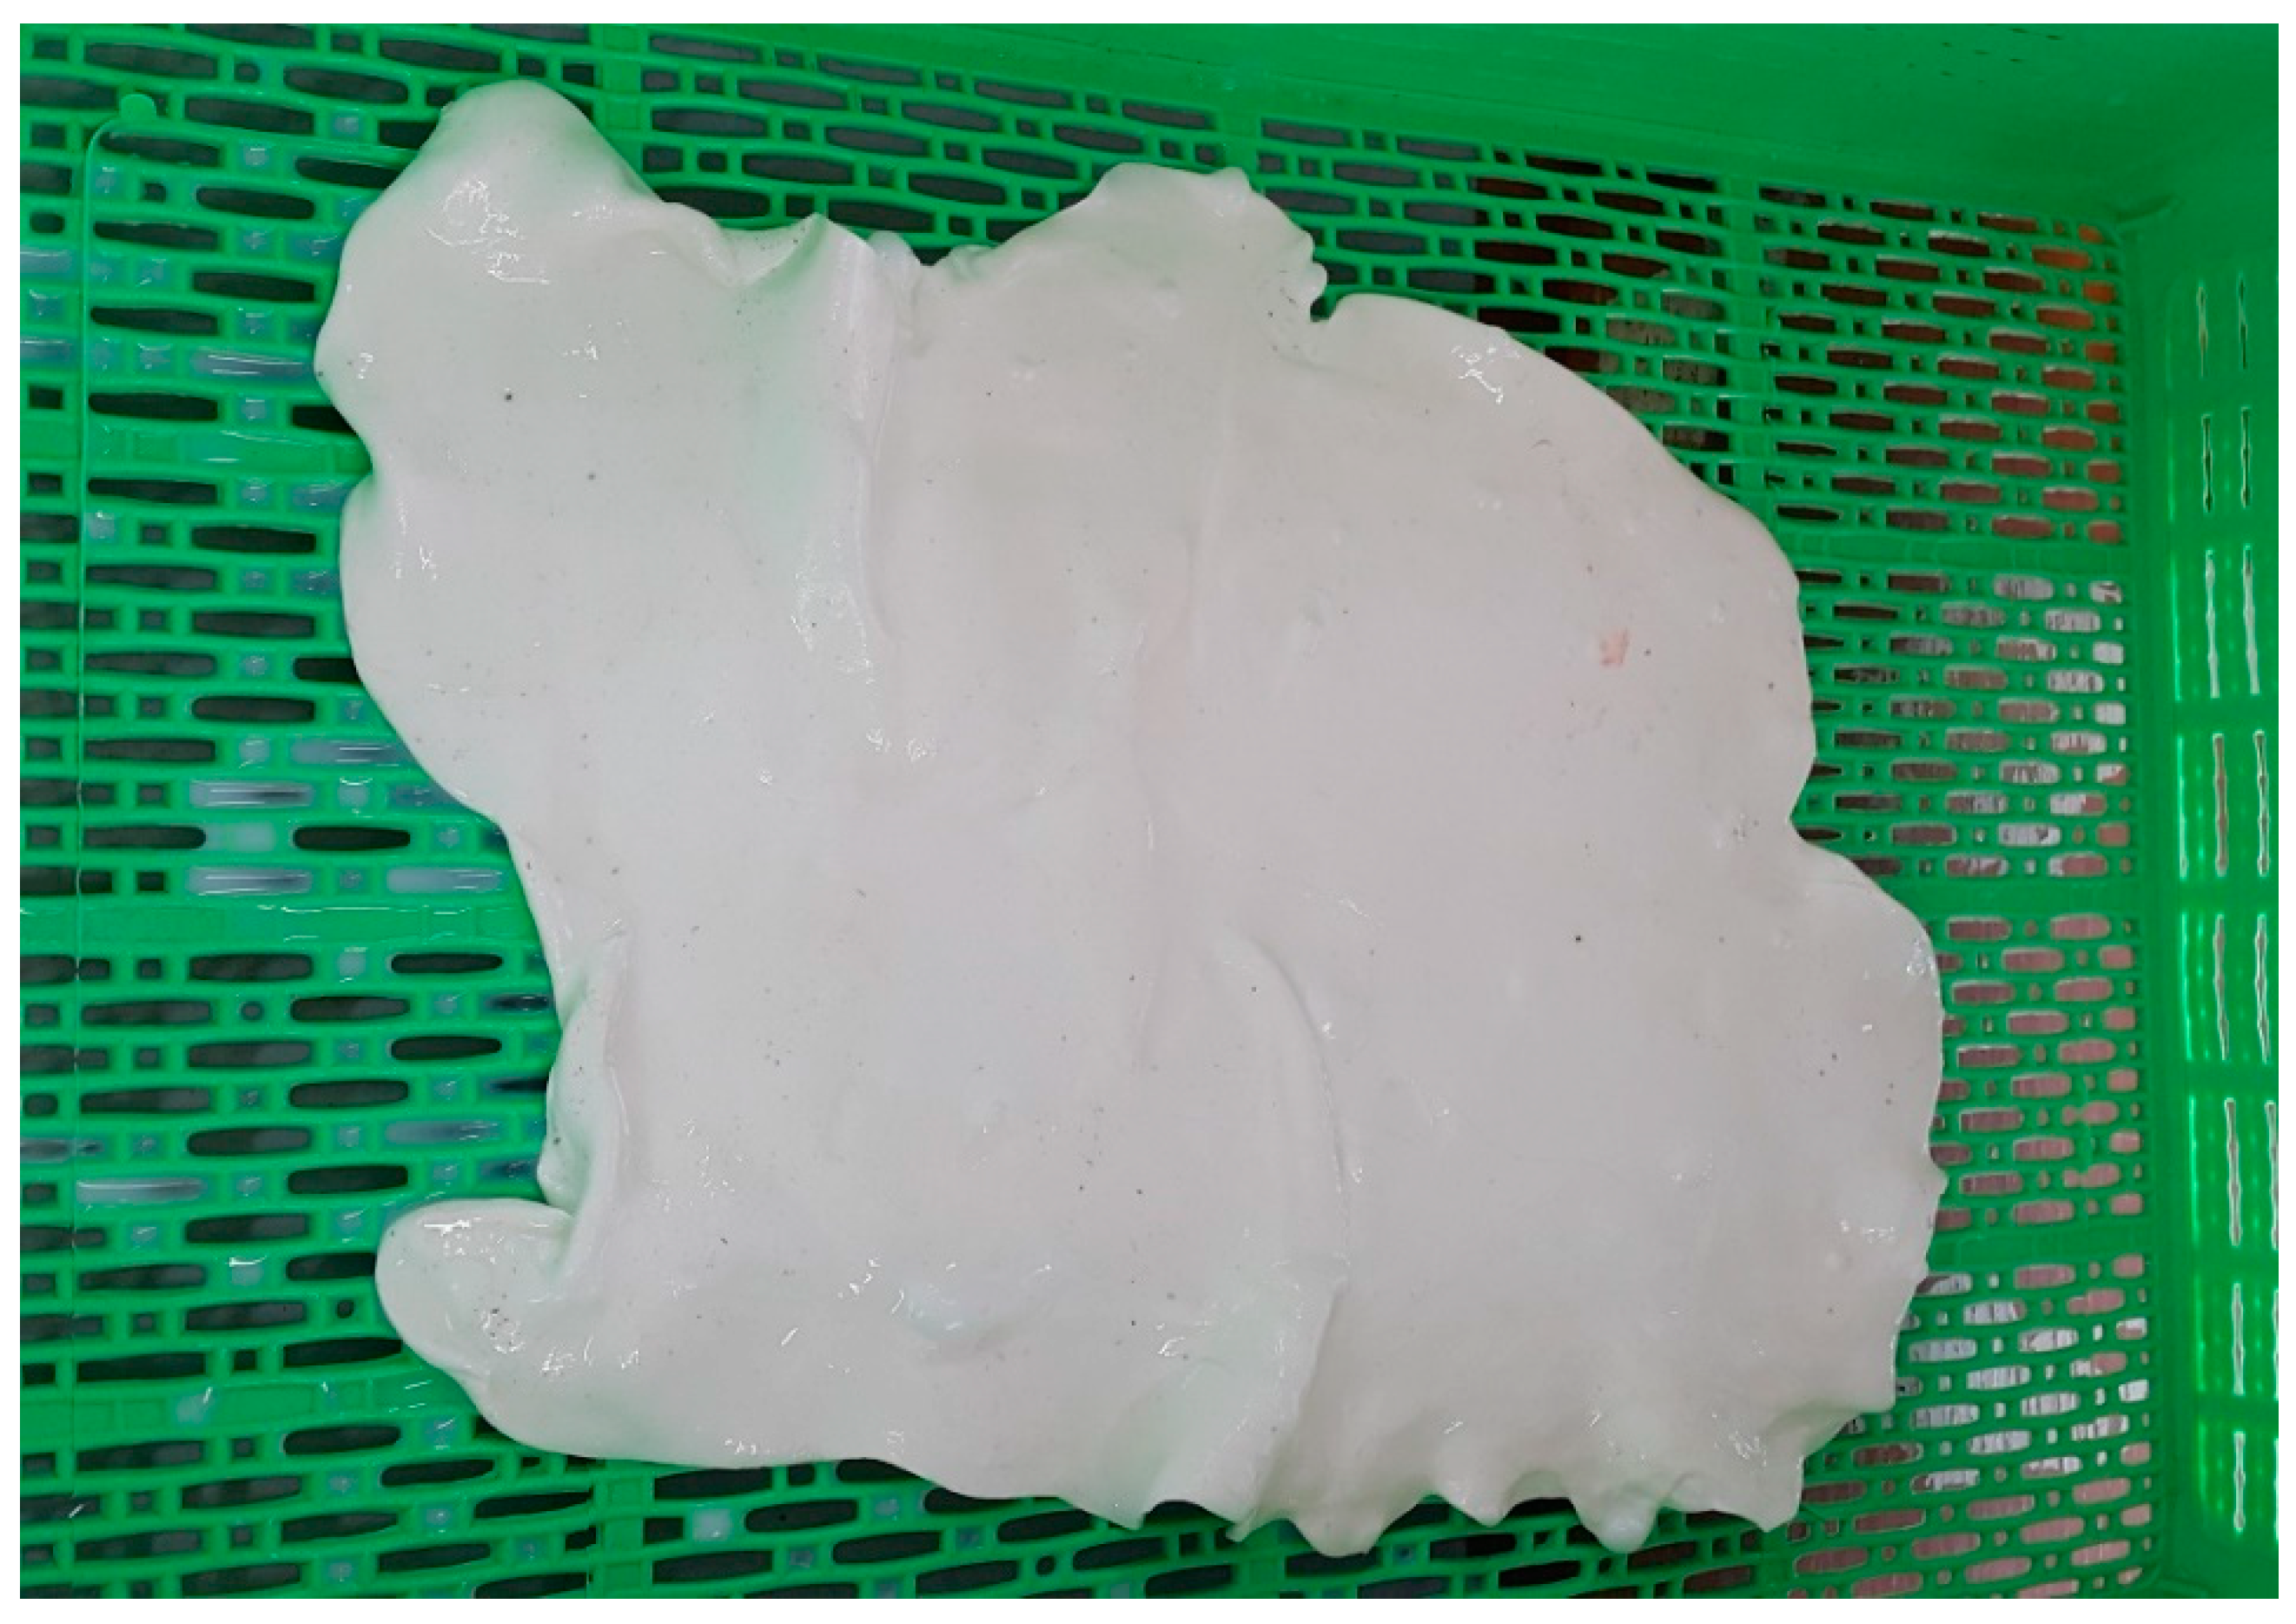
The proposed technique is successful in determination of the complex relative permittivity of the honey samples. Further study is performed on the natural latex samples to obtain the initial results. The experimental setup is shown in
Figure 5. After the measurement is performed, the dry rubber content (DRC) of the natural latex is determined as shown in
Figure 17. The obtained DRC is 35.27%
w/
w.
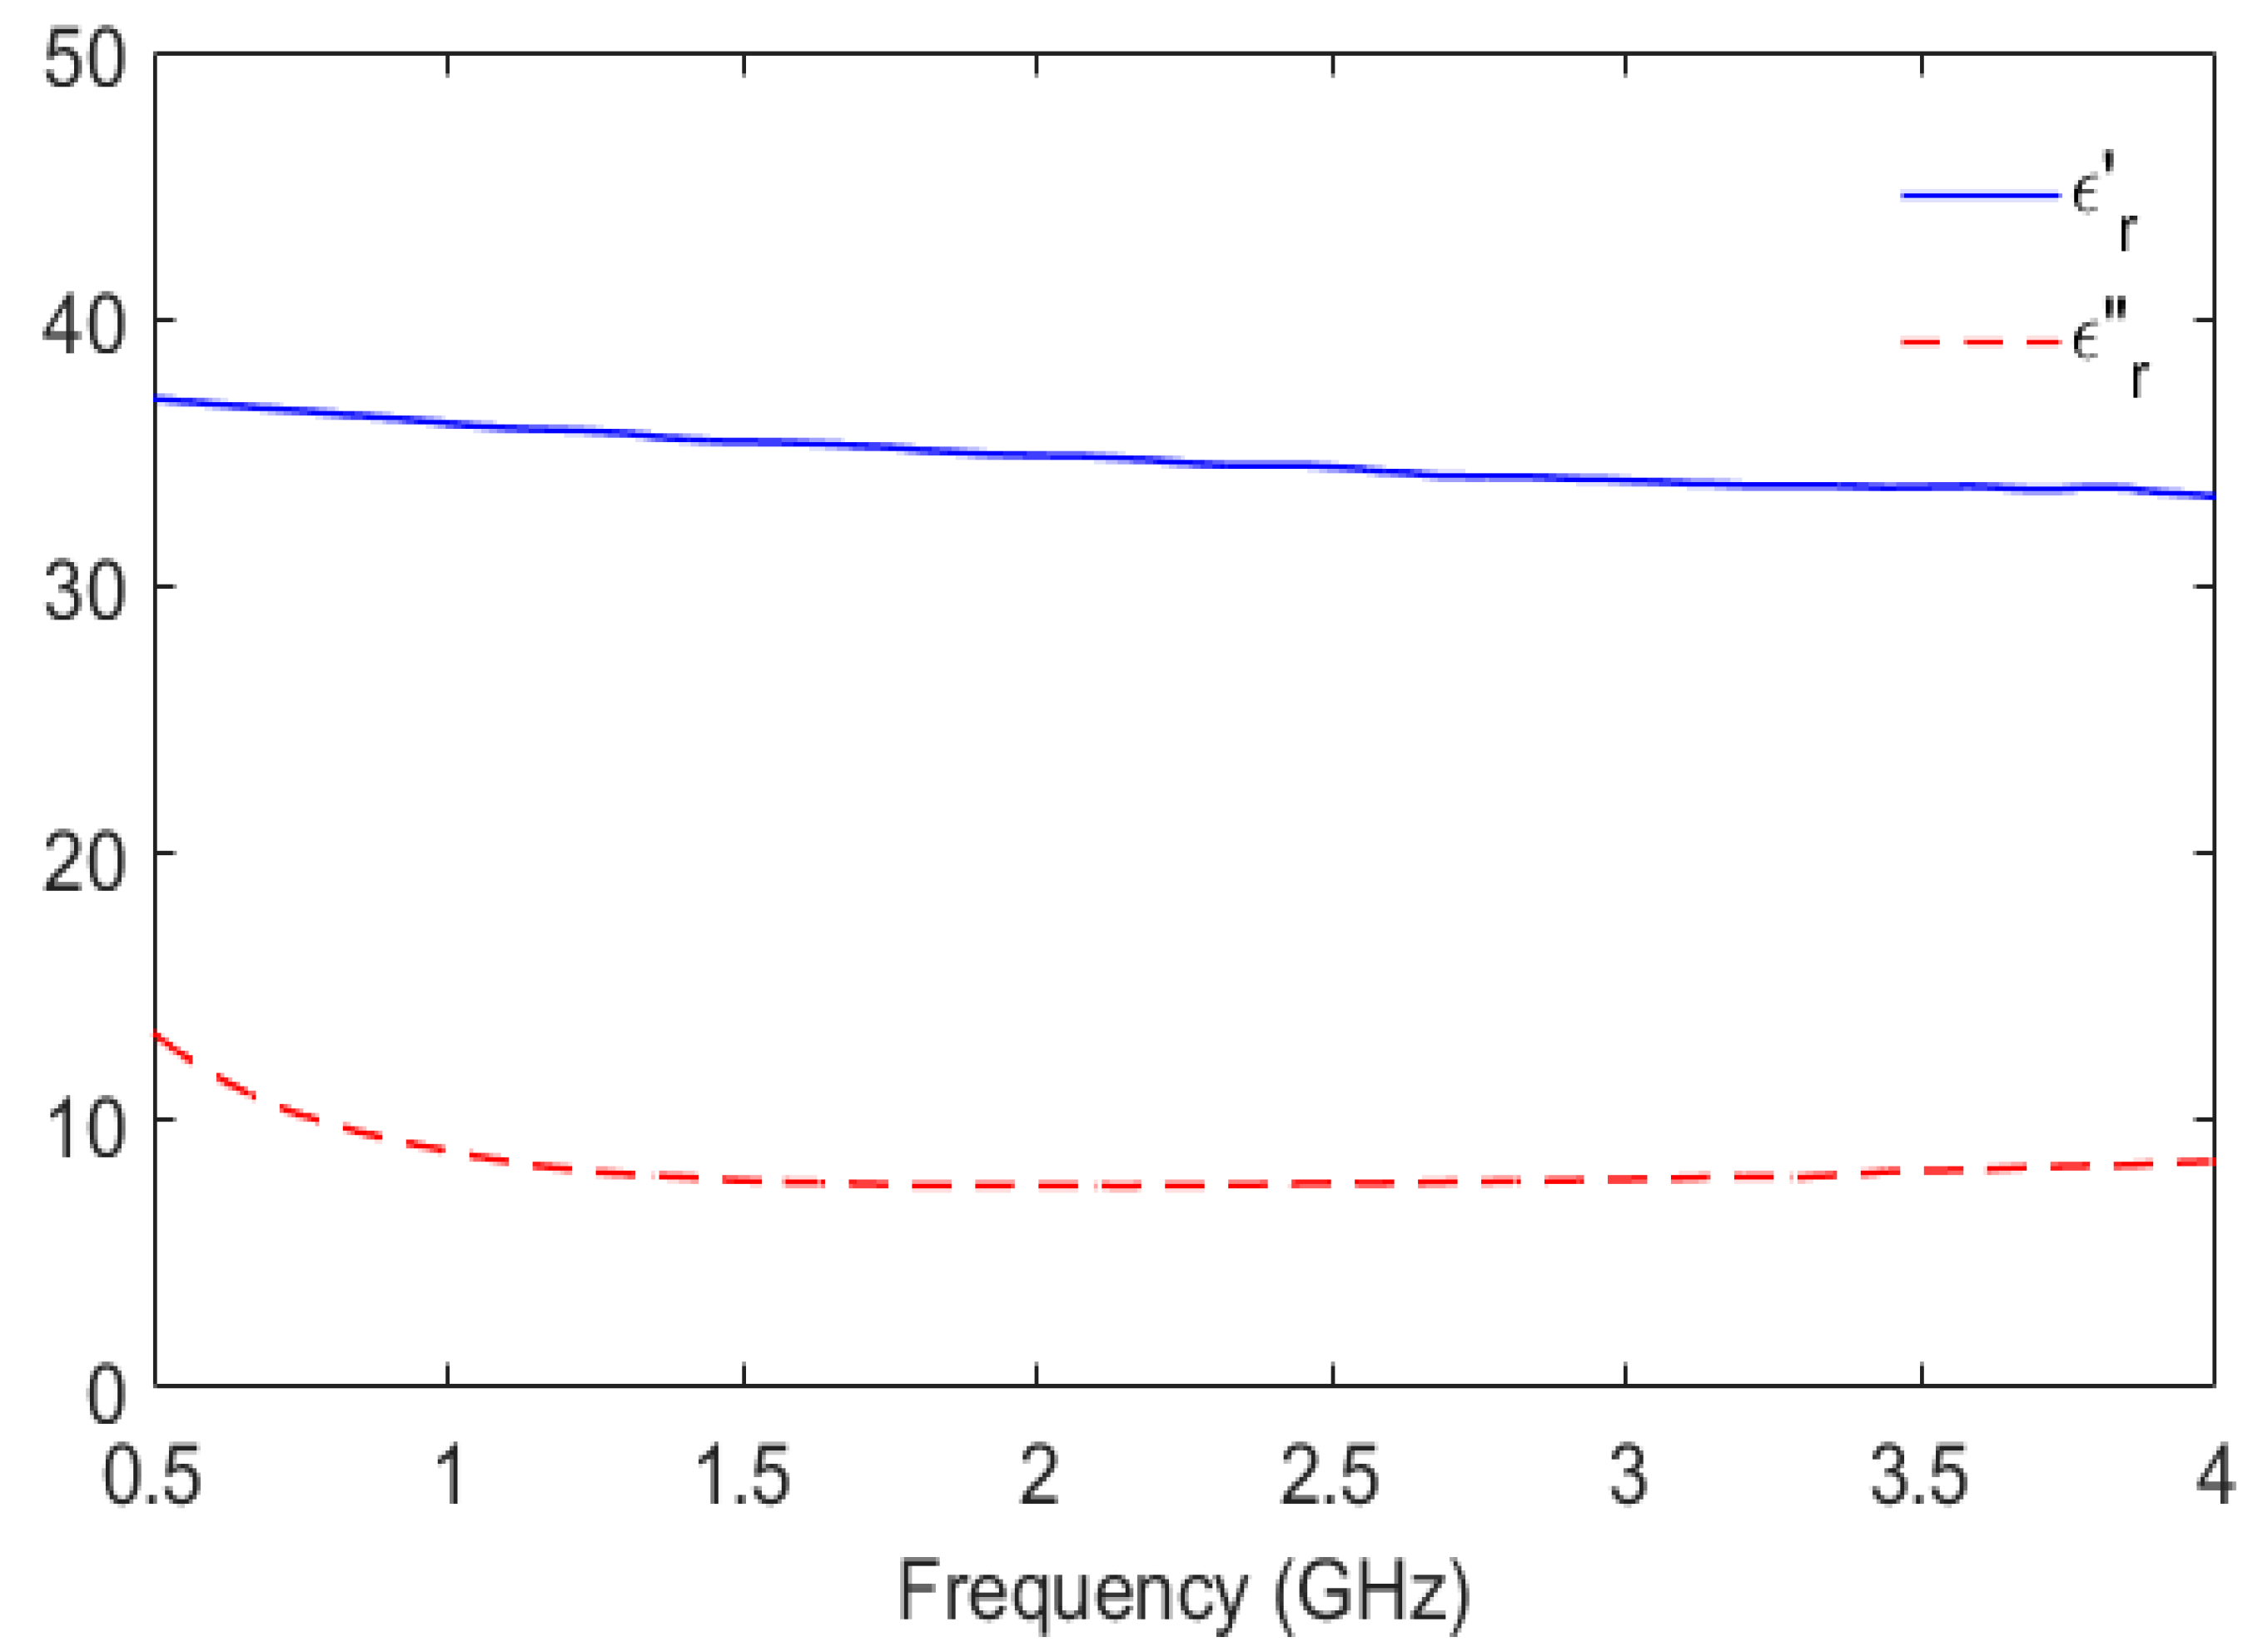
In
Figure 18, the proposed technique can be used to determine the complex relative permittivity of the natural latex samples. The real part is in the range of 34–37 while the imaginary ranges from 7–14. From the results in
Figure 18, it is possible to apply the proposed sensor to determine the DRC in different concentrations and choose the suitable frequency for the determination of the DRC.
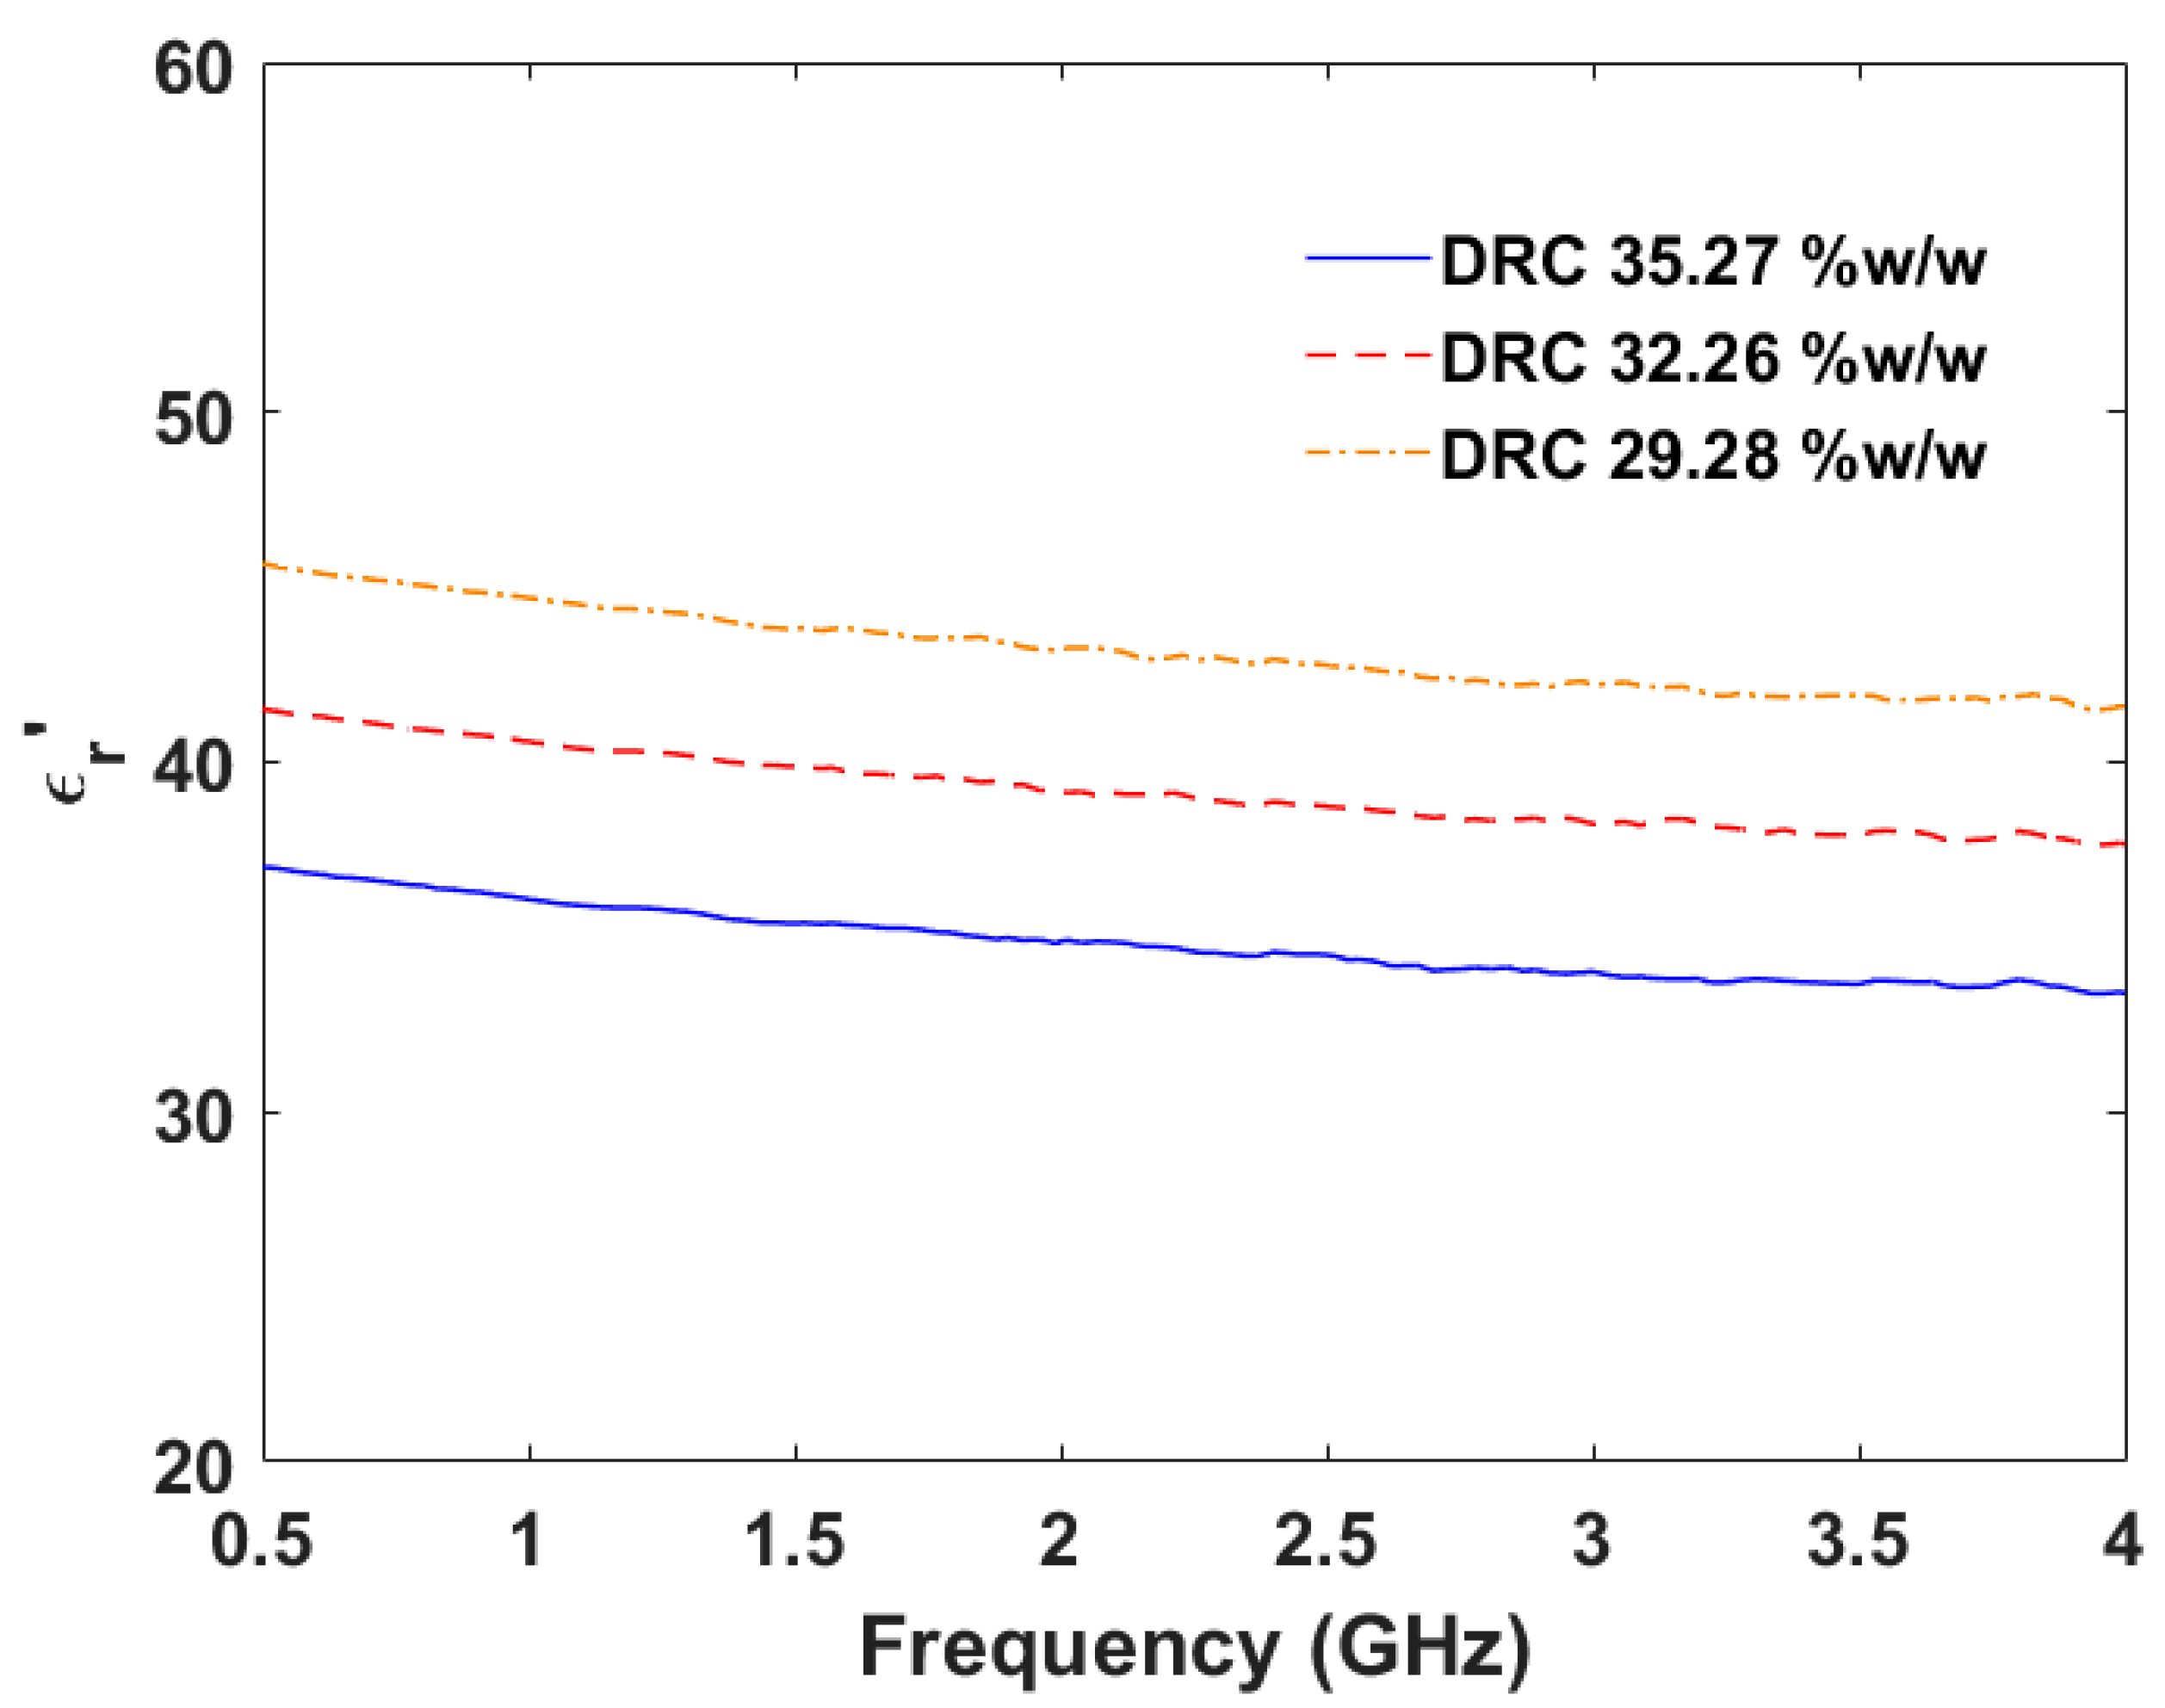
Generally, DRC is inversely proportional to the water content of the natural latex sample. In the experiments for the natural latex samples with DRC in the range of 29.28–35.27%
w/
w, the complex relative permittivity, the electrical conductivity, and the phase constant of the natural latex samples at different frequencies are calculated and shown in
Figure 19,
Figure 20,
Figure 21 and
Figure 22, respectively. In
Figure 19, when the DRC decreases due to the increasing water content in the natural latex samples, the real part of the complex relative permittivity increases over the frequency range of 0.5–4.0 GHz because of the high real part of the complex relative permittivity of water [
23]. Therefore, the real part of the complex relative permittivity of natural latex samples increases as well. The maximum FOM1 is equal to 1.4462 (%
w/
w)
−1 at the frequency of 0.5 GHz. The frequency of 0.5 GHz is the most suitable frequency when the real part of the complex relative permittivity is considered the indicator.
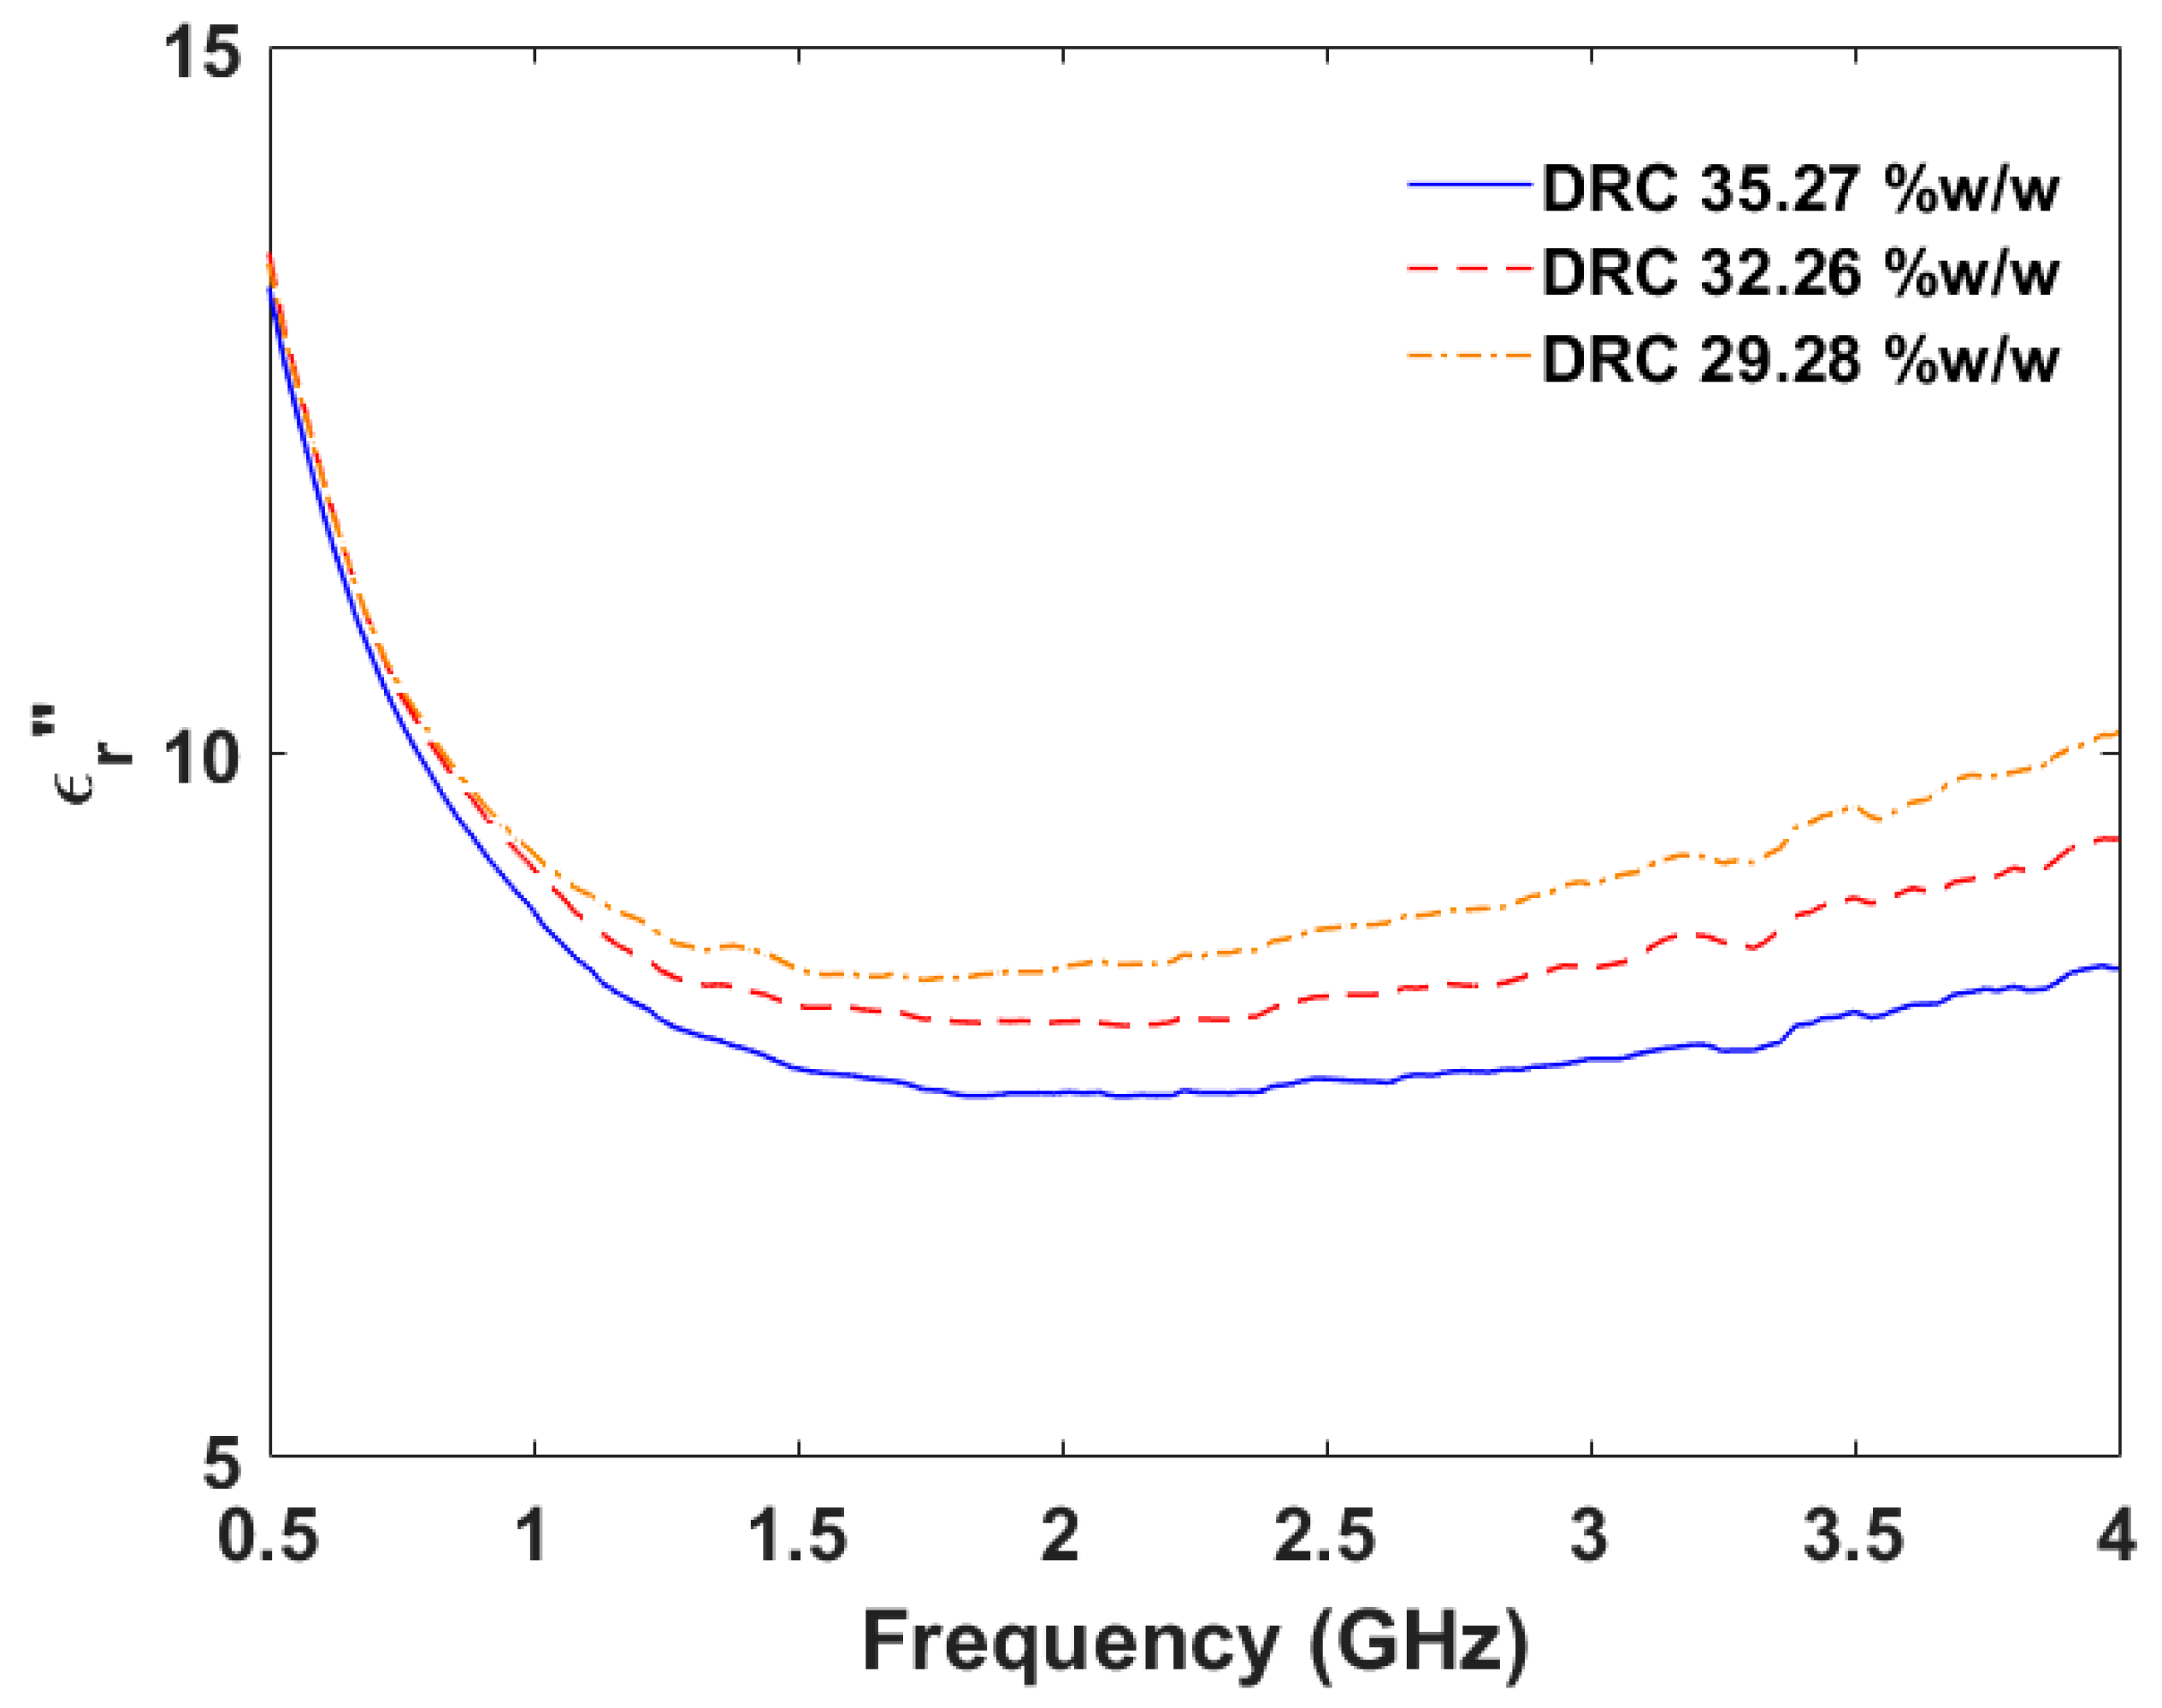
Figure 20 shows the imaginary part of complex relative permittivity of the natural samples with different DRCs. The imaginary part of the complex relative permittivity increases when the DRC in the natural latex sample decreases. The maximum figure of merit is equal to 0.2759 (%
w/
w)
−1 at the frequency of 4.0 GHz. Therefore, the frequency of 4.0 GHz is the most appropriate frequency when the imaginary part of the complex relative permittivity is considered the indicator.
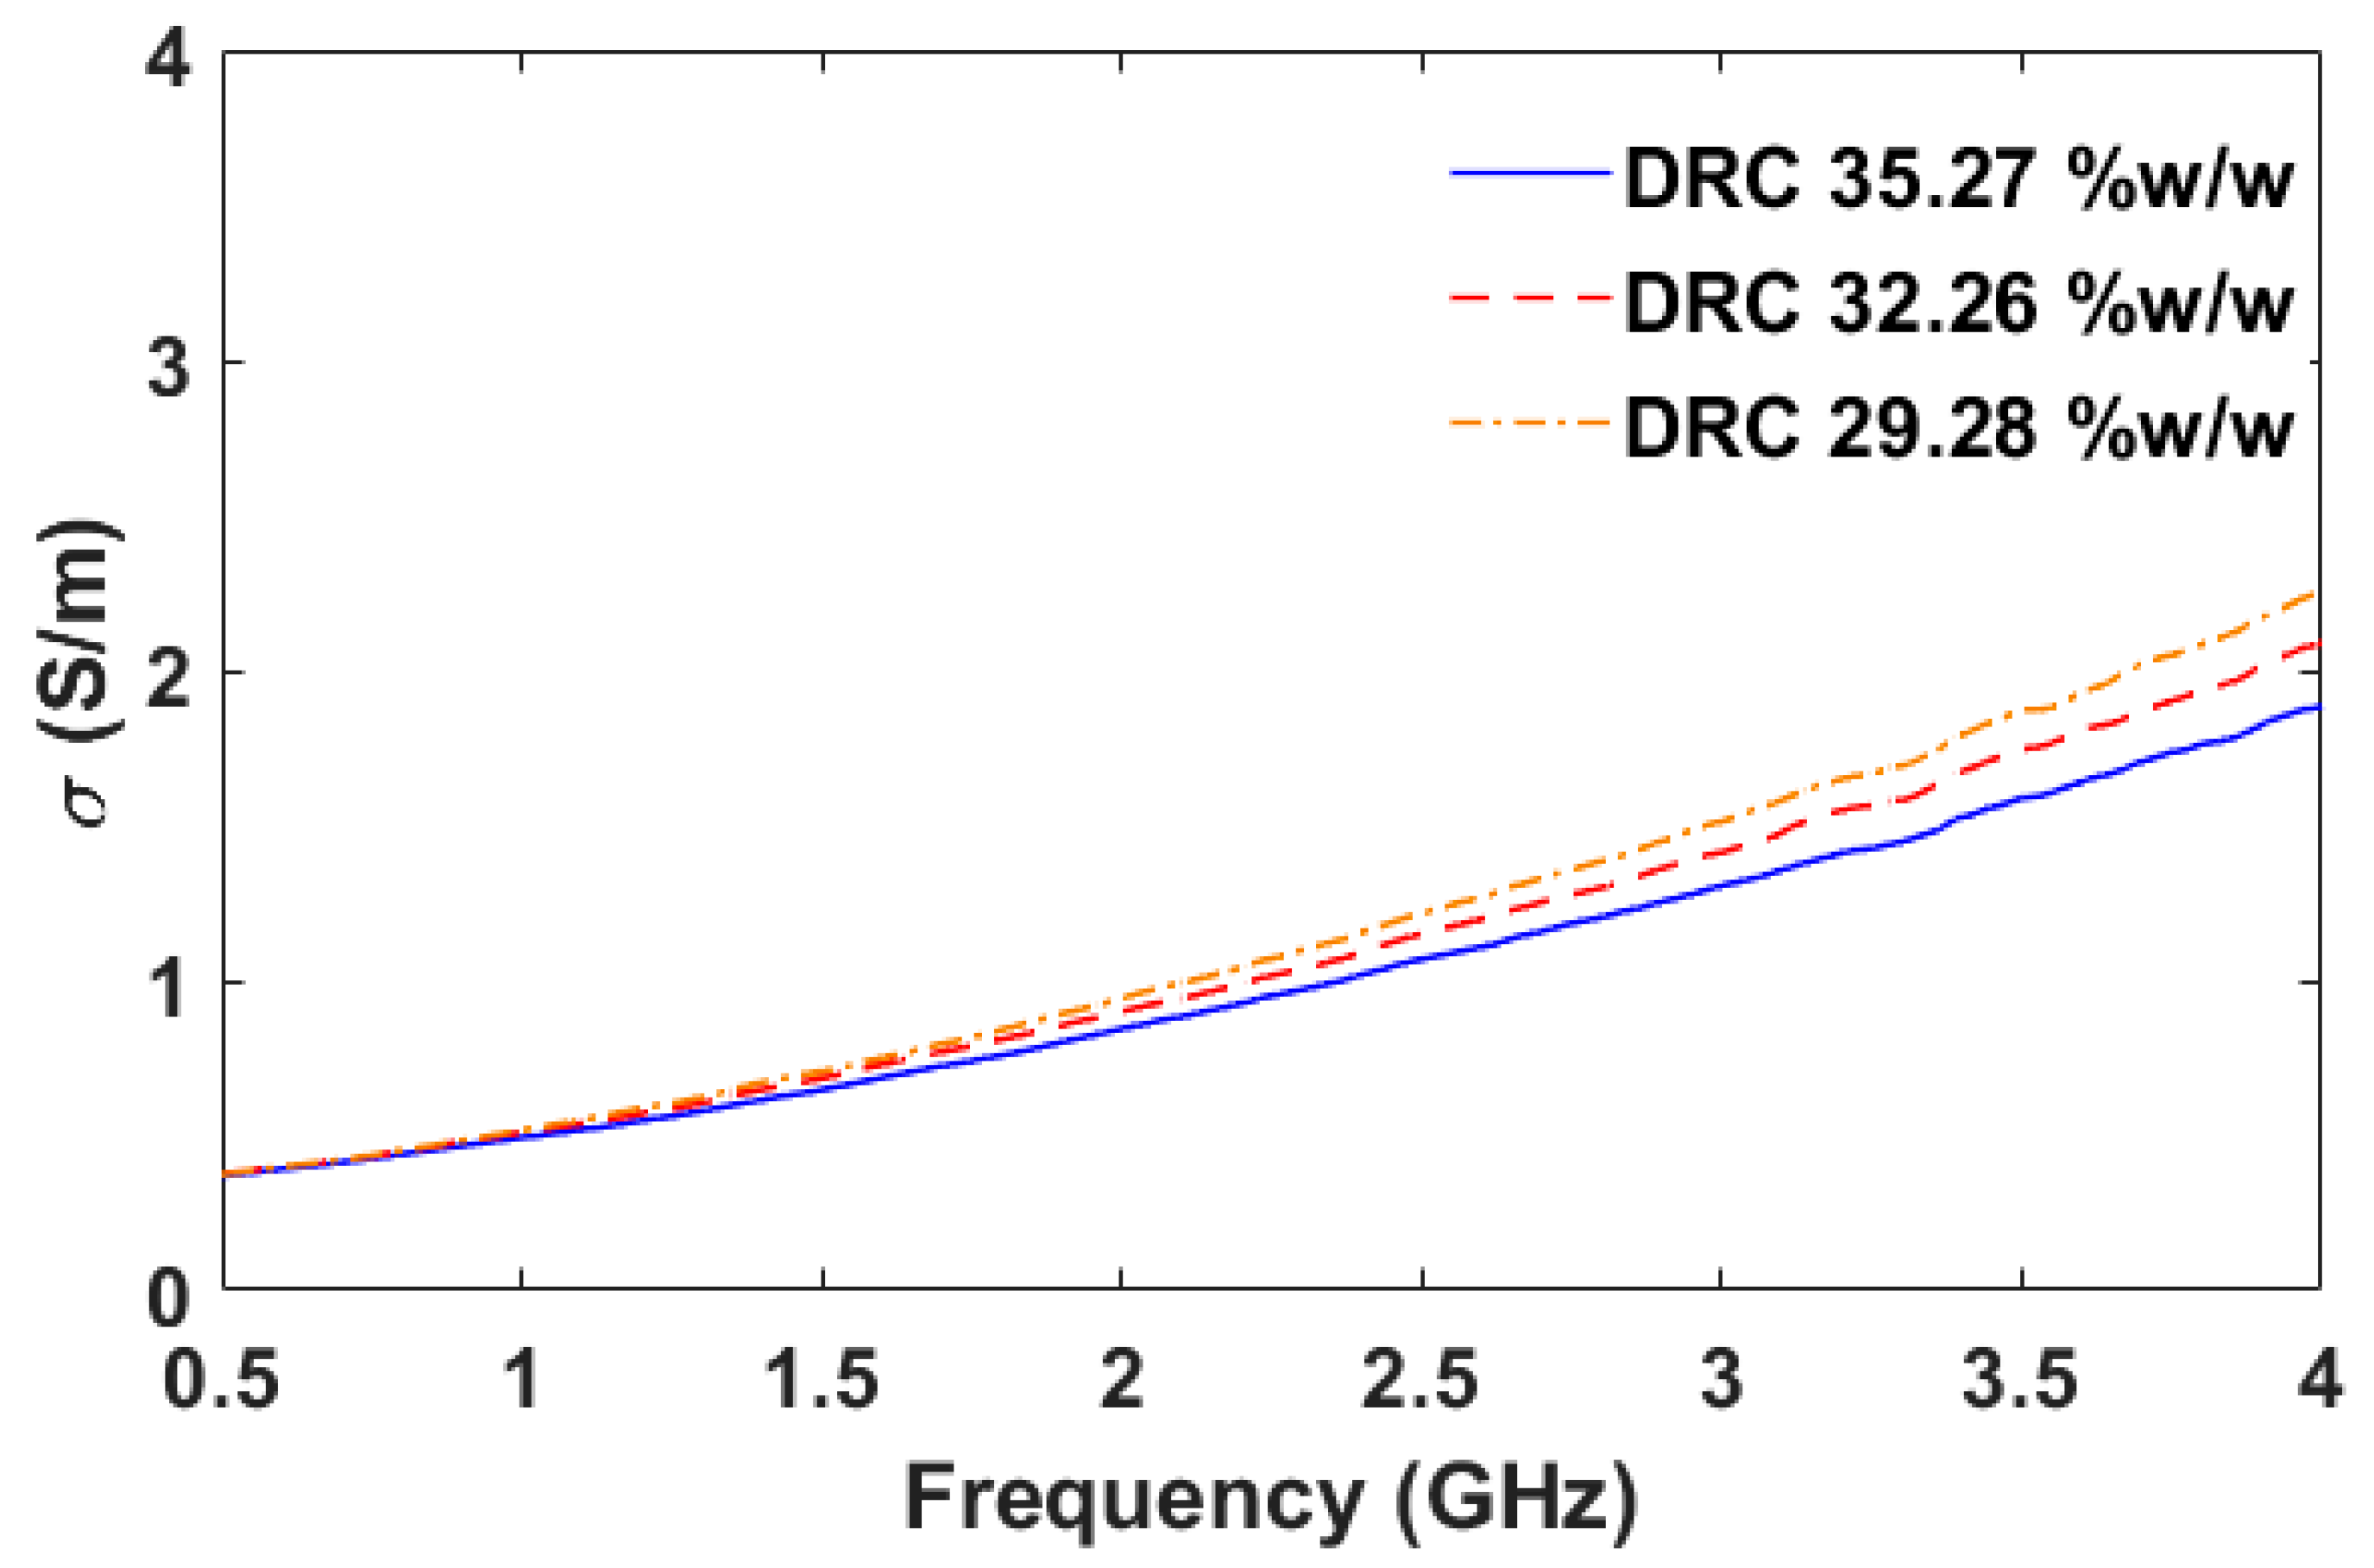
Figure 21 demonstrates the electrical conductivity of the natural latex samples with different DRCs. When the DRC in the natural latex sample decreases, the electrical conductivity is slightly changed in the frequency range of 0.5–1.0 GHz while the significant increase occurs in the higher frequency range of 1.0–4.0 GHz. The maximum FOM2 is equal to 0.0612 S/m * (%
w/
w)
−1 at the frequency of 4.0 GHz. Therefore, when considering the electrical conductivity as an indicator, the frequency of 4.0 GHz is the optimum frequency.
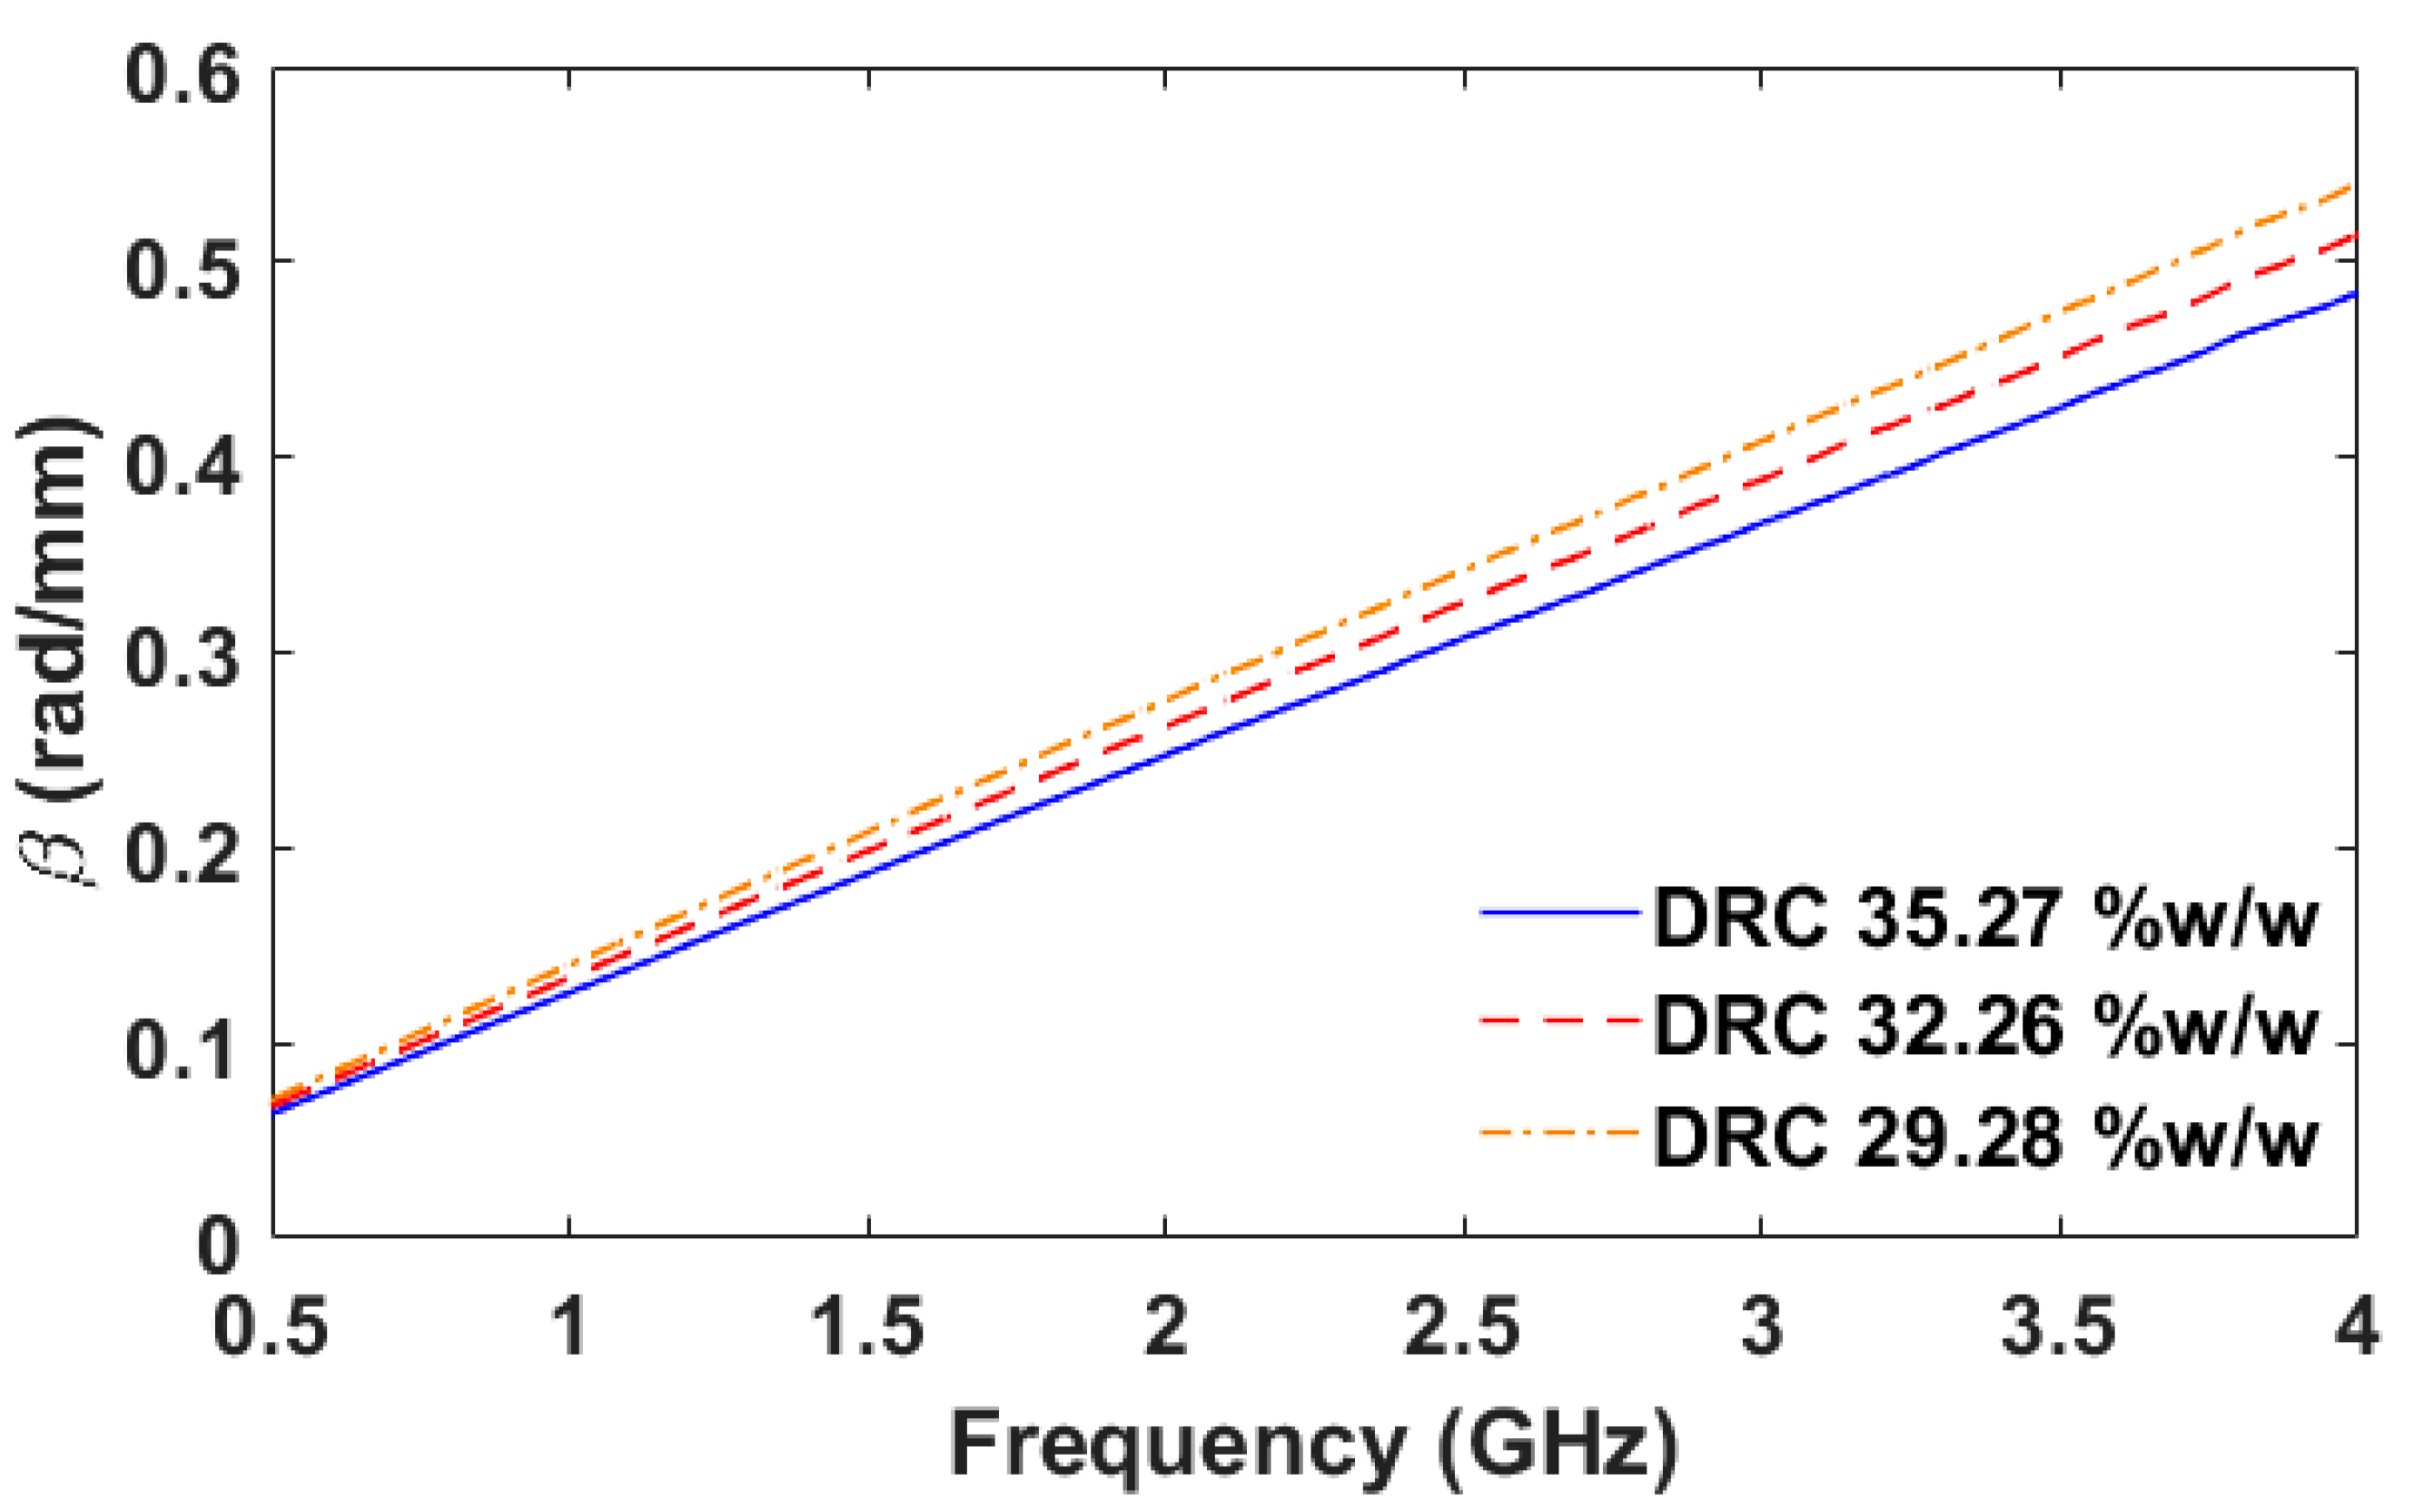
Figure 22 depicts the phase constant of the natural latex samples with different DRCs. The phase constant is inversely proportional to the DRC over the frequency range of 0.5–4.0 GHz. The significant increase of the phase constant occurs over the frequency range of 0.7–4.0 GHz. The maximum FOM3 is equal to 0.0093 rad/mm * (%
w/
w)
−1 at the frequency of 4.0 GHz. When using the phase constant as an indicator, the frequency of 4.0 GHz is the most suitable frequency.


