Article

Identification and Chemometric Profiling of C10- and C11-Decalins as Novel Hydrodesulfurization Products for Diesel Spill Environmental Forensics

1
Institute of Chemistry, Academia Sinica, Taipei 115201, Taiwan
2
Department of Applied Chemistry, National Yang Ming Chiao Tung University, Hsinchu 300093, Taiwan
3
Sustainable Science and Technology (SCST), Taiwan International Graduate Program (TIGP), Academia Sinica, Taipei 115201, Taiwan
4
Environmental Management Administration, Ministry of Environment, Taipei 100005, Taiwan
*
Author to whom correspondence should be addressed.
Molecules 2026, 31(17), 3006; https://doi.org/10.3390/molecules31173006
Submission received: 11 July 2026 / Revised: 21 August 2026 / Accepted: 25 August 2026 / Published: 27 August 2026
(This article belongs to the Special Issue Analytical Techniques for Environmental Contamination)

Abstract

This study introduces decahydronaphthalenes (C10- and C11-decalins; C0De and C1De) as a novel class of hydrodesulfurization (HDS)-associated forensic markers. Diesel-contaminated soil residues from 12 gas station spills and fresh ultra-low-sulfur diesel (ULSD) reference samples (2018–2025) in Taiwan were evaluated. The decalin abundances, derived from gas chromatography/mass spectrometry (GC/MS) peak areas, were converted into diagnostic ratios (DRs) using a conserved C15 sesquiterpane (BS3) internal reference. These ratios were correlated with conventional fingerprint parameters and alternative HDS products to support source identification and manufacturing-era estimation. Notably, Pearson correlations revealed that C0De and C1De weathering behaviors mimic those of short- (CH-6/CH-7) and medium-chain (CH-9) n-alkylcyclohexanes, respectively. Furthermore, C1De’s negative correlation with CxD proxies indicates the premise that rigorous HDS processing lowers sulfur concentration while elevating these hydrogenated side products. Expanding on a framework using dimethylbiphenyls (C2B) and trimethyltetralins (C3T), adding these novel decalin markers in principal component analysis (PCA) maintained manufacturer-specific source discrimination, with collinear loading vectors confirming C1De and C3T as codependent HDS markers. Cross-validated (CV) linear discriminant analysis (LDA) showed that replacing C3T with C0De or C1De improved discrimination among broad sulfur-regulatory manufacturing-era groups, although residual classification uncertainty remained for strongly weathered samples. These results support C0De and C1De as complementary HDS-associated markers for semi-quantitative manufacturing-era assessment rather than exact chronological dating.

1. Introduction

Diesel, a middle-distillate petroleum fraction, contains a diverse array of inherent compounds that serve as critical diagnostic markers in environmental forensic investigations [1]. In particular, n-alkanes (n-Cn) and isoprenoids, such as phytane (Ph) and pristane (Pr) patterns, selected aromatic compounds or polycyclic aromatic hydrocarbons (PAHs), n-alkylcyclohexanes (CH-n) and bicyclic sesquiterpanes (BS, sesquiterpenoid hydrocarbons with a decalin-type skeleton and multiple alkyl substituents [2]) are widely used as fuel source and weathering indicators [1,3,4,5,6]. These chemical fingerprints, quantified via specific extracted ion mass (EIM) values derived from total ion chromatogram (TIC) full-scan data or acquired directly via selected ion monitoring (SIM) mode, are analyzed using gas chromatography/mass spectrometry (GC/MS). The resulting profiles can be utilized for source identification, age dating, or manufacturing era estimation [7,8,9,10,11]. To decouple environmental degradation or evaporation from original fuel characteristics, these profiles are used to construct two distinct classes of diagnostic metrics. Weathering diagnostic ratios (WDRs) [4,7,12] are formulated by placing a labile, weathering-sensitive compound (such as a linear n-alkane) in the numerator against a highly recalcitrant source biomarker in the denominator; this architecture allows investigators to precisely track the preferential loss of light fractions due to evaporation and biodegradation over time. Conversely, source diagnostic ratios (SDRs) [2,4,5,6,13] consist of mutual ratios between two highly recalcitrant source markers (e.g., isoprenoids like Ph or specific bicyclic sesquiterpanes of BS3 or BS10). Because both components in an SDR resist weathering at comparable rates, the ratio remains invariant, thereby preserving the original chemical signature of the source oil. Consequently, through the concurrent utilization of WDRs and SDRs, investigators can simultaneously evaluate both the environmental weathering state and the source similarity of an unknown diesel spill.
The Christensen–Larsen approach [7], based on weathering diagnostic ratios such as the heptadecane (n-C17)/Pr ratio, remains one of the most established methods for estimating diesel residence times, providing approximate environmental exposure periods in soil on the scale of a few years. Building on this work, a distinct weathering sequence, based on physical, chemical and biological processes [10,14], was formulated for petroleum products, especially middle distillates such as diesel, kerosene, and No. 2 heating oil, as the Kaplan weathering stages [12,13,15]. This sequential framework characterizes the initial rapid depletion of linear n-alkanes and low-molecular-weight PAHs, consistent with traditional depletion profiles and historical residence-time models [16,17,18,19], followed by systematic losses of n-alkylcyclohexanes and low-methyl-substituted PAHs. At the advanced stage of environmental weathering (stage 6), microbial degradation extensively consumes highly branched isoprenoids such as Ph and Pr, ultimately leaving only highly resistant biomarkers (e.g., BS, hopanes, and heavy PAHs) essentially intact [2,16,20]. However, existing approaches for age-dating identification, or manufacturing era estimation still rely largely on empirical time–ratio relationships rather than multivariate pattern models [21].
To overcome these constraints, multivariate chemometric models [22,23,24,25,26,27,28,29], particularly principal component analysis (PCA) and linear discriminant analysis (LDA), have been successfully applied to classify petroleum products and distinguish sources using GC-based fingerprints, including two-dimensional gas chromatography (GC×GC) and high-resolution time-of-flight mass spectrometry (HR GC/TOF/MS) [22,23,24,25,29,30]. These tools, alongside state-of-the-art gas chromatography and mass spectrometry techniques, significantly enhance source discrimination, but they have rarely been extended to explicit diesel manufacturing-era scenarios, or incorporated chemical variables that directly reflect hydrotreating and hydrodesulfurization (HDS) chemistry [31]. In a recently developed framework from our laboratory [11], PCA was performed on molecular fingerprint profiles by pairing traditional SDRs (based on Ph and BS4) with a unique application of refining-specific markers, namely dimethylbiphenyls (C2B) and trimethyltetralins (C3T). This novel approach segregated diesel samples into discrete clusters corresponding to their respective manufacturers. Furthermore, supervised LDA, incorporating alkyl dibenzothiophenes (CxD, x = 1 and 2) and refining specific markers, such as C2B, C3T, and trimethylnaphthalenes (C3N), enabled classification of samples into inferred regulatory eras spanning the 1993–2011 Sulfur content (S-content) control period. However, as global regulatory frameworks shifted entirely to post-2011 modern ultra-low-sulfur regimes (<15 mg S kg−1 diesel fuel, equivalent to <15 ppm on a mass basis), these specialized aromatic HDS markers reached analytical resolution limits under severe hydrotreating conditions; therefore, there is a need to further explore deeper, fully saturated hydrogenation products.
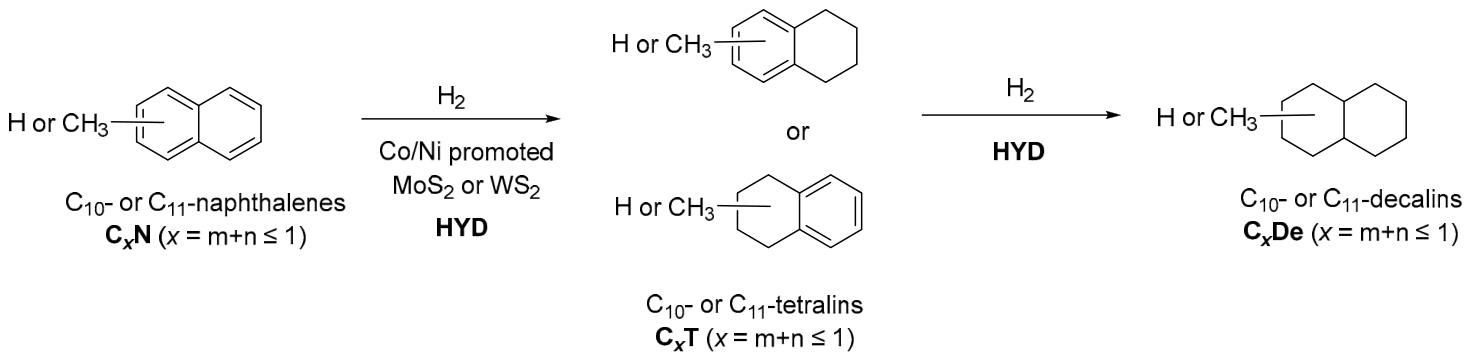
In recent years, increasingly stringent government regulations mandated across the USA, Europe, and China for ultra-low-sulfur diesel (ULSD) have driven the global adoption of deep HDS over Co/Ni-promoted Mo/W sulfide catalysts [31,32]. For alkyl dibenzothiophenes, direct desulfurization (DDS) yields methyl-substituted biphenyls, whereas hydrogenation (HYD) routes produce partially saturated intermediates such as cyclohexylbenzenes [31,33,34]; in parallel, the deep hydrogenation of naphthalenes generates tetralins and, under highly severe conditions, fully saturated decahydronaphthalenes (decalins) [35,36,37,38] (Scheme 1). These deeply hydrogenated naphthalenes represent a largely unexplored reservoir of potential post-HDS markers in middle-distillate fuels.
Alkyl decahydronaphthalenes (alkyl decalins) are saturated bicyclic naphthalenes that have been detected and structurally characterized in crude oils and related petroleum samples, and have been suggested as potential petroleum biomarkers [14,39]. Hydrogenation and hydrocracking studies [37,40] on fused aromatics show that tetralins, decalins, and methyldecalins can form under conditions relevant to hydrotreating and hydrodesulfurization of diesel-range streams, indicating that C10- and short-chain alkyl decalins are plausible, persistent constituents of modern ULSD formulations. Furthermore, due to their saturated bicyclic ring structures, similar to BS fingerprints, these alkyl decalins exhibit distinct environmental stability and resistance to microbial cleavage. This resilience can allow them to persist in weathered matrices long after labile linear hydrocarbon fractions have evaporated or degraded, potentially helping to bridge a critical operational gap in historical residence-time models or in manufacturing-era identification.
In this study, the targeted unalkylated and monomethylated decalins (C10- and C11-decalins, denoted as C0De and C1De, respectively) were characterized in contaminated soil extracted diesel spills. After validating these compounds against established BS3-normalized WDR and SDR-based fingerprint markers using Pearson linear correlations, we further applied multivariate statistical tools (PCA and LDA) to an expanded dataset that includes recent ULSD (2018–2025) samples, aiming to improve manufacturer source discrimination and manufacturing era classification. Specifically, the novel deep-hydrogenation markers based on C10/C11-decalin DRs were evaluated in combination with legacy HDS-related markers (C3N, C2B, C3T). This integrated approach evaluates the potential of these composite markers for enhancing the forensic diagnostic resolution of diesel pollution for source identification and linking a spill’s manufacturing date to historical regulatory periods.

2. Results and Discussion

2.1. Employment of C10- and C11-Decalins for Forensic Analysis

The analytical framework of this study was extended to evaluate both fresh diesel oils (spanning the 2018–2025 collection period) and weathered diesel spill extracts from the 12 contaminated sites using multivariate statistical analysis for source classification and forensic manufacturing era estimation [11]. This expanded characterization relies on the newly developed diagnostic ratios (DRs) of C0De and C1De (Table S1 in Supplementary Materials). Chemical markers designated for DR calculations encompassed targeted marker suites including dibenzothiophene (CxD), biphenyls (C2B), indanes (CxI, x = 1 and 2), naphthalenes (CxN, x = 1–4), tetralins (CxT, x = 1–4), and decalins, specifically targeting both unalkylated decalin (C0De) and methyl decalins (C1De) at the high-abundance EIC of m/z 95 (corresponding to the [C7H11]+∙ fragment [39,41]), and their respective molecular ion mass-to-charge ratios appeared at the corresponding EICs of m/z 138 and m/z 152, respectively (Figure S5, in Supplementary Materials).
Following the calibration of the S-content against high-sulfur diesel feedstock reference standard (6700 ppm), the mean S-contents across the 12 gas stations were determined [11]. Statistical refinements utilizing a Student’s t-test allowed for the high-resolution segregation of the contaminated-site data into 19 distinct spill events (Table S5, in Supplementary Materials). Comprehensive operational histories and baseline geographic data regarding these 12 retail stations are detailed in our previous work, and the estimated S-contents (in ppm) for the 12 gas stations were provided in our earlier published results [11].
C10- and C11-decalins occur naturally in petroleum feedstocks [14,39]. Although refinery-specific catalyst systems and operating conditions are proprietary [31,33,42], these related decalins have been reported to form or become enriched during hydrotreating through the sequential hydrogenation of naphthalene and methylnaphthalenes via their corresponding tetralin intermediates (Scheme 1) [36,37,38].

2.2. Pairwise Pearson’s Correlation Analysis of r-DRs

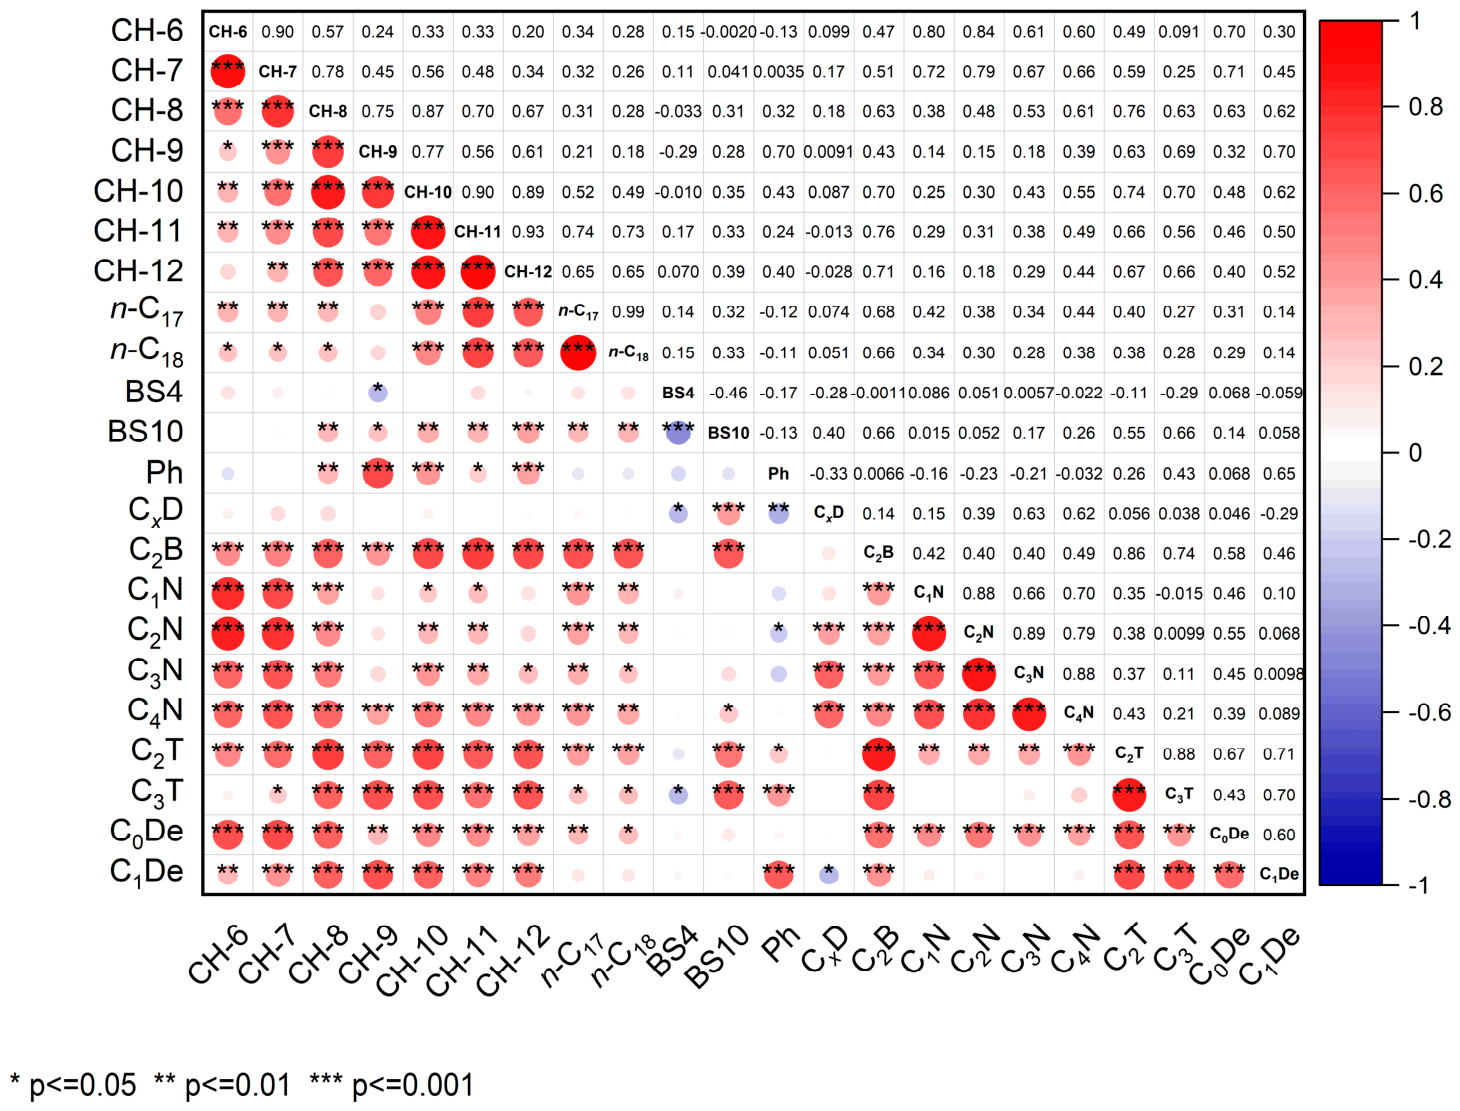
Building upon our earlier analysis [11], in which the dataset from the 12 contaminated sites was refined into 19 distinct spill events based on the DRCxD/BS3 or SRE ratios (serving as proxies for S-content and regulatory-period classification, respectively), we proceeded with a pairwise correlation analysis based on the C0De and C1De DRs. Correlation coefficients were systematically calculated across the complete matrix of DRs using BS3 as the conserved internal reference denominator (Figure 1 and Figure S1 in Supplementary Materials).
A series of linear regression analyses were performed to calculate Pearson correlation coefficients (r) linking the decalins to various fingerprinting marker r-DRs, including n-alkanes, isoprenoids, bicyclic sesquiterpanes, n-alkylcyclohexanes, PAHs, specifically naphthalenes, and the aromatic HDS derivatives (biphenyls and tetralins). The resulting correlation matrix was visualized via the dot plots shown in Figure 1, with r-values classified into 5 distinct magnitude levels (ranging from 0 to ±1.00) to reveal the mutual correlations among variable r-DRs [11,43]. For these comparative evaluations, all DRs were converted to r-DRs, where the maximum observed ratio across the entire sample set was defined as the reference baseline value of 1.0. A comprehensive inventory of these DR markers, along with their respective maximum baseline ratios using BS3 as the denominator is provided in Table S1 in Supplementary Materials and the previous work [11].
Importantly, the fresh ULSD reference samples were not included in the Pearson correlation analyses presented in Figure 1 and Figure S1 in Supplementary Materials. These analyses were restricted exclusively to samples collected from the 12 diesel-spill sites in order to evaluate marker relationships within environmentally weathered field residues. The complete field dataset was intentionally retained to evaluate whether the marker relationships remained informative across the continuum of weathering conditions encountered in practical spill investigations, rather than under a single or specific predefined weathering state.

2.3. Correlation of Major DR Markers Against the r-DRC0De/BS3 and r-DRC1De/BS3

To reflect practical forensic conditions, the complete spill-site dataset was retained in the following correlation analyses to assess whether the relationships that C0De and C1De have with established forensic markers remain informative under the heterogeneous weathering conditions encountered in field investigations.
Linear regression of both r-DRC0De/BS3 and r-DRC1De/BS3 against the standard aliphatic proxy r-DRn-C17/BS3 revealed correlation coefficients (r = 0.31 and 0.14, respectively), indicating weak to negligible correlations (Figure 1, Figures S1 and S2 in Supplementary Materials). Regarding the correlation with isoprenoid Ph, C0De exhibits virtually no linear correlation (r = 0.067), whereas C1De displayed a moderate correlation (r = 0.65). Conversely, when correlated against PAHs (C1N–C4N), r-DRC0De/BS3 demonstrates low-to-moderate correlations (r = 0.39–0.55), while r-DRC1De/BS3 showed negligible tracking (r = 0.011–0.086). These divergent trends suggest that the unalkylated C0De marker is more susceptible to weathering than its methylated counterpart, C1De, which functions as a relatively stable diagnostic marker akin to isoprenoids. Crucially, both decalin markers exhibit limited correlation to the heavy biomarker BS4. This implies that these unique HDS products behave largely independently of the native bicyclic sesquiterpanes background within the diesel matrix.
However, while C0De, like C2B, C2T, and C3T, yielded negligible correlation to the regulatory proxy CxD, C1De showed a marginal correlation to weak negative (r = –0.29) to S-content diagnostic markers (Figure 1 and Figure S1B(2) in Supplementary Materials). This finding fundamentally supports the theoretical negative correlation between HDS product indicators and the S-content proxy (CxD), demonstrating that rigorous HDS process simultaneously depletes CxD while elevating specific hydrogenated side products.
Thus, the negligible correlations of C2B, C2T, C3T and C0De with the CxD proxy observed in field applications are primarily attributed to the highly complex degradation variability introduced by profound, long-term environmental weathering processes, which mask the theoretical unweathered baseline. However, because the present correlation analysis intentionally incorporates field samples spanning heterogeneous weathering conditions, these observed correlations should not be interpreted as a direct quantitative measure of HDS severity. Likewise, the weak or negligible correlations observed for several HDS-related markers may reflect the combined effects of environmental weathering, site-specific matrix conditions, original fuel-composition variability, and refinery history, rather than weathering alone. Importantly, the purpose of the pooled field analysis was to determine whether diagnostically useful relationships persist despite these realistic sources of variability. Within this heterogeneous field dataset, C3T and C1De nevertheless exhibited a relatively strong correlation (r = 0.70), indicating that these two markers retain related compositional information across the investigated spill samples.
Interestingly, C0De displayed strong linear correlations with short-chain n-alkylcyclohexanes (CH-6 and CH-7), yielding correlation coefficients of 0.70 and 0.71, respectively, representing the lower-end feature of n-alkylcyclohexanes [3] (Figure 1 and Figure S1A(1) in Supplementary Materials). Moreover, the r-values of CH-6 and CH-7 corresponding to r-DRs of n-C17 and n-C18 were in a consistent range of 0.26–0.34 to C0De (r = 0.31). In contrast, C1De exhibited moderate to strong correlations with CH-8 (r = 0.62) and CH-9 (r = 0.70), while the remaining n-alkylcyclohexanes demonstrated only weak-to-moderate correlations (Figure 1 and Figure S1B(1) in Supplementary Materials). Notably, linear correlations (r) of CH-9 to n-C17 and n-C18 were 0.21 and 0.18, respectively, indicating borderline negligible correlations that were comparable to those of C1De (r = 0.14). The trends align with those revealed for medium-chain n-alkylcyclohexanes under deep underground anaerobic conditions [3], and presumably arise because C10- and C11-decalins are structurally related to cyclohexyl derivatives. A comparative analysis with the n-alkylcyclohexane suite implies that decalins share broadly analogous weathering behavior. The distribution experiences progressive preferential losses of normal alkylcyclohexanes from its high end [44] and enhanced levels at the low end [45]. Taken together, these correlation patterns suggest that C0De and C1De may be relatively less susceptible to environmental weathering than heavier alicyclic compounds such as CH-11 and CH-12 within the investigated field samples.
When benchmarked against other critical refinery HDS indicators, C2B (derived from the CxD HDS process) exhibited a moderate correlation with C0De (r = 0.58), and a weaker correlation with C1De (r = 0.46) (Figure 1, Figures S1A(2) and S1B(2) in Supplementary Materials). For the HDS reaction intermediates directly derived from naphthalenes, the alkyltetralins (C1T–C3T) exhibited a broad correlation range with C0De spanning from strong to weak (0.77–0.44), while maintaining consistently strong correlations with C1De (r = 0.69–0.71) (Figure 1 and Figure S2 in Supplementary Materials). Indanes (C0I–C2I), which are structural rearrangement products of tetralins [11], exhibited moderate-to-strong linear correlations with C0De (r = 0.50–0.70) but negligible correlations with C1De, similar to CxN (Figure 1 and Figure S2 in Supplementary Materials). These features suggest that the C0De weathering pattern is similar to the depletion profiles of methyl-substituted naphthalenes and indanes, which would be more susceptible to weathering than the other alkylated PAH series [16]. Overall, C0De and C1De exhibited measurable associations with several established refinery- and HDS-related markers, including C2B and C3T. Together with their persistence across the heterogeneous field samples, these relationships support further evaluation of C0De and C1De as complementary variables in multivariate forensic models.

2.4. Evaluation of C10- and C11-Decalins for Source Identification via Principal Component Analysis (PCA)

Previously, appropriate BS3-based DRs were selected to differentiate commercial diesel sources between company A and company B [11]. Baseline PCA modeling utilizing the r-DRs of BS4, Ph, C2B, and C3T revealed distinct clustering patterns, successfully segregating the fresh reference diesel fuels and the field-weathered soil extracts into the 95% confidence ellipses corresponding to distinct companies A and B. This baseline configuration attributed the weathered diesel samples from spill sites V and W, as well as a specific subset of the P-site data (designated as Group P-2), to company B. This clustering was driven by the significantly higher abundances of DRC2B/BS3 and DRC3T/BS3 characteristic of company B formulations with a more rigorous HDS process (Figure 2a) [11]. Such manufacturer-associated compositional differences may reflect the combined influence of feedstock characteristics and refinery-specific processing conditions, including HDS.
A closely matching trend was observed in the fresh reference diesel samples collected from 2018 to 2025. However, as government sulfur regulations became increasingly stringent over this timeline, shifting chemical profiles altered sample coordinates; for instance, the 2022 fresh reference sample from company A (A-22) shifted into the 95% confidence ellipse of company B, while the 2020 and 2025 company A fresh samples (A-20 and A-25) appeared as outliers along the periphery of the company A cluster (Figure S3 in Supplementary Materials). Furthermore, the 2025 company B fresh diesel sample (B-25) also fell completely outside the 95% confidence ellipse of company B, shifting towards a higher positive value on PC1 axis.
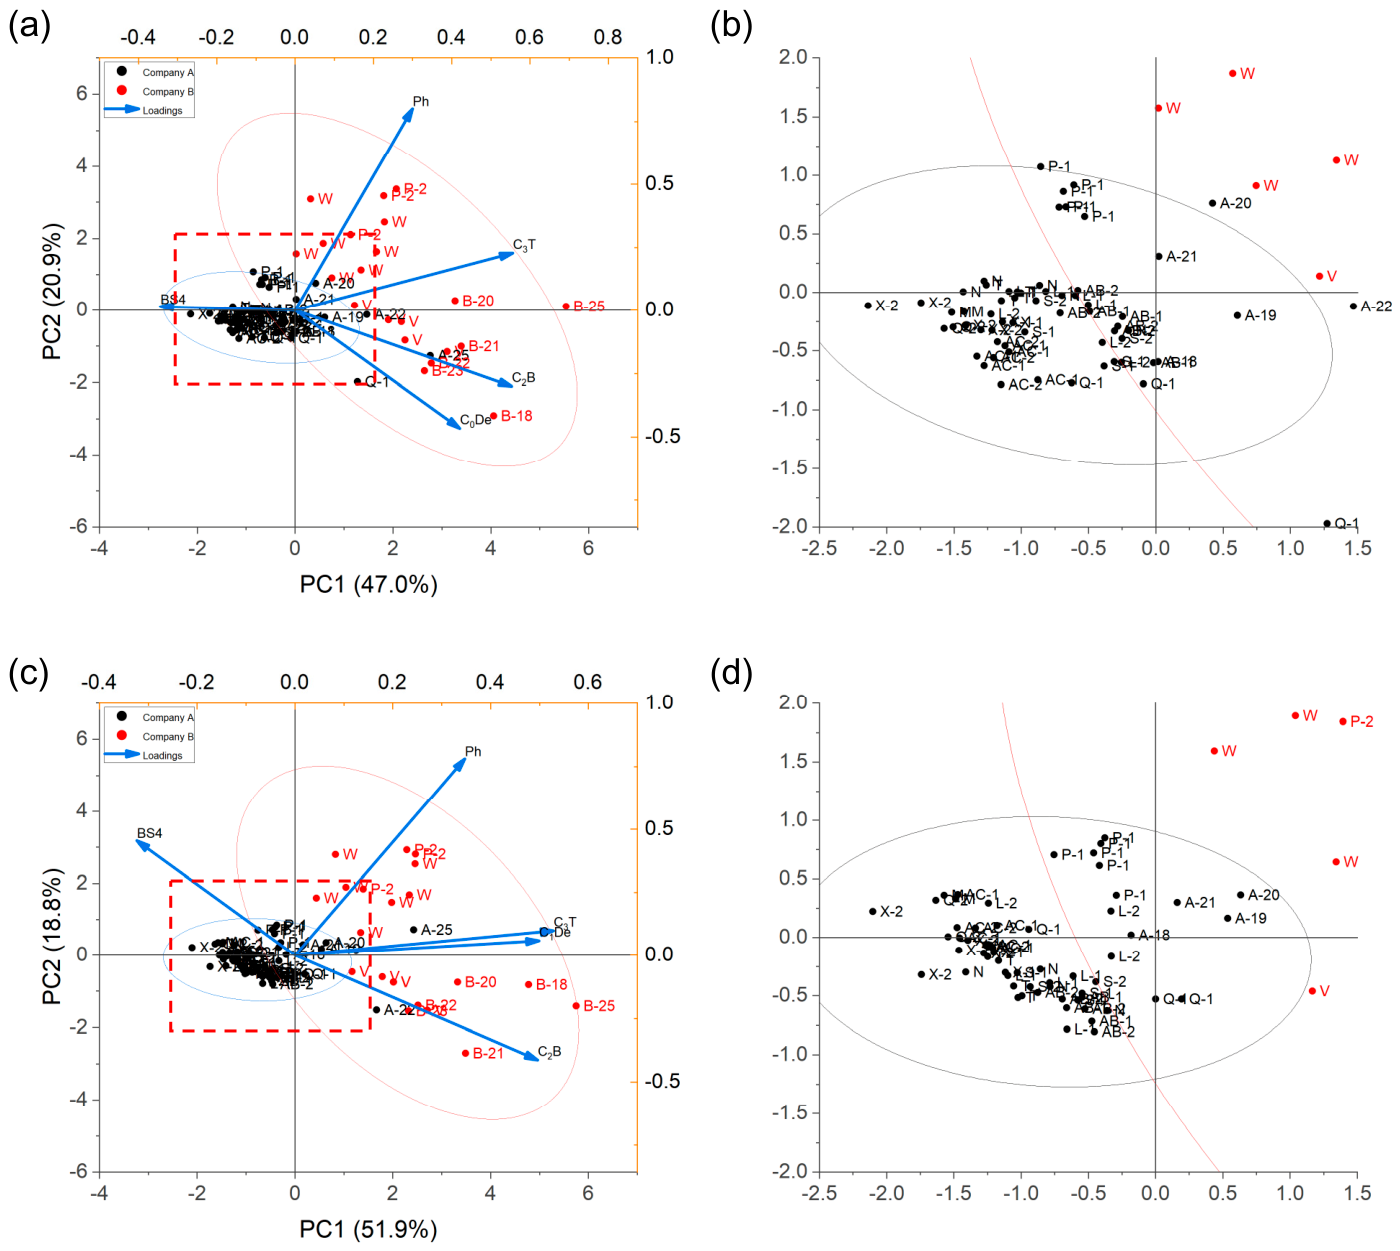
Since diesel-range decalins are predominantly generated via sequential hydrogenation of parent naphthalenes during industrial refinery HDS processes, we evaluated the diagnostic utility of these alternative markers by systematically adding C0De and C1De into the PCA framework for comparison. Because the C0De DR exhibits a relatively low correlation (r = 0.46) with the C3T DR, its resulting loading vector projected to the left-hand side of C2B, pointing towards the negative axis of PC2. This vector shift caused one low-weathering, high-ratio spill sample from site Q-1 to migrate away from the company A cluster and settle within the 95% confidence ellipse of company B (Figure 3a,b). Due to distinct HDS selectivity variances between C3T and C0De, the A-25 fresh reference diesel sample directly shifted into the company B’s ellipse, whereas the A-20 and A-22 reference samples positioned themselves along the boundary interface separating the company A and company B clusters. Meanwhile, the B-25 fresh diesel sample still fell completely outside the 95% confidence ellipse of company B, remaining far away from company A’s ellipse.
In contrast, when the C0De DR was replaced with the methylated C1De marker, its high linear regression correlation (r = 0.71) with C3T was clearly reflected in the PCA loading plot; the C1De vector projected in the same direction as the original C3T vector, albeit with a lower magnitude (Figure 3c). Under this configuration, the A-22 and A-25 fresh reference oils were redistributed to the center of the company B’s 95% confidence ellipse, while the A-20 fresh oil sample was successfully pulled into the company A ellipse (Figure 3c,d). However, this substitution also caused two weathered soil samples originating from company B sites V and W, both with relatively low baseline C1De abundances, to fall along the interface or within the confidence ellipse of company A, adjacent to company A’s fresh diesel samples. Because the baseline DRC3T/BS3 abundances for these company B-derived V and W sites are substantially higher than those shown by company A (including their fresh diesel samples), co-indexing both C3T and C1De parameters significantly strengthens the overall source discrimination resolution. Nevertheless, this combination did not counteract the anomalies caused by the extraordinarily high C1De levels present in the A-22 and A-25 fresh diesels, which still appear within company B’s confidence ellipse. Interestingly, the B-25 fresh diesel sample was located right at the edge of company B’s 95% ellipse on the positive side of PC1. These shifts among the PCA data tracks were directly governed by the relative yield and distribution of the C3T, C0De and C1De side products during LSD (<500 ppm S-content) and ULSD (<15 ppm S-content) production processes operated by the two companies.
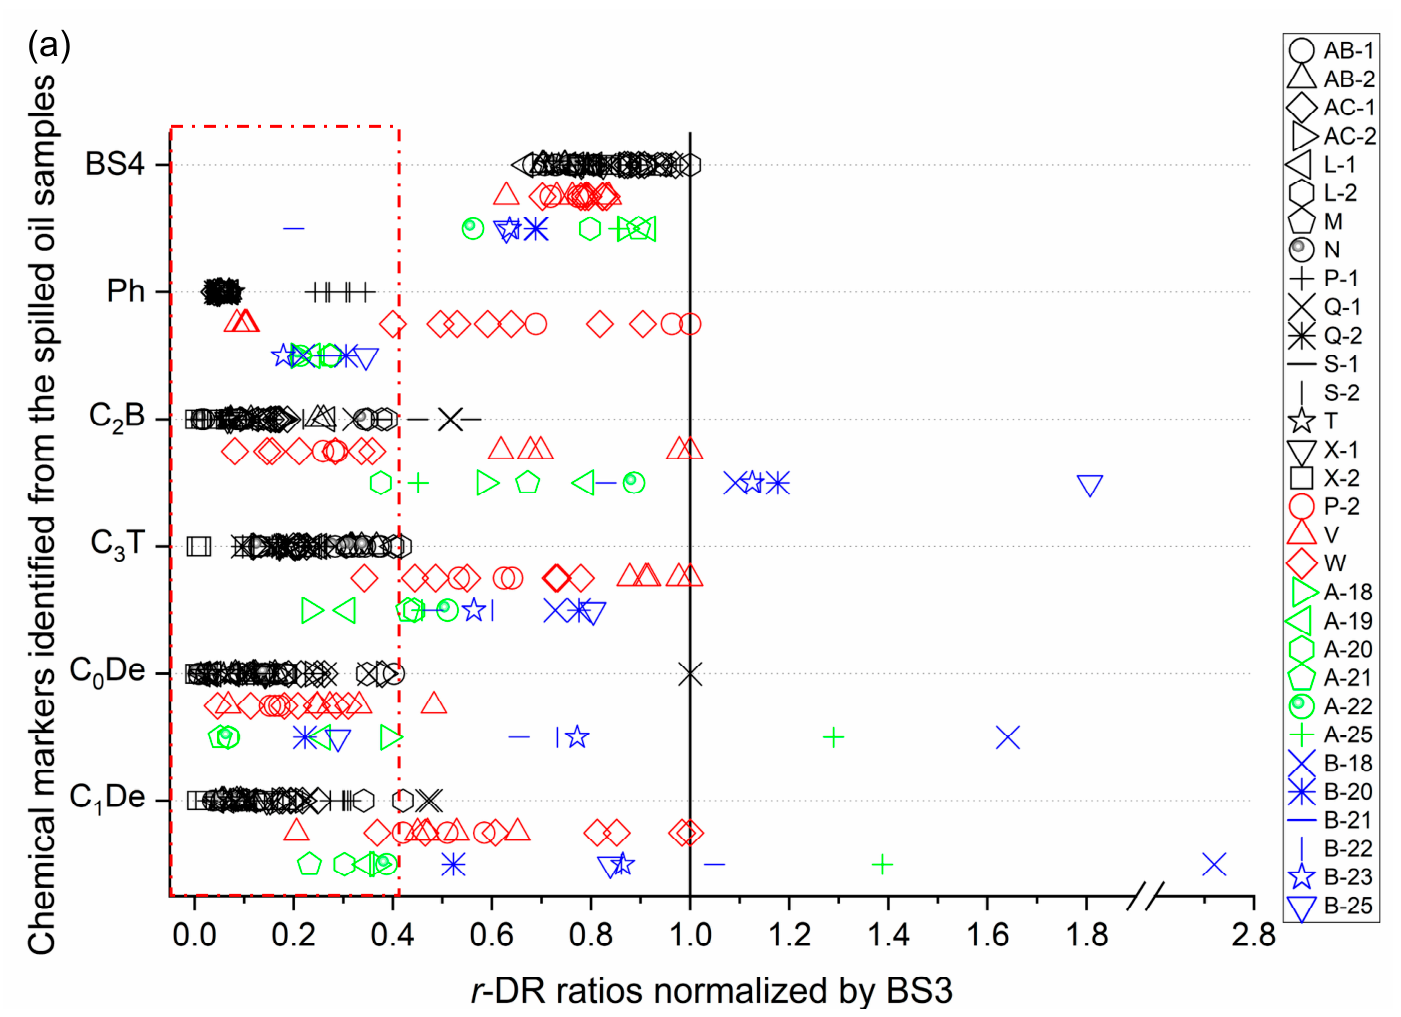
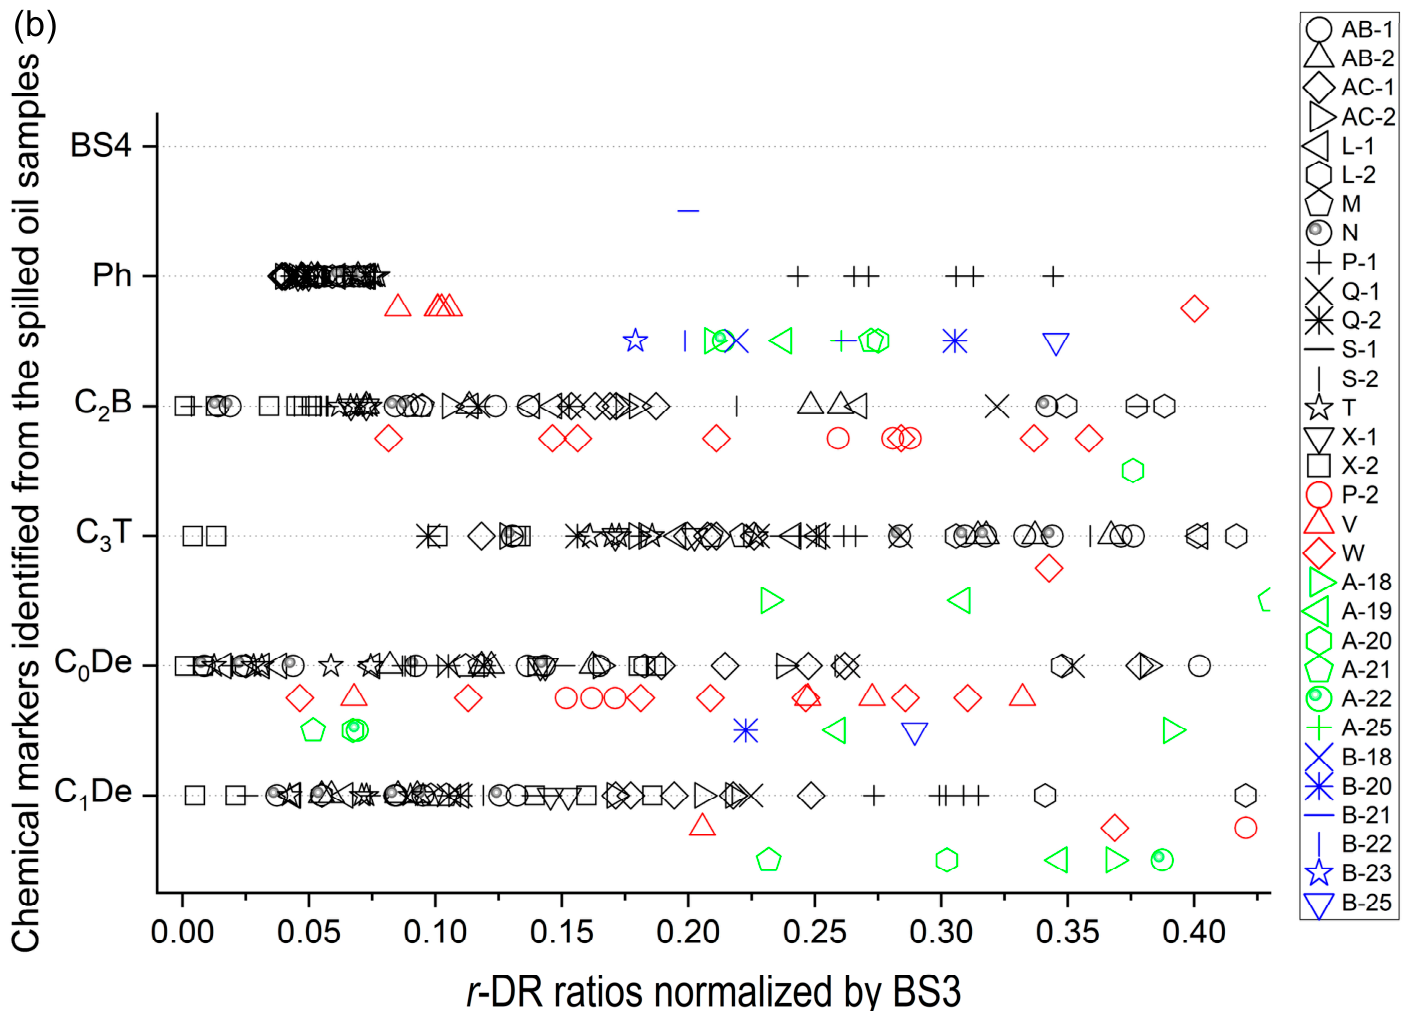
Because company B typically utilizes refinery conditions that yield a higher abundance of biphenyls and tetralins, the corresponding decalin abundances tracked at spill sites V, W, and P-2 were markedly higher than those recorded at contaminated sites originating from company A (Figure 2). Moreover, the fresh diesel stocks acquired from company B under increasingly rigorous HDS modes, necessitated by modern, stringent ULSD environmental standards, corroborate this trend, systematically exhibiting elevated decalin signatures compared to company A (Figure 2).
Overall, in the C0De-containing model (Figure 3a,b), A-25 shifted into the company B confidence region, whereas A-20 and A-22 were located near the boundary between the two groups. In the C1De model (Figure 3c,d), A-22 and A-25 were positioned within the company B confidence region, while A-20 remained within the company A region, indicating partial compositional overlap between the two manufacturers for some recent ULSD samples. Notably, incorporation of either C0De or C1De did not substantially alter the general manufacturer-associated clustering observed in the baseline PCA. Although the 2022 and 2025 fresh ULSD samples from company A showed shifts toward or into the company B-associated region, the weathered soil extracts from sites V, W, and P-2 consistently remained within the company B-associated region across the evaluated PCA marker configurations. This reproducible positioning relative to the manufacturer-associated reference regions provides consistent multivariate evidence for source attribution. Accordingly, within the investigated dataset, the combined and reproducible PCA evidence confirms the attribution of sites V, W, and P-2 to company B.
To independently quantify the robustness of this manufacturer-discrimination framework and the incremental contribution of the decalin markers, the corresponding predictor sets were further assessed using cross-validated two-class LDA between company A and company B (Table 1, Tables S6 and S7 in Supplementary Materials). The baseline DRC2B/BS3/DRC3T/BS3/DRBS4/BS3/DRPh/BS3 model yielded a CV accuracy of 95.24% and a balanced accuracy of 96.83%. 4 of the 84 observations were misclassified. The addition of DRC0De/BS3 increased these values to 97.62% and 98.41%, reducing the number of misclassified observations from 4 to 2. The addition of DRC1De/BS3 yielded a CV accuracy of 96.43% and a balanced accuracy of 97.62%, with 3 misclassified observations. In contrast, simultaneous inclusion of both decalin markers reduced CV accuracy and balanced accuracy to 92.86% and 90.48%, respectively. These results indicate that C0De and C1De provide incremental manufacturer-discrimination information when incorporated individually, but their combined contribution is not additive.
As C10- and C11-decalins occur naturally in petroleum feedstocks, the high-sulfur middle-distillate reference with a known total S-content of 6700 ppm exhibited DRC0De/BS3 and DRC1De/BS3 values of 0.14 and 1.04, respectively (Table S1 in Supplementary Materials). These values were substantially lower than the corresponding maximum DR values observed in the investigated dataset (0.78 for C0De and 4.91 for C1De), indicating that the pre-existing decalin contribution from the feedstock was relatively limited. Therefore, although a feedstock contribution cannot be completely excluded, it is unlikely to dominate the manufacturer-associated compositional differences observed in the PCA models. These datasets were consistent with the LOD/LOQ results, indicating that the quantification limit (S/N ≥ 10) was not attainable for C1De-3 to C1De-6 (Figure S5 in Supplementary Materials). The other peaks remained detectable at dilution factors ranging from 1/2 to 1/8. Ultimately, the CV two-class LDA data indicated that including the HDS markers of C2B, C3T, C0De, and C1De can significantly improve the CV accuracy and balanced accuracy to over 90% (Table 1). The results indicated that including the HDS markers of the baseline BS3-normalized C0De or C1De ratios exhibits substantial contributions to the source discrimination between companies A and B.

2.5. Forensic Manufacturing Era Estimation of Spills, Including C0De or C1De, via Linear Discriminant Analysis (LDA)

To evaluate broad diesel manufacturing era groups aligned with historical sulfur regulations, a baseline supervised LDA was established using the chemical S-proxy DRCxD/BS3, together with the legacy DRC2B/BS3, DRC3T/BS3 and DRC3N/BS3 ratios [11]. This baseline predictive model classified weathered soil extracts from sites L-1 and AB-1 as originating from the post-1993 regulatory period, corresponding to a proposed historical S concentration range of 1500–3000 ppm. The baseline model subsequently classified spill extracts from sites AB-2, AC-1, Q-1, and S-1 as post-1997 releases, aligning with the presumably historical 500–1500 ppm S regulatory tier. Similarly, the estimated S-content profiles for the AC-2, Q-2, and S-2 sample groups fall within the 350–500 ppm S range, presumably dating these specific manufacturing events to the 1997–1998 regulatory window.
However, definitively distinguishing between the more modern low-S limits (10 and 350 ppm) previously was challenging due to low signal-to-noise ratios (<10) for these target markers. Consequently, isolating and resolving individual spill samples from sites M, N, W, X (comprising Groups X-1 and X-2 (<50 ppm)), and P (comprising Groups P-1 (<50 ppm) and P-2), remained problematic in early models (Table S5 in Supplementary Materials) [11].
Cross-validation provided a quantitative assessment of manufacturing-era classification performance. The baseline DRC2B/BS3/DRC3N/BS3/DRC3T/BS3/DRCxD/BS3 model yielded a CV accuracy of 83.33% and a balanced accuracy of 89.60%. Replacing C3T with C0De increased these values to 90.48% and 91.54%, respectively, whereas replacement with C1De yielded 89.29% and 92.69%. These results indicate improved discrimination of broad sulfur-regulatory groups after substitution with the decalin markers, while also demonstrating that classification remains imperfect (Table S8 in Supplementary Materials).
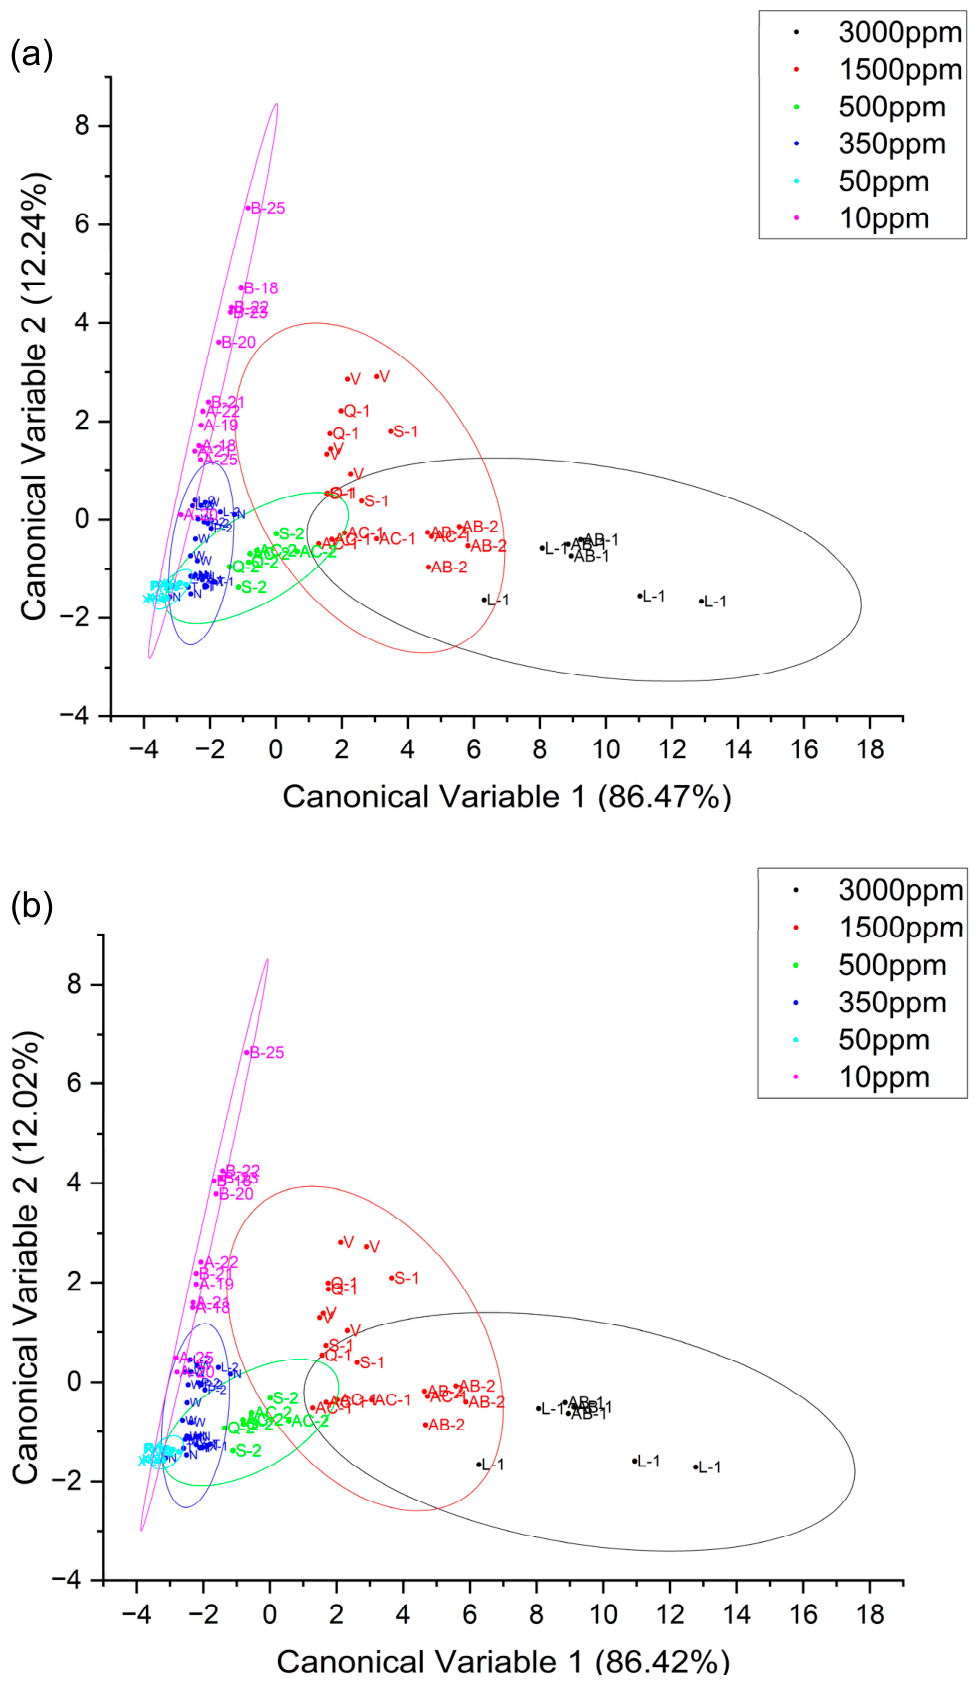
By systematically substituting the conventional C3T DR with the novel C0De and C1De decalin markers, these ambiguous sites were more clearly segregated into their corresponding supervised S-content regulatory regions (Figure 4) [11]. In the earlier LDA configuration utilizing C3T, a single sample point from the Q site, whose manufacturing era was attributed to the 350–500 ppm S-limit regime, anomalously clustered inside the 95% confidence ellipse of the <350 ppm S regime. Under the revised decalin-modified model, this point shifted toward the boundary of the 350–500 ppm S domain.
The low-sulfur regulatory groups showed improved separation in the decalin-containing LDA models; however, residual overlap and classification uncertainty remained. In particular, the highly weathered P-1 and X-2 samples were positioned predominantly within the <50 ppm S region, but these assignments should be interpreted cautiously. Both sample groups exhibit relatively low abundances of several HDS-related diagnostic markers, and prolonged environmental weathering may alter their relative marker distributions and shift their positions within the discriminant space. Accordingly, the LDA results for P-1 and X-2 are more appropriately interpreted as being broadly consistent with a low-sulfur manufacturing era rather than as precise chronological assignments.
Crucially, all fresh commercial diesel reference points fell tightly within the 95% confidence ellipse of the modern 10 ppm S regulatory tier, demonstrating complete separation from the historical 50 ppm and 350 ppm S clusters. Because company B historically operates under severe refinery parameters that yield higher relative baseline abundances of the HDS side-products C3T, C0De and C1De (Figure 2), its fresh diesel formulations occupy a distinct territory. This rigorous HDS fingerprint, the 10 ppm S-limit 95% confidence ellipse, separates company B’s fresh diesel references into the upper region along the second canonical variable axis (Y-axis) in the C0De-modified LDA plot (Figure 4a), in sharp contrast to company A’s fresh samples, which are positioned in the lower portion of the axis.
Substituting C3T with either of the novel decalin DRs, C0De or C1De consistently maintained the classification of the contaminated soil extracts from site V within the 500–1500 ppm S regime. However, due to the low baseline abundances of BS3 and BS4 recorded in the site V core samples, the true initial S-content at this location was refined to below 500 ppm [11]. This adjustment suggests the spilled oils from site V were likely manufactured in the 1998–2002 historical window. Historically, the spills at the site V originated from a transitioning independent retail gas station that entered the market since 1990, which had not sourced fuel from Taiwan’s major diesel supplier (e.g., company A), based on the records [46]. These samples exhibited unique high-abundance normal alkanes (such as n-C17 and n-C18 with the baseline r-DR = 1.0), whereas the corresponding ratios in fresh modern ULSD diesels typically fall below 0.5 [11]. We therefore concluded that the spilled oils from site V reflect a specific, unweathered refining formulation with inherently low BS3 levels, a profile that is highly consistent with company B’s initial retail market entry.
Additionally, the updated LDA model indicated that the contamination events at the P-2 site involved diesel whose manufacturing period fell in the 2002–2005 regulatory regime, matching the estimated S-content threshold of 350 ppm. These findings further strengthen the source discrimination model for the P-1 site. This specific site was previously identified via PCA as a highly weathered company A oil fraction and represents a contamination event established during the historical transition of station ownership from company A to company B. Due to the lower baseline yields of the characteristic HDS products C3T, C0De and C1De inherent to older company A processing modes, the spilled diesel matrix at site P-1 possessed lower structural resistance to environmental weathering. The strongly weathered character of P-1, together with its relatively low HDS-marker abundances, may have contributed to displacement of these samples within the LDA space. Consequently, the apparent assignment of P-1 to the low-sulfur regulatory region should be regarded as semi-quantitative and should not be interpreted as an exact manufacturing date.

3. Materials and Methods

3.1. General Analytical Conditions

The experimental protocols for soil sampling, extraction of fresh and spilled diesel oils, sample preparation, and subsequent GC/MS analysis followed methodologies previously established and validated in our earlier publication [11]. Briefly, 2–5 sampling points were established at each contaminated gas station, with boreholes generally extending to depths of 5–10 m. Continuous soil cores were collected from approximately 1 m below ground surface to the groundwater table, and the intervals showing the highest contamination based on field screening were selected, sealed, stored at approximately 4 °C, and transported to the laboratory. For extraction, approximately 10 g of soil was sequentially extracted with DCM (3 × 10 mL) by ultrasonication for 15 min per cycle. The combined extracts were concentrated to approximately 4 mL by rotary evaporation at 40 °C and subsequently to 1.0 mL under nitrogen. Fresh diesel reference samples (0.50 mL) were separately suspended in 50 mL of an aqueous solution and extracted using DCM (3 × 3 mL), with vortex agitation for 15 min per extraction. The organic extracts were subsequently concentrated to 1.0 mL under nitrogen prior to GC/MS analysis.
Chromatographic separation and mass spectral analysis were performed using gas chromatography/mass spectrometry (GC/MS) systems (Models 6890 GC/5973 MSD, 7890A GC/5975C MSD or 7890B GC/5977B MSD; Agilent Technologies, Santa Clara, CA, USA). Separation was achieved on a DB-1 MS capillary column (60 m × 0.25 mm i.d. × 0.25 μm film thickness). Helium (99.9995%) was used as a carrier gas at a constant flow rate of 1.0 mL min−1. The GC oven temperature program was initiated at 40 °C (held for 5 min), ramped at 4 °C/min to a final temperature of 300 °C, where it was maintained isothermally at 300 °C for 10 min. GC/MS data acquisition was performed in full scan mode (scan range: m/z 50–650). For chemical fingerprinting and diagnostic ratio calculations, characteristic extracted ion mass (EIM, m/z) profiles for each target analyte were systematically extracted from the total ion chromatogram (TIC) dataset for peak integration. The specific EIMs from the extracted ion chromatograms (EICs) utilized for integration and the corresponding retention times for C0De and C1De are detailed in the electronic Supplementary Information (Supplementary Materials; Table S1 and Figure S5). All data processing and statistical analyses were performed using OriginPro 2024 (OriginLab Corp., Northampton, MA, USA).

3.2. Chemometric Modeling and Diagnostic Calculations [10,11]

A molecular proxy based on alkyl dibenzothiophenes (CxD: C1D and C2D) was utilized to infer the S-content of the diesel samples on a mass basis. The BS3-normalized alkyl-dibenzothiophene ratio (DRCxD/BS3) was calibrated against a crude middle-distillate feedstock originating from the Middle East with a known total sulfur content of 6700 mg S kg−1 fuel (6700 ppm, w/w) [11]. Assuming proportionality between DRCxD/BS3 and sulfur content, the inferred sulfur content of each spill sample was estimated relative to the DRCxD/BS3 value of this reference [11]. This approach represents a reference-based single-point calibration rather than a conventional multi-point calibration curve for absolute sulfur quantification. To mitigate operational errors arising from absolute concentration variances in weathered field spills, target markers were converted into normalized DRs. The highly conserved, biodegradation-resistant C15 sesquiterpane derivative (BS3) was chosen as the universal internal reference denominator to compute standard relative indicators (DRmarkers/BS3) [11]. To facilitate cross-site comparison for correlation and regression analysis, each DR (e.g., C0De or C1De) was normalized against the maximum value observed within the entire dataset to yield the relative diagnostic ratio (r-DR) (Table S1, in Supplementary Materials) [11].

3.3. Multivariate Statistical Analysis: Principal Component Analysis (PCA) and Linear Discriminant Analysis (LDA)

PCA was conducted to differentiate source attributes between the two dominant fuel suppliers (company A vs. B). The dataset comprised all soil spill samples from the 12 sites and fresh diesel samples (2018–2025). The PCA model was executed on the correlation matrix computed from the untransformed DRs. The first two principal components (PC1 and PC2) were utilized for the visualization and interpretation of sample clustering.
For manufacturer discrimination, only two predefined classes (company A and company B) were involved. Because canonical LDA can generate at most K − 1 discriminant functions for K classes, the two-class problem yields only one non-zero canonical discriminant function and therefore does not provide a natural two-dimensional canonical score plot. PCA was consequently retained for visualization of the manufacturer-associated sample distribution and group overlap on the PC1–PC2 plane, whereas cross-validated LDA was used to quantitatively evaluate classification performance. Thus, PCA and LDA served complementary exploratory and classification purposes, respectively.
To evaluate manufacturing era classification, LDA was performed. The inferred S-content level (in ppm (mg S kg−1)), corresponding to historical government regulatory limits, was defined as the grouping variable [11]. Selected DRs served as predictor variables to generate canonical discriminant functions, enabling evaluation of class separation and misclassification rates over the regulatory timeline. The canonical variables of the diesel samples for LDA were calculated. The derived equations are presented in Table S2 in Supplementary Materials.

3.4. Cross-Validation and Evaluation of Classification Performance for Multivariate Statistical Analysis

Because PCA is an unsupervised exploratory method and does not directly provide classification accuracy, the incremental contribution of DRC0De/BS3 and DRC1De/BS3 to manufacturer discrimination was additionally evaluated using cross-validated two-class LDA between company A and B [47]. Therefore, four predictor sets corresponding to the PCA source-discrimination framework were compared. These included DRC2B/BS3/DRC3T/BS3/DRBS4/BS3/DRPh/BS3, the baseline set plus DRC0De/BS3, the baseline set plus DRC1De/BS3, and the baseline set plus both DRC0De/BS3 and DRC1De/BS3 (Tables S6 and S7 in Supplementary Materials). CV accuracy, class-specific recall, balanced accuracy, and cross-validated confusion counts were used to evaluate classification performance [48,49].
The manufacturing-era LDA models were also evaluated by cross-validation. The original predictor set comprised DRC2B/BS3, DRC3N/BS3, DRC3T/BS3, and DRCxD/BS3, whereas the two decalin-containing models replaced C3T with C0De or C1De, respectively. CV accuracy and balanced accuracy were calculated to quantify the discrimination of the broad sulfur-regulatory groups from 10 to 3000 ppm (Table S8 in Supplementary Materials).
For both manufacturer and manufacturing-era classification, performance metrics were calculated from the cross-validated predictions rather than from the re-substitution classifications of the complete training dataset. Leave-one-out cross-validation (LOOCV) was applied, in which each observation was excluded once, the LDA model was fitted using the remaining N − 1 observations, and the excluded observation was subsequently assigned to a predicted class [47]. The cross-validated predictions from all iterations were then combined to construct the confusion matrix [48].
Let n k j denote the number of observations belonging to observed class k and assigned to predicted class j, N the total number of observations, and K the number of classes. Cross-validated accuracy (CV accuracy) was calculated as the proportion of correctly classified observations:
C V   a c c u r a c y % = k = 1 K n k k N × 100 % .
The recall for each class k was calculated as
R e c a l l k = n k k j = 1 K n k j ,
and balanced accuracy was calculated as the unweighted mean of the class-specific recall values [49]:
B a l a n c e d   a c c u r a c y % = 1 K k = 1 K R e c a l l k × 100 %
For the two-class manufacturer-discrimination analysis, balanced accuracy therefore corresponds to the mean of the recall values for company A and company B. For the multiclass manufacturing-era analysis, the same calculation was applied across all sulfur-regulatory groups.
Specifically, for the two-class manufacturer analysis ( N = 84 ), CV accuracy and balanced accuracy were calculated as
C V   a c c u r a c y % = n A A + n B B 84 × 100 % ,
B a l a n c e d   a c c u r a c y % = 1 2 n A A n A A + n A B + n B B n B B + n B A × 100 % ,
where n A A and n B B represent correctly classified observations from company A and company B, respectively, whereas n A B and n B A represent the corresponding cross-validated misclassifications.

3.5. Quality Assurance, Quality Control, and Analytical Uncertainty

The QA/QC methods were detailed in our previous study [11]. Solvent blank tests ensured that no contamination peaks or carryover occurred during the GC/MS analysis. Furthermore, the evaluation of analytical precision and uncertainty demonstrated that the relative standard deviations (RSDs) remained below 10% across a dynamic sample concentration range of 2.5–20 mg/mL in DCM. For both the raw GC/MS peak area integrations and the calculation of BS3-normalized diagnostic ratios (DRs), the calculated RSDs for most markers, including C0De and C1De, fell within the 10% uncertainty threshold (Table S3 in Supplementary Materials) [11]. All analytical variations adhered to the 14% repeatability limit prescribed for environmental oil spill forensic analysis [9].
The analytical sensitivity of C0De and C1De was additionally evaluated using representative fresh ULSD and high-sulfur diesel (~6700 ppm S) samples. Neat diesel samples were directly diluted with DCM to nominal diesel fractions of 1/2, 1/4, 1/8, 1/16, and 1/32 (v/v), and analyzed under identical GC/MS conditions. Signal-to-noise (S/N) ratios were determined for C0De and six predefined resolved C1De peaks. S/N ≥ 3 and S/N ≥ 10 were used as operational criteria for detection and reliable quantification, respectively. To accurately reflect the complex matrix effects, the sensitivity results are reported as matrix-specific, dilution-based operational detection and quantification levels rather than as absolute analyte concentrations derived from neat authentic standards (Table S4 in Supplementary Materials).

4. Conclusions

This study establishes unalkylated and monomethylated decahydronaphthalenes (C0De and C1De) as chemical signatures that improve manufacturing era resolution in environmental forensics for diesel spills, spanning the timeline from legacy LSD (<500 ppm) to the modern, post-2011 ULSD era. As C0De and C1De HDS markers act as structural analogs to n-alkylcyclohexanes, both decalin compounds are less susceptible to deep anaerobic underground weathering than heavier, long-chain n-alkylcyclohexanes.
The weak negative association between C1De and the CxD proxy was consistent with an inverse relationship between sulfur-related and hydrogenated markers, although the relative contributions of feedstock composition, refining conditions, and environmental weathering cannot be independently resolved from the present dataset. The baseline PCA framework differentiated broad manufacturer-associated compositional patterns, and the decalin markers provided complementary information when incorporated into the multivariate models.
Several limitations of the present study should be acknowledged. First, the commercial diesel and field-spill samples investigated here were collected primarily within the Taiwanese fuel market, and the transferability of the proposed markers to diesel formulations from other geographic regions remains to be validated. Second, although the field dataset includes highly weathered samples, including samples with strongly depleted conventional weathering indicators, the persistence of C0De and C1De has not yet been independently verified under controlled extreme-biodegradation conditions. Third, detailed crude-oil feedstock histories and refinery operating parameters were unavailable for the commercial samples; therefore, the independent contributions of crude-oil origin and refining conditions cannot be fully disentangled. Future studies incorporating geographically diverse fuels, known feedstock histories, and controlled biodegradation experiments will be necessary to define the broader applicability of these markers.
Overall, incorporating the decalin markers into the supervised LDA framework improved the discrimination of broad manufacturing-era groups within the investigated dataset. Nevertheless, residual misclassification in some strongly weathered samples indicates that this approach should be regarded as a complementary, semi-quantitative forensic tool rather than a method for exact chronological dating.

Supplementary Materials

The following supporting information can be downloaded at https://www.mdpi.com/article/10.3390/molecules31173006/s1. Table S1. Analytical and baseline data for BS3-normalized diagnostic ratios (DRs) of C0De and C1De. Table S2. Canonical discriminant-function coefficients and explained variance of LDA models using alternative DRX/BS3 variables. Table S3. Analytical uncertainty and repeatability of GC/MS peak-area integration, and BS3-normalized diagnostic ratios. Table S4. Dilution-based operational detection and quantification levels of C0De and resolved C1De peaks in representative diesel matrices. Table S5. The estimated sulfur contents (S-contents in ppm) for the diesel spill samples collected from 12 gas stations were derived using the diagnostic ratios DRCxD/BS3. This chemical proxy was calibrated against a reference crude middle distillate provided by Taiwan CPC Co., which had an S-content of 6700 ppm. Table S6. Cross-validated confusion counts for LDA models used in manufacturer discrimination. Table S7. Sensitivity analysis of cross-validated LDA performance using alternative marker combinations for manufacturer discrimination. Table S8. Cross-validated performance of LDA models for discrimination among sulfur-regulatory manufacturing-era groups. All predictor variables represent BS3-normalized diagnostic ratios, i.e., DRC2B/BS3, DRC3N/BS3, DRC3T/BS3, DRCxD/BS3, DRC0De/BS3, and DRC1De/BS3. A check mark (✓) indicates inclusion of the corresponding diagnostic ratio in the LDA model, whereas an em dash (—) indicates exclusion. The baseline model comprised DRC2B/BS3, DRC3N/BS3, DRC3T/BS3, and DRCxD/BS3. In the decalin-substitution models, DRC3T/BS3 was replaced by either DRC0De/BS3 or DRC1De/BS3. CV accuracy represents overall cross-validated classification accuracy, whereas balanced accuracy represents the mean of the class-specific recall values across the sulfur-regulatory groups. The highest performance values are shown in bold. Figure S1. Linear regression analysis of BS3-normalized relative diagnostic ratios using C0De and C1De as reference variables. The scatter plots illustrate the correlations between individual r-DRmarker/BS3 values and the reference r-DRs. Solid lines represent the least-squares linear fits, while shaded regions indicate the 95% confidence bands. Pearson linear correlation coefficients (r) and slopes are provided in the figure legend. Figure S2. An expanded pairwise Pearson correlation matrix including BS3-normalized C0De and C1De relative diagnostic ratios (r-DRs) alongside the previous established markers for comparison [11]. Asterisks indicate statistical significance levels: p ≤ 0.05, p ≤ 0.01, and p ≤ 0.001. Figure S3. Baseline PCA source identification model using four distinct BS3-normalized DRs. This baseline PCA model used DRBS4/BS3, DRPh/BS3, DRC2B/BS3, and DRC3T/BS3 as variables for the source identification of spilled and fresh diesel samples [11]. This model is provided as the baseline reference for comparison with the decalin-modified PCA models. Figure S4. Baseline LDA manufacturing-era classification model using the conventional HDS DRX/BS3 variable. The baseline LDA model uses DRCxD/BS3, DRC2B/BS3, DRC3N/BS3, and DRX/BS3 as predictor variables, with X set to C3T. This model is provided as the baseline reference for comparison with the subsequent LDA models in which the C3T DR is substituted with C0De or C1De DRs [11]. Figure S5. Representative extracted ion chromatograms (EICs) of C0De and C1De generated from full-scan GC/MS data. DR calculations for C0De and C1De in source identification and manufacturing-era estimation were based on the EIC of m/z =95. The additional superimposed EICs at m/z 95, 138, and 152 were included as confirmatory traces for the molecular ion masses of C0De (m/z 138) and C1De (m/z 152), respectively.

Author Contributions

Conceptualization, W.-H.H. and S.S.-F.Y.; Data curation, W.-H.H.; Formal analysis, W.-H.H., Z.-H.L. and S.S.-F.Y.; Funding acquisition, S.S.-F.Y.; Investigation, W.-H.H., Z.-H.L. and S.S.-F.Y.; Methodology, W.-H.H. and S.S.-F.Y.; Validation, W.-H.H., Z.-H.L. and S.S.-F.Y.; Visualization, W.-H.H. and S.S.-F.Y.; Project administration, S.S.-F.Y.; Resources, S.S.-F.Y.; Supervision, S.S.-F.Y.; Writing—original draft, W.-H.H., Z.-H.L. and S.S.-F.Y.; Writing—review and editing, W.-H.H., Z.-H.L., S.-H.L. and S.S.-F.Y. All authors have read and agreed to the published version of the manuscript.

Funding

This work was supported by grants from Academia Sinica, Taiwan, and the Soil and Groundwater Remediation Fund Management Board, Environmental Management Administration, Ministry of Environment (MOENV), Taiwan, R.O.C. (EPA-107-GA03-03-A179).

Institutional Review Board Statement

Not applicable.

Informed Consent Statement

Not applicable.

Data Availability Statement

The data presented in this study are available in the article and Supplementary Materials . ( Supplementary Information: tables detailing the specific EIM values of C0De and C1De and their corresponding EIC (extracted ion chromatograms) data; the baseline data used for normalizing the BS3 diagnostic ratios of C0De and C1De; LOD/LOQ analysis; the estimated S-content for the diesel spill samples; cross-validated linear discriminant performance, including the confusion counts for the multivariate statistical analysis; linear correlation plots of the BS3-normalized relative diagnostic ratios based on C0De and C1De, along with the regression data; and prior PCA and LDA data (excluding C0De and C1De) used for the classification of spilled and fresh diesel samples according to Taiwan’s historical regulation periods for source identification and manufacturing-era estimation.).

Conflicts of Interest

The authors declare no conflict of interest.

References

  1. Oudijk, G. Age dating of middle-distillate fuels released to the subsurface environment. In Earth Sciences; Dar, I.A., Ed.; IntechOpen: London, UK, 2012; pp. 541–583. [Google Scholar]
  2. Yang, C.; Wang, Z.; Hollebone, B.P.; Brown, C.E.; Landriault, M. Characteristics of bicyclic sesquiterpanes in crude oils and petroleum products. J. Chromatogr. A 2009, 1216, 4475–4484. [Google Scholar] [CrossRef] [Scilit] [PubMed]
  3. Hostettler, F.D.; Lorenson, T.D.; Bekins, B.A. Petroleum Fingerprinting with Organic Markers. Environ. Forensics 2013, 14, 262–277. [Google Scholar] [CrossRef] [Scilit]
  4. Han, B.; Zheng, L.; Yu, S. Evaluation of diagnostic ratios of phenanthrenes and chrysenes for the identification of severely weathered spilled oils from the simulation weathering and the Sinopec pipeline explosion at Huangdao, 2013. RSC Adv. 2018, 8, 32164–32171. [Google Scholar] [CrossRef] [Scilit] [PubMed]
  5. Han, B.; Zheng, L.; Yu, S. Applicability evaluation of the diagnostic ratios consisting of bicyclic sesquiterpanes to source identification for seriously weathered spilled oils. Anal. Methods 2019, 11, 5997–6003. [Google Scholar] [CrossRef] [Scilit]
  6. Filewood, T.; Kwok, H.; Brunswick, P.; Yan, J.; Ollinik, J.E.; Cote, C.; Kim, M.; van Aggelen, G.; Helbing, C.C.; Shang, D. Advancement in oil forensics through the addition of polycyclic aromatic sulfur heterocycles as biomarkers in diagnostic ratios. J. Hazard. Mater. 2022, 435, 129027. [Google Scholar] [CrossRef] [Scilit] [PubMed]
  7. Christensen, L.B.; Larsen, T.H. Method for determining the age of diesel oil spills in the soil. Groundw. Monit. Remediat. 1993, 13, 142–149. [Google Scholar] [CrossRef] [Scilit]
  8. Wang, Z.; Fingas, M.; Page, D.S. Oil spill identification. J. Chromatogr. A 1999, 843, 369–411. [Google Scholar] [CrossRef] [Scilit]
  9. CEN/TR, 15522–2:2012; Oil Spill Identification—Waterborne Petroleum and Petroleum Products—Part2: Analytical Methodology and Interpretation of Results Based on GC-FID and GC-MS Low Resolution Analyses. European Committee for Standardization: Brussels, Belgium, 2012.
  10. Yang, C.; Wang, Z.; Hollebone, B.P.; Brown, C.E.; Yang, Z.; Landriault, M. Chromatographic Fingerprinting Analysis of Crude Oils and Petroleum Products. In Handbook of Oil Spill Science and Technology; John Wiley & Sons, Inc.: Hoboken, NJ, USA, 2014; pp. 93–163. [Google Scholar]
  11. Hsu, W.-H.; Lin, Z.-H.; Wang, S.; Huang, T.-K.; Wu, S.-H.; Lin, S.-H.; Yu, S.S.-F. Integrating manufacturing era estimation and source identification of diesel spills in Taiwan: Leveraging hydrodesulfurization (HDS) markers and regulatory history. J. Hazard. Mater. Adv. 2026, 23, 101367. [Google Scholar] [CrossRef] [Scilit]
  12. Kaplan, I.R.; Galperin, Y.; Alimi, H.; Lee, R.-P.; Lu, S.-T. Patterns of chemical changes during environmental alteration of hydrocarbon fuels. Groundw. Monit. Remediat. 1996, 16, 113–124. [Google Scholar] [CrossRef] [Scilit]
  13. Oudijk, G. Age dating heating-oil releases, Part 1. heating-oil composition and subsurface weathering. Environ. Forensics 2009, 10, 107–119. [Google Scholar] [CrossRef] [Scilit]
  14. Lundberg, R. Validation of Biomarkers for the Revision of the CEN/TR 15522-2:2012 Method: A Statistical Study of Sampling, Discriminating Powers and Weathering of New Biomarkers for Comparative Analysis of Lighter Oils; Department of Physics, Chemistry and Biology, Linköping University: Linköping, Sweden, 2019. [Google Scholar]
  15. Kaplan, I.R.; Galperin, Y.; Lu, S.-T.; Lee, R.-P. Forensic environmental geochemistry: Differentiation of fuel-types, their sources and release time. Org. Geochem. 1997, 27, 289–317. [Google Scholar] [CrossRef] [Scilit]
  16. Wang, Z.; Fingas, M.F. Development of oil hydrocarbon fingerprinting and identification techniques. Mar. Pollut. Bull. 2003, 47, 423–452. [Google Scholar] [CrossRef] [Scilit] [PubMed]
  17. Tobiszewski, M.; Namieśnik, J. PAH diagnostic ratios for the identification of pollution emission sources. Environ. Pollut. 2012, 162, 110–119. [Google Scholar] [CrossRef] [Scilit] [PubMed]
  18. Arey, J.S.; Nelson, R.K.; Reddy, C.M. Disentangling oil weathering using GC×GC. 1. chromatogram analysis. Environ. Sci. Technol. 2007, 41, 5738–5746. [Google Scholar] [CrossRef] [Scilit] [PubMed]
  19. Montas, L.; Ferguson, A.C.; Mena, K.D.; Solo-Gabriele, H.M.; Paris, C.B. PAH depletion in weathered oil slicks estimated from modeled age-at-sea during the Deepwater Horizon oil spill. J. Hazard. Mater. 2022, 440, 129767. [Google Scholar] [CrossRef] [Scilit] [PubMed]
  20. Wang, Z.; Stout, S.A.; Fingas, M. Forensic fingerprinting of biomarkers for oil spill characterization and source identification. Environ. Forensics 2006, 7, 105–146. [Google Scholar] [CrossRef] [Scilit]
  21. Wade, M.J. Age-dating Diesel Fuel Spills: Using the European Empirical Time-based Model in the U.S.A. Environ. Forensics 2001, 2, 347–358. [Google Scholar] [CrossRef] [Scilit]
  22. McGregor, L.A.; Gauchotte-Lindsay, C.; Nic Daéid, N.; Thomas, R.; Kalin, R.M. Multivariate statistical methods for the environmental forensic classification of coal tars from former manufactured gas plants. Environ. Sci. Technol. 2012, 46, 3744–3752. [Google Scholar] [CrossRef] [Scilit] [PubMed]
  23. Sun, P.; Bao, K.; Li, H.; Li, F.; Wang, X.; Cao, L.; Li, G.; Zhou, Q.; Tang, H.; Bao, M. An efficient classification method for fuel and crude oil types based on m/z 256 mass chromatography by COW-PCA-LDA. Fuel 2018, 222, 416–423. [Google Scholar] [CrossRef] [Scilit]
  24. Chua, C.C.; Brunswick, P.; Kwok, H.; Yan, J.; Cuthbertson, D.; van Aggelen, G.; Helbing, C.C.; Shang, D. Enhanced analysis of weathered crude oils by gas chromatography-flame ionization detection, gas chromatography-mass spectrometry diagnostic ratios, and multivariate statistics. J. Chromatogr. A 2020, 1634, 461689. [Google Scholar] [CrossRef] [Scilit] [PubMed]
  25. Alexandrino, G.L.; Tomasi, G.; Kienhuis, P.G.M.; Augusto, F.; Christensen, J.H. Forensic investigations of diesel oil spills in the environment using comprehensive two-dimensional gas chromatography–high resolution mass spectrometry and chemometrics: New perspectives in the absence of recalcitrant biomarkers. Environ. Sci. Technol. 2019, 53, 550–559. [Google Scholar] [CrossRef] [Scilit] [PubMed]
  26. Blanchard, A.L.; Shaw, D.G. Multivariate analysis of polycyclic aromatic hydrocarbons in sediments of Port Valdez, Alaska, 1989–2019. Mar. Pollut. Bull. 2021, 171, 112906. [Google Scholar] [CrossRef] [Scilit] [PubMed]
  27. Prasantongkolmol, T.; Thongkorn, H.; Sunipasa, A.; Do, H.A.; Saeung, C.; Jongpatiwut, S. Analysis of sulfur compounds for crude oil fingerprinting using gas chromatography with sulfur chemiluminescence detector. Mar. Pollut. Bull. 2023, 186, 10. [Google Scholar] [CrossRef] [Scilit] [PubMed]
  28. Zhong, M.; Niu, Z.; Fan, J.; Huang, H.; Li, N.; Li, J.; Zhang, H. Establishing the relationship between heavy oil viscosity and molecular markers using an enhanced neural network model. Sci. Rep. 2025, 15, 33289. [Google Scholar] [CrossRef] [Scilit] [PubMed]
  29. Zhang, M.; Yan, D.; Li, T. Combined diagnostic ratio of trace elements and biomarkers with multivariate statistical analysis for the differentiation of crude oil origin. Microchem. J. 2024, 200, 110491. [Google Scholar] [CrossRef] [Scilit]
  30. Sampaio, F.X.A.; Garcia, K.S.; de Souza Queiroz, A.F.; Machado, M.E. Determination of organic sulfur markers in crude oils by gas chromatography triple quadrupole mass spectrometry. Fuel Process. Technol. 2021, 217, 106813. [Google Scholar] [CrossRef] [Scilit]
  31. Stanislaus, A.; Marafi, A.; Rana, M.S. Recent advances in the science and technology of ultra low sulfur diesel (ULSD) production. Catal. Today 2010, 153, 1–68. [Google Scholar] [CrossRef] [Scilit]
  32. Tanimu, A.; Alhooshani, K. Advanced hydrodesulfurization catalysts: A review of design and synthesis. Energy Fuels 2019, 33, 2810–2838. [Google Scholar] [CrossRef] [Scilit]
  33. Weng, X.; Cao, L.; Zhang, G.; Chen, F.; Zhao, L.; Zhang, Y.; Gao, J.; Xu, C. Ultradeep hydrodesulfurization of diesel: Mechanisms, catalyst design strategies, and challenges. Ind. Eng. Chem. Res. 2020, 59, 21261–21274. [Google Scholar] [CrossRef] [Scilit]
  34. Chandra Srivastava, V. An evaluation of desulfurization technologies for sulfur removal from liquid fuels. RSC Adv. 2012, 2, 759–783. [Google Scholar] [CrossRef] [Scilit]
  35. Nakajima, K.; Suganuma, S.; Tsuji, E.; Katada, N. Mechanism of tetralin conversion on zeolites for the production of benzene derivatives. React. Chem. Eng. 2020, 5, 1272–1280. [Google Scholar] [CrossRef] [Scilit]
  36. Wei, Q.; Chen, J.; Song, C.; Li, G. HDS of dibenzothiophenes and hydrogenation of tetralin over a SiO2 supported Ni-Mo-S catalyst. Front. Chem. Sci. Eng. 2015, 9, 336–348. [Google Scholar] [CrossRef] [Scilit]
  37. Rautanen, P.A.; Lylykangas, M.S.; Aittamaa, J.R.; Krause, A.O.I. Liquid Phase Hydrogenation of Naphthalene on Ni/Al2O3. In Studies in Surface Science and Catalysis; Froment, G.F., Waugh, K.C., Eds.; Elsevier: Amsterdam, The Netherlands, 2001; Volume 133, pp. 309–316. [Google Scholar]
  38. Stanislaus, A.; Cooper, B.H. Aromatic hydrogenation catalysis: A review. Catal. Rev. 1994, 36, 75–123. [Google Scholar] [CrossRef] [Scilit]
  39. Wang, H.; Zhang, S.; Weng, N.; Zhang, B.; Zhu, G.; Liu, L. Discovery and identification of a series of alkyl decalin isomers in petroleum geological samples. Analyst 2015, 140, 4694–4701. [Google Scholar] [CrossRef] [Scilit] [PubMed]
  40. Blanco, E.; Di Felice, L.; Catherin, N.; Piccolo, L.; Laurenti, D.; Lorentz, C.; Geantet, C.; Calemma, V. Understanding the Mechanisms of Decalin Hydroprocessing Using Comprehensive Two-Dimensional Chromatography. Ind. Eng. Chem. Res. 2016, 55, 12516–12523. [Google Scholar] [CrossRef] [Scilit]
  41. Guthrie, J.D.; Rowell, C.; Nowling, S.E.; Lee, Y.-j.; Chen, R.J.; Meier, C.B.; Kilaz, G.; Peretich, M.E.; Kenttämaa, H.I. Molecular Characterization of Hydrocarbons in Aviation Fuels via Two-Dimensional Gas Chromatography/Methane Chemical Ionization Mass Spectrometry. Energy Fuels 2025, 39, 6319–6331. [Google Scholar] [CrossRef] [Scilit]
  42. Morales-Valencia, E.M.; Castillo-Araiza, C.O.; Giraldo, S.A.; Baldovino-Medrano, V.G. Kinetic assessment of the simultaneous hydrodesulfurization of dibenzothiophene and the hydrogenation of diverse polyaromatic structures. ACS Catal. 2018, 8, 3926–3942. [Google Scholar] [CrossRef] [Scilit]
  43. Asuero, A.G.; Sayago, A.; González, A.G. The correlation coefficient: An overview. Crit. Rev. Anal. Chem. 2006, 36, 41–59. [Google Scholar] [CrossRef] [Scilit]
  44. Hostettler, F.D.; Kvenvolden, K.A. Alkylcyclohexanes in environmental geochemistry. Environ. Forensics 2002, 3, 293–301. [Google Scholar] [CrossRef] [Scilit]
  45. Hostettler, F.D.; Wang, Y.; Huang, Y.; Cao, W.; Bekins, B.A.; Rostad, C.E.; Kulpa, C.F.; Laursen, A. Forensic fingerprinting of oil-spill hydrocarbons in a methanogenic environment–Mandan, ND and Bemidji, MN. Environ. Forensics 2007, 8, 139–153. [Google Scholar]
  46. Wu, S.-H.; Chen, M.-H.; Hsu, C.-H.; Hsu, C.-C.; Chen, T.-Y.; Liu, W.-Y.; Lin, C.-C.; Yu-Yun, H.; Wu, T.-T.; Chen, T.-C. Applying Environmental Forensic Techniques to Establish Commercial Diesel Fingerprint Investigation Plan (III); Grant Final Report (Grant No. EPA-105-GA13-03-A194); Environmental Protection Administration: Taipei, Taiwan, 2017.
  47. Lachenbruch, P.A.; Mickey, M.R. Estimation of Error Rates in Discriminant Analysis. Technometrics 1968, 10, 1–11. [Google Scholar] [CrossRef]
  48. Sokolova, M.; Lapalme, G. A systematic analysis of performance measures for classification tasks. Inf. Process. Manag. 2009, 45, 427–437. [Google Scholar] [CrossRef] [Scilit]
  49. Brodersen, K.H.; Ong, C.S.; Stephan, K.E.; Buhmann, J.M. The Balanced Accuracy and Its Posterior Distribution. In 2010 20th International Conference on Pattern Recognition; IEEE: Piscataway, NJ, USA, 2010; pp. 3121–3124. [Google Scholar]
Scheme 1. Proposed hydrogenation pathways for the formation of C10- and C11-decalins (C0De and C1De) from C10- and C11-naphthalenes via the corresponding tetralin intermediates under hydrotreating/HDS conditions. The scheme represents literature-supported pathways rather than refinery-specific proprietary processes.
Molecules 31 03006 sch001
Figure 1. Pairwise correlation matrix of BS3-based relative diagnostic ratios (r-DRs), including n-C17, n-C18, BS4, BS10, Ph, CxD, C2B, C1N-C4N, C2T-C3T, C0De, and C1De, derived from 12 sampling sites. The plot illustrates the correlation coefficients (r) obtained from linear regression analysis between mutual DRs. Circle size represents the absolute magnitude of Pearson’s r-value, whereas color represents the sign and direction of the correlation (red, positive; blue, negative; near-white, weak correlation). Numerical r values are displayed in black to improve readability.
Molecules 31 03006 g001
Figure 2. Distribution of BS3-based r-DRs, including BS4, Ph, C2B, C3T, C0De, and C1De derived from spilled oil (Table S5 in Supplementary Materials) and fresh ULSD (2018–2025) samples attributed to companies A and B. (a) Overall distribution across the full r-DR range. (b) Expanded view of the 0.0–0.4 region (highlighted by the red dashed box in panel (a)) to improve visualization of the densely distributed low-ratio observations. Black and red symbols represent spill-site samples associated with companies A and B, respectively, whereas green and blue symbols represent fresh ULSD samples from companies A and B, labeled by collection year (two-digit numbers).
Molecules 31 03006 g002aMolecules 31 03006 g002b
Figure 3. Differentiation of diesel samples (company A vs. company B) using principal component analysis (PCA). The PCA was conducted using five distinct diagnostic ratios as variables: (a,b) DRBS4/BS3, DRPh/BS3, DRC2B/BS3, DRC3T/BS3, and DRC0De/BS3 ratios; (c,d) DRBS4/BS3, DRPh/BS3, DRC2B/BS3, DRC3T/BS3, and DRC1De/BS3 ratios. These were analyzed across 12 spill sites, refined into 19 distinct events (Table S5 in Supplementary Materials), alongside fresh reference diesel samples (denoted by collection year with a two-digit number; e.g., A-20 represents the company A diesel sample collected in 2020). Black symbols denote samples associated with company A, while red symbols denote those associated with company B. Ellipses represent the 95% confidence regions of the manufacturer-associated PCA distributions and are used to visualize compositional similarity, group structure, and source-associated positioning of the samples. The red-boxed regions in the complete PCA plots in panels (a,c) indicate the areas selected for enlarged visualization. Panels (b,d) show the corresponding zoom-in views of panels (a,c), respectively, covering PC1 = −2.5 to 1.5 and PC2 = −2 to 2 to facilitate visualization of the densely distributed data points associated primarily with company A.
Molecules 31 03006 g003
Figure 4. Manufacturing era classification of spilled and fresh diesel samples using linear discriminant analysis (LDA). The LDA model classified samples into groups defined by inferred S-content levels corresponding to Taiwan’s historical regulatory period [11]. Four key diagnostic ratios, (a) DRCxD/BS3, DRC2B/BS3, DRC3N/BS3, and DRC0De/BS3; (b) DRCxD/BS3, DRC2B/BS3, DRC3N/BS3, and DRC1De/BS3, were employed as discriminating variables. Marker colors distinguish the different S-content regulation zones (e.g., 3000, 1500, 500, 350, 50 and 10 ppm). Ellipses represent the 95% confidence regions of the regulatory groups and illustrate both the overall separation and residual overlap among adjacent manufacturing-era classes.
Molecules 31 03006 g004
Table 1. Cross-validated (CV) two-class LDA for evaluating the incremental performance of the C0De and C1De HDS markers in manufacturer discrimination.
Model aCV Accuracy (%) bBalanced Accuracy (%) cMisclassified (n/84) d
Baseline [11]95.2496.834
+C0De97.6298.412
+C1De96.4397.623
+C0De + C1De92.8690.486
a The baseline model comprised the BS3-normalized diagnostic ratios of C2B, C3T, BS4, and Ph (DRC2B/BS3, DRC3T/BS3, DRBS4/BS3, and DRPh/BS3, respectively). The +C0De and +C1De models were constructed by individually adding DRC0De/BS3 or DRC1De/BS3 to the baseline predictor set, whereas the “+C0De + C1De model” included both decalin ratios. b CV accuracy represents the proportion of correctly classified observations under cross-validation. c Balanced accuracy was calculated as the mean of the class-specific recall values for company A and company B. d “Misclassified” indicates the number of cross-validated predictions that did not match the observed manufacturer among the 84 observations. The highest performance values are shown in bold.
Disclaimer/Publisher’s Note: The statements, opinions and data contained in all publications are solely those of the individual author(s) and contributor(s) and not of MDPI and/or the editor(s). MDPI and/or the editor(s) disclaim responsibility for any injury to people or property resulting from any ideas, methods, instructions or products referred to in the content.