Article

Comprehensive LC-MS Analysis of the Most Abundant Flavonoid Glycosides in the Extracts of Alcea rosea Flowers

by
Weronika Wiśniewska
1,
Monika Beszterda-Buszczak
2 and
Rafał Frański
1,*
1
Faculty of Chemistry, Adam Mickiewicz University, Uniwersytetu Poznańskiego 8, 61-614 Poznań, Poland
2
Department of Food Biochemistry and Analysis, Poznań University of Life Sciences, Mazowiecka 48, 60-623 Poznań, Poland
*
Author to whom correspondence should be addressed.
Molecules 2026, 31(15), 2737; https://doi.org/10.3390/molecules31152737
Submission received: 14 July 2026 / Revised: 4 August 2026 / Accepted: 5 August 2026 / Published: 6 August 2026

Abstract

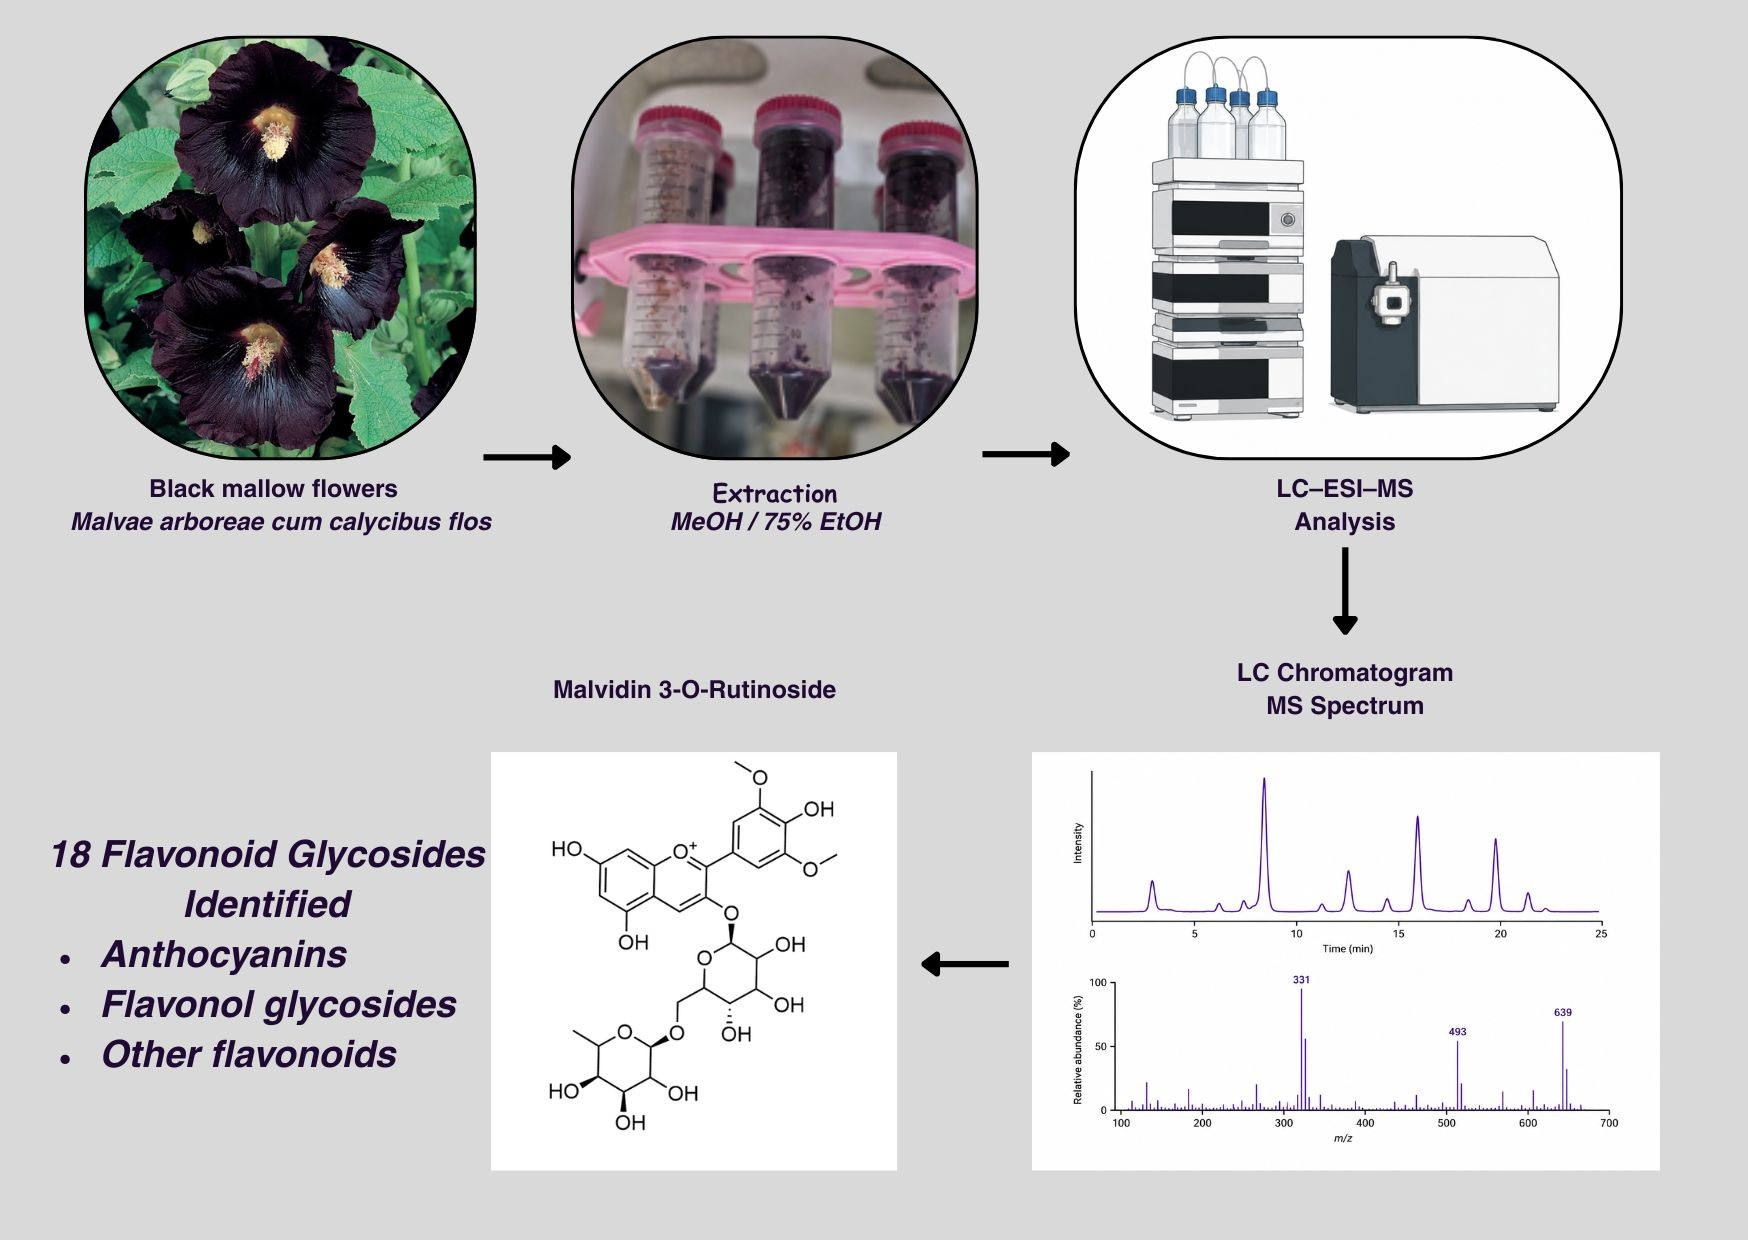
The extracts of the Alcea rosea L. flowers are known to show various kinds of biomedical activities and are widely used as food and cosmetic ingredients. Unfortunately, no comprehensive analysis aimed at the identification of the most abundant flavonoid glycosides present in the extract of Alcea rosea L. has been made as of yet. In this paper we present the LC-MS identification of the most abundant flavonoid glycosides in the methanol and 75% ethanol extracts of Alcea rosea L. obtained from two manufacturers. The identification has been based on the detection of the respective parent and product ions as well as their relative abundances. The differences between identified isomeric and isobaric compounds have also been discussed. In all extracts a number of 3-O-anthocyanidin glycosides (anthocyanins) and 3-O-flavonol glycosides have been identified. Among the anthocyanins, the most abundant were malvidin glycosides, e.g., malvidin 3-O-(6″-[E]-p-coumaroyl)glucoside; among the flavonol glycosides, the most abundant were kaempferol glycosides, e.g., tiliroside.

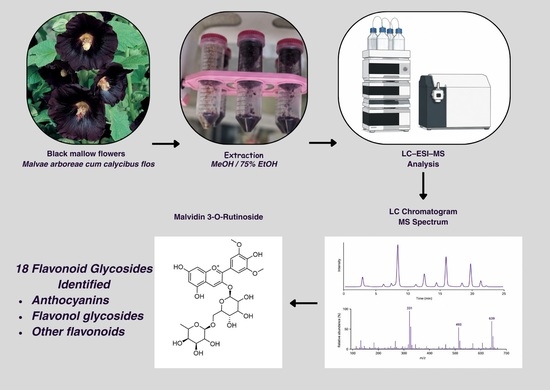
Graphical Abstract

1. Introduction

The species from the genus Alcea are ornamental garden plants grown for their beautiful, showy and very colorful flowers. Among these species, the Alcea rosea L., known as hollyhock, seems to be the most common; its flowers can be white, yellow, pink, red, purple and even almost black. Furthermore, the extracts of Alcea rosea L. have been widely studied with respect to their biomedical activities [1,2], and are widely used as food and cosmetic ingredients [3]. It is clear that the extract composition, and consequently its health-promoting effects, depend on the extraction conditions, mainly on the solvent used. The most common solvents used to prepare extracts of Alcea rosea L., further studied with respect to their biomedical properties, are methanol [4,5,6,7], methanol/water (~3/1) [8,9], ethanol/water (70–95% of ethanol) [10,11,12], and more rarely water [13,14]. Sometimes the dried alcohol extract has been subjected to further extraction with different solvents, e.g., with ethyl acetate [15].
The health-promoting properties of Alcea rosea L. extracts are strongly related to the high flavonoid content, e.g., anthocyanins (which are responsible for the beautiful dark color of the flowers), but also to other kinds of flavonoid glycosides. To the best of our knowledge, there is scarcely any comprehensive analysis aimed at the identification of the most abundant flavonoid glycosides present in the extract of Alcea rosea L., namely anthocyanins and other flavonoid glycosides. Anthocyanins have been identified in [5] and [14] (in the former in methanol extract, in the latter in acidified water extract), whereas the other flavonoid glycosides, or free aglycones, have been identified in [8,10,11] and [15]. As far as we know, there are only two reports in which both anthocyanins and other flavonoid glycosides have been identified [4,16]. For most of the identified compounds, only general names have been provided in [4] (e.g., anthocyanin I, anthocyanin II, kaempherol glycoside II, kaempherol glycoside III); thus, the information concerning the sugar moieties and their possible substitution sites has not been provided [4]. The only article in which both anthocyanins and other flavonoid glycosides have been carefully identified is that by Hosaka et al. [16]. The authors have identified nine anthocyanins, three flavonol glycosides and one flavone glycoside. In this paper we present the LC-MS identification of the most abundant flavonoid glycosides (anthocyanins and the others) in the extracts of Alcea rosea L. The identification has been based on the detection of the respective parent and product ions as well as their relative abundances. The differences between identified isomeric and isobaric compounds have also been discussed.

2. Results and Discussion

2.1. Identification of Anthocyanins

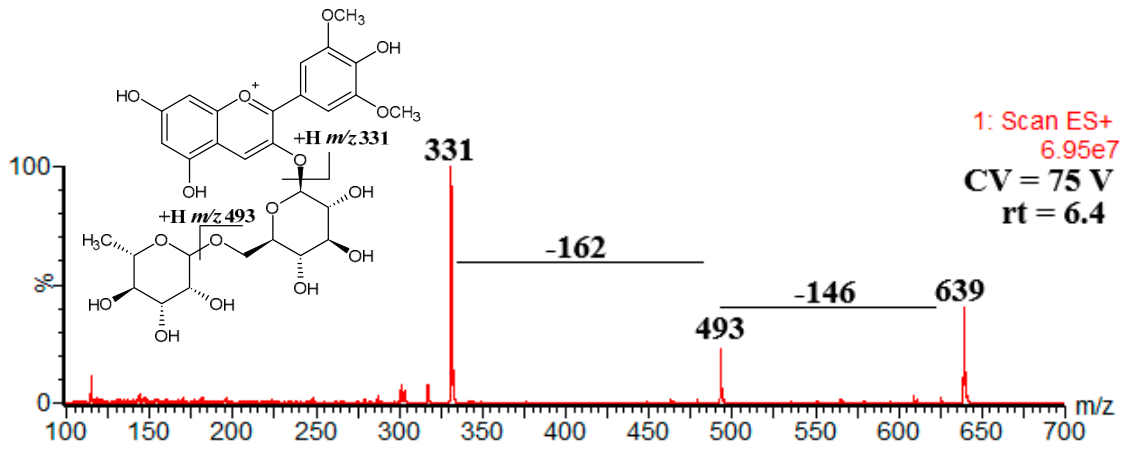
The first group of identified flavonoid glycosides were anthocyanins (anthocyanidin glycosides). Since they are flavylium cation-derived compounds, thus cationic compounds, their LC-MS analysis in the positive ion mode is more appropriate than in the negative ion mode. Four anthocyanidin 3-O-rutinosides (O-di-glycosides) were detected, as summarized in Table 1. These rutinosides have also been detected in other extracts of the hollyhock flowers [5,14,16]. The parent ions which were assigned as [M]+ (the assignment as [M−Cl]+ would also be acceptable [17]), yielded Y1+ and Y0+ product ions (the widely accepted nomenclature of glycoconjugate fragmentation [18]) with relative abundance, characteristic of 3-O-rutinosides [14,19,20]. The representative ESI(+) mass spectrum is shown in Figure 1.
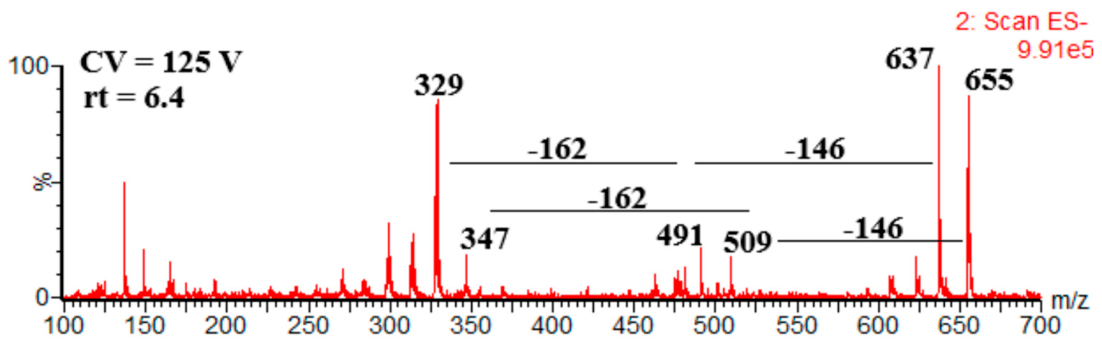
In the negative ion mode the anthocyanins were also detected; although, as expected, a relatively high background was observed since the sensitivity in negative ion mode was not as good as in positive ion mode. They yielded ions assigned as [M−2H+H2O] which enabled their differentiation from other flavonoid glycosides [21,22,23]. At higher cone voltage the ions [M−2H] were detected as well as the characteristic product ions, which fully confirmed the structures elucidated by the data obtained in the positive ion mode. The exemplary ESI(−) mass spectrum is shown in Figure 2.

2.2. Identification of Acylated Anthocyanins

Along with the anthocyanidin rutinosides 14, four acylated anthocyanins were identified, namely petunidin 3-O-(6″-[E]-p-coumaroyl)glucoside (5), malvidin 3-O-(6″-[E]-p-coumaroyl)glucoside (6), petunidin 3-O-(6″-malonyl)glucoside (7), and malvidin 3-O-(6″-malonyl)glucoside (8) (Table 2).
The malonylated anthocyanin 8 has already been detected in the hollyhock extract [5,14,16], whereas the malonylated anthocyanin 7 has only been detected in [14]. To the best of our knowledge, the coumaroylated ones (5 and 6) have not been detected, although coumaric acid and its other conjugates have been detected in the hollyhock extract [4,10,11,15]. Compounds 58, in contrast to the rutinosides 14, did not yield Y1+ product ions; they yielded only Y0+ (Supplementary Material, Figure S1). Therefore, 5 and 6 can be easily differentiated from their isobaric compounds, 3 and 4, respectively, by using low resolution mass spectrometry. Of course, the accurate masses (m/z values) obtained on the high-resolution instrument also enable their differentiation (Supplementary Material, Figure S2). In the negative ion mode, the acylated anthocyanins 58 (similarly to rutinosides 46) yielded [M−2H+H2O] ions. Compounds 7 and 8, in the negative ion mode, also yielded the product ions formed due to the decomposition of the malonyl moiety, namely [M−2H+H2O−CO2] and [M−2H−CO2] ions. In the Supplementary Material the single ion chromatograms are shown as representative examples (Figures S3 and S4).

2.3. Identification of Flavonol Glycosides

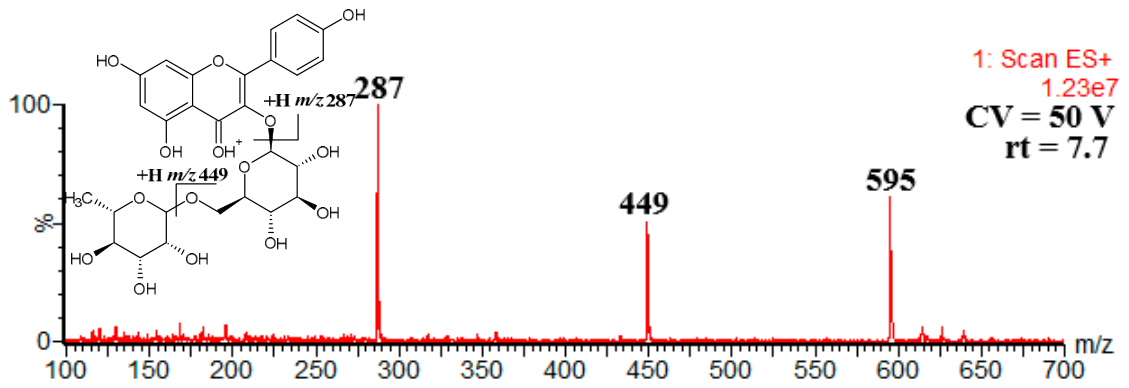
In the analyzed extracts, the glycosides of three flavonols, namely glucosides and rutinosides of kaempferol, quercetin and myricetin, were detected (Table 3). Hosaka et al. have detected myricetin 3-O-glucoside and kaempferol 3-O-glucoside/rutinoside [16]. The flavonol glycosides yielded intense signals in both positive and negative ion mode ([M+H]+ and [M−H] ions, respectively). The ESI(+) mass spectrum of kaempferol 3-O-rutinoside (9) is shown in Figure 3 as a representative example.
The fragmentation pathways of flavonol 3-O-rutinosides observed in the positive ion mode resemble those reported elsewhere [19,24,25,26]. In the negative ion mode, they yielded abundant [Y0−H]−• ion, characteristic of flavonol 3-O-glycosides (Figure S5) [27,28,29]. The negative ions enable their differentiation from their isomeric anthocyanins (1 and 9, 2 and 11, 3 and 13, Table 1 and Table 3). It has to be stressed that the identification of quercetin 3-O-rutinoside (11, rutin) and quercetin 3-O-glucoside (12, isoquercetin) was also confirmed by comparison of their retention times and mass spectra with those of the standards. Furthermore, myricetin 3-O-glucoside (14) had a slightly different retention time than myricetin 3-O-galactoside identified in the extract of Trifolium repens (galactose is the second most common hexose after glucose which is substituted onto the phenolic compounds in plants) [28]. Therefore, in the detected compounds the hexose has always been tentatively identified as glucose.
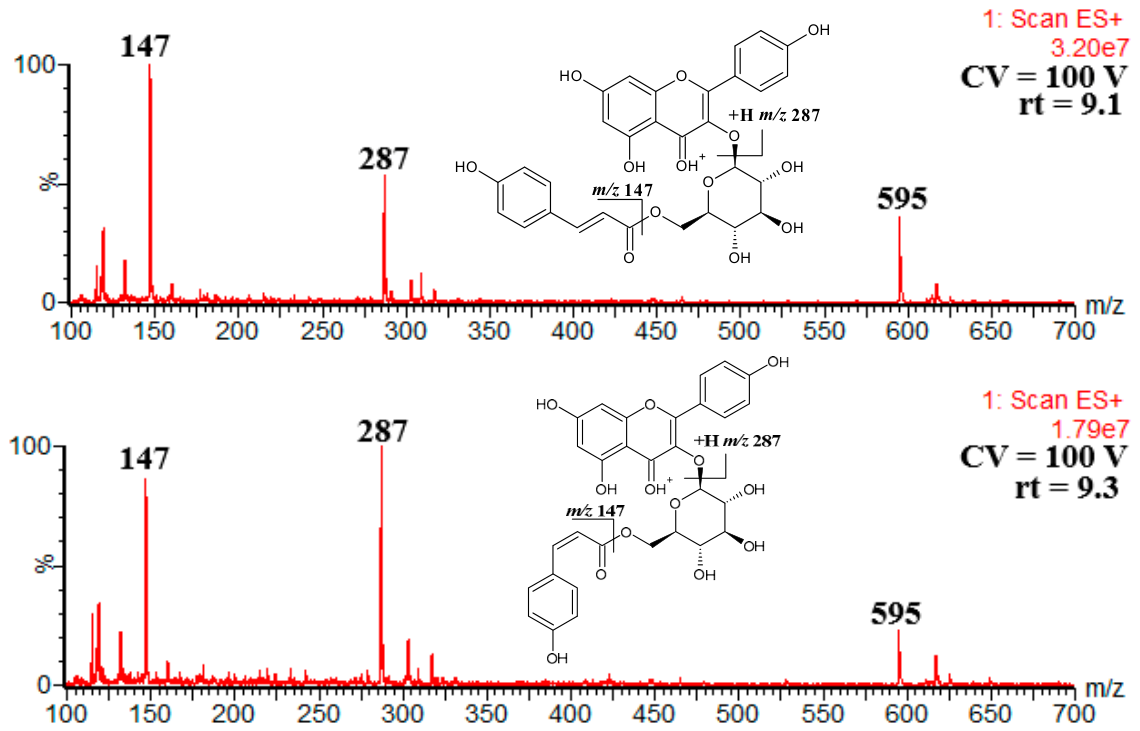
Besides the flavonol glycosides 914, two coumaroylated conjugates of kaempferol glucoside were identified, namely kaempferol 3-O-(6″-[E]-p-coumaroyl)glucoside (trans-tiliroside, 15a) and kaempferol 3-O-(6″-[Z]-p-coumaroyl)glucoside (cis-tiliroside, 15b). The isomer trans has already been detected by Abdel-Salam et al. [10]. Compounds 15a/b are isobaric to compound 9 and to the M+ ion of 1. The single ion chromatograms of these four compounds as well as their high-resolution mass spectra are shown in the Supplementary Material (Figures S6 and S7, respectively). It is known that under the reversed-phase chromatography conditions, the trans-tiliroside (15a) is eluted earlier than cis-tiliroside (15b) [30,31,32]. The ESI mass spectra of isomers 15a and 15b were different with respect to the relative ion abundances, especially in the positive ion mode, as shown in Figure 4 (in the negative ion mode the differences were less pronounced, Figure S8). Isomer trans yielded a much more abundant product ion at m/z 147 ([HO-C6H4-CH=CH-CO]+) in comparison to the product ion at m/z 287 (Y0+ ion) than isomer cis. Therefore, these isomers can be differentiated on the basis of relative ion abundances.

2.4. Identification of Other Flavonoid Glycosides

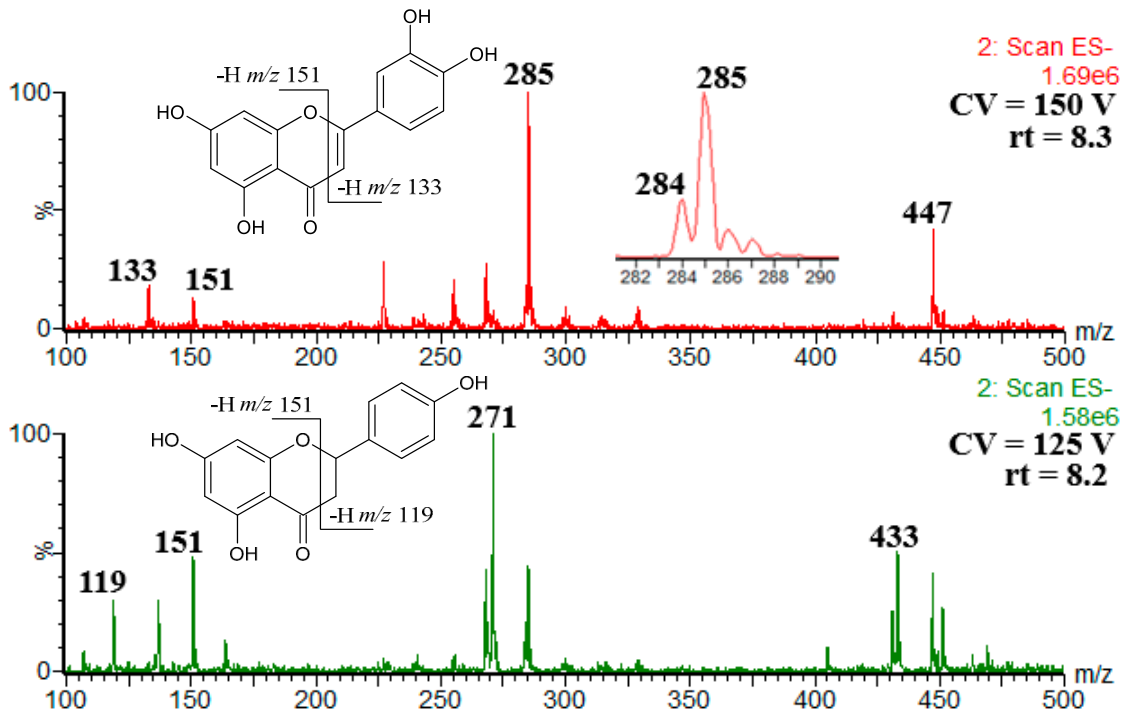
Apart from anthocyanins (18) and flavonol glycosides (915), three other flavonoid glycosides were identified: two flavone glycosides, namely apigenin 7-O-glucoside (16) and luteolin 4′-O-glucoside (17), and one flavanone glycoside, namely naringenin 7-O-glucoside (18) (Table 4). Of these three compounds, Hosaka et al. have detected luteolin 4′-O-glucoside [16]. Although these compounds had very similar retention times (Supplementary Material, Figure S9) it was possible to determine their structures, as the retention times of parent and product ions were carefully checked and they always matched perfectly. In the negative ion mode apigenin 7-O-glucoside (16) yielded the abundant [Y0−H]−• product ion (m/z 268, Table 3); however, its relative abundance was lower than that of flavonol 3-O-glycosides (Table 2). Low abundant [Y0−H]−• ion (m/z 284), in comparison to the Y0 ion (m/z 285), was detected for 17, indicating the glycosylation at the C-4′ site [27,33,34]. The lack of the [Y0−H]−• ion and the m/z values of Y0+/Y0 ions (275/273) indicated the flavanone aglycone for 17 [19,34,35]. At high cone voltage, the fragmentation of Y0 ions of 17 and 18 (these ions correspond to the deprotonated aglycones) enabled the determination of aglycone structures as shown in Figure 5. The product ion at m/z 133 detected for 17 confirmed luteolin as the aglycone, and excluded its isomer kaempferol [36,37], and the product ions at m/z 119 and 151 confirmed naringenin as the aglycone for 18 [19,38]. Naringenin 7-O-glucoside (18), commonly known as prunin (a compound with very promising anti-cancer activity, [39]), is present in high amounts in citrus fruits and in plants belonging to the Prunus genus [40]. We have confirmed its presence in the hollyhock extracts by comparing its retention time with that present in the bark extract of Prunus persica [19].

2.5. Relative Abundances of the Identified Flavonoid Glycosides

Two samples of Alcea rosea L. (obtained from two different manufacturers) were extracted with methanol (samples 1A and 2A) and with 75% ethanol (samples 1B and 2B). These are the most common solvents used for the preparation of Alcea rosea L extracts. In order to semi-quantitively evaluate the relative abundances of the identified flavonoid glycosides in the analyzed samples, the chromatographic peak areas of [M]+ ions for anthocyanins, and [M+H]+ as well as [M−H] ions for other flavonoid glycosides, obtained at a low cone voltage (40 V) in order to avoid fragmentation, were compared. Since anthocyanins yields low signals in the negative ion mode (ions [M−2H+H2O]), in this mode they were not taken into account.
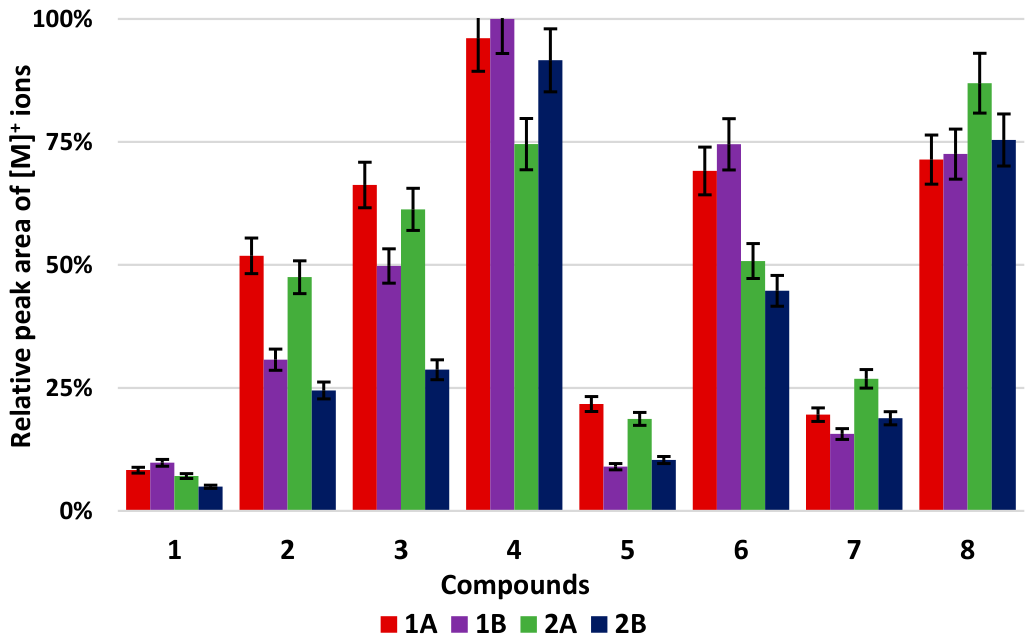
Figure 6 shows the chromatographic peak areas obtained for anthocyanins (compounds 18). It is reasonable that their ESI responses are comparable, since it is the group of compounds of the same type (flavylium cation-containing compounds). In all analyzed extracts the most abundant are malvidin 3-O-rutinoside (4) and malvidin 3-O-(6″-malonyl)glucoside (8). The relative amount of malvidin 3-O-(6″-[E]-p-coumaroyl)glucoside (6) is also quite high, although in the extracts 2A and 2B (manufacturer 2) their amounts are smaller than in the extracts 1A and 1B (manufacturer 1). Therefore, hollyhock can be regarded as an excellent source of malvidin glycosides, compounds of well-documented health-promoting properties, e.g., anti-cancer and anti-inflammatory [41,42]. The effect of the solvent has not been pronounced for malvidin glycosides, e.g., the relative amount of compound 4 was the lowest in sample 2A (manufacturer 2, methanol extract), whereas for compound 8 we deal with the opposite situation (Figure 6). On the other hand, the effect of solvent has been clearly pronounced for 2, 3, 5 and 7, namely, in the methanol extracts (samples 1A and 2A) their relative amounts are higher than in the 75% ethanol (samples 1B and 2B, Figure 6).
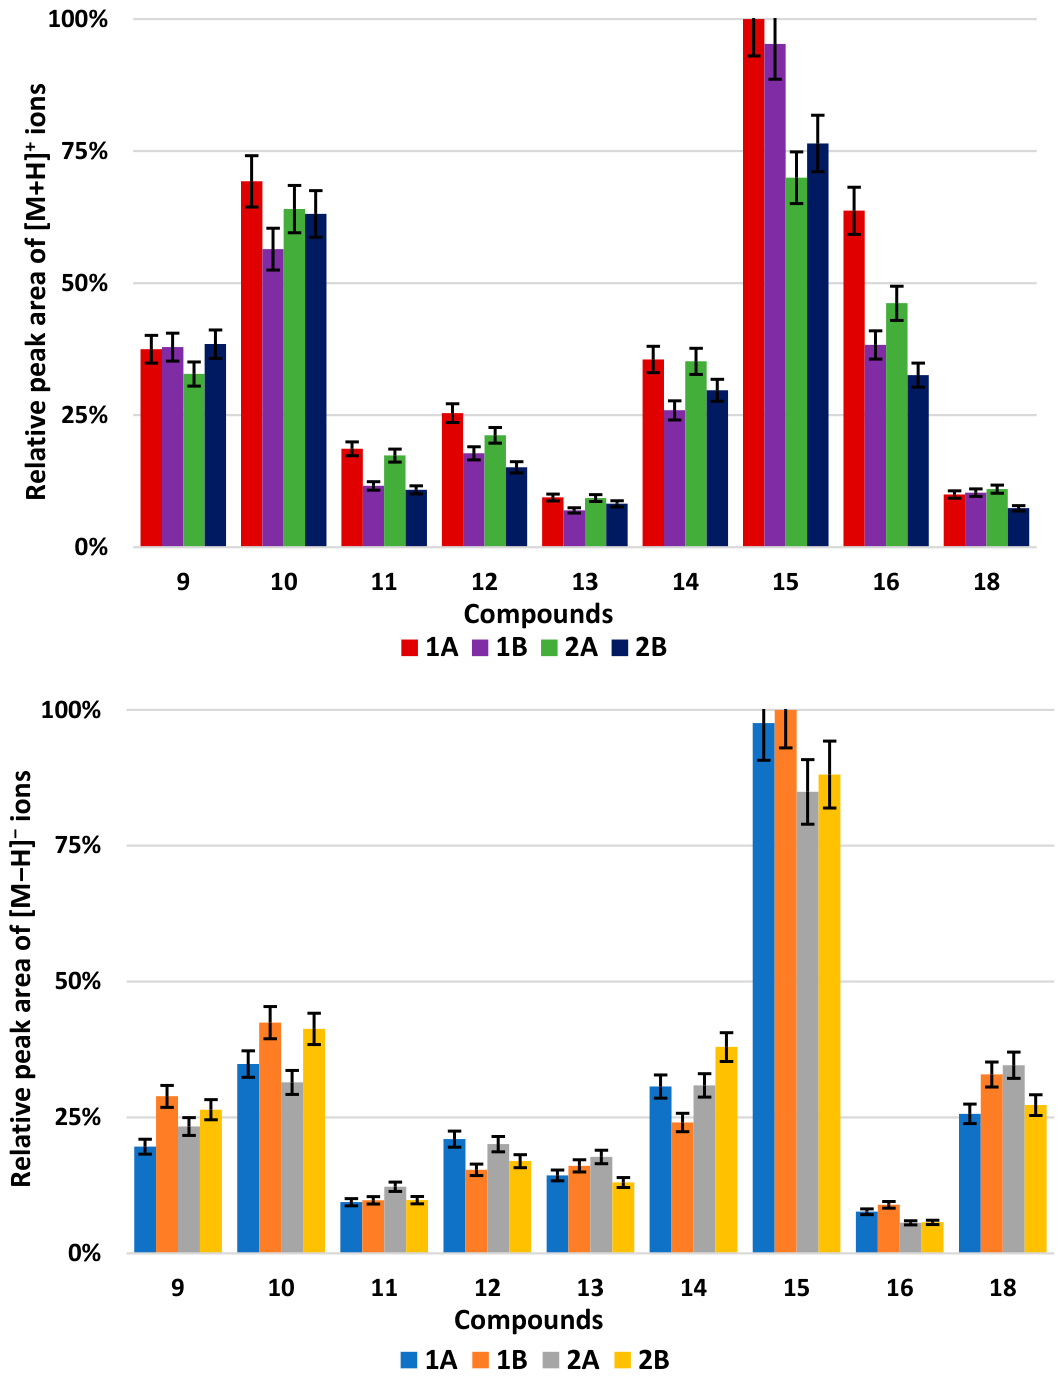
Figure 7 shows the chromatographic peak areas of [M+H]+ and [M−H] ions of compounds 116 and 18. Compound 17 is of low abundance and has been poorly separated from its isomer 10 (Figure S7); therefore, it was not included. Compounds 15a and 15b (trans/cis-tiliroside, respectively), which also have been poorly separated (Figure S5), have been combined as one compound 15. The results obtained in both positive and negative ion mode indicate that among compounds 118, the most abundant are kaempferol glycosides (9, 10, 15), and among them the most abundant is tiliroside 15, a compound of great potential to mitigate inflammation and its associated diseases [43,44]. The effect of the solvent has not been clearly pronounced for flavonoid glycosides 118. In the positive ion mode, usually in the methanol extract, the peak areas are slightly higher; however, in the negative ion mode it has not been observed.
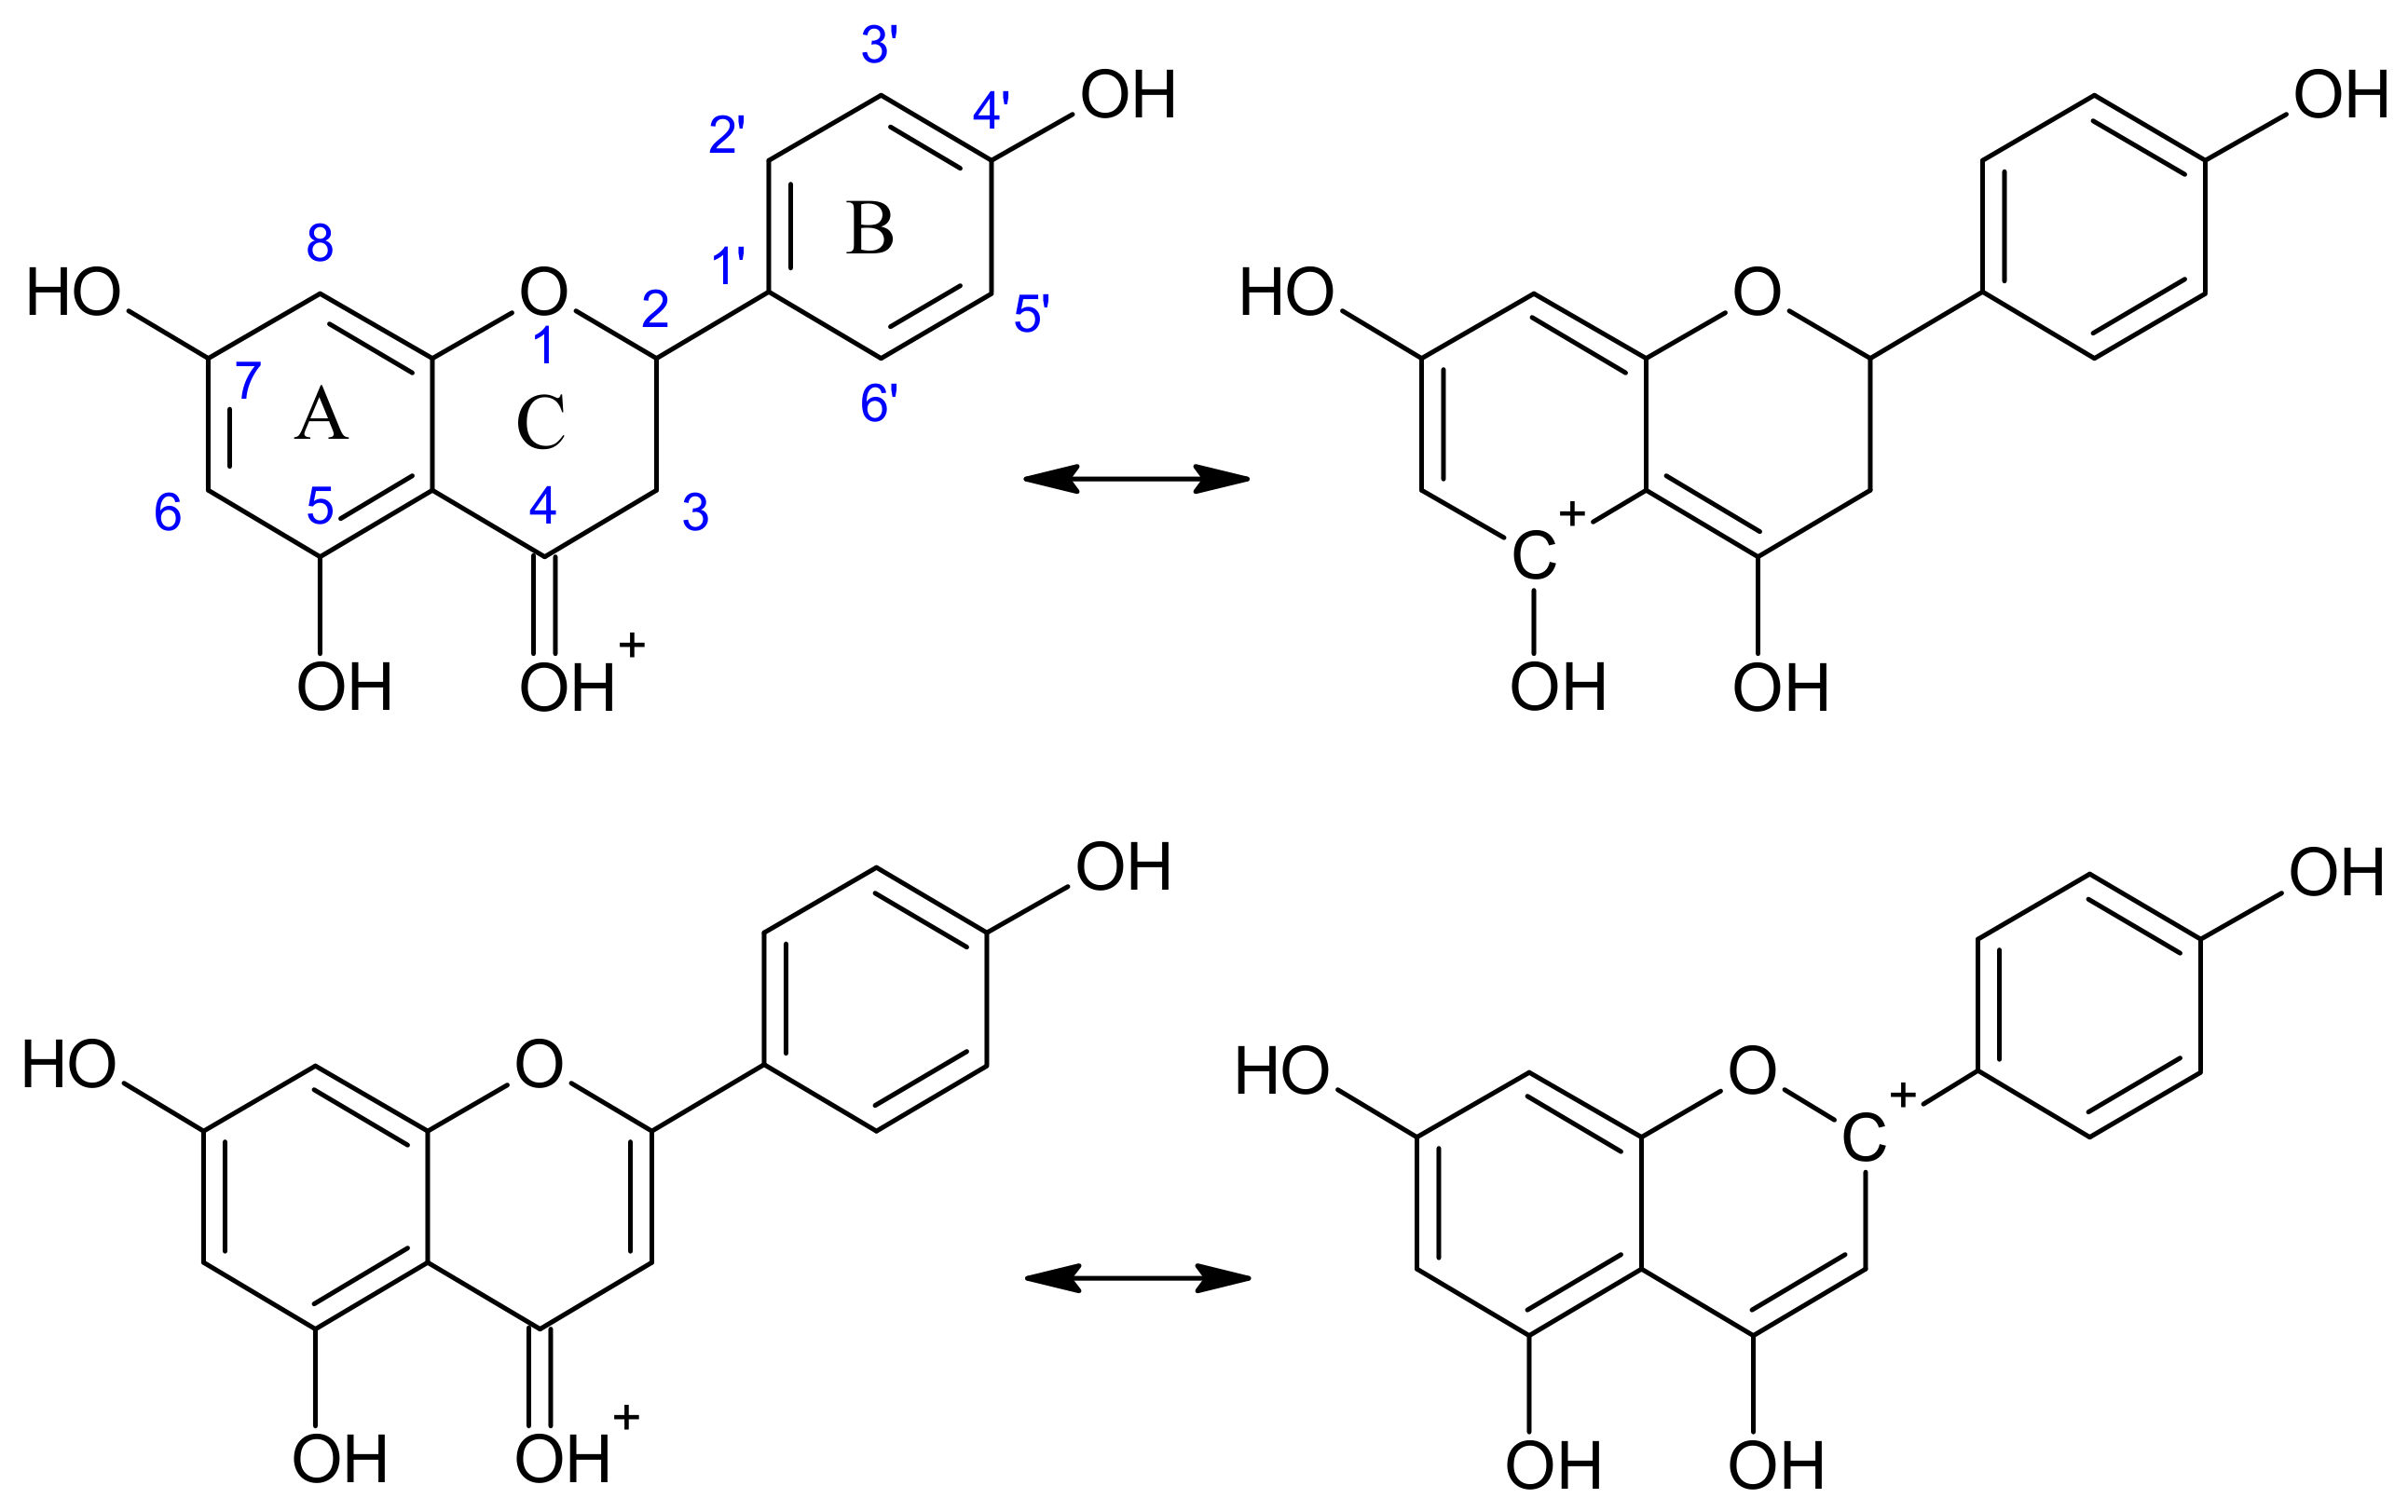
Compounds 915 are flavonol 3-O-glycosides so it is reasonable that they have very similar ESI response in both positive and negative ion mode. It is known that the C4=O moiety (carbonyl oxygen atom) is the most favored protonation site of flavonoid molecules [45,46], which for 915 can be affected by the interaction with neighboring groups C5-OH and glycosylated C3-OH. Deprotonation of 915 can occur at phenolic groups substituted either at ring A or B [28,47]. In both ESI(+) and ESI(−), the relative abundances of 915 were similar (Figure 7). On the other hand, for compounds 16 and 18 there is a notable discrepancy between their relative amounts observed in the positive and negative ion mode (Figure 7). Compound 16 (apigenin 7-O-glucoside) contains only two free phenolic groups (C5-OH and C4′-OH); therefore, it is reasonable that its ESI(−) response is lower than that of 915 (consequently the ESI(+) response can be higher). Compound 18 (naringenin 7-O-glucoside), among the identified compounds, is the only one which contains a single C2-C3 bond at the C ring (flavanone). Therefore, the protonation of its C4=O moiety cannot yield a structure containing the charge delocalized in the B ring (in contrast to the flavones and flavonols, Scheme 1); thus, compound 18 showed a lower ESI(+) response than 117, and as a consequence, a higher ESI(−) response. Of course, protonated 18 and the others can yield structures containing the charge delocalized in ring A (Scheme 1).

3. Materials and Methods

3.1. Preparation of the Extracts for HPLC-MS Analysis

Two dietary supplements, dried black mallow flowers (Malvae arboreae cum calycibus flos), sourced from various manufacturers, were purchased from local pharmacies in the first quarter of 2026. A 0.5 g portion of each sample was extracted with 15 mL of 75% ethanol. The sample was then homogenized (T 18 Ultra Turrax, IKA-Werke, Staufen, Germany), shaken at 500 rpm for 30 min (Vortex 3, IKA-Werke GmbH, Staufen, Germany) and after 24 h filtered through a 0.45 μm syringe filter (Macherey-Nagel GmbH, Düren, Germany). The same procedure was followed for the extraction using pure methanol. All extracts were stored at a temperature of 5 °C.

3.2. HPLC-MS Analysis

The HPLC-MS analyses were performed using a Waters Arc HPLC pump and a Waters SQD mass spectrometer (single quadrupole-type instrument equipped with electrospray ionization (ESI) source, Z-spray, Milford, MA, USA). The software used was MassLynx V4.2 SCN1046 (Milford, MA, USA). Using an autosampler, the sample solutions were injected into the XTerra® MS C18 column (Waters, Milford, MA, USA, 5 μm, 150 mm × 3 mm i.d.). The injection volume was 10 µL. The solutions were analyzed by using a linear gradient of CH3CN-H2O at a flow rate of 0.5 mL/min. The gradient started from 0% CH3CN to 95% H2O with 5% of a 10% solution of formic acid in water, reaching 95% CH3CN after 15 min, and the latter concentration was maintained for 10 min. The ESI mass spectra were recorded in the m/z range 100–1000, in positive and negative modes simultaneously (during the HPLC/ESI-MS analyses, the mass spectrometer was switched in the fast mode between the positive and negative ion modes). The ESI source potentials were as follows: capillary, 3 kV; lens, 0.5 V; extractor, 4 V; cone voltage (CV) 30–150 V. The latter parameter has the greatest impact on the full scan mass spectra recorded. An increase in this parameter leads to the so-called “in-source” fragmentation/dissociation, but a low cone voltage that is too low may cause a decrease in sensitivity. The source temperature was 120 °C, and the desolvation temperature was 300 °C. Nitrogen was used as the nebulizing and desolvating gas at flow rates of 100 and 300 L h−1, respectively. In order to evaluate the relative abundances of identified compounds, the HPLC-MS analyses were performed in triplicate, and the relative standard deviation did not exceed 7%.

3.3. HPLC-QTOF-MS Analysis

In order to confirm the elemental composition of the identified compounds the HPLC-QTOF-MS analyses were performed using an UltiMateTM 3000 UHPLC system (ThermoScientific/Dionex, Sunnyvale, CA, USA) and an Impact HD mass spectrometer (QTOF type instrument equipped with electrospray ion source; Bruker Daltonics, Billerica, MA, USA). Using an autosampler, the sample solutions were injected into the Kinetex C18 column (100 × 2.10 mm i.d., 2.6 μm particle size). The mobile phases used were water with 0.1% formic acid (solvent A) and acetonitrile with 0.1% formic acid (solvent B). The samples were analyzed using a linear gradient at a flow rate of 0.3 mL/min and the column temperature was maintained at 35 °C. The gradient was programmed as follows: 90% A and 10% B for 1 min, followed by a linear change to 5% A and 95% B in 20 min, held for 10 min. The instrument was operated in the positive ion mode, under the following optimized settings: end-plate voltage 500 V, capillary voltage 4.2 kV; collision energy 8 eV, nebulizer pressure 1.5 bar; dry gas (nitrogen); temperature 200 °C; dry gas flow rate 8 L/min.

4. Conclusions

Anthocyanidin 3-O-glycosides, mainly malvidin glycosides, and flavonol 3-O-glycosides, mainly kaempferol glycosides, have been found as main flavonoid conjugates in the extracts of the flowers of Alcea rosea L. No significant differences between the methanol and 75% ethanol extract compositions have been observed. Among the identified compounds, the acylated conjugates were quite abundant, namely malvidin 3-O-(6″-malonyl)glucoside, malvidin 3-O-(6″-[E]-p-coumaroyl)glucoside and kaempferol 3-O-(6″-p-coumaroyl)glucoside (trans- and cis-tiliroside). Therefore, the flowers of the Alcea rosea L. seem to be a good source of malvidin and kaempferol conjugates. It has been demonstrated that the detected isomers, e.g., delphinidin 3-O-rutinoside and quercetin-O-rutinoside (rutin), as well as isobars, e.g., kaempferol-O-rutinoside and tiliroside, can be differentiated on the basis of low-resolution mass spectra by using the cone-voltage-induced fragmentation.

Supplementary Materials

The following supporting information can be downloaded at: https://www.mdpi.com/article/10.3390/molecules31152737/s1.

Author Contributions

Conceptualization, M.B.-B. and R.F.; methodology, W.W., M.B.-B. and R.F.; validation, W.W., M.B.-B. and R.F.; formal analysis, W.W., M.B.-B. and R.F.; investigation, W.W., M.B.-B. and R.F.; writing—original draft preparation, W.W., M.B.-B. and R.F.; writing—review and editing, W.W., M.B.-B. and R.F.; visualization, W.W. and R.F.; supervision, R.F.; funding acquisition, M.B.-B. and R.F. All authors have read and agreed to the published version of the manuscript.

Funding

This research received no external funding.

Institutional Review Board Statement

Not applicable.

Informed Consent Statement

Not applicable.

Data Availability Statement

The original contributions presented in this study are included in the article and Supplementary Materials. Further inquiries can be directed to the corresponding author (R.F.).

Conflicts of Interest

The authors declare no conflicts of interest.

References

  1. Azadeh, Z.; Asgharian, S.; Habtemariam, S.; Lorigooini, Z.; Taheri, A. A review of botanical, phytochemical, and pharmacological properties of Alcea rosea L. Future Nat. Prod. 2024, 9, 88–99. [Google Scholar] [CrossRef] [Scilit]
  2. Azab, A. Alcea: Traditional medicine, current research and future opportunities. Eur. Chem. Bull. 2016, 5, 505–514. [Google Scholar]
  3. Gil, S.; Lim, K.M. Assessment of systemic safety of Althaea rosea flower extract for use in cosmetics: Threshold of toxicological concern and history of safe consumption approaches. Cosmetics 2025, 12, 133. [Google Scholar] [CrossRef] [Scilit]
  4. Castillo-Carrión, M.; Martínez-Espinosa, R.; Pérez-Álvarez, J.Á.; Fernández-López, J.; Viuda-Martos, M.; Lucas-González, R. Nutritional, fatty acids, (poly)phenols and technological properties of flower powders from Fuchsia hybrida and Alcea rosea. Foods 2024, 13, 237. [Google Scholar] [CrossRef] [Scilit] [PubMed]
  5. Tariq, H.; Andleeb, A.; Batool, S.; Ali, U.; Waqas, M.; Wahab, A.; Zaman, G.; Drouet, S.; Giglioli-Guivarc’h, N.; Hano, C.; et al. Qualitative and quantitative analysis of high-value metabolites from callus culture of Alcea rosea L. Plant Cell Tissue Organ Cult. 2024, 157, 68. [Google Scholar] [CrossRef] [Scilit]
  6. Yaglıoglu, A.S.; Eser, F.; Tekin, S.; Onal, A. Antiproliferative activities of several plant extracts from Turkey on rat brain tumor and human cervix carcinoma cell lines. Front. Sci. 2016, 9, 69–74. [Google Scholar]
  7. Mert, T.; Fafal, T.; Kıvçak, B.; Öztürk, H.T. Antimicrobial and cytotoxic activities of the extracts obtained from the flowers of Alcea Rosea L. Hacet. Univ. J. Fac. Pharm. 2010, 1, 17–24. [Google Scholar]
  8. Ammar, N.M.; El-Kashoury, E.S.A.; Abou El-Kassem, L.T.; Abd El-Hakeem, R.E. Evaluation of the phenolic content and antioxidant potential of Althaea rosea cultivated in Egypt. J. Arab Soc. Med. Res. 2013, 8, 48–52. [Google Scholar] [CrossRef] [Scilit]
  9. Asres, K.; Bucar, F.; Kartnig, T.; Witvrouw, M.; Pannecouque, C.; De Clercq, E. Antiviral activity against human immunodeficiency virus type 1 (HIV-1) and type 2 (HIV-2) of ethnobotanically selected Ethiopian medicinal plants. Phytother. Res. 2001, 15, 62–69. [Google Scholar] [CrossRef] [Scilit] [PubMed]
  10. Abdel-Salam, N.A.; Ghazy, N.M.; Sallam, S.M.; Radwan, M.M.; Wanas, A.S.; ElSohly, M.A.; El-Demellawy, M.A.; Abdel-Rahman, N.M.; Piacente, S.; Shenouda, M.L. Flavonoids of Alcea rosea L. and their immune stimulant, antioxidant and cytotoxic activities on hepatocellular carcinoma HepG-2 cell line. Nat. Prod. Res. 2018, 32, 702–706. [Google Scholar] [PubMed]
  11. Ma, F.; Cui, Q.; Bai, G. Combining UPLC/Q-TOF-MS/MS with biological evaluation for NF-κB inhibitors in uyghur medicine Althaea rosea flowers. Front. Plant Sci. 2019, 9, 1975. [Google Scholar] [CrossRef] [Scilit] [PubMed]
  12. Zhang, Y.; Jin, L.; Chen, Q.; Wu, Z.; Dong, Y.; Han, L.; Wang, T. Hypoglycemic activity evaluation and chemical study on hollyhock flowers. Fitoterapia 2015, 102, 7–14. [Google Scholar] [CrossRef] [Scilit] [PubMed]
  13. Papież, M.; Gancarczyk, M.; Bilińska, B. The compounds from the hollyhock extract (Althaea rosea Cav. var. nigra) affect the aromatization in rat testicular cells in vivo and in vitro. Folia Histochem. Cytobiol. 2002, 40, 353–359. [Google Scholar]
  14. Safari, A.; Rahimi, M.; Sonboli, A.; Behboudi, H.; Ebrahimi, S.N. Optimization of anthocyanin extraction from black Hollyhock flower: Process efficiency, stability, and cytotoxicity assessment. Ind. Crops Prod. 2024, 222, 119944. [Google Scholar] [CrossRef] [Scilit]
  15. Zheng, R.; Wu, Y.; Huang, L.; Zeng, F.; Huang, L. The potential mechanisms of Althaea rosea (Linn.) Cavan. flower in alleviating tetrodotoxin poisoning: An integrated metabolomics, network pharmacology and experimental validation. Drug Des. Dev. Ther. 2025, 19, 3657–3680. [Google Scholar] [CrossRef] [Scilit] [PubMed]
  16. Hosaka, H.; Mizuno, T.; Iwashina, T. Flavonoid pigments and color expression in the flowers of black Hollyhock (Alcea rosea ‘Nigra’). Bull. Natl. Mus. Nat. Sci. Ser. B 2012, 38, 69–75. [Google Scholar]
  17. Stężycka, O.; Frańska, M. Comment on the “Response surface methodology optimization and HPLC-ESI-QTOF-MS/MS analysis on ultrasonic-assisted extraction of phenolic compounds from okra (Abelmoschus esculentus) and their antioxidant activity”. Food Chem. 2023, 414, 135729. [Google Scholar] [CrossRef] [Scilit] [PubMed]
  18. Domon, B.; Costello, C.E. A systematic nomenclature for carbohydrate fragmentations in FAB-MS/MS spectra of glycoconjugates. Glycoconj. J. 1988, 5, 397–409. [Google Scholar] [CrossRef] [Scilit]
  19. Beszterda, M.; Frański, R. Seasonal qualitative variations of phenolic content in the stem bark of Prunus persica var. nucipersica—Implication for the use of the bark as a source of bioactive compounds. ChemistrySelect 2022, 7, e202200418. [Google Scholar] [CrossRef] [Scilit]
  20. Carballeda-Sangiao, N.; Chamorro, S.; de Pascual-Teresa, S. A red-berry mixture as a nutraceutical: Detailed composition and neuronal protective effect. Molecules 2021, 26, 3210. [Google Scholar] [PubMed]
  21. Sun, J.; Lin, L.Z.; Chen, P. Study of the mass spectrometric behaviors of anthocyanins in negative ionization mode and its applications for characterization of anthocyanins and non-anthocyanin polyphenols. Rapid Commun. Mass Spectrom. 2012, 26, 1123–1133. [Google Scholar] [CrossRef] [Scilit] [PubMed]
  22. Lee, H.; Oh, I.N.; Kim, J.; Jung, D.; Cuong, N.P.; Kim, Y.; Lee, J.; Kwon, O.; Park, S.U.; Lim, Y.; et al. Phenolic compound profiles and their seasonal variations in new red-phenotype head-forming Chinese cabbages. LWT-Food Sci. Technol. 2018, 90, 433–439. [Google Scholar] [CrossRef] [Scilit]
  23. Sommella, E.; Pepe, G.; Pagano, F.; Ostacolo, C.; Tenore, G.C.; Russo, M.T.; Novellino, E.; Manfra, M.; Campiglia, P. Detailed polyphenolic profiling of Annurca apple (M. pumila Miller cv Annurca) by a combination of RP-UHPLC and HILIC, both hyphenated to IT-TOF mass spectrometry. Food Res. Int. 2015, 76, 466–477. [Google Scholar] [CrossRef] [Scilit] [PubMed]
  24. Available online: https://massbank.eu/MassBank/RecordDisplay?id=MSBNK-RIKEN-PR302937 (accessed on 10 July 2026).
  25. Rosenberg, E. Characterisation of historical organic dyestuffs by liquid chromatography–mass spectrometry. Anal. Bioanal. Chem. 2008, 391, 33–57. [Google Scholar] [CrossRef] [Scilit] [PubMed]
  26. Wang, J.; Ren, X.; Wen, C.; Xu, Y.; Chen, Y. Separation and characterization of unknown impurities in rutin tablets using trap-free two-dimensional liquid chromatography coupled with ion trap/time-of-flight mass spectrometry. Rapid Commun. Mass Spectrom. 2020, 34, e8739. [Google Scholar] [CrossRef] [Scilit] [PubMed]
  27. March, R.E.; Lewars, E.G.; Stadey, C.J.; Miao, X.-S.; Zhao, X.; Metcalfe, C.D. A comparison of flavonoid glycosides by electrospray tandem mass spectrometry. Int. J. Mass Spectrom. 2006, 248, 61–85. [Google Scholar] [CrossRef] [Scilit]
  28. Stężycka, O.; Kasperkowiak, M.; Beszterda-Buszczak, M.; Jankowski, W.; Hoffmann, M.; Frańska, M. Structure elucidation of quercetin- and myricetin-O-glycosides from the seeds of Trifolium repens. J. Mol. Struct. 2025, 1351, 144348. [Google Scholar] [CrossRef] [Scilit]
  29. Yang, W.-Z.; Qiao, X.; Bo, T.; Wang, Q.; Guo, D.-A.; Ye, M. Low energy induced homolytic fragmentation of flavonol 3-O-glycosides by negative electrospray ionization tandem mass spectrometry. Rapid Commun. Mass Spectrom. 2014, 28, 385–395. [Google Scholar] [CrossRef] [Scilit] [PubMed]
  30. Ranjana, S.; Srivastava, A.; Goyal, A.; Singh, I.P.; Jachak, S.M. Quantitative analysis of tiliroside and other flavonoid glycosides in Hippophae salicifolia D. Don leaves by HPLC-PDA. Nat. Prod. Res. 2024, 38, 1445–1450. [Google Scholar] [CrossRef] [Scilit] [PubMed]
  31. Riehle, P.; Rusche, N.; Saake, B.; Rohn, S. Influence of the leaf content and herbal particle size on the presence and extractability of quantitated phenolic compounds in Cistus incanus herbal teas. J. Agric. Food Chem. 2014, 62, 10978–10988. [Google Scholar] [CrossRef] [Scilit] [PubMed]
  32. Trendafilova, A.; Staleva, P.; Petkova, Z.; Ivanova, V.; Evstatieva, Y.; Nikolova, D.; Rasheva, I.; Atanasov, N.; Topouzova-Hristova, T.; Veleva, R.; et al. Phytochemical profile, antioxidant potential, antimicrobial activity, and cytotoxicity of dry extract from Rosa damascena Mill. Molecules 2023, 28, 7666. [Google Scholar] [CrossRef] [Scilit] [PubMed]
  33. Cuyckens, F.; Claeys, M. Determination of the glycosylation site in flavonoid mono-O-glycosides by collision-induced dissociation of electrospray-generated deprotonated and sodiated molecules. J. Mass Spectrom. 2005, 40, 364–372. [Google Scholar] [CrossRef] [Scilit] [PubMed]
  34. Hvattum, E.; Ekeberg, D. Study of the collision-induced radical cleavage of flavonoid glycosides using negative electrospray ionization tandem quadrupole mass spectrometry. J. Mass Spectrom. 2003, 38, 43–49. [Google Scholar] [CrossRef] [Scilit] [PubMed]
  35. Mazzotti, F.; Bartella, L.; Talarico, I.R.; Napoli, A.; Di Donna, L. High-throughput determination of flavanone-O-glycosides in citrus beverages by paper spray tandem mass spectrometry. Food Chem. 2021, 360, 130060. [Google Scholar] [CrossRef] [Scilit] [PubMed]
  36. Cuyckens, F.; Ma, Y.L.; Pocsfalvi, G.; Claeysi, M. Tandem mass spectral strategies for the structural characterization of flavonoid glycosides. Analusis 2000, 28, 888–895. [Google Scholar] [CrossRef] [Scilit]
  37. Śliwka-Kaszyńska, M.; Anusiewicz, I.; Skurski, P. The mechanism of a retro-Diels–Alder fragmentation of luteolin: Theoretical studies supported by electrospray ionization tandem mass spectrometry results. Molecules 2022, 27, 1032. [Google Scholar] [CrossRef] [Scilit] [PubMed]
  38. Hughes, R.J.; Croley, T.R.; Metcalfe, C.D.; March, R.E. A tandem mass spectrometric study of selected characteristic flavonoids. Int. J. Mass Spectrom. 2001, 210–211, 371–385. [Google Scholar] [CrossRef] [Scilit]
  39. Rana, J.N.; Mumtaz, S. Prunin: An emerging anticancer flavonoid. Int. J. Mol. Sci. 2025, 26, 2678. [Google Scholar] [CrossRef] [Scilit] [PubMed]
  40. Poonam, V.; Raunak; Kumar, G.; Reddy, L.C.S.; Jain, R.; Sharma, S.K.; Prasad, A.K.; Parmar, V.S. Chemical constituents of the genus prunus and their medicinal properties. Curr. Med. Chem. 2011, 18, 3758–3824. [Google Scholar] [CrossRef] [Scilit] [PubMed]
  41. Sood, R.; Choi, H.K.; Lee, H.J. Potential anti-cancer properties of malvidin and its glycosides: Evidence from in vitro and in vivo studies. J. Funct. Foods 2024, 116, 106191. [Google Scholar] [CrossRef] [Scilit]
  42. Merecz-Sadowska, A.; Sitarek, P.; Kowalczyk, T.; Zajdel, K.; Jęcek, M.; Nowak, P.; Zajdel, R. Food anthocyanins: Malvidin and its glycosides as promising antioxidant and anti-inflammatory agents with potential health benefits. Nutrients 2023, 15, 3016. [Google Scholar] [CrossRef] [Scilit] [PubMed]
  43. Kaur, G.; Kaur, J.; Goyal, J.; Vaid, L.; Singh, T.G.; Singh, R.; Devi, S. Multifaceted role of tiliroside in inflammatory pathways: Mechanisms and prospects. Recent Adv. Inflamm. Allergy Drug Discov. 2025, 19, 316–327. [Google Scholar] [CrossRef] [Scilit] [PubMed]
  44. Grochowski, D.M.; Locatelli, M.; Granica, S.; Cacciagrano, F.; Tomczyk, M. A review on the dietary flavonoid tiliroside. Compr. Rev. Food Sci. Food Saf. 2018, 17, 1395–1421. [Google Scholar] [CrossRef] [Scilit] [PubMed]
  45. Tóth, J.; Remko, M.; Nagy, M. Structural study of flavonoids and their protonated forms. Z. Naturforsch. C 1996, 51, 784–790. [Google Scholar] [CrossRef] [Scilit]
  46. Stężycka, O.; Kasperkowiak, M.; Frańska, M.; Nowak, D.; Hoffmann, M. Oxygen atom from carbonyl group as an important binding agent to the G-quadruplex—Study case of flavonoids. ChemPlusChem 2024, 89, e202400186. [Google Scholar] [CrossRef] [Scilit] [PubMed]
  47. Klein, E.; Rimarčík, J.; Senajová, E.; Vagánek, A.; Lengyel, J. Deprotonation of flavonoids severely alters the thermodynamics of the hydrogen atom transfer. Comput. Theor. Chem. 2016, 1085, 7–17. [Google Scholar] [CrossRef] [Scilit]
Figure 1. ESI(+) mass spectrum and observed fragmentation pattern of malvidin 3-O-rutinoside (4).
Molecules 31 02737 g001
Figure 2. ESI(−) mass spectrum of malvidin 3-O-rutinoside (4). Peak at m/z 655 corresponds to the [M−2H+H2O] ion, and that at m/z 637 to the [M−2H] ion.
Molecules 31 02737 g002
Figure 3. The ESI(+) mass spectrum of kaempferol 3-O-rutinoside (7).
Molecules 31 02737 g003
Figure 4. The ESI(+) mass spectra of isomers 15a and 15b (rt = 9.1 and rt = 9.3, respectively) obtained in the positive ion mode.
Molecules 31 02737 g004
Figure 5. ESI(−) mass spectra of 17 and 18 and their aglycone fragmentation patterns.
Molecules 31 02737 g005
Figure 6. Comparison of the chromatographic peak areas of [M]+ ions of identified anthocyanins.
Molecules 31 02737 g006
Figure 7. Comparison of the chromatographic peak areas of [M+H]+ and [M−H] ions of identified flavonoid glycosides.
Molecules 31 02737 g007
Scheme 1. Examples of the possible resonance structures of protonated naringenin (top) and protonated apigenin (bottom).
Molecules 31 02737 sch001
Table 1. HPLC-ESI-MS(+) results obtained for anthocyanidin 3-O-rutinoside.
Compound (Retention Time, min)Ion m/z, % ri (CV = 75 V)
Molecules 31 02737 i001R1 = OH, R2 = H
Cyanidin 3-O-rutinoside (1) (6.0 min)
[M]+ 595, 25%; Y1+ 449, 25%; Y0+ 287, 100%
R1 = OH, R2 = OH
Delphinidin 3-O-rutinoside (2) (5.8 min)
[M]+ 611, 35%; Y1+ 465, 25%; Y0+ 303, 100%
R1 = OCH3, R2 = OH
Petunidin 3-O-rutinoside (3) (6.1 min)
[M]+ 625, 40%; Y1+ 479, 25%; Y0+ 317, 100%
R1 = OCH3, R2 = OCH3
Malvidin 3-O-rutinoside (4) (6.4 min)
[M]+ 639, 40%; Y1+ 493, 25%; Y0+ 331, 100%
Table 2. HPLC-ESI-MS(+) results obtained for acylated anthocyanins.
Compound (Retention Time, min)Ion m/z, % ri (CV = 100 V)
Petunidin 3-O-(6″-[E]-p-coumaroyl)glucoside (5) (7.6)[M]+ 625, 45%; Y0+ 317, 100%
Malvidin 3-O-(6″-[E]-p-coumaroyl)glucoside (6) (7.9)[M]+ 639, 30%; Y0+ 331, 100%
Petunidin 3-O-(6″-malonyl)glucoside (7) (6.7)[M]+ 565, 25%; Y0+ 317, 100%
Malvidin 3-O-(6″-malonyl)glucoside (8) (6.9)[M]+ 579, 50%; Y0+ 331, 100%
Table 3. HPLC-ESI-MS(−/+) results obtained for flavonol 3-O-glycosides (CV = 75 V).
Compound
(Retention Time, min)
(+) Ion m/z, % ri
CV= 50 V
(−) Ion m/z, % ri
CV= 125 V
Kaempferol 3-O-rutinoside (9) (7.7 min)[M+H]+ 595, 70%; Y1+ 449, 50%; Y0+ 287, 100%[M−H] 593, 90%; Y0 285, 50%; [Y0−H]−• 284, 100%
Kaempferol 3-O-glucoside (10) (8.0 min)[M+H]+ 449, 50%; Y0+ 287, 100%[M−H] 447, 100%; Y0 285, 40%; [Y0−H] 284, 80%
Quercetin 3-O-rutinoside (rutin, 11) (7.3 min)[M+H]+ 611, 80%; Y1+ 465, 60%; Y0+ 303, 100%[M−H] 609, 90%; Y0 301, 40%; [Y0−H]−• 300, 100%
Quercetin 3-O-glucoside (isoquercetin, 12) (7.6 min)[M+H]+ 465, 50%; Y0+ 303, 100%[M−H] 463, 80%; Y0 301, 40%; [Y0−H]−• 300, 100%
Myricetin 3-O-rutinoside (13) (6.9 min)[M+H]+ 627, 75%; Y1+ 481, 55%; Y0+ 319, 100%[M−H] 625, 100%; Y0 317, 30%; [Y0−H]−• 316, 100%
Myricetin 3-O-glucoside (14) (7.1 min)[M+H]+ 481, 60%; Y0+ 319, 100%[M−H] 479, 100%; Y0 317, 30%; [Y0−H]−• 316, 75%
Table 4. HPLC-ESI-MS(−/+) results obtained for other flavonoid glycosides.
Compound
(Retention Time, min)
(+) Ion m/z, % ri(−) Ion m/z, % ri
Apigenin 7-O-glucoside (16) (8.1 min)[M+H]+ 433, 35%; Y0+ 271, 100% (CV = 75 V)[M−H] 431, 100%; Y0 269, 60%; [Y0−H]−• 268, 60% (CV = 100 V)
Luteolin 4′-O-glucoside (17) (8.3 min)[M+H]+ 449, 95%;
Y0+ 287, 100% (CV = 50 V)
[M−H] 447, 40%; Y0 285, 100%; [Y0−H]−• 284, 25% (CV = 150 V)
Naringenin 7-O-glucoside (18) (8.2 min)[M+H]+ 435, 40%; Y0+ 273, 100% (CV= 50 V)[M−H] 433, 50%; Y0 271, 100% (CV = 125 V)
Disclaimer/Publisher’s Note: The statements, opinions and data contained in all publications are solely those of the individual author(s) and contributor(s) and not of MDPI and/or the editor(s). MDPI and/or the editor(s) disclaim responsibility for any injury to people or property resulting from any ideas, methods, instructions or products referred to in the content.