1. Introduction
The genus
Rhododendron L. is a highly diverse group within the family Ericaceae. There are approximately 962 known species worldwide [
1], primarily distributed across Europe, North America, and Asia. East Asia and Southeast Asia are the two centers of diversification for the genus
Rhododendron [
2]. As one of the centers of diversity for this genus [
3], the Himalayan region of China is home to numerous endemic species. According to the literature [
4,
5], there are more than 245 species belonging to 15 genera of the
Rhododendron genus distributed in Tibet, ranging in elevation from 1000 to 5800 m. Among these,
Rhododendron mainlingense,
Rhododendron anthopogon, and
Rhododendron nivale are primarily found in alpine regions at elevations of 2700–5800 m. These
Rhododendron species are rich in flavonoids, terpenoids, and phenolic acids, and play an important role in Tibetan medicine.
According to *Chinese Tibetan Medicine*, in clinical practice,
Rhododendrons are commonly classified into two categories based on leaf size: those with leaves longer than 4 cm are transliterated from Tibetan as “Dama,” such as the
Rhododendron principis and the
Rhododendron vellereum; Those with leaves smaller than 4 cm are collectively referred to as “Tali” (also known as “Balu”), and are further subdivided into “Tali Gabao” and “Tali Nabao.” Both the leaves and flowers of the Tali Gabao are used medicinally; representative species include the
Rhododendron anthopogon,
Rhododendron mainlingense,
Rhododendron lepidotum, and the
Rhododendron fragariiflorum. The flowers of Tali Nabao are used medicinally, with the representative species being
Rhododendron nivale [
6]. When used medicinally, it can alleviate cold-related ailments and treat diseases such as diphtheria and anthrax [
7]. Dama is typically toxic and exhibits significant expectorant, antitussive, anti-inflammatory, and antibacterial effects. Although classical texts such as *Chinese Tibetan Medicine* do not fully document the medicinal uses of all species (such as
Rhododendron lepidotum and
Rhododendron fragariiflorum), these plants are indeed used in Tibetan medical practice. As important ornamental and medicinal plants,
Rhododendrons have broad market prospects and tremendous development potential [
8,
9]. However, due to the wide variety of
Rhododendron species and their high morphological similarity, there has long been confusion between the “Dama” and “Tali” groups during collection and processing, which has seriously compromised the consistency of herbal quality and the stability of clinical efficacy. Furthermore, existing research lacks a systematic comparison of the chemical compositions of “Dama” and “Tali”; the pharmacologically active components and taxonomic relationships of these species remain unclear, which hinders the scientific development and rational utilization of Tibetan
Rhododendron resources.
In this study, ultra-performance liquid chromatography coupled with quadrupole time-of-flight mass spectrometry (UPLC-Q-TOF-MS) was employed to analyze the chemical constituents of the samples. This technique offers advantages such as high resolution, high sensitivity, and accurate mass measurement, making it suitable for the simultaneous detection and preliminary identification of multiple compound classes in Rhododendron species. Through systematic identification and comparison of the chemical components of “Dama” (large-leaved Rhododendron) and “Tali” (small-leaved Rhododendron), a chemical fingerprint was constructed to distinguish the misused species. Combined with the evaluation of anti-complement activity, the dominant medicinal resources were screened. This study aims to provide a theoretical basis and technical support for the original plant identification, quality evaluation, and resource development of Tibetan medicinal Rhododendron.
2. Results
2.1. Seven Phytochemicals in Rhododendrons
Using the method described in
Section 4.4, combined with a high-resolution mass spectrometry database of natural products and relevant literature, a total of 52 compounds were tentatively identified from seven
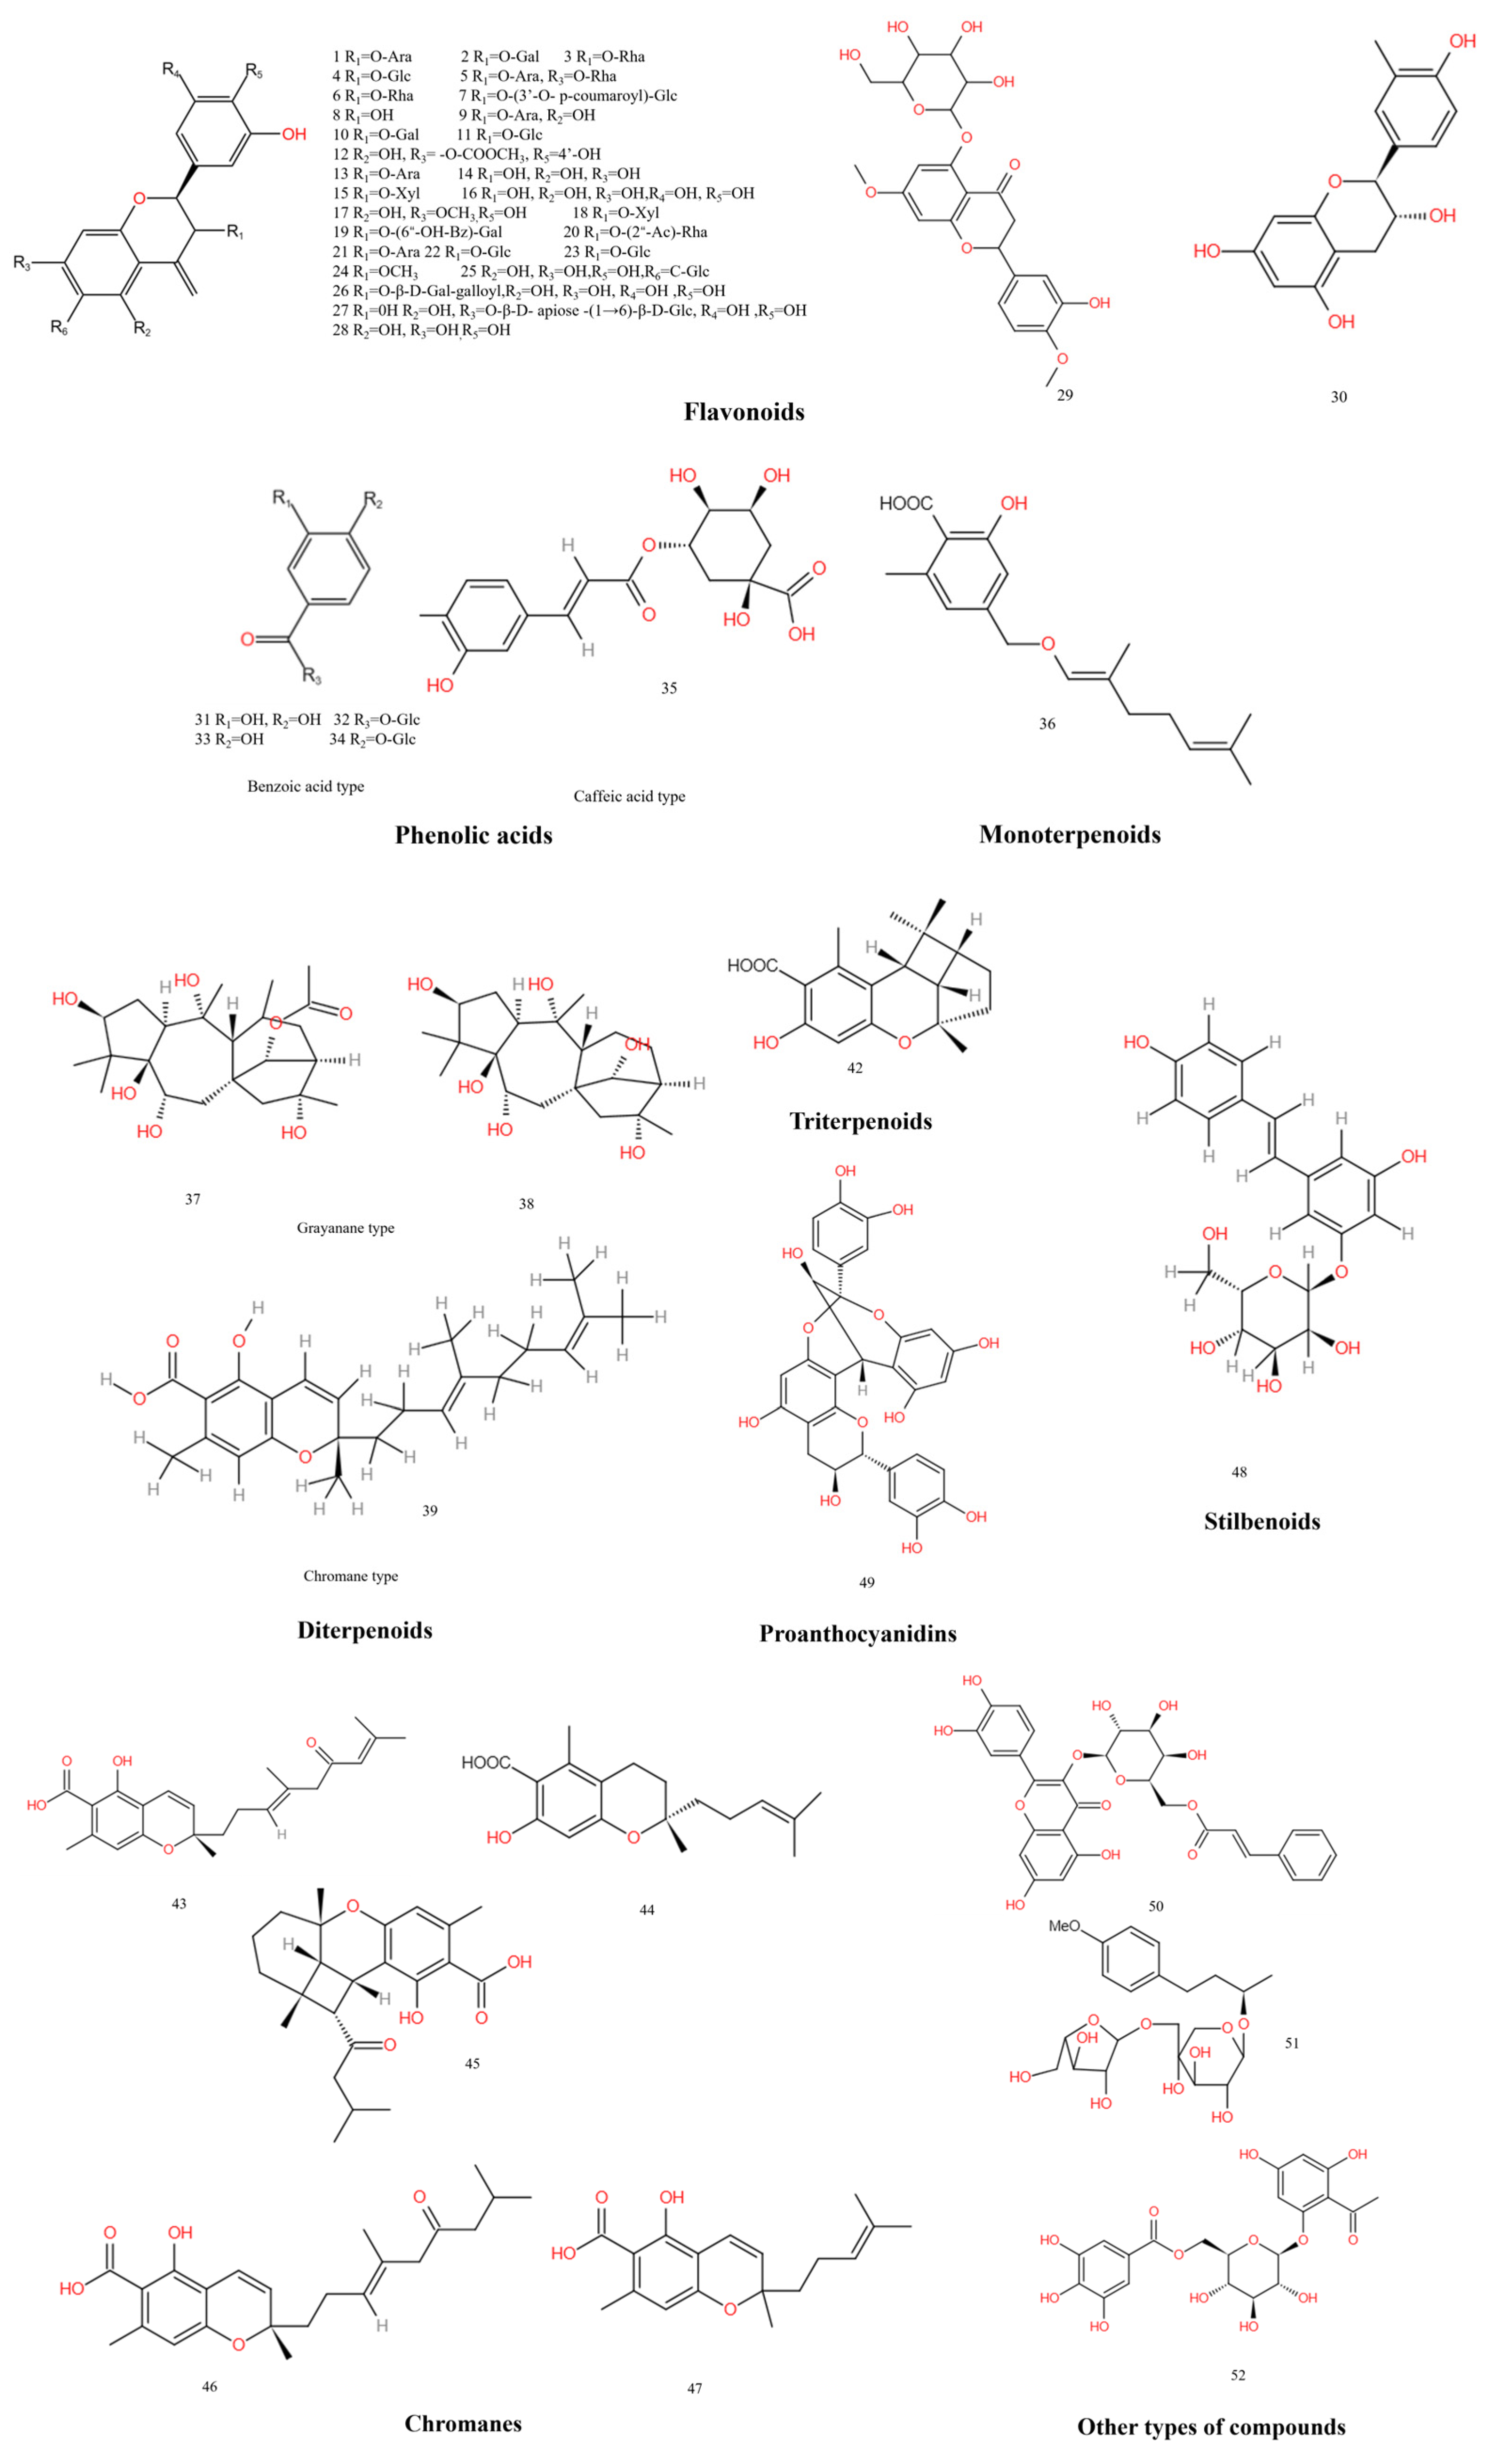
Rhododendron species (chemical structures are shown in
Figure 1; mass spectrometry data and compound classification are presented in
Table S4). These compounds mainly include 30 flavonoids and their glycosides, comprising flavonol aglycones such as quercetin (8) and myricetin (16); flavonol glycosides such as hyperin (2) and quercitrin (6); flavone glycosides such as myricetin-3-O-arabinoside (21) and taxifolin derivatives (1, 18, 23); dihydroflavones such as farrerol (17); and flavanols such as catechin (30). In addition, five phenolic acids were tentatively identified, including protocatechuic acid (31) and chlorogenic acid (35); seven terpenoids, including ranhuadujuanine C (36), grayanotoxin I (38), nimbocinin (41), and anthopogocyclolic acid (42); five chromane/chromene derivatives (43–47); one proanthocyanidin, procyanidin A1 (49); one stilbenoid, resveratrol-3-O-glucoside (48); and three other compounds, including myrciaphenone B (52).
The number of compounds tentatively identified in each species and their representative constituents are as follows: 14 compounds were tentatively identified in Rhododendron vellereum, including protocatechuic acid (31), grayanotoxin I (38), and hyperin (2); 16 compounds in Rhododendron principis, including catechin (30), vanillic acid 1-O-β-D-glucoside (32), and rhododendrin (28); 15 compounds in Rhododendron fragariiflorum, including 4′-hydroxyacetophenone (33), myricetin (16), and farrerol (17); 14 compounds in Rhododendron lepidotum, including chlorogenic acid (35), catechin (30), and taxifolin-3-O-xyloside (18); 16 compounds in Rhododendron mainlingense, including taxifolin-3-O-arabinoside (1), quercitrin (6), and quercetin 3-(2″-acetylrhamnoside) (20); 16 compounds in Rhododendron anthopogon, including myricetin-3-O-β-D-galactoside (10), quercetin (8), and ranhuadujuanine C (36); and 16 compounds in Rhododendron nivale, including taxifolin-3-O-glucoside (23), persiconin (29), and farrerol (17).
2.2. A Comparison of the Phytochemical Composition of Seven Rhododendron Species
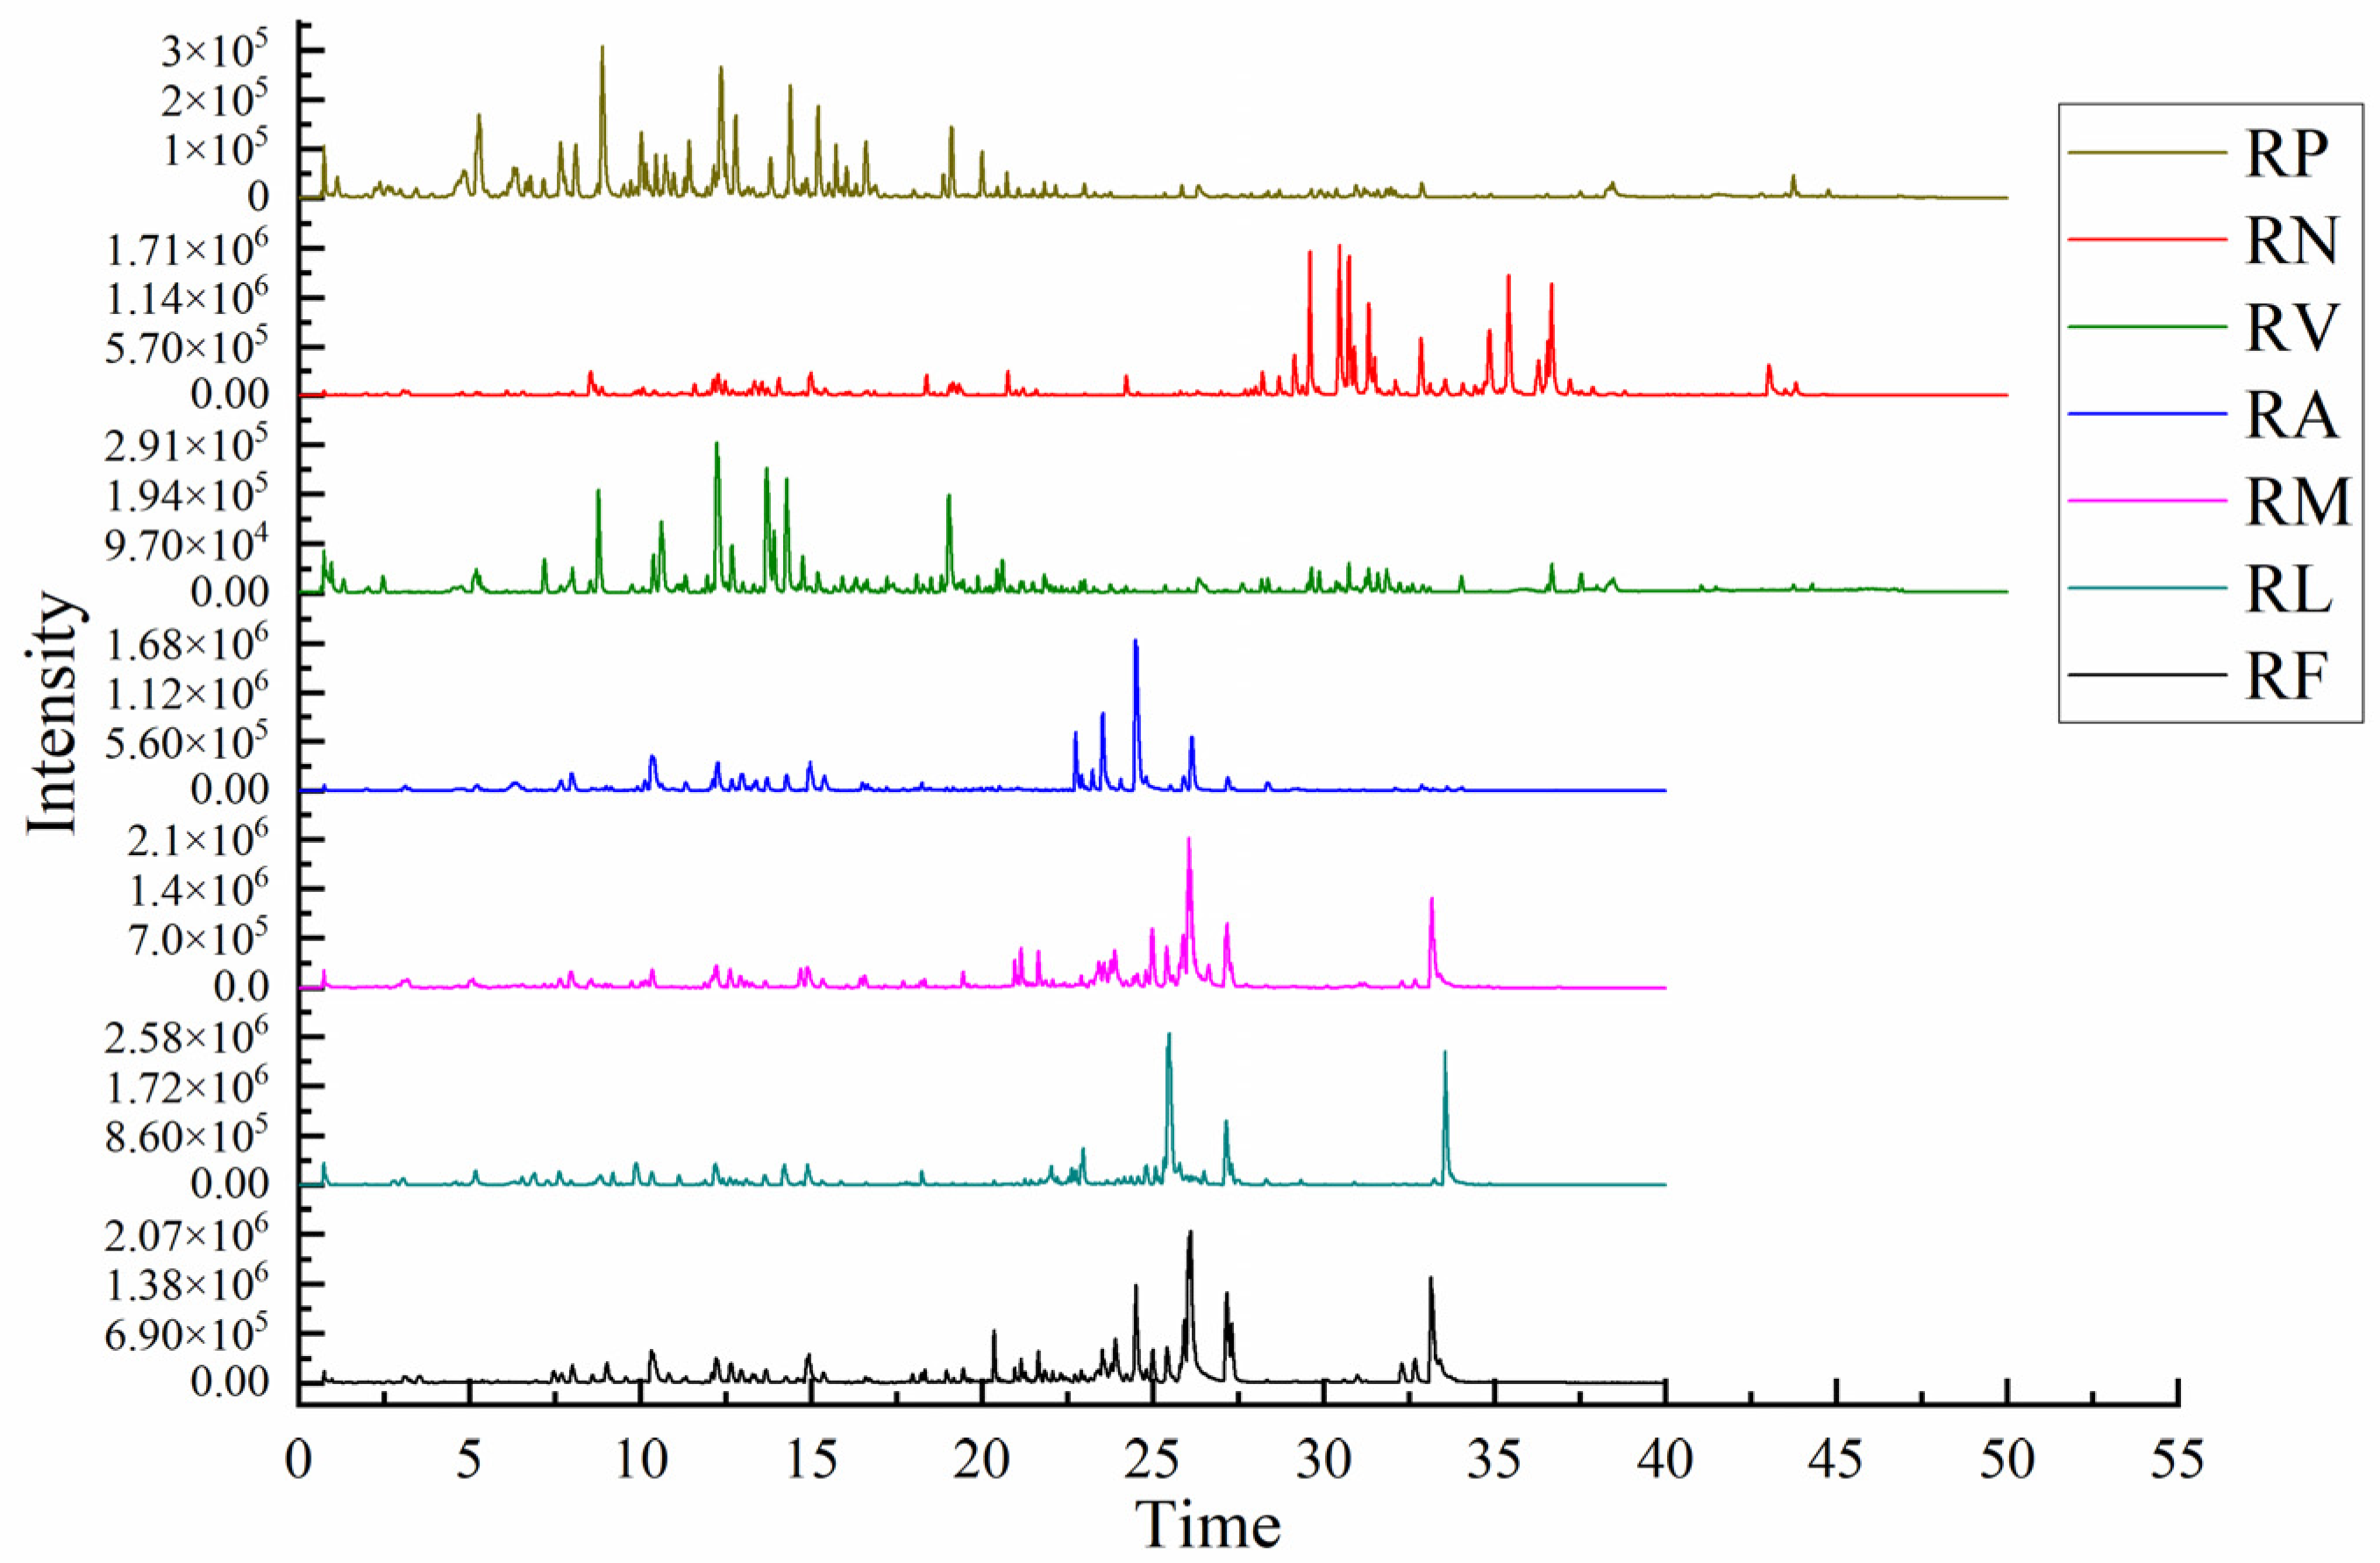
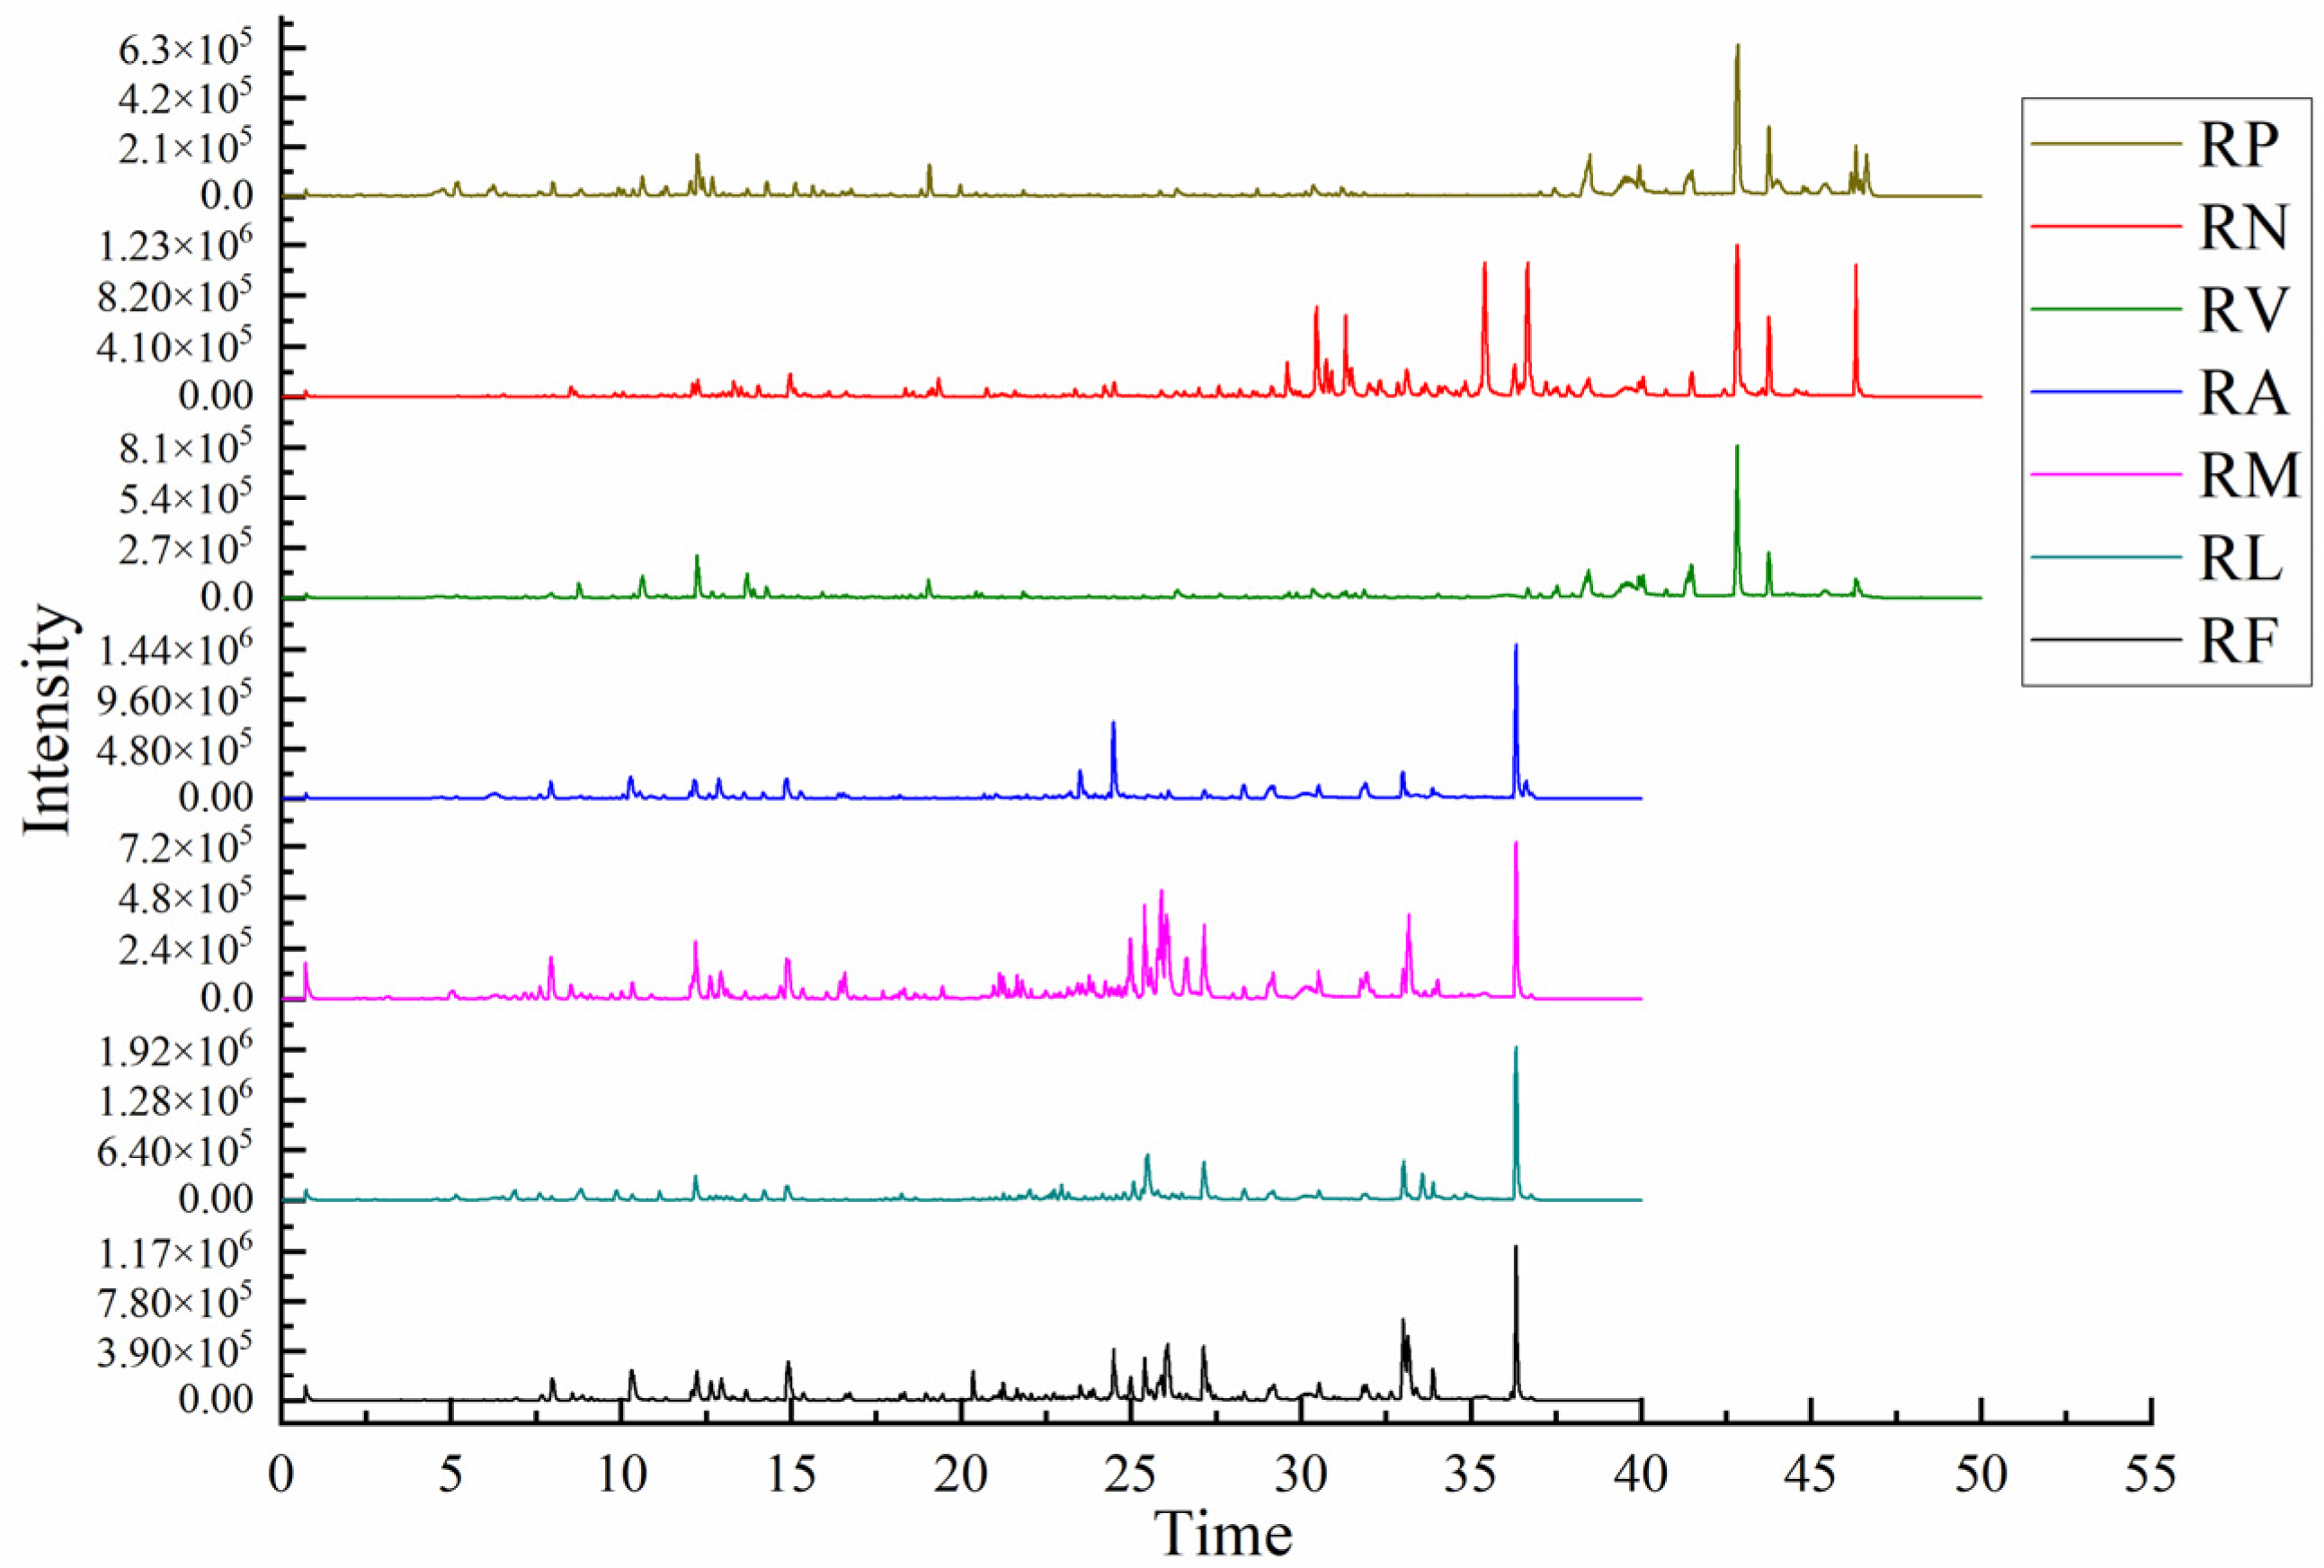
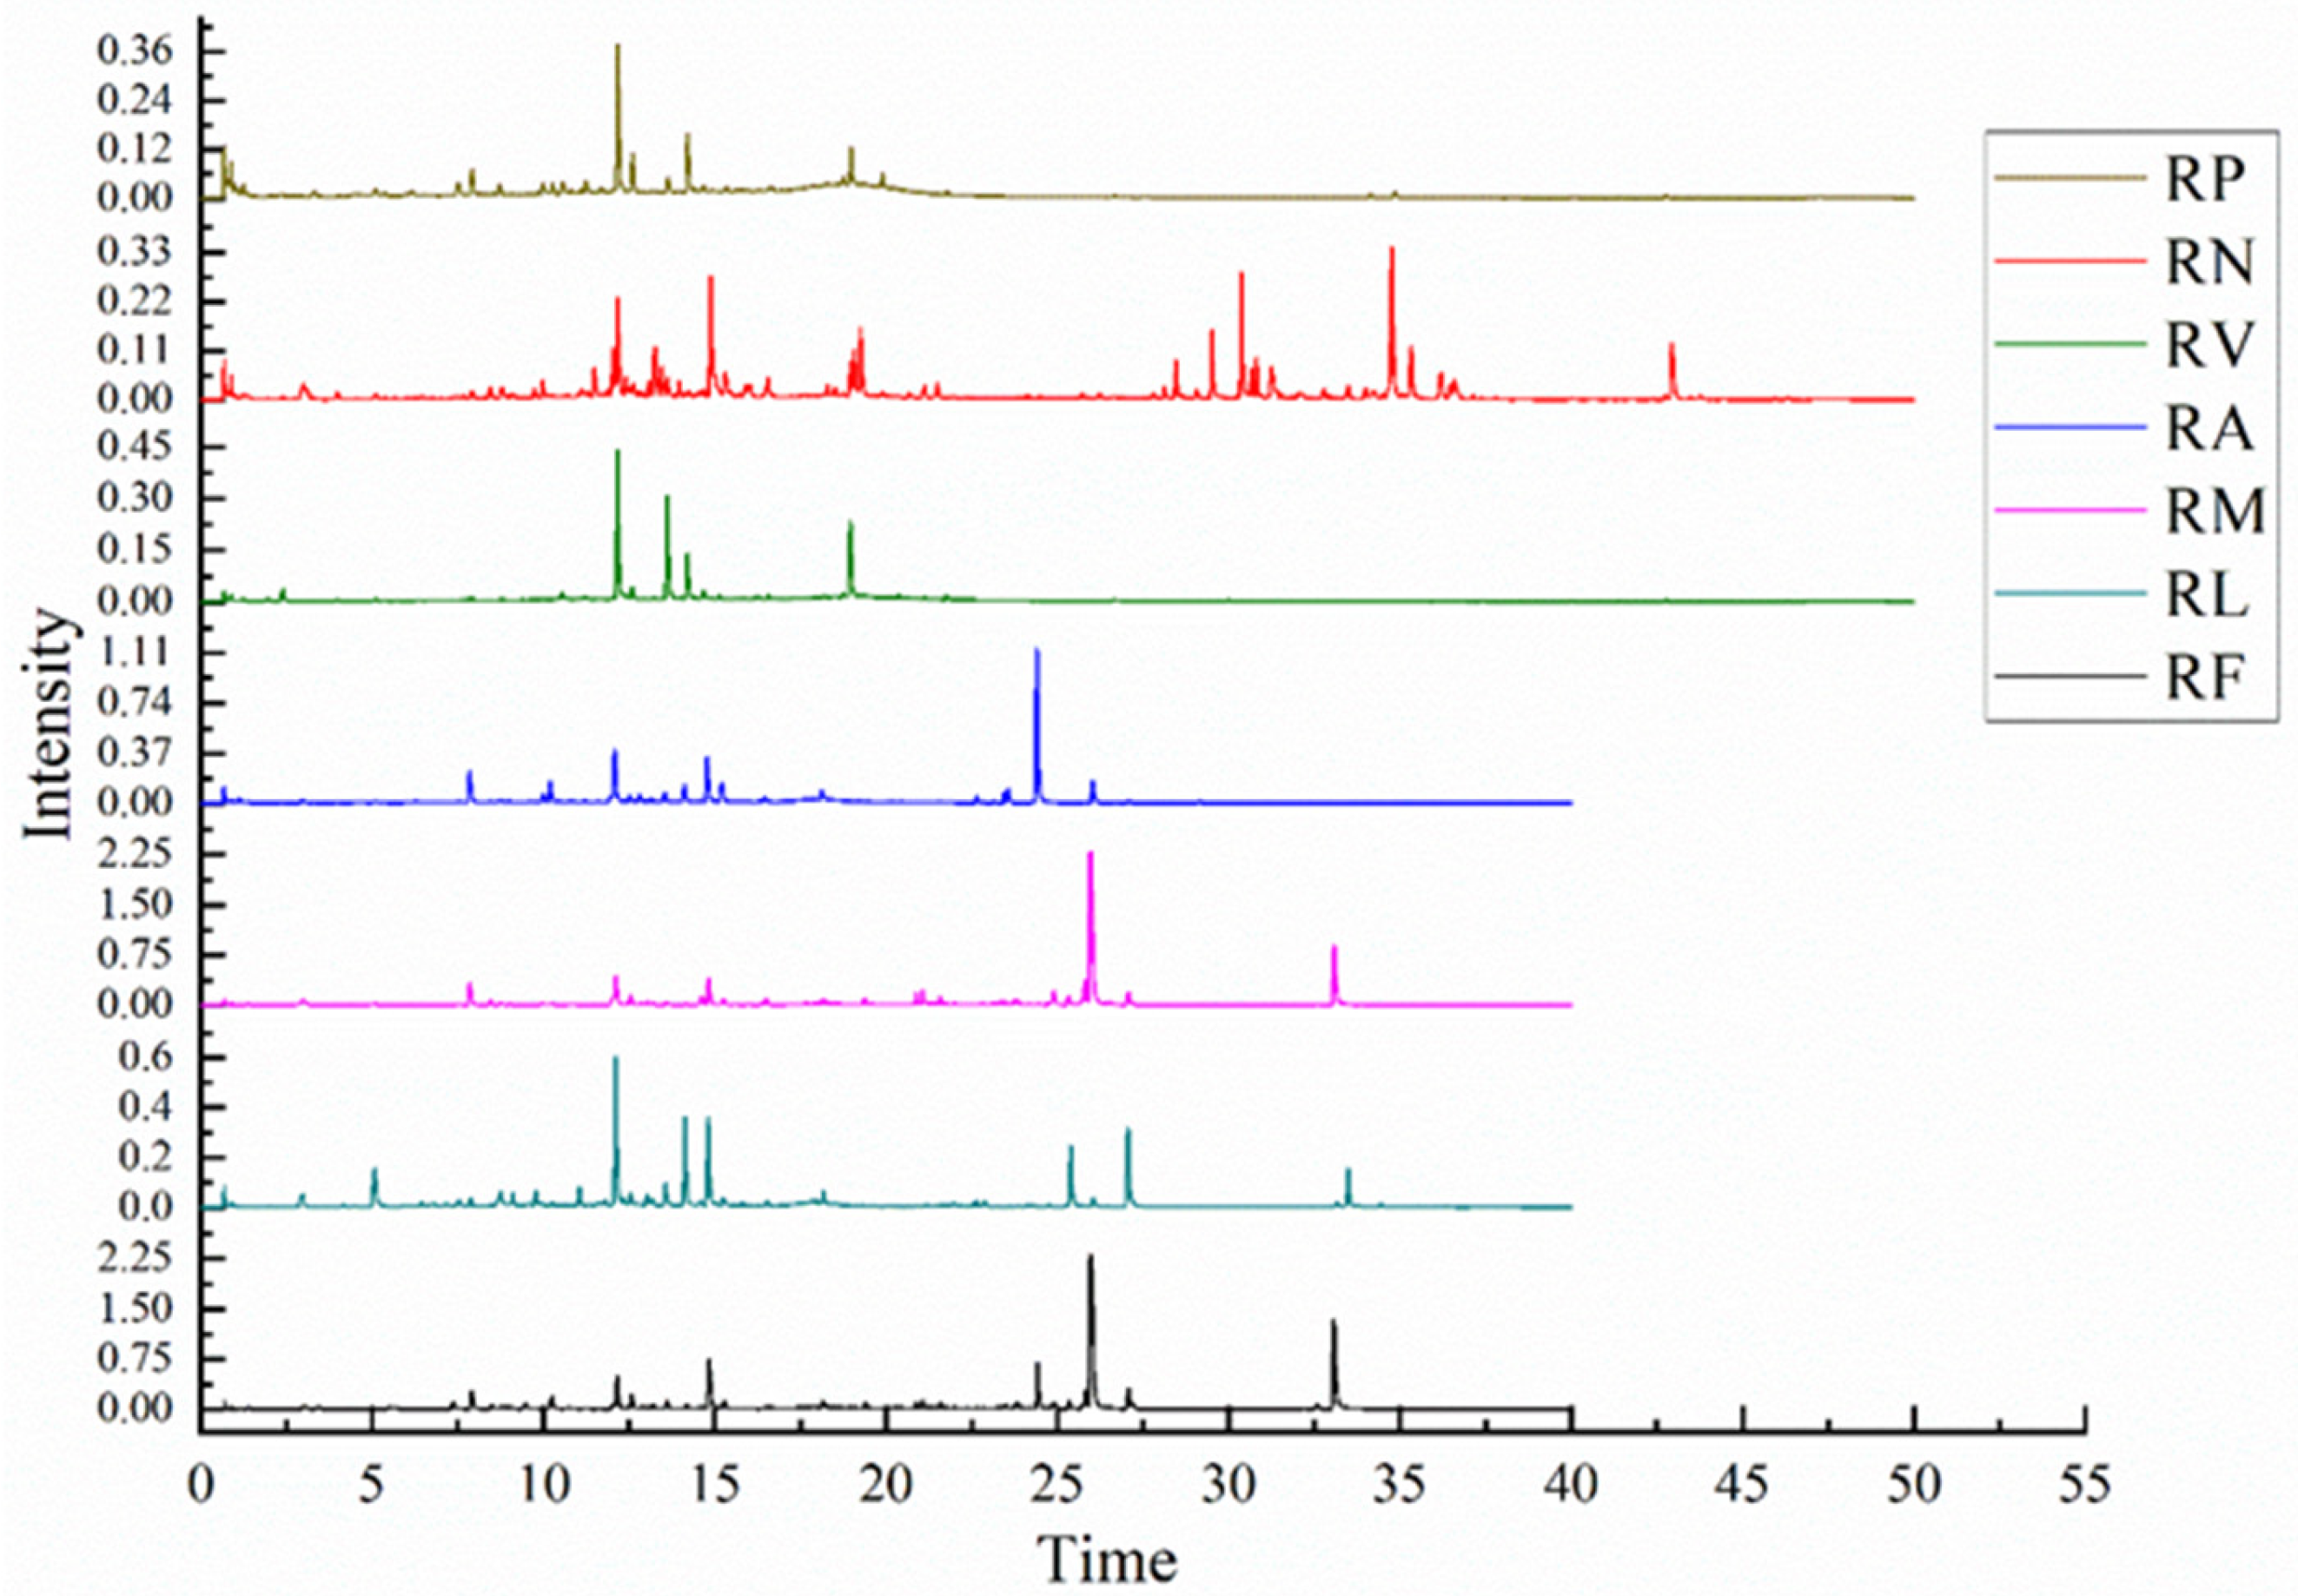
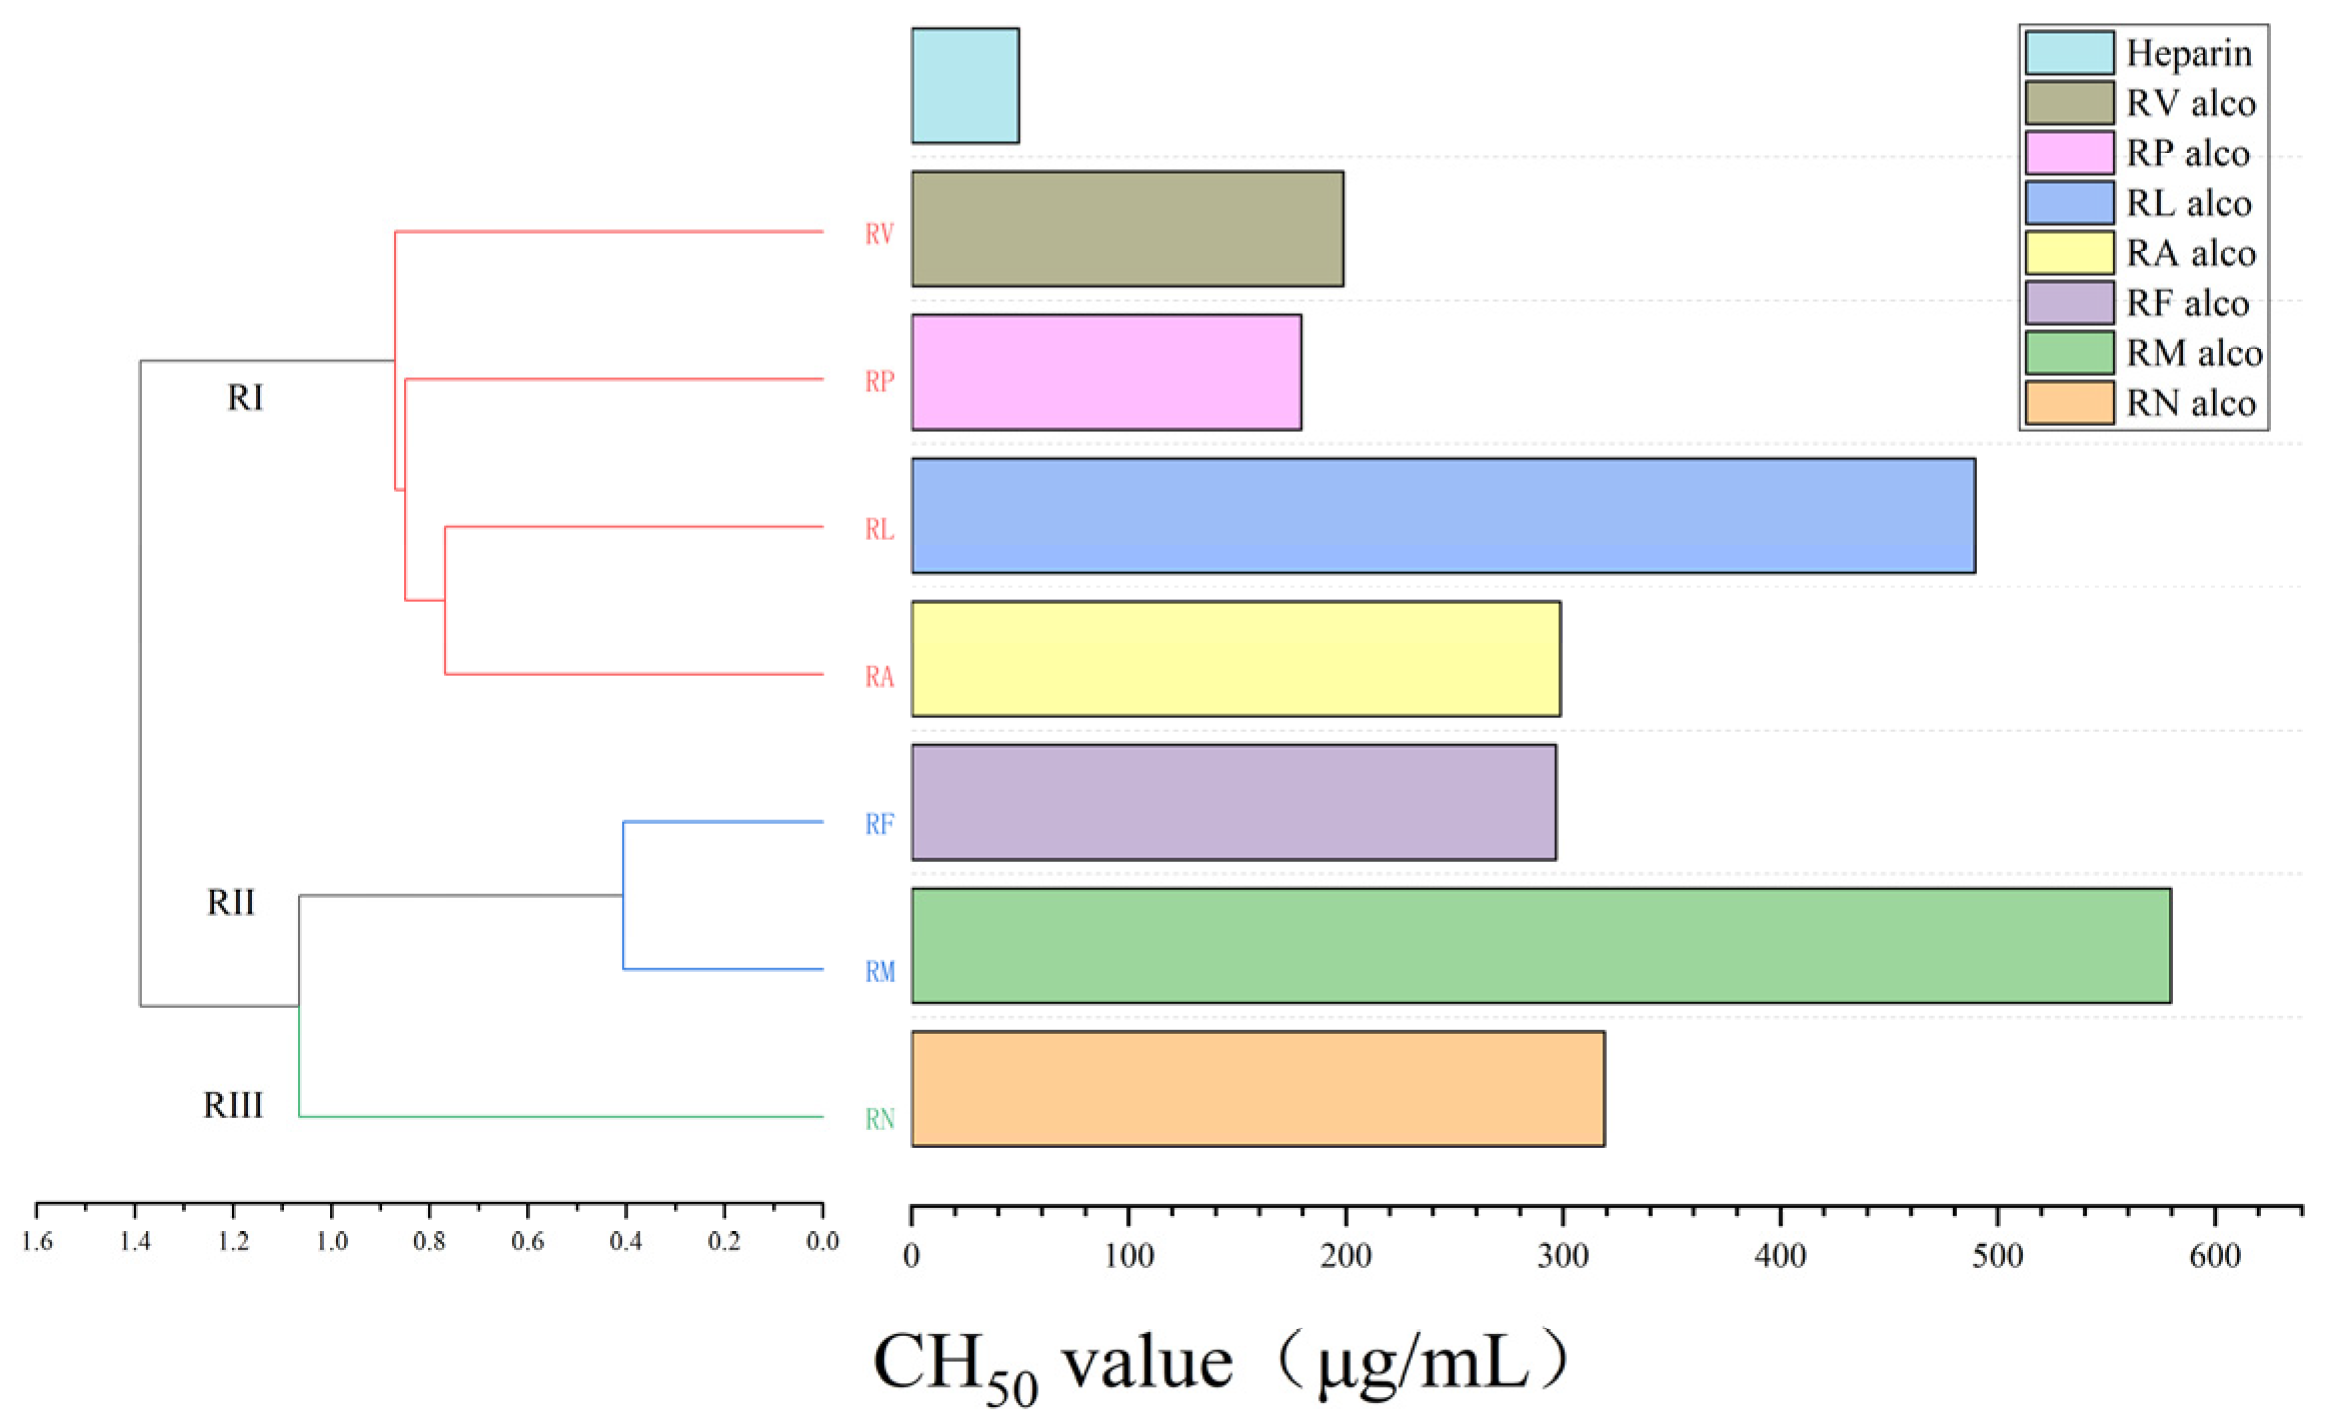
According to cluster analysis, the 52 tentatively identified compounds allowed the classification of the seven
Rhododendron species into three chemotypes (see
Figure 2,
Figure 3,
Figure 4 and
Figure 5): RI (
Rhododendron vellereum,
R. principis,
R. lepidotum, and
R. anthopogon), RII (
R. fragariiflorum and
R. mainlingense), and RIII (
R. nivale). The distribution of characteristic compounds in each group is as follows: In the RI group, the main detected constituents include taxifolin-3-O-arabinoside (1), procyanidin A1 (49), hyperin (2), isoquercitrin (3), avicularin (4), guaijaverin (5), etc. In the RII group, the main detected constituents include taxifolin-3-O-arabinoside (1), hyperin (2), isoquercitrin (3), myricetin-3-O-β-D-galactoside (10), myricetin-3-O-β-D-xylopyranoside (15), myricetin (16), rubiginosin B (40), anthopogochromene C (43), etc. In the RIII group, the main detected constituents include hyperin (2), quercetin (8), myricetin-3-O-glucoside (11), myricetin-3-O-β-D-xylopyranoside (15), myricetin (16), farrerol (17), anthopogocyclolic acid (42), daurichromenic acid (39), anthopogochromane (45), anthopogochromene A (46), laricitrin 3-O-β-D-glucoside (22), taxifolin-3-O-glucoside (23), persiconin (29), farrerol-7-O-β-D-apiofuranosyl(1 → 6)-β-D-glucopyranoside (27), myricetin 3-methyl ether (24), cirsimarin or isomer (25), etc.
Among the 52 tentatively identified compounds, the distribution of different constituents across the seven Rhododendron species exhibited marked differences. Hyperin (2) was a common component present in all seven species. Taxifolin-3-O-arabinoside (1) and isoquercitrin (3) were distributed in six species. Avicularin (4) and myricetin-3-O-β-D-xylopyranoside (15) were found in five species. Guaijaverin (5), myricetin-3-O-β-D-galactoside (10), myricetin (16), and anthopogochromenic acid (44) were distributed in four species. Procyanidin A1 (49), quercetin (8), anthopogocyclolic acid (42), nimbocinin (41), and daurichromenic acid (39) were found in three species. In addition, quercitrin (6), catechin (30), myricetin-3-O-glucoside (11), farrerol (17), rubiginosin B (40), anthopogochromene C (43), anthopogochromane (45), anthopogochromene A (46), laricitrin-3-O-β-D-glucoside (22), and other constituents were distributed in two species.
Among the 52 tentatively identified compounds, the distribution of different constituents across the seven Rhododendron species exhibited marked differences. Hyperin (2) was a common component present in all seven species. Taxifolin-3-O-arabinopyranoside (1) and isoquercitrin (3) were distributed in six species. Avicularin (4) and myricetin-3-O-β-D-xylopyranoside (15) were found in five species. Guaijaverin (5), myricetin-3-O-β-D-galactoside (10), myricetin (16), and anthopogochromenic acid (44) were distributed in four species. Procyanidin A1 (49), quercetin (8), anthopogocyclolic acid (42), nimbocinin (41), and daurichromenic acid (39) were found in three species. In addition, quercitrin (6), catechin (30), myricetin-3-O-glucoside (11), farrerol (17), rubiginosin B (40), anthopogochromene C (43), anthopogochromane (45), anthopogochromene A (46), laricitrin-3-O-β-D-glucoside (22), and other constituents were distributed in two species. Furthermore, each species possesses its own characteristic compounds: Rhododendron vellereum contains protocatechuic acid (31), grayanotoxin III (37), grayanotoxin I (38), and naringenin (9); R. principis contains vanillic acid-1-O-β-D-glucoside (32), rhododendrin (28), resveratrol-3-O-glucoside (48), phaeochrysin or isomer (51), rhododendrin methyl ether (12), azaleatin-3-O-arabinoside (13), and azaleatin (14); R. fragariiflorum contains 4′-hydroxyacetophenone (33); R. lepidotum contains vanillic acid-4-β-D-glucoside (34), chlorogenic acid (35), myrciaphenone B (52), taxifolin-3-O-xyloside (18), and 2″-galloylhyperin (26); R. mainlingense contains quercetin 3-(6″-p-hydroxybenzoylgalactoside) (19) and quercetin 3-(2″-acetylrhamnoside) (20); R. anthopogon contains myricetin-3-O-arabinoside (21), ranhuadujuanine C (36), and cannabiorcichromenic acid (47); R. nivale contains taxifolin-3-O-glucoside (23), persiconin (29), farrerol-7-O-β-D-apiofuranosyl(1 → 6)-β-D-glucopyranoside (27), myricetin 3-methyl ether (24), and cirsimarin or isomer (25).
2.3. Anti-Complement Activity Assay
The anti-complement activity of the ethanol extracts from seven
Rhododendron species was evaluated in this study. The results showed that all samples exhibited varying degrees of complement inhibition, with CH
50 values ranging from 179.29 to 579.47 μg/mL. Among them, the ethanol extract of
Rhododendron principis showed the strongest activity, with a CH
50 value of 179.29 ± 11.86 μg/mL, followed by that of
Rhododendron vellereum (198.61 ± 7.93 μg/mL), while the extract of
Rhododendron mainlingense exhibited the weakest activity (579.47 ± 11.49 μg/mL). The activities of the other four
Rhododendron ethanol extracts fell between these values. The CH
50 value of the positive control, heparin, was 49.25 ± 2.59 μg/mL, and all ethanol extracts showed weaker activity than heparin. The detailed results are presented in
Table 1.
According to cluster analysis, the 52 tentatively identified compounds allowed the classification of the seven
Rhododendron species into three chemotypes. RI (
Rhododendron vellereum,
R. principis,
R. lepidotum, and
R. anthopogon), RII (
R. fragariiflorum and
R. mainlingense), and RIII (
R. nivale). This classification indicates significant differences in chemical composition among the different
Rhododendron species. Species within the same chemotype may share similar metabolic characteristics, whereas compositional differences between chemotypes may be the intrinsic reason for their varying anti-complement activities (see
Table 1 and
Figure 5).
2.4. Results of the Spectrum–Effect Relationship Analysis of the Ethanol Extracts from Seven Rhododendron Species
2.4.1. PLS Model Performance
A single-component partial least squares (PLS) regression model was established based on the eight selected characteristic peaks (F5991, F2582, F8140, F6758, F5822, F5315, F5368, F2481). The model exhibited a goodness-of-fit R2 of 0.908, a cross-validated predictive ability Q2 of 0.365, and a root mean square error (RMSE) of 0.303. The high R2 value indicates that the model can explain the variation in the training data reasonably well, whereas the low Q2 value (<0.5) suggests that, due to the extremely small sample size (n = 7), the predictive ability of the model is limited. Therefore, the results are primarily used as a preliminary screening reference for activity-related features.
2.4.2. Overall Bootstrap Stability
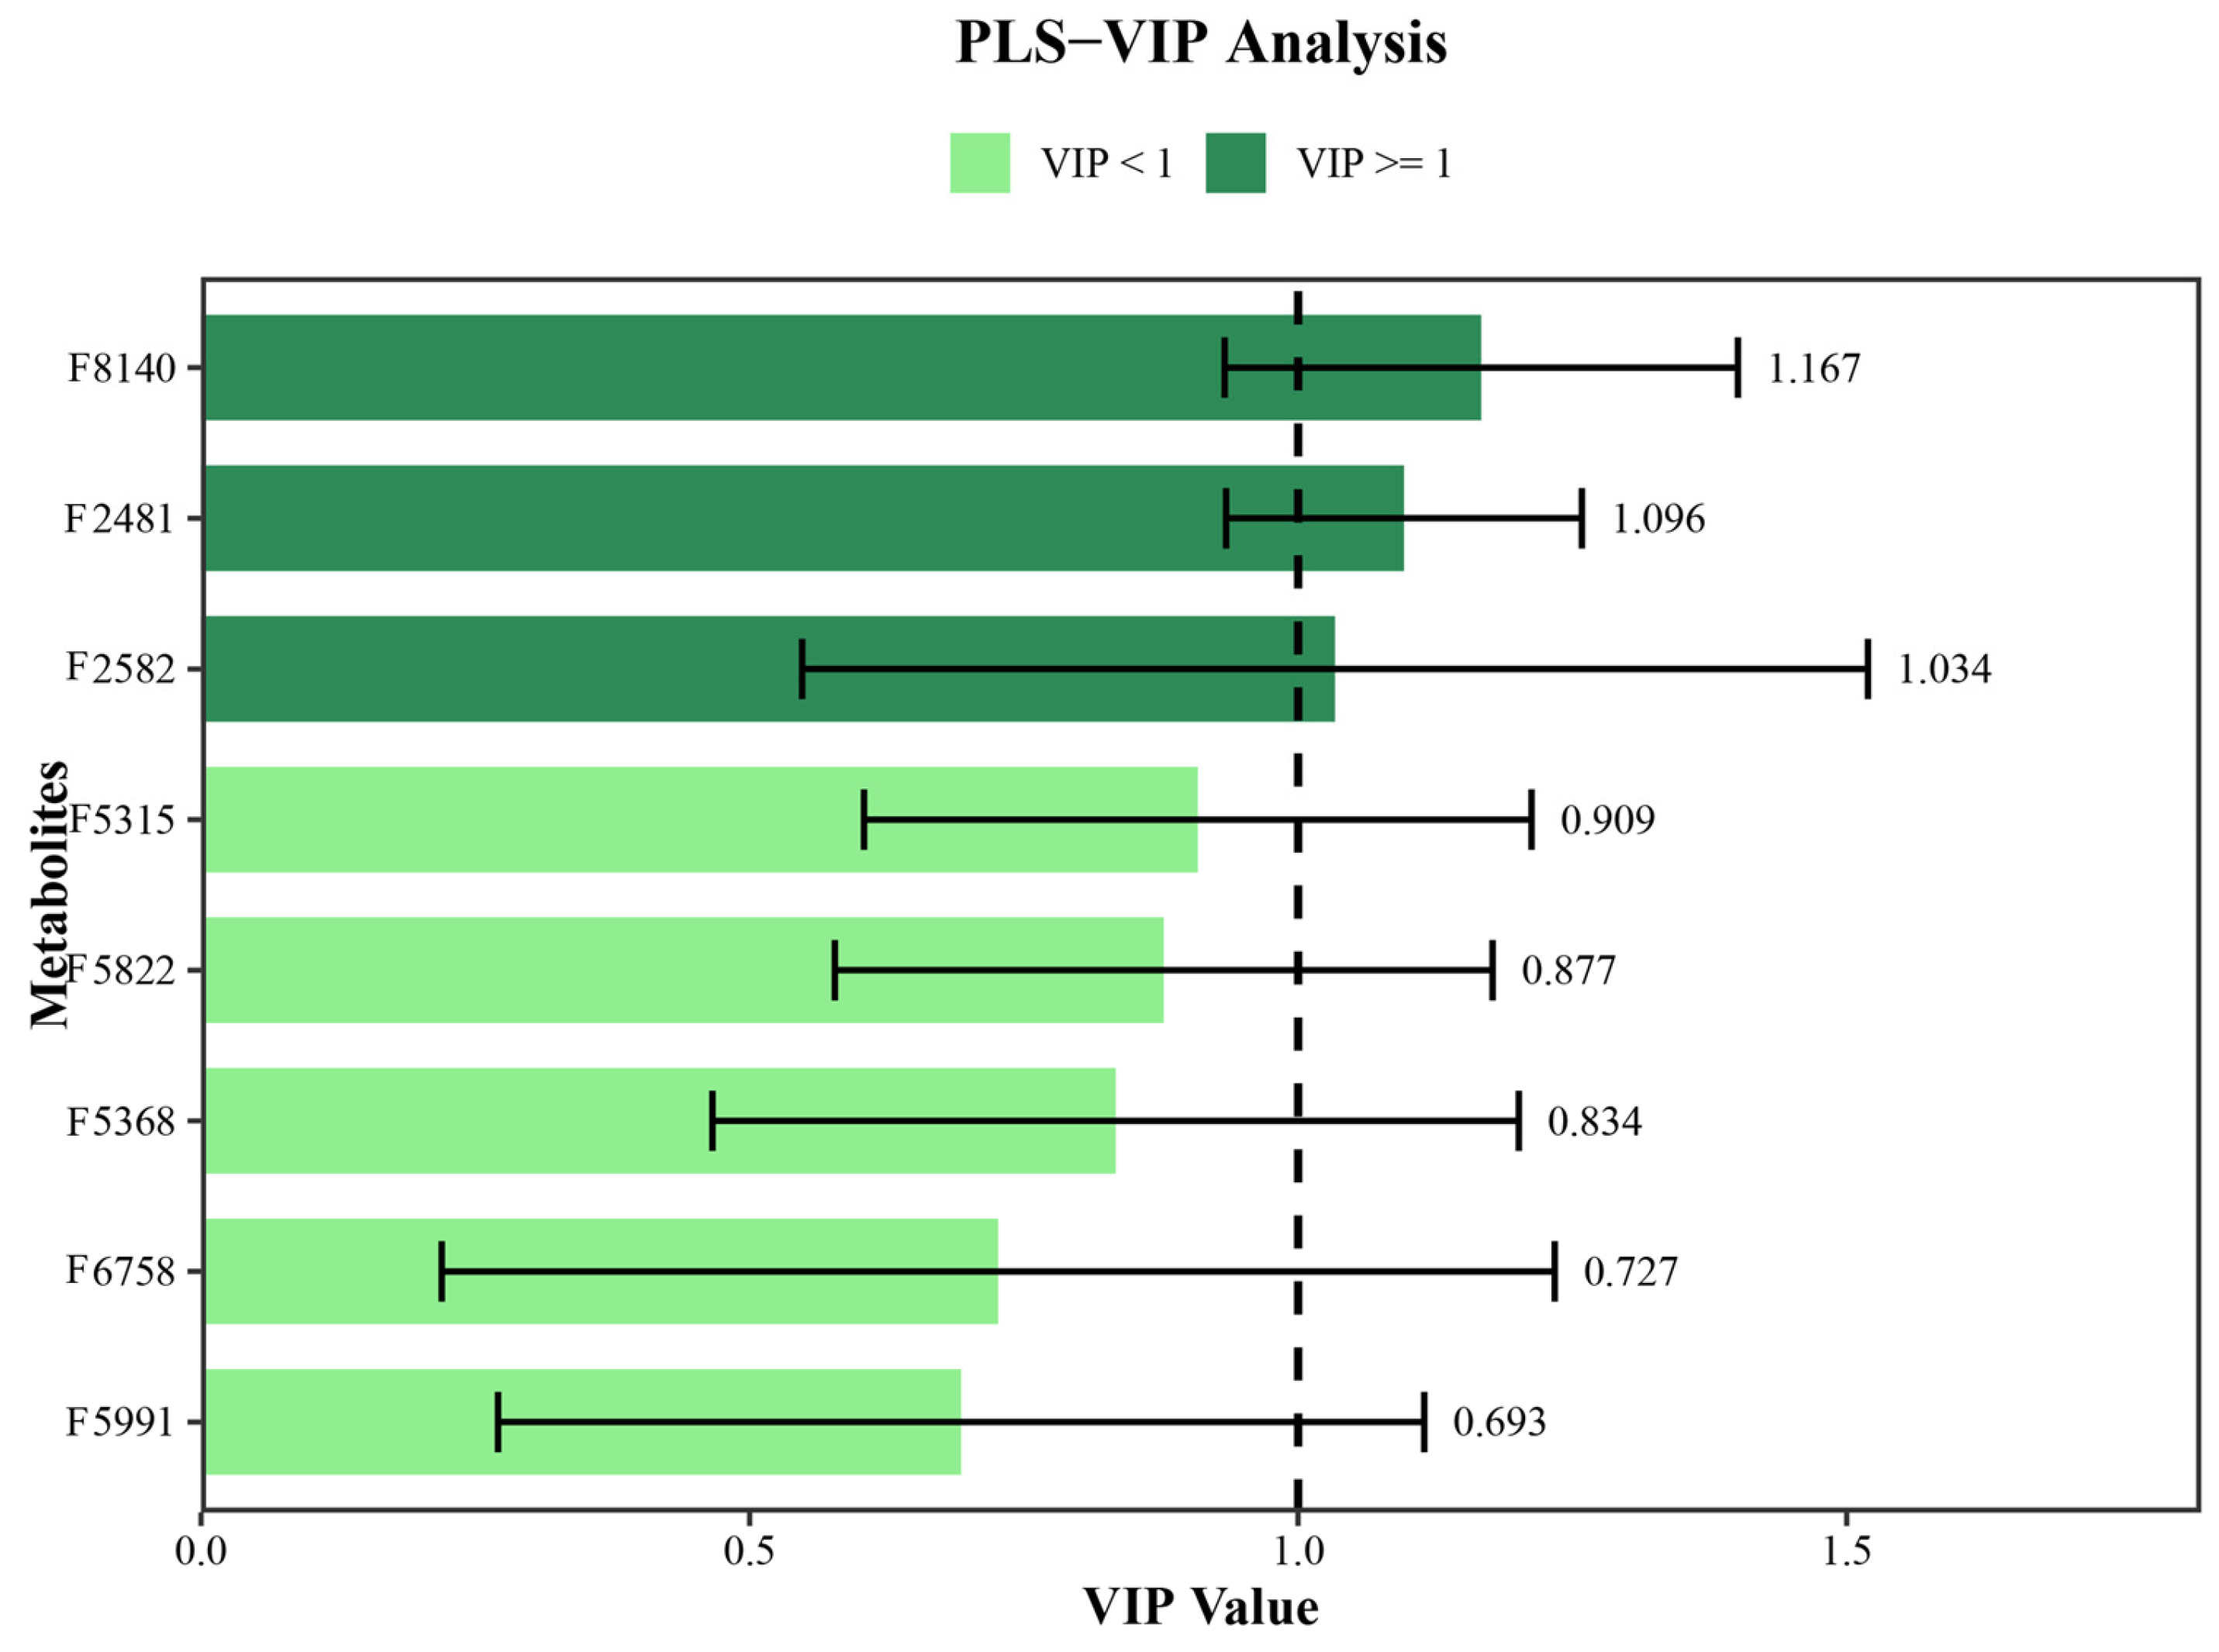
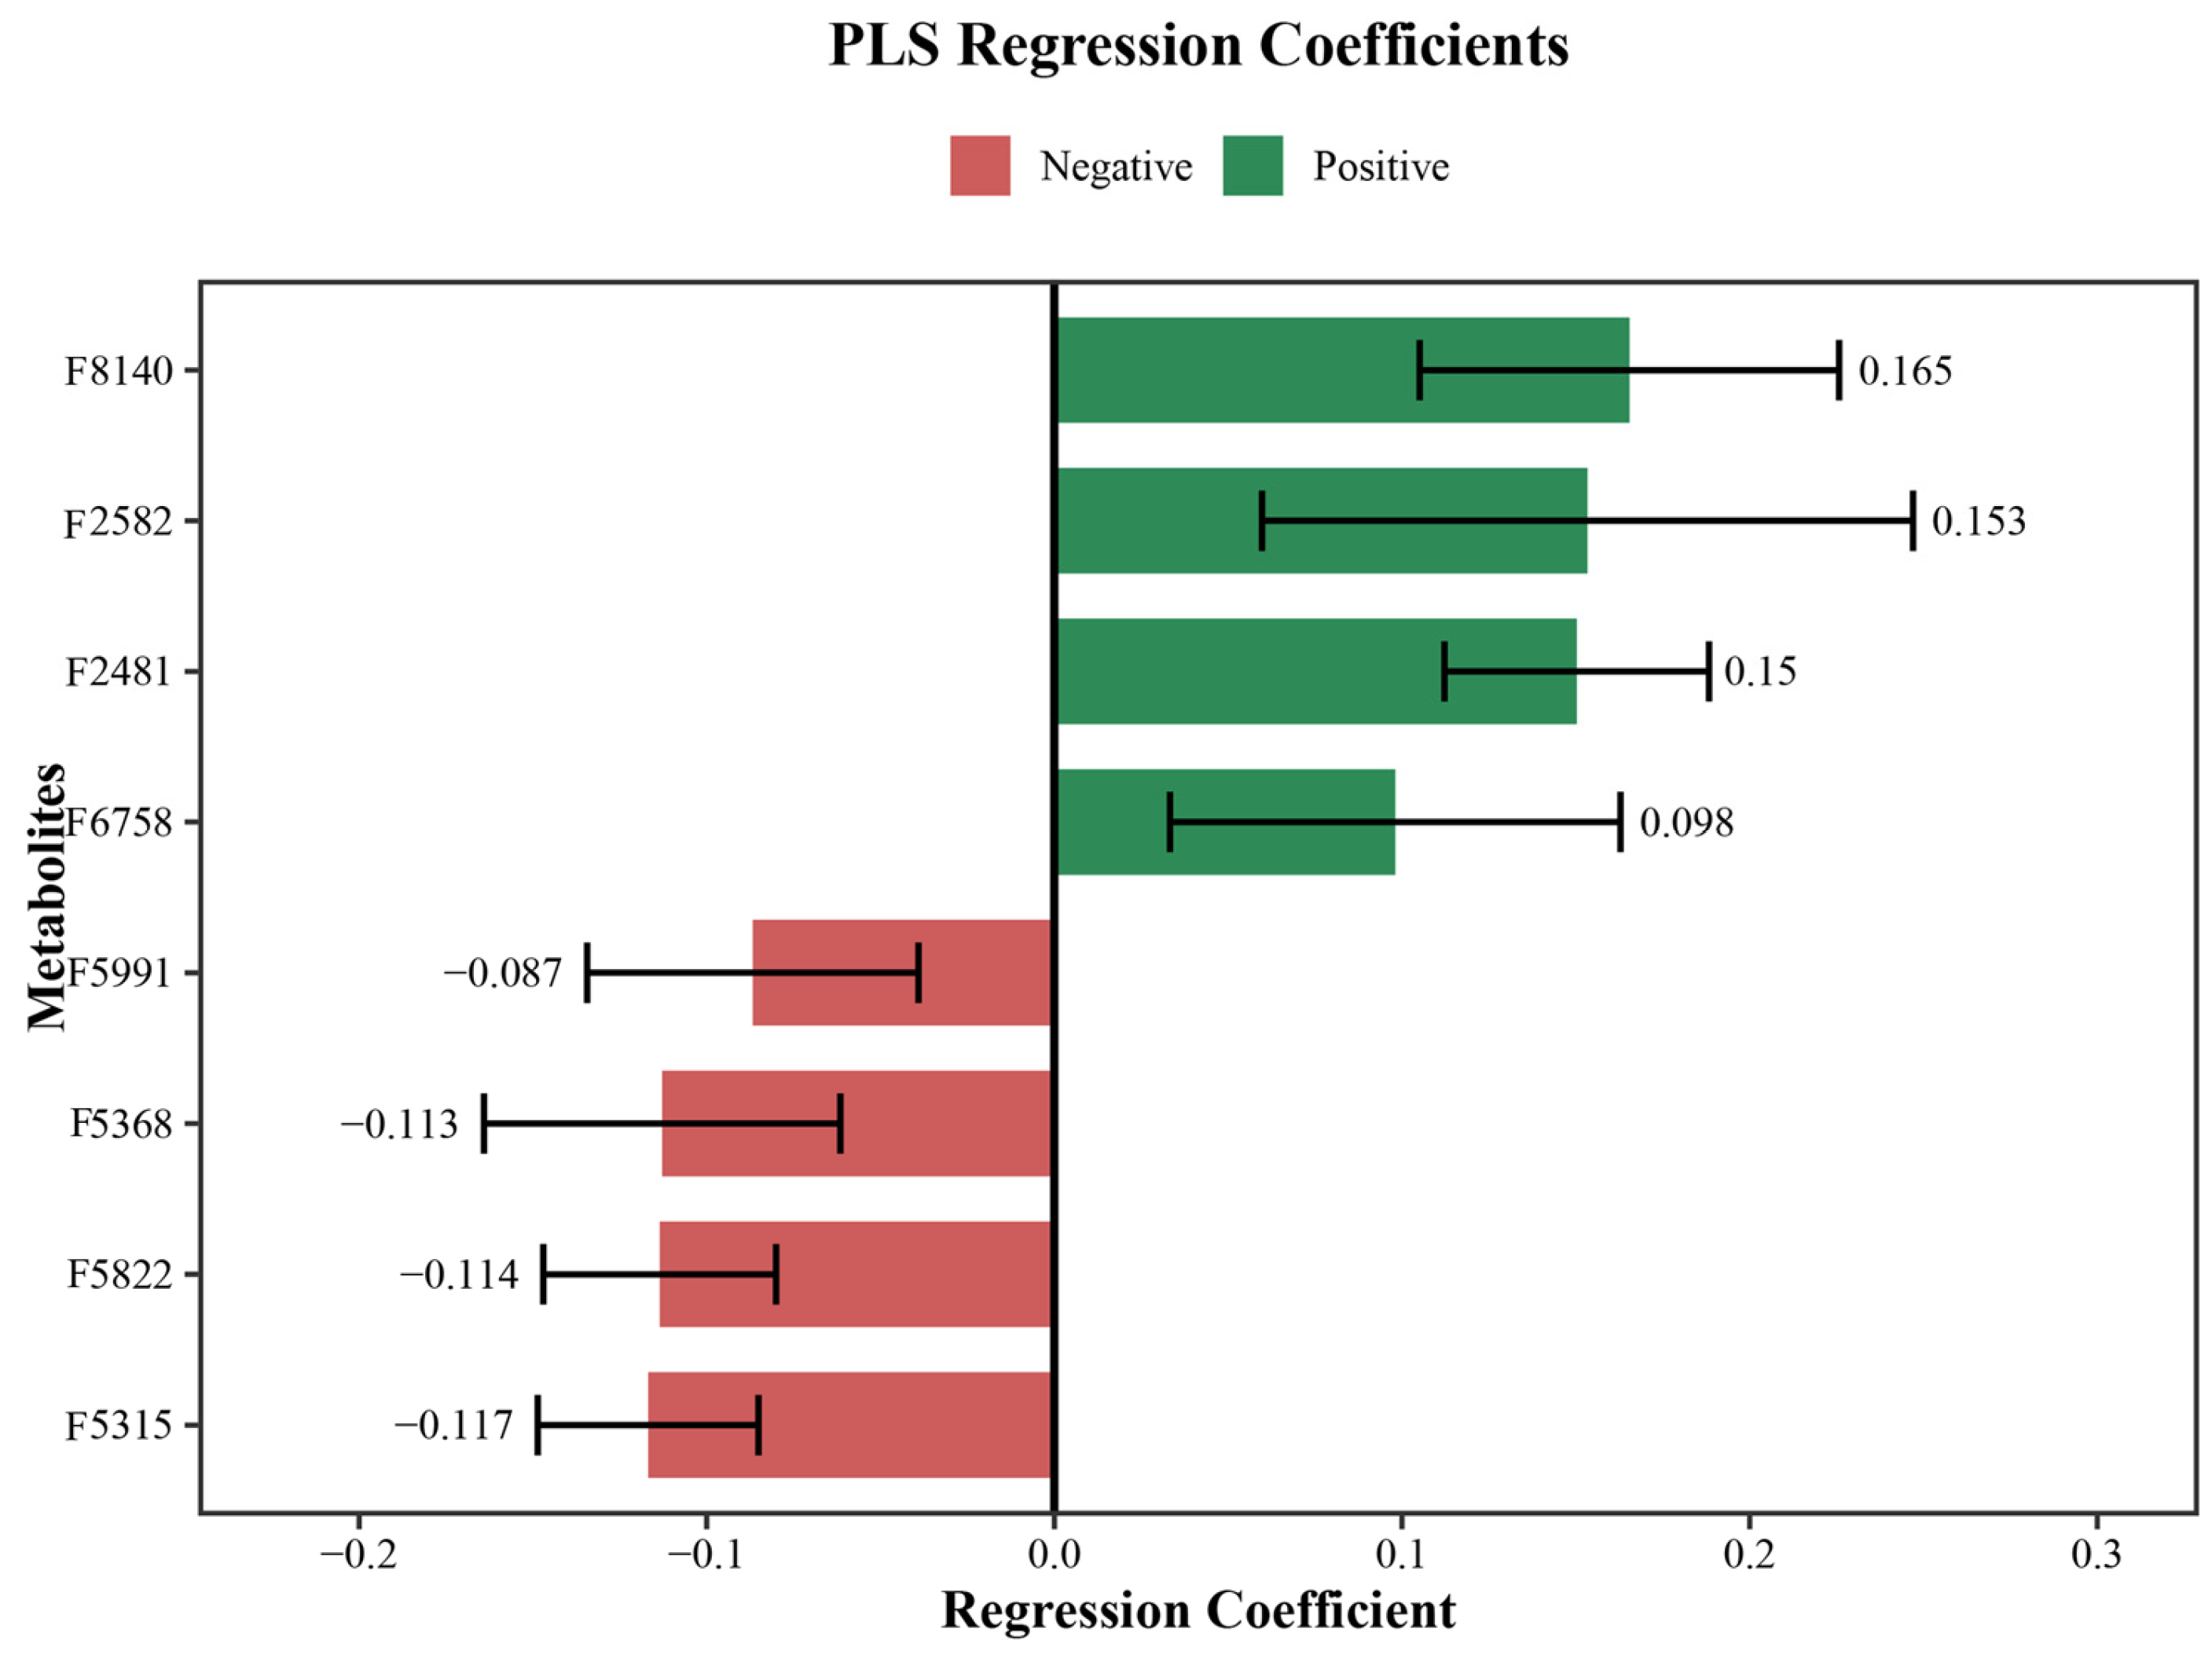
After 5000 bootstrap resampling iterations, the statistical results of the variable importance in projection (VIP) and regression coefficients for each feature are shown in
Figure 6. Overall, the mean standard deviation of the VIP values was 0.348, and the mean standard deviation of the regression coefficients was 0.053, indicating high robustness of the parameter estimates for each feature. The VIP means of features F8140, F2481, and F2582 were 1.167, 1.096, and 1.034, respectively, all greater than 1.0, and their VIP_SD values were all less than 0.5, demonstrating high model contribution and stability.
2.4.3. Regression Coefficient Analysis and Candidate Marker Screening
Combined analysis of VIP and regression coefficients (
Figure 7 and
Figure 8) showed that although features F8140, F2481, and F2582 met the VIP criterion and exhibited good stability, they were excluded due to their positive regression coefficients (indicating a negative correlation between content and activity). Feature F6758 had a VIP_SD slightly above 0.5 (0.507), indicating relatively lower stability. According to the strict criteria (VIP_mean ≥ 1.0, VIP_SD < 0.5, Coefficient_mean < 0), no qualified quality marker was identified. Although their VIP means did not reach 1.0, features F5315, F5822, F5368, and F5991 satisfied Coefficient_mean < 0 and VIP_SD < 0.43, indicating a positive correlation between their content and anti-complement activity (higher content leads to lower CH
50) and stable bootstrap results. These features were listed as potential active marker candidates.
Among them, features F5315 (VIP = 0.909, coefficient = −0.117), F5822 (VIP = 0.877, coefficient = −0.114), and F5368 (VIP = 0.834, coefficient = −0.113) had VIP means close to 0.9, warranting special attention in this small-sample study. Feature F5991 (VIP = 0.693, coefficient = −0.087), although contributing less, showed the correct direction and good stability, and can be considered as a secondary candidate.
3. Discussion
In this study, a total of 52 compounds were tentatively identified from seven Tibetan medicinal
Rhododendron species using UPLC-Q-TOF-MS. Based on their structural features, these compounds can be classified into seven major categories, including flavonoids, terpenoids, and chromanes. This chemical classification reveals that flavonoids serve as the core constituents of
Rhododendron species, while toxic diterpenes (e.g., grayanotoxins) and specific chromanes are also abundantly present [
10], providing a chemical basis for subsequent quality marker discovery and bioactive compound screening.
The results of the chemical composition cluster analysis (RI–RIII) show a significant correlation with the traditional Tibetan medicinal classification of Rhododendrons (“Dama” and “Tali”). Specifically, the “Dama” group (Rhododendron vellereum, Rhododendron principis) occupies a similar position in the clustering. The flavonoids and phenolic acids abundant in this group are known to possess multiple pharmacological activities, including anti-inflammatory, analgesic, antioxidant, and cardioprotective effects. This aligns with Tibetan medical practices that utilize Rhododendron principis and Rhododendron vellereum, which are commonly used in Tibetan medical practice for expectorant, antitussive, and anti-inflammatory purposes. Similarly, the Rhododendron fragariiflorum, Rhododendron mainlingense, and Rhododendron nivale within the “Tali” group each form distinct clusters; their reported antihypertensive, hypoglycemic, and antioxidant activities provide modern scientific support for their traditional use in treating cold-related illnesses and diphtheria. The aforementioned chemical classification results provide a material basis for supporting the empirical classification of Tibetan medicines “Dama” and “Tali.”
This study correlates the tentatively identified constituents of
Rhododendron species with the pharmacological activities reported in the literature, providing clues for elucidating the therapeutic potential of
Rhododendron resources. For example, hyperoside exhibits various physiological activities, including anti-inflammatory, antispasmodic, diuretic, antitussive, antihypertensive, cholesterol-lowering, and central analgesic effects, as well as protection against cardiovascular and cerebrovascular diseases [
11]. Phenolic acids such as protocatechuic acid exhibit significant cardioprotective effects, including anti-inflammatory, antioxidant, anti-atherosclerotic, and anti-myocardial ischemia properties [
12,
13]. As a flavonoid, naringin exhibits various pharmacological activities, including anti-inflammatory, antioxidant, antifibrotic, antitumor, and lipid metabolism-regulating effects [
14,
15]. The abundance of hyperoside, protocatechuic acid, and naringin in
R. vellereum may contribute to the strongest anti-complement activity observed among the tested species.
The white rhodochrin and rhodochrin-B, which are unique to
Rhododendron principis, have been shown to inhibit the activation of the TLR-7/NF-κB inflammatory pathway [
16,
17] and enzymes associated with neurodegenerative diseases, such as human glutamyl cyclase (hQC), and thus possess potential biological activity for the treatment of Alzheimer’s disease (AD) [
18]. Phaeochrysin has been reported to be isolated and tentatively identified from
Rhododendron agglutinatum, and this study also detected this compound in
Rhododendron principis [
19]. Furthermore, species-specific compounds have been identified in multiple species. For example, p-hydroxyacetophenone from
Rhododendron fragariiflorum exhibits soothing and sebum-regulating effects [
20], inhibits the in vitro adhesion, invasion, and migration of colon cancer cells, and reduces the metastatic burden in an in vivo model of colon cancer liver metastasis [
21]. Chlorogenic acid (a phenolic compound) isolated from
Rhododendron lepidotum exhibits potent inhibitory effects against various foodborne pathogens in vitro and in food matrices, as well as significant anti-inflammatory activity [
22,
23]; 2″-O-galloyl oleandrin demonstrates neuroprotective effects and some anti-inflammatory potential [
24]; Myrciaphenone B (a phenethyl ketone derivative isolated from the Brazilian medicinal plant Myrciaria multiflora) was reported for the first time from this species [
25]. Myrciarandol C (a monoterpene volatile compound) detected in
Rhododendron anthopogon is a typical representative of naturally occurring volatile organic compounds in the carbon cycle of forest ecosystems [
26]; Cannabiorcichromenic acid exhibits antibacterial activity [
27]. Taxifolin-3-O-glucoside, detected in
Rhododendron nivale, has hypoglycemic effects [
28]; Cirsimarin, a flavonoid, can inhibit cell proliferation, migration, and invasion, and exhibits anti-inflammatory, antioxidant, lipolytic, and anti-obesity activities [
29,
30,
31]. The discovery of these compounds provides a chemical basis for the diversified applications of these
Rhododendron plants beyond their traditional uses in Tibetan medicine.
4. Materials and Methods
4.1. Equipment
Waters H-Class Ultra-High-Performance Liquid Chromatograph (Waters Technologies Co., Ltd., Shanghai, China), AB Sciex Triple TOF® 4600 High-Resolution Mass Spectrometer (Sciex, Marlborough, MA, USA), Electronic Balance (ME104, Mettler-Toledo International Trading (Shanghai) Co., Ltd., Shanghai, China), Ultrasonic Cleaner (KQ-300 BD, Kunshan Ultrasonic Instrument Co., Ltd., Kunshan, China), High-Speed Centrifuge (SIGMA 3K15, SIGMA, Laborzentrifugen GmbH, Osterode am Harz, Germany), Constant-Temperature Shaker (WMZK 8002, Shanghai Medical Instrument Factory, Shanghai, China), Low-speed bench-top centrifuge (Model TDL-4, Shanghai Anting Scientific Instrument Factory, Shanghai, China), UV analyzer (ZF-20C dark box, Shanghai Jihui Scientific Analytical Instrument Co., Ltd., Shanghai, China), Analytical balance (Mettler-Toledo AG, Laboratory & Weighing Technologies, Greifensee, Switzerland), Rotary Evaporator (EYELA N-100, Tokyo Rika EYELA Co., Ltd., Tokyo, Japan), Low-Temperature High-Speed Centrifuge (HERAEUS FRESCO 17 Centrifuge, Waltham, MA, USA), Microplate reader (MULTISKAN MK3 model, Thermo Scientific, Waltham, MA, USA), Ultrasonic Bath (Model 4CQ50, Shanghai Ultrasonic Instrument Factory, Shanghai, China).
4.2. Reagents
Acetonitrile (MS grade, I0965929833, Merck, Darmstadt, Germany), methanol (mass spectrometry grade, I0931035804, Merck, Darmstadt, Germany), Water (Purified Water, Lot No.20210402C, Guangzhou Watsons Food & Beverage Co., Ltd., Guangzhou, China), Formic acid (MS grade, Lot No.Y9330090, CNW, Shanghai, China), Anti-SRBC antibodies (hemolysin) (in-house), Barbiturate buffer (5×, pH 7.4) (Beijing Leigen Biotechnology Co., Ltd., Beijing, China, Lot No.0314A17), Sterile sheep blood (SRB) (Lu Yaoying, Shanghai Reagent Supply Research Center, Shanghai, China), Heparin (Shanghai Aizite Biotechnology Co., Ltd., Shanghai, China, Lot No.090602).
4.3. Materials
Plant Material and Collection
From June to August 2019–2020, specimens of
Rhododendron nivale,
Rhododendron principis,
Rhododendron anthopogon,
Rhododendron mainlingense,
Rhododendron fragariiflorum,
Rhododendron lepidotum, and
Rhododendron vellereum were collected in south-central Tibet. The plants used in this study were identified by the team led by Professor Laqiong from the School of Ecology and Environment at Tibet University. Detailed information on the sample collection is shown in
Table S1 and Figure S1.
4.4. Experimental Methods
4.4.1. UPLC-Q-TOF-MS
Preparation of the Test Solution
Approximately 0.5 g of the test sample was accurately weighed, placed in a stoppered conical flask, and mixed with 20 mL of 80% methanol. The mixture was subjected to ultrasonic treatment for 30 min (300 W, 40 kHz), then cooled to room temperature. The lost weight was replenished with 80% methanol, and the solution was shaken well. After sampling, the mixture was centrifuged at 12,000 rpm for 5 min, and the supernatant was collected for analysis.
UPLC-MS Chromatographic Conditions
Chromatography column: Waters CORTECS@ UPLC
® C18 (2.1 × 100 mm, 1.6 μm); Column temperature: 30 °C; Sample volume: 2 µL; Detection wavelength: 254 nm; Mobile phase composition and flow rate: Phase A is a 0.1% aqueous formic acid solution; Phase B is acetonitrile. See
Table S2 for the gradient.
UPLC-MS Mass Spectrometry Conditions
Mass spectrometry detection mode: ESI-negative/positive ion mode. Mass spectrometry parameters: See
Table S3.
To ensure the reliability and reproducibility of the analytical data, QC samples were inserted into the sample sequence, and a total of 10 injections were performed. The relative standard deviation (RSD) was calculated based on the peak areas of all analytes in the QC samples to assess the instrument’s stability. Analytes with an RSD ≤ 30% were considered stable and reliable. Seven Rhododendron samples were analyzed using ultra-high-performance liquid chromatography coupled with quadrupole-time-of-flight mass spectrometry (UPLC-Q-TOF-MS). Compounds were tentatively identified based on the multi-stage mass spectrometry data of the samples, in conjunction with a high-resolution mass spectrometry database of natural products and relevant literature. Data acquisition was performed using Analyst TF 1.7.1, and data processing was conducted using PeakView 1.2. During identification, mass spectrometry data were first matched against the Natural Products HR-MS/MS Spectral Library 1.0 database. Compounds were preliminarily screened based on the score information of each chromatographic peak, and further confirmed using the first- and second-order information of each peak. After normalization, fingerprint spectra were generated using Origin 2021.
4.5. Determination of Anti-Complement Activity in Seven Rhododendron Alcohol Extracts
4.5.1. Sample Collection
The whole plants of the seven Rhododendron species were crushed. Approximately 100 g of each sample was weighed, then extracted with 95% ethanol under ultrasonic treatment for 1 h, followed by filtration. The residue was further extracted with purified water under reflux for 1 h, followed by filtration. The filtrates were concentrated and evaporated to dryness, and the obtained extracts were used for activity screening. The choice of 95% ethanol as the extraction solvent for the anti-complement activity assay was based on the following considerations: 95% ethanol enables a more comprehensive extraction of phenolic acids, flavonoids, triterpenes, and their glycosides from Rhododendron plants, which are potential anti-complement active substances; this solvent exhibited the best activity reproducibility and extraction efficiency in preliminary experiments; additionally, 95% ethanol is a widely used extraction solvent in natural product activity screening, facilitating cross-comparison with literature results.
4.5.2. Preparation of the Solution
Prepare the following solutions: 1× barbitol buffer solution (BBS); 2% sheep erythrocyte suspension; 1:1000 hemolysin; test solutions (seven types of
Rhododendron ethanol extracts); establishment of the classical complement hemolysis system: take complement (guinea pig serum), add 1× BBS, and dilute to prepare a solution, then determine the critical complement concentration [
32].
4.5.3. Classic Approach to Complement Inactivation Assay
Mix 0.2 mL of the critical complement concentration with 0.2 mL of the test sample, then add 0.1 mL of hemolysin and 0.1 mL of SRBC. Incubate in a 37 °C water bath for 30 min, then centrifuge in a low-temperature high-speed centrifuge at 5000 rpm and 4 °C. Transfer 0.2 mL of the supernatant from each tube to a 96-well plate and measure the absorbance at 405 nm using a microplate reader [
33].
4.5.4. Positive Control Complement Titer
In this experiment, heparin was selected as the positive control. Guinea pig serum was diluted with BBS to determine its complement titer.
4.5.5. Component Cluster Analysis
In this experiment, cluster analysis of the seven Rhododendron samples was performed using Origin 2021 software. The presence or absence (binary variables) of the 52 chemical constituents in the seven samples was used as the clustering basis. The hierarchical clustering method (Ward‘s linkage method) was applied with Euclidean distance as the distance measure.
4.6. Spectrum–Effect Relationship Analysis of the Ethanol Extracts from Seven Rhododendron Species
4.6.1. Data Preprocessing and Variable Screening
Based on the UPLC-Q-TOF-MS/MS raw data of the seven Rhododendron samples, a total of 8164 features (each tentatively identified by retention time RT and mass-to-charge ratio m/z) were obtained after processing with MS-DIAL software (ver.5.1.230912). After removing features with zero peak area in all samples, a feature matrix (7 samples × 8164 features) was generated. The anti-complement activity CH50 value (a smaller value indicates stronger activity) of the ethanol extract from each sample was used as the dependent variable Y.
Since the number of features far exceeded the number of samples, Spearman’s rank correlation coefficient was first used to perform a correlation analysis between each feature and CH50. The top 30 features (TOP_N = 30) with the highest absolute correlation coefficients were retained to reduce dimensionality. Subsequently, the Pearson correlation coefficients among the retained features were calculated, and variables with an absolute correlation coefficient greater than 0.95 (high collinearity) were removed. Finally, eight features (IDs: F5991, F2582, F8140, F6758, F5822, F5315, F5368, F2481) were obtained. Missing values were imputed with the median, and all features were Z-score standardized.
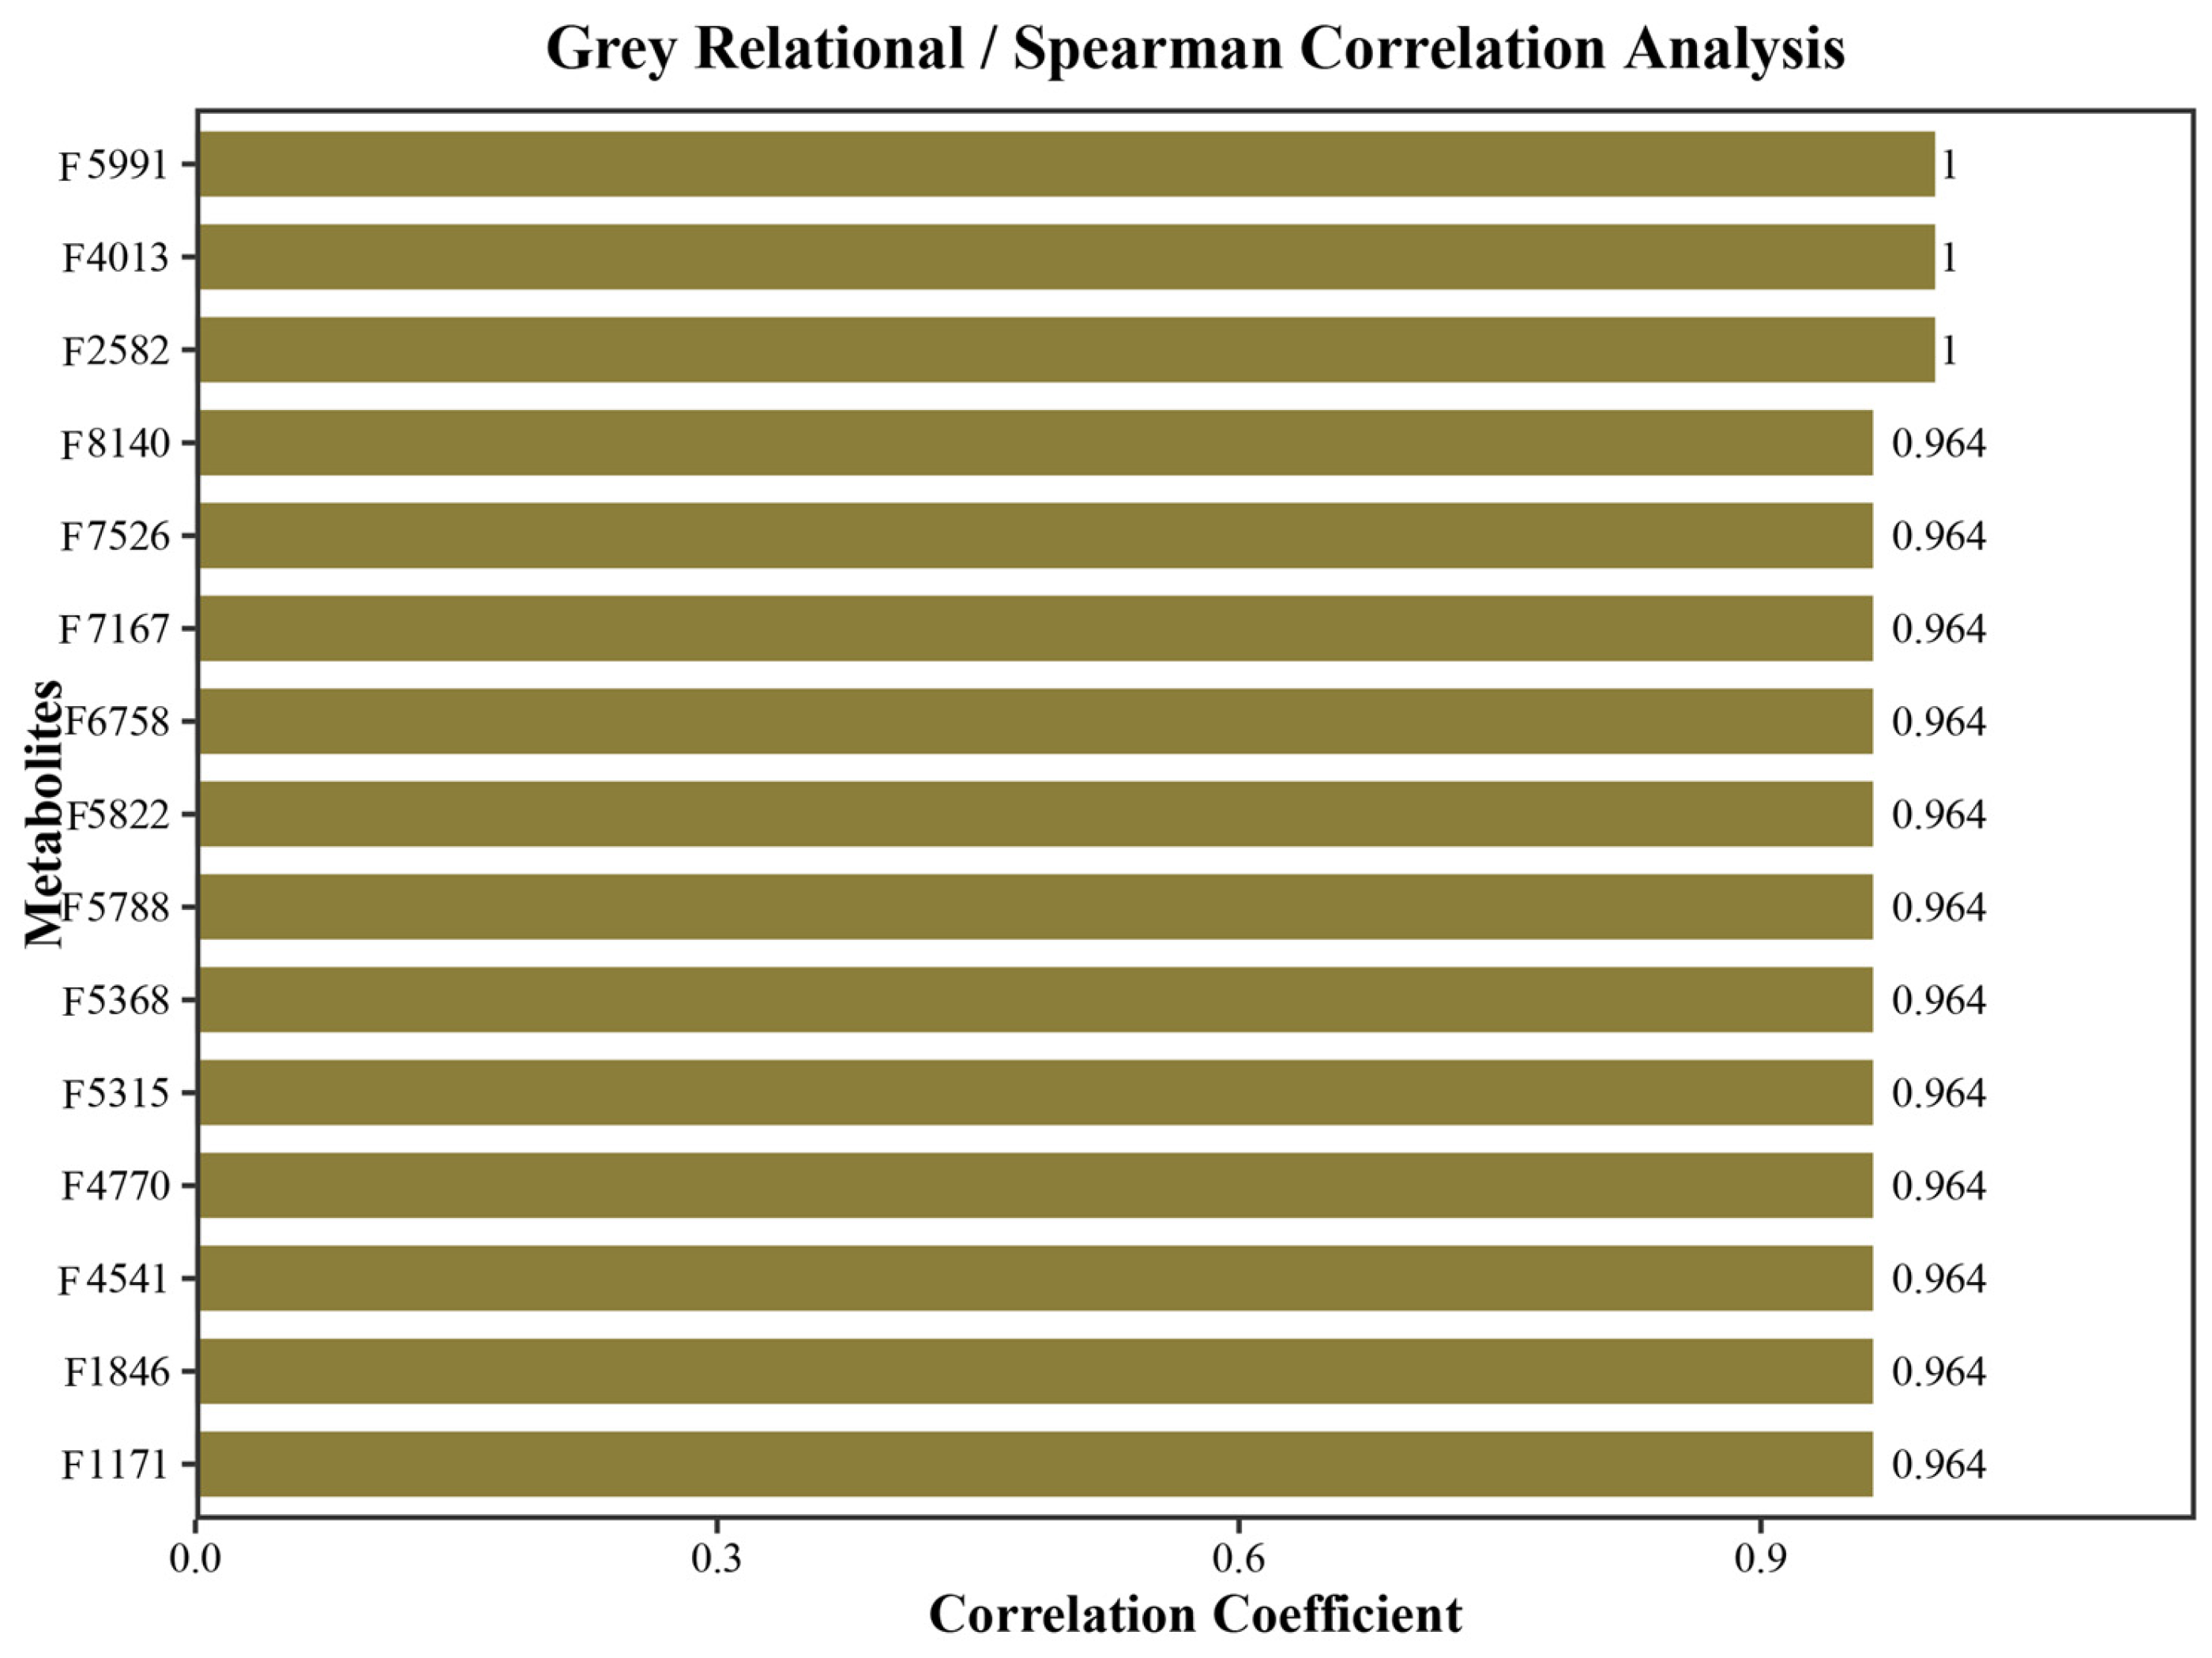
4.6.2. Grey Relational Analysis
Grey relational analysis (GRA) was employed to investigate the correlation between each characteristic peak and the anti-complement activity. Before analysis, the peak areas of the common peaks were standardized, and the resolution coefficient (ρ) was set to 0.5. The grey relational grade (GRG) was calculated using the following formula:
where the standardized peak areas of the common peaks served as the comparison sequences, and the CH
50 value of the ethanol extract from each sample served as the reference sequence. The calculations were performed using self-written code.
4.6.3. Partial Least Squares Regression and Bootstrap Stability Analysis
Partial least squares regression (PLS) was used to establish a quantitative model between the chemical components (X) and the anti-complement activity (Y). Given the very small sample size (n = 7), to avoid overfitting, the number of PLS components was fixed to 1. To evaluate the stability of the model parameters, 5000 bootstrap resampling iterations were performed (with replacement, each sampling including 7 samples). In each iteration, the PLS model was refitted, and the variable importance in projection (VIP) and the standardized regression coefficient for each feature were calculated. Finally, the mean and standard deviation (SD) of the VIP and regression coefficient for each feature were used to represent its point estimate and stability. The predictive ability of the model was evaluated by the Q2 value from a 2-fold cross-validation.
4.6.4. Screening Criteria for Quality Markers
A candidate quality marker had to simultaneously satisfy the following criteria: VIP_mean ≥ 1.0 (indicating a substantial contribution to the model); VIP_SD < 0.5 (indicating stable bootstrap results with low variation); and Coefficient_mean < 0 (since a smaller CH50 value corresponds to stronger activity, a negative coefficient indicates a positive correlation between content and activity). Features with a VIP_mean slightly below 1.0 but with a negative coefficient and good stability were also discussed as potential active component candidates.
5. Conclusions
In this study, UPLC-Q-TOF-MS/MS combined with PLS regression and bootstrap resampling was employed to preliminarily screen four characteristic peaks (F5315, F5822, F5368, and F5991) that were potentially associated with anti-complement activity. However, due to the limited sample size (n = 7), the predictive ability of the model (Q2 = 0.365) is suboptimal, and the screening results require further validation using an independent dataset with a larger sample size. In future studies, these candidate peaks will be subjected to targeted isolation and structural identification (e.g., preparative liquid chromatography, NMR, high-resolution mass spectrometry) to clarify their chemical identities, combined with in vitro activity assays to confirm their contribution to anti-complement activity. Such efforts would provide a more substantial scientific basis for elucidating the anti-complement active constituents and establishing quality markers for Rhododendron species. In addition, the present study is an untargeted metabolomics investigation. Although system stability was verified using QC samples, comprehensive method validation (including linearity, LOD, LOQ, and spike recovery) has not been fully performed. Targeted quantitative analyses should be carried out in the future to validate the key compounds.
In summary, this study represents a preliminary attempt to distinguish interspecific differences among Tibetan medicinal Rhododendron species using chemical fingerprinting combined with chemometric analysis, and to tentatively identify the metabolites of each species. By comparing with literature reports on known bioactive compounds, the medicinal potential of the seven Rhododendron species was preliminarily evaluated. Through correlation analysis with anti-complement activity, Rhododendron vellereum was highlighted as a promising resource with superior anti-complement activity. These findings provide a scientific basis and potential strategies for the botanical identification, quality evaluation, and innovative drug development of Tibetan medicinal Rhododendron plants. It should be noted that the extraction solvent used in this study was 95% ethanol, whereas traditional Tibetan medicine uses water decoctions. Therefore, the ethanol extract results may not fully reflect the actual pharmacologically active components. As all sample materials were consumed in the preliminary experiments, it was not possible to include water extract analyses in the current study. In future research, the sampling scope should be expanded, water extracts should be included for comparison, and the active components should be further verified through spectrum–effect relationship analysis.