Article

Low-Temperature Methane Catalytic Combustion on a New Pt-Based Catalyst Confined in a MnO2/Al2O3 Carrier

1
Intelligent Engineering College, Chongqing Electric Power College, Chongqing 400030, China
2
Sichuan Provincial for Rare Earth & Vanadium-Titanium Based Functional Materials, Sichuan University, No. 24 South Section 1, Yihuan Road, Chengdu 610065, China
3
Key Laboratory of Advanced Special Materials & Technology, Ministry of Education, Chengdu 610065, China
4
School of Materials Science & Engineering, Sichuan University, Chengdu 610065, China
*
Authors to whom correspondence should be addressed.
Molecules 2026, 31(11), 1942; https://doi.org/10.3390/molecules31111942
Submission received: 29 April 2026 / Revised: 21 May 2026 / Accepted: 25 May 2026 / Published: 3 June 2026

Abstract

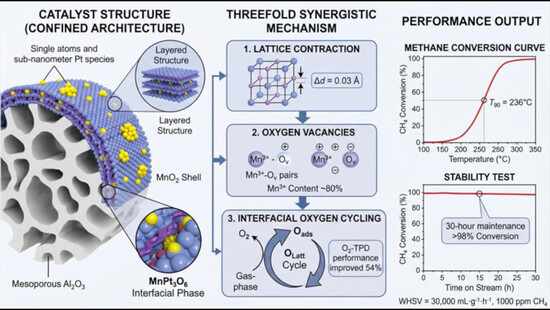
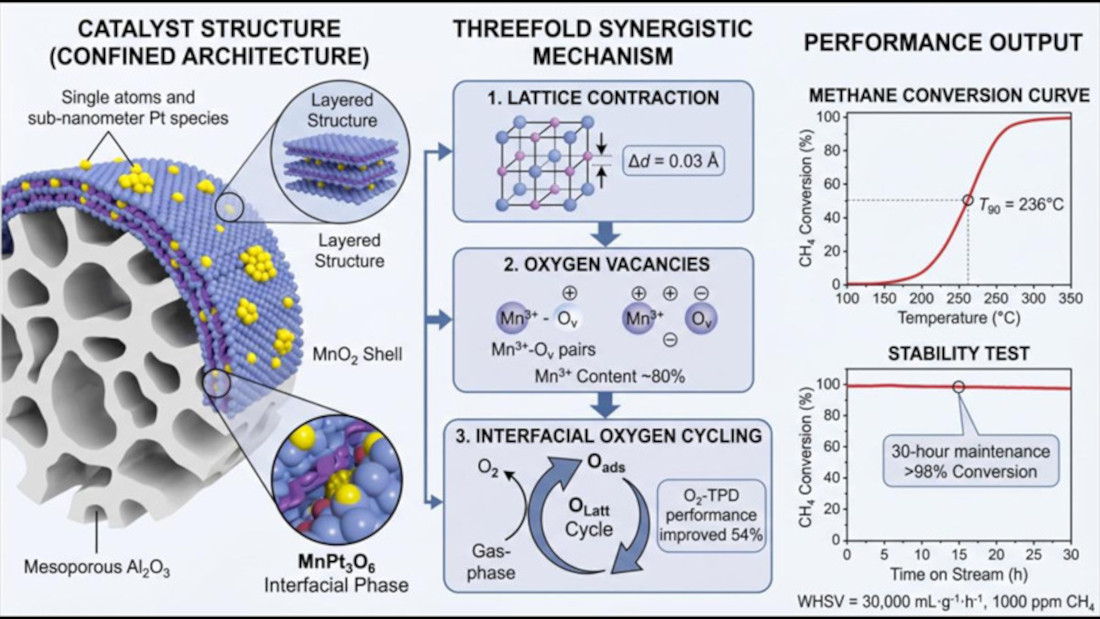
In this study, a hierarchically confined Pt/MnO2–meso-Al2O3 catalyst with 0.5 wt% Pt loading was synthesized via a precipitation method using MnO2 as a promoter and mesoporous Al2O3 (m-Al2O3) as a support, and its methane catalytic combustion performance and structure–activity relationship were systematically investigated. The results demonstrate that the 0.5 wt% Pt-loaded Pt-MnO2/m-Al2O3 catalyst achieved 90% methane conversion at 236 °C. The enhanced performance is attributed to three synergistic mechanisms: (1) Pt doping induced lattice contraction in MnO2 (XRD revealed a 0.03 Å reduction in the (001) interplanar spacing), which facilitated the formation of Mn3+–oxygen vacancy pairs (XPS indicated a Mn3+- content of 79.87%); (2) the MnPt3O6 interfacial structure (HAADF-STEM confirmed lattice spacings of 0.21 nm) accelerated oxygen species cycling, with the 0.5 wt% Pt-loaded catalyst for lattice oxygen desorption capacity (O2-TPD) increasing by 54% compared to undoped samples; (3) the mesoporous m-Al2O3 carrier provided effective confinement, achieving a high specific surface area (27.6 m2/g) and sub-nanometer Pt dispersion (particle size < 2 nm). Under conditions of 1000 ppm CH4 and a space velocity of 30,000 h−1, the catalyst maintained a methane conversion rate of 98.2 ± 0.5% during continuous operation for 300 h. Post-cycling characterization revealed a stable crystalline structure (XRD full width at half maximum of 0.35° ± 0.02°) and grain size (15.5 ± 0.5 nm), confirming its robustness for industrial applications. This study provides theoretical and experimental foundations for the rational design of highly efficient catalysts for low-concentration methane elimination. For comparison, a Co-doped catalyst (1.0 wt% Co–MnO2/Al2O3) was also prepared, which exhibited significantly lower activity (T90 = 251 °C), underscoring the unique role of Pt in the confined architecture. This study provides theoretical and experimental foundations for the rational design of highly efficient catalysts for low-concentration methane elimination.

Graphical Abstract

1. Introduction

Methane catalytic combustion has emerged as a pivotal technology for mitigating anthropogenic emissions of methane—a potent greenhouse gas with 84-fold higher global warming potential than CO2 over 20 years [1]. This process enables efficient elimination of low-concentration methane (<10%) from natural gas systems, coal mines, and landfills, simultaneously recovering energy [2]. Despite its promise, industrial implementation faces fundamental challenges rooted in methane’s high C–H bond energy (434 kJ/mol) and sluggish kinetics under mild conditions [3].
Conventional Pt/Al2O3 catalysts exhibit superior activity but suffer from irreversible deactivation via sintering (>500 °C) and hydrothermal poisoning [4]. Recent studies reveal that Pt nanoparticle coalescence accelerates under cyclic redox conditions, with >50% activity loss within 100 h [5]. While core-shell architectures (e.g., Pt@SiO2) enhance thermal stability, they inevitably sacrifice active site accessibility. For instance, Lei et al. [6] demonstrated that 2D-confined Pt catalysts maintained 90% dispersion after aging at 800 °C but showed 40% lower TOF than unconfined counterparts due to diffusion limitations. Similarly, Xu’s Pt@MnO2 core-shell design [7] achieved 300 h stability at 500 °C, but required a temperature higher than 300 °C to reach 90% methane conversion (T90 > 300 °C), constrained by thick MnO2 shells (>5 nm) that impede oxygen mobility. (Note: T90 is commonly used as a benchmark in catalytic combustion to avoid mass-transfer limitations near equilibrium; it reliably reflects intrinsic activity.)
To reconcile activity–stability trade-offs, multifunctional interfaces have gained traction. Zhang et al. [8] pioneered MnO2-coated Pt catalysts where oxygen vacancy (Ov)-rich MnO2 layers facilitated lattice oxygen (Olatt) cycling, lowering T90 to 280 °C. However, Ov regeneration kinetics remained suboptimal (0.05 s−1), limiting long-term performance. Subsequent studies identified interfacial electronic effects as critical levers: Qin’s atomically dispersed Pt/MnO2 [9] achieved 210 °C T90 via Pt–O–Mn charge transfer, while Wu’s operando spectroscopy [10] revealed that Mn3+–Ov–Pt interfaces accelerated Olatt migration rates by 3-fold higher compared to isolated sites.
Building on these insights, we propose a hierarchical confinement strategy leveraging synergistic Pt–MnO2–Al2O3 interactions. Unlike conventional coatings, our design engineers three-tier functionality (Figure 1):
(1)
Mesoporous Al2O3 (m-Al2O3) provides mechanical stabilization and sub-nanometer Pt confinement (<2 nm), suppressing coalescence while maximizing dispersion [11];
(2)
MnO2 tunnels enable lattice oxygen buffering via reversible Mn4+/Mn3+ transitions, enhancing Ov regeneration [12];
(3)
Pt–Mn3O6 interfaces (predicted by DFT to lower O2 dissociation barriers by 0.8 eV [13]) facilitate oxygen spillover to adjacent C–H activation sites.
This architecture uniquely addresses two frontier challenges: (i) balancing metal dispersion against sintering resistance—a limitation in recent MOF-derived catalysts [14]; and (ii) accelerating Olatt replenishment kinetics beyond state-of-the-art doped ceria [15]. Preliminary work by Luo [16] on cryo-EM-validated oxygen pathways further confirms interfacial oxygen mobility as rate-determining for hydrocarbon oxidation.
Herein, we synthesize hierarchically confined Pt-MnO2/Al2O3 via precipitation and systematically investigate methane combustion performance. For comparison, a Co-doped MnO2/Al2O3 catalyst (1.0 wt% Co) was also synthesized and evaluated under identical conditions to verify the essential role of Pt in the proposed hierarchical confinement strategy. Through advanced characterization (HAADF-STEM, O2-TPD, in situ Raman) and kinetic analysis, we establish how MnO2 lattice contraction (△d = 0.03 Å), Pt-induced Ov formation (Mn3+ content: 79.87%), and MnPt3O6 interfaces synergistically enhance low-temperature activity (T90 = 236 °C) and 30 h stability (98.2% conversion).

2. Experimental Section

2.1. Catalyst Preparation

A dual-active-site Pt-based catalyst (M1–MnO2/Al2O3) was synthesized via a precipitation method using Al2O3 as the primary support. M1 represents the doped transition metal (Pt or Co), and M1Ox represents the composite oxide interface formed by the doped metal and MnO2. The synthesis involved four sequential steps: (1) Al2O3 support preparation, (2) MnO2 synthesis, (3) co-precipitation and calcination of MnO2/Al2O3 composites, and (4) noble metal loading.
(1)
Synthesis of Al2O3 Support
A total of 5.0 g of Al2(SO4)3 was dissolved in 100 mL of deionized water under magnetic stirring for 0.5 h. The solution was transferred into a 500 mL Teflon-lined autoclave and subjected to hydrothermal treatment at 140 °C for 12 h. The resulting precipitate was cooled, filtered, washed with ethanol, and dried at 80 °C for 6 h. Finally, the product was calcined at 400 °C for 4 h in air to obtain the mesoporous Al2O3 support.
(2)
Preparation of Active Metal Precursor Solutions
MnO2 Synthesis: Amounts of 4.0 g of MnSO4·H2O and 8.0 g of KMnO4 were separately dissolved in 150 mL of deionized water. The MnSO4 solution was gradually added to the KMnO4 solution under vigorous stirring, followed by continuous agitation at room temperature for 0.5 h. The mixture was hydrothermally treated at 140 °C for 12 h. The product was filtered, washed with ethanol, dried at 80 °C for 6 h, and calcined at 400 °C for 4 h to obtain MnO2. The composition and sample codes of M1-MnO2/Al2O3 catalysts synthesized with noble metal precursors are shown in Table 1.
M1 Metal Precursors: Metal salt solutions (0.5~1 mol/L), such as H2PtCl6 for Pt and Co(NO3)2 for Co, were prepared in deionized water.
Surfactant Addition: A template with a nanoparticle size of approximately 5 nm—NP-5 surfactant (a nonionic triblock copolymer, Pluronic P123, Sigma-Aldrich, Saint Louis, MO, USA)—was added at 1 vol% relative to the metal solution to enhance metal dispersion.
(3)
Co-Precipitation and Calcination of MnO2/Al2O3 Composites
The as-synthesized MnO2 and Al2O3 supports were mixed in a 10:1 Mn/Al molar ratio. The mixture was ultrasonically dispersed in 100 mL deionized water for 30 min, followed by dropwise addition of the M1 metal precursor solution (Pt or Co) under stirring. After 2 h of aging, the precipitates (MnO2/Al2O3 composites with adsorbed metal precursors) were repeatedly washed with deionized water until a neutral pH was achieved to remove residual reactants. The washed solids were dried at 80 °C for 12 h to obtain the catalyst precursor. Subsequent calcination was performed in air at 400 °C for 4 h with a heating rate of 2 °C/min to eliminate surfactant residues and oxidize metallic species, forming the active Pt-M1 centers.
(4)
Noble Metal Loading
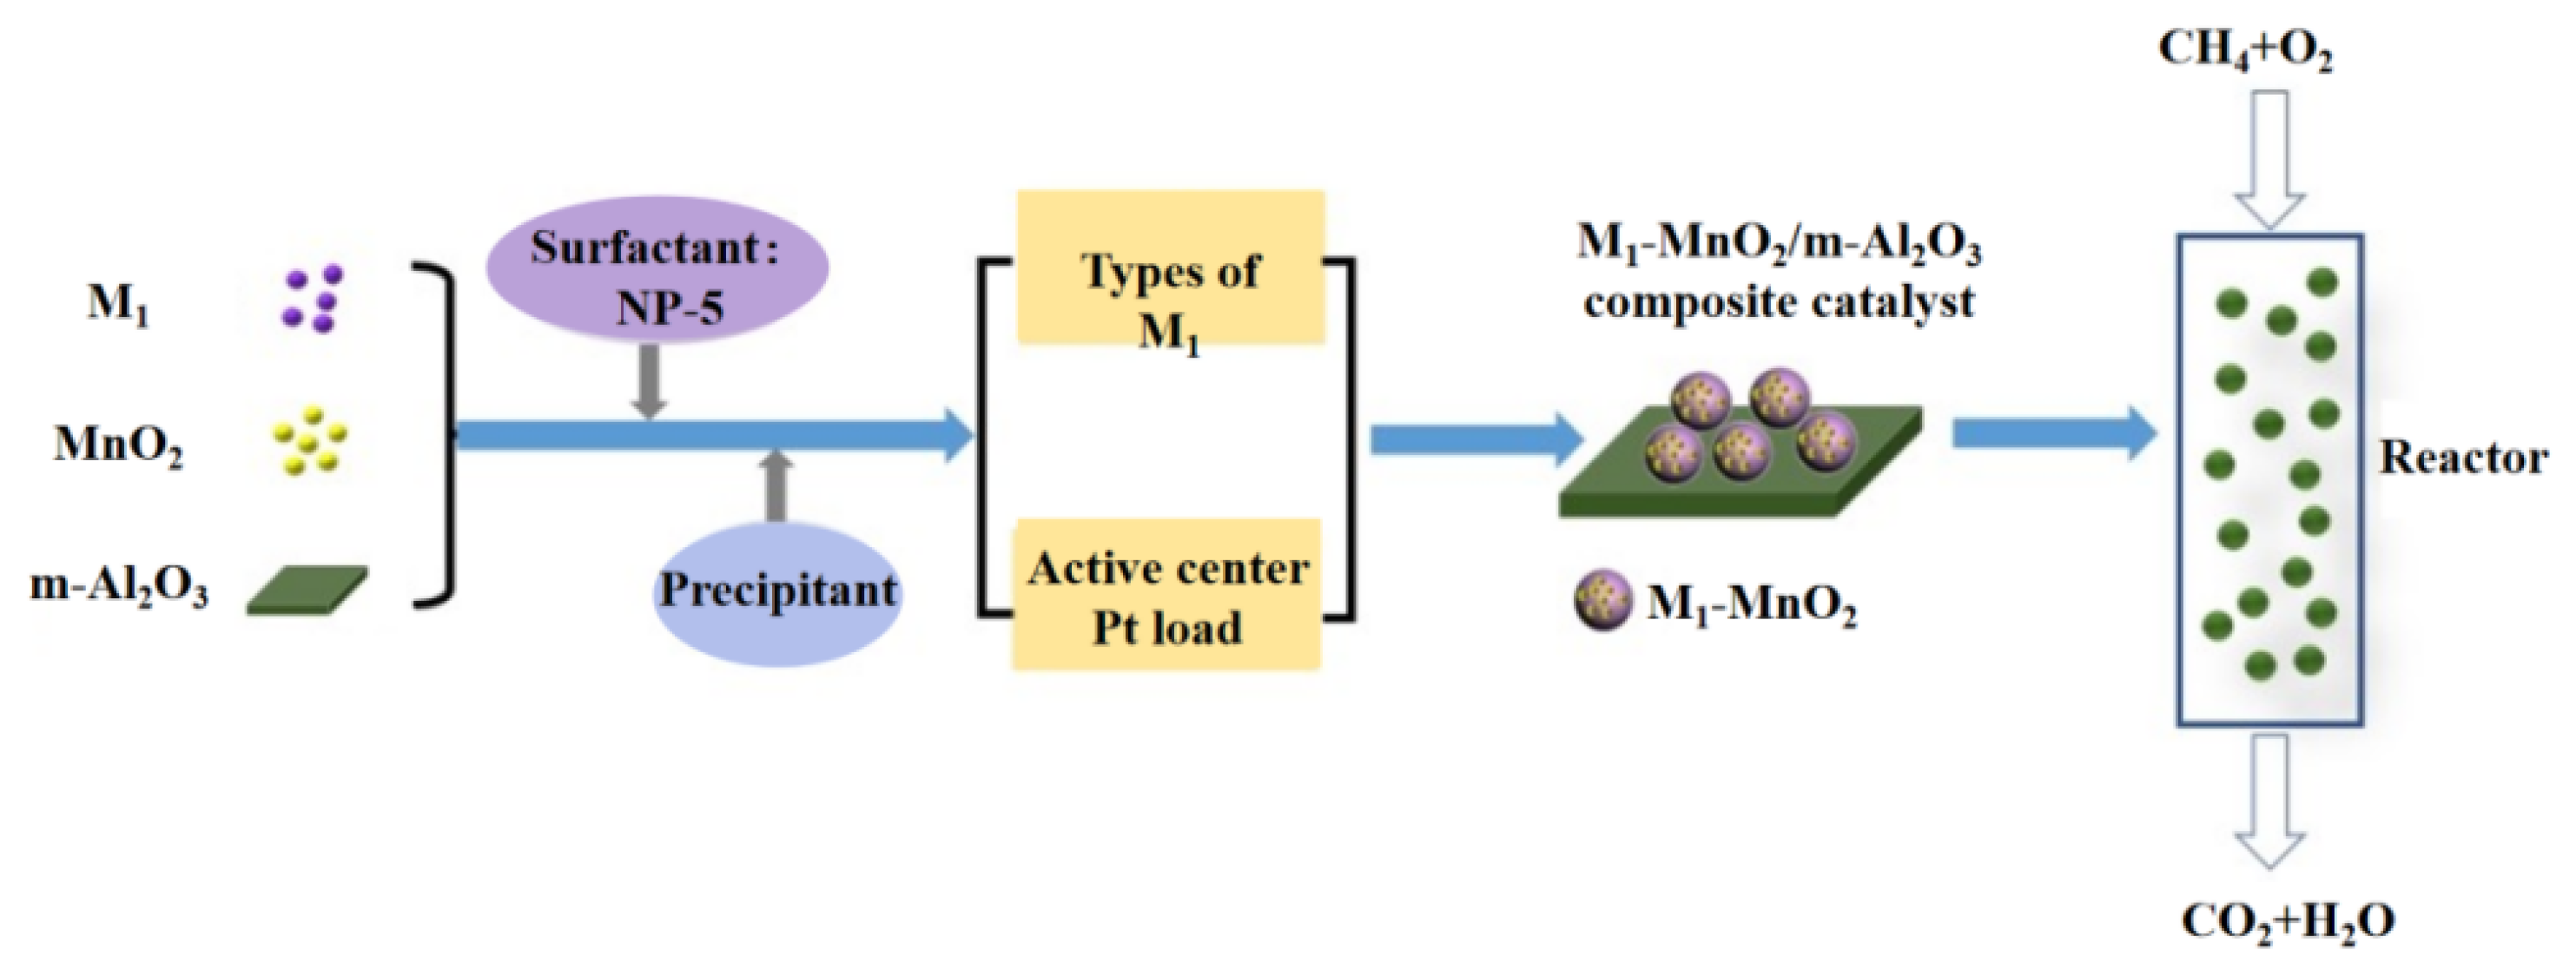
The calcined MnO2/Al2O3 composites (1.0 g) were ultrasonically dispersed in 100 mL of deionized water. The noble metal precursor solution (H2PtCl6 or Co(NO3)2) was added under stirring, and the mixture was heated to 80 °C. A 1.2% H2O2 aqueous solution (50 mL) was added dropwise to facilitate metal reduction. The final product was cooled, filtered, washed with ethanol, dried at 80 °C for 6 h, and calcined at 600 °C for 2 h in air to yield the dual-active-site Pt-based catalyst. For comparison, a Co-doped MnO2/Al2O3 catalyst with 1.0 wt% Co loading was prepared using the same procedure, except that Co(NO3)2 solution was used instead of H2PtCl6. The synthesis process is illustrated in Figure 1.

2.2. Catalyst Characterization

Unless otherwise specified, all catalysts were characterized in their as-calcined form (fresh) without any additional reduction or activation pretreatment. For H2-TPR and O2-TPD, the samples were pretreated in Ar flow at 300 °C for 1 h to remove surface adsorbates, which mimics the pretreatment used in catalytic activity tests (Section 2.3). The physicochemical properties of the catalysts were systematically characterized using the following techniques. X-ray diffraction (XRD) analysis was performed on a Bruker D8 Advance diffractometer (Bruker Corporation, Billerica, MA, USA) with Cu-Kα radiation (λ = 1.5406 Å) operating at 40 kV and 40 mA. Scans were collected in the 2θ range of 5–80° at a step size of 0.02°. Transmission electron microscopy (TEM) and high-angle annular dark-field scanning TEM (HAADF-STEM) were conducted on a JEOL JEM-2100F microscope (JEOL Ltd., Tokyo, Japan) at 200 kV acceleration voltage. Samples were ultrasonically dispersed in ethanol and drop-casted onto carbon-coated copper grids. X-ray photoelectron spectroscopy (XPS) measurements were carried out on a Thermo Scientific ESCALAB Xi+ spectrometer (Thermo Fisher Scientific, Waltham, MA, USA) using Al-Kα radiation (1486.6 eV), with binding energies calibrated against the C 1s peak (284.8 eV). H2 temperature-programmed reduction (H2-TPR) and O2 temperature-programmed desorption (O2-TPD) were performed on a Micromeritics AutoChem II 2920 system (Micromeritics Instrument Corp., Norcross, GA, USA). For H2-TPR, 50 mg of catalyst was pretreated in Ar at 300 °C for 1 h, then cooled to 50 °C, and heated to 800 °C at 10 °C/min under 10% H2/Ar (30 mL/min). O2-TPD involved pre-adsorption of O2 at 200 °C for 1 h followed by desorption up to 800 °C (10 °C/min) in He flow. N2 physisorption isotherms were acquired at −196 °C on a Micromeritics ASAP 2460 analyzer (Micromeritics Instrument Corp., Norcross, GA, USA), with specific surface areas calculated via the BET method and pore size distributions derived from the BJH model. Raman spectra were recorded on a Renishaw InVia Reflex spectrometer (Renishaw plc, Wotton-under-Edge, Gloucestershire, UK) using a 532 nm laser (5 mW power, 10 s integration). Scanning electron microscopy (SEM) was conducted on a Hitachi SU8010 microscope (Hitachi Ltd., Tokyo, Japan) at 5 kV, with samples sputter-coated with Pt prior to imaging. The actual Pt and Co loadings were determined by inductively coupled plasma optical emission spectrometry (ICP-OES) on a PerkinElmer Optima 8300 instrument (PerkinElmer Inc., Waltham, MA, USA). Prior to analysis, the catalyst samples (ca. 20 mg) were digested in a mixture of aqua regia (3 mL HCl + 1 mL HNO3) at 120 °C for 2 h, then diluted to 50 mL with deionized water. The measurement uncertainty was within ±5%.
Oxygen vacancy regeneration kinetics were quantified through isothermal O2-TPD experiments coupled with in situ Raman spectroscopy, following the methodology described in [17]. Ov regeneration rate was quantified through in situ Raman spectroscopy as outlined in [16].

2.3. Catalytic Performance Evaluation

Methane catalytic combustion activity was evaluated in a fixed-bed reactor. The reactor consisted of a quartz glass tube (inner diameter: 6 mm, length: 300 mm) to minimize catalytic interference from metal walls. A 100 mg catalyst sample (particle size: 40–60 mesh) was placed on a quartz wool bed positioned at the center of a tubular furnace. A K-type thermocouple was inserted directly above the catalyst bed to monitor the reaction temperature. The reactant gas mixture (1000 ppm CH4, 20% O2, balanced with N2) was introduced at a total flow rate of 50 mL/min, corresponding to a space velocity of 30,000 mL·g−1·h−1. Prior to testing, the catalyst was pretreated in air at 300 °C for 1 h to remove surface contaminants and ensure a consistent initial state. After pretreatment, the reactor was cooled to 150 °C and held for ≥1 h to establish dynamic adsorption equilibrium. The effluent gases were analyzed online using a gas chromatograph (SP-6890, Ruihong Chromatographic Analysis Co., Ltd., Beijing, China) equipped with a flame ionization detector (FID). Steady-state conversion data were recorded after at least 30 min of stable operation, and each measurement was repeated three times to calculate the average and standard deviation.
The reported methane conversion values are the average of three independent measurements under identical conditions. The error bars represent the standard deviation (SD) calculated as
S D = 1 n 1 i = 1 n x i x ¯ 2
where xi is the individual measurement and x ¯ is the mean value (n = 3). The overall experimental error (±0.5%±0.5%) includes contributions from gas chromatography (GC) calibration (±0.3%±0.3%) and mass flow controller accuracy (±0.2%±0.2%), as estimated from repeated calibration runs [17].
The reaction temperature was increased stepwise from 150 °C to 500 °C at a ramp rate of 2 °C/min. At each target temperature, the catalyst was held for 30 min to reach a steady state, and the methane conversion was recorded as the average of three consecutive GC measurements. In the light-off region (typically between 200 °C and 300 °C), measurements were taken at intervals of 10 °C. The temperatures for 50% and 90% methane conversion (T50 and T90) were determined by linear interpolation between the two nearest experimental data points. The interpolation uncertainty was estimated to be ≤±2 °C based on the reproducibility of replicate experiments.

3. Results and Discussion

3.1. Phase and Structural Analysis

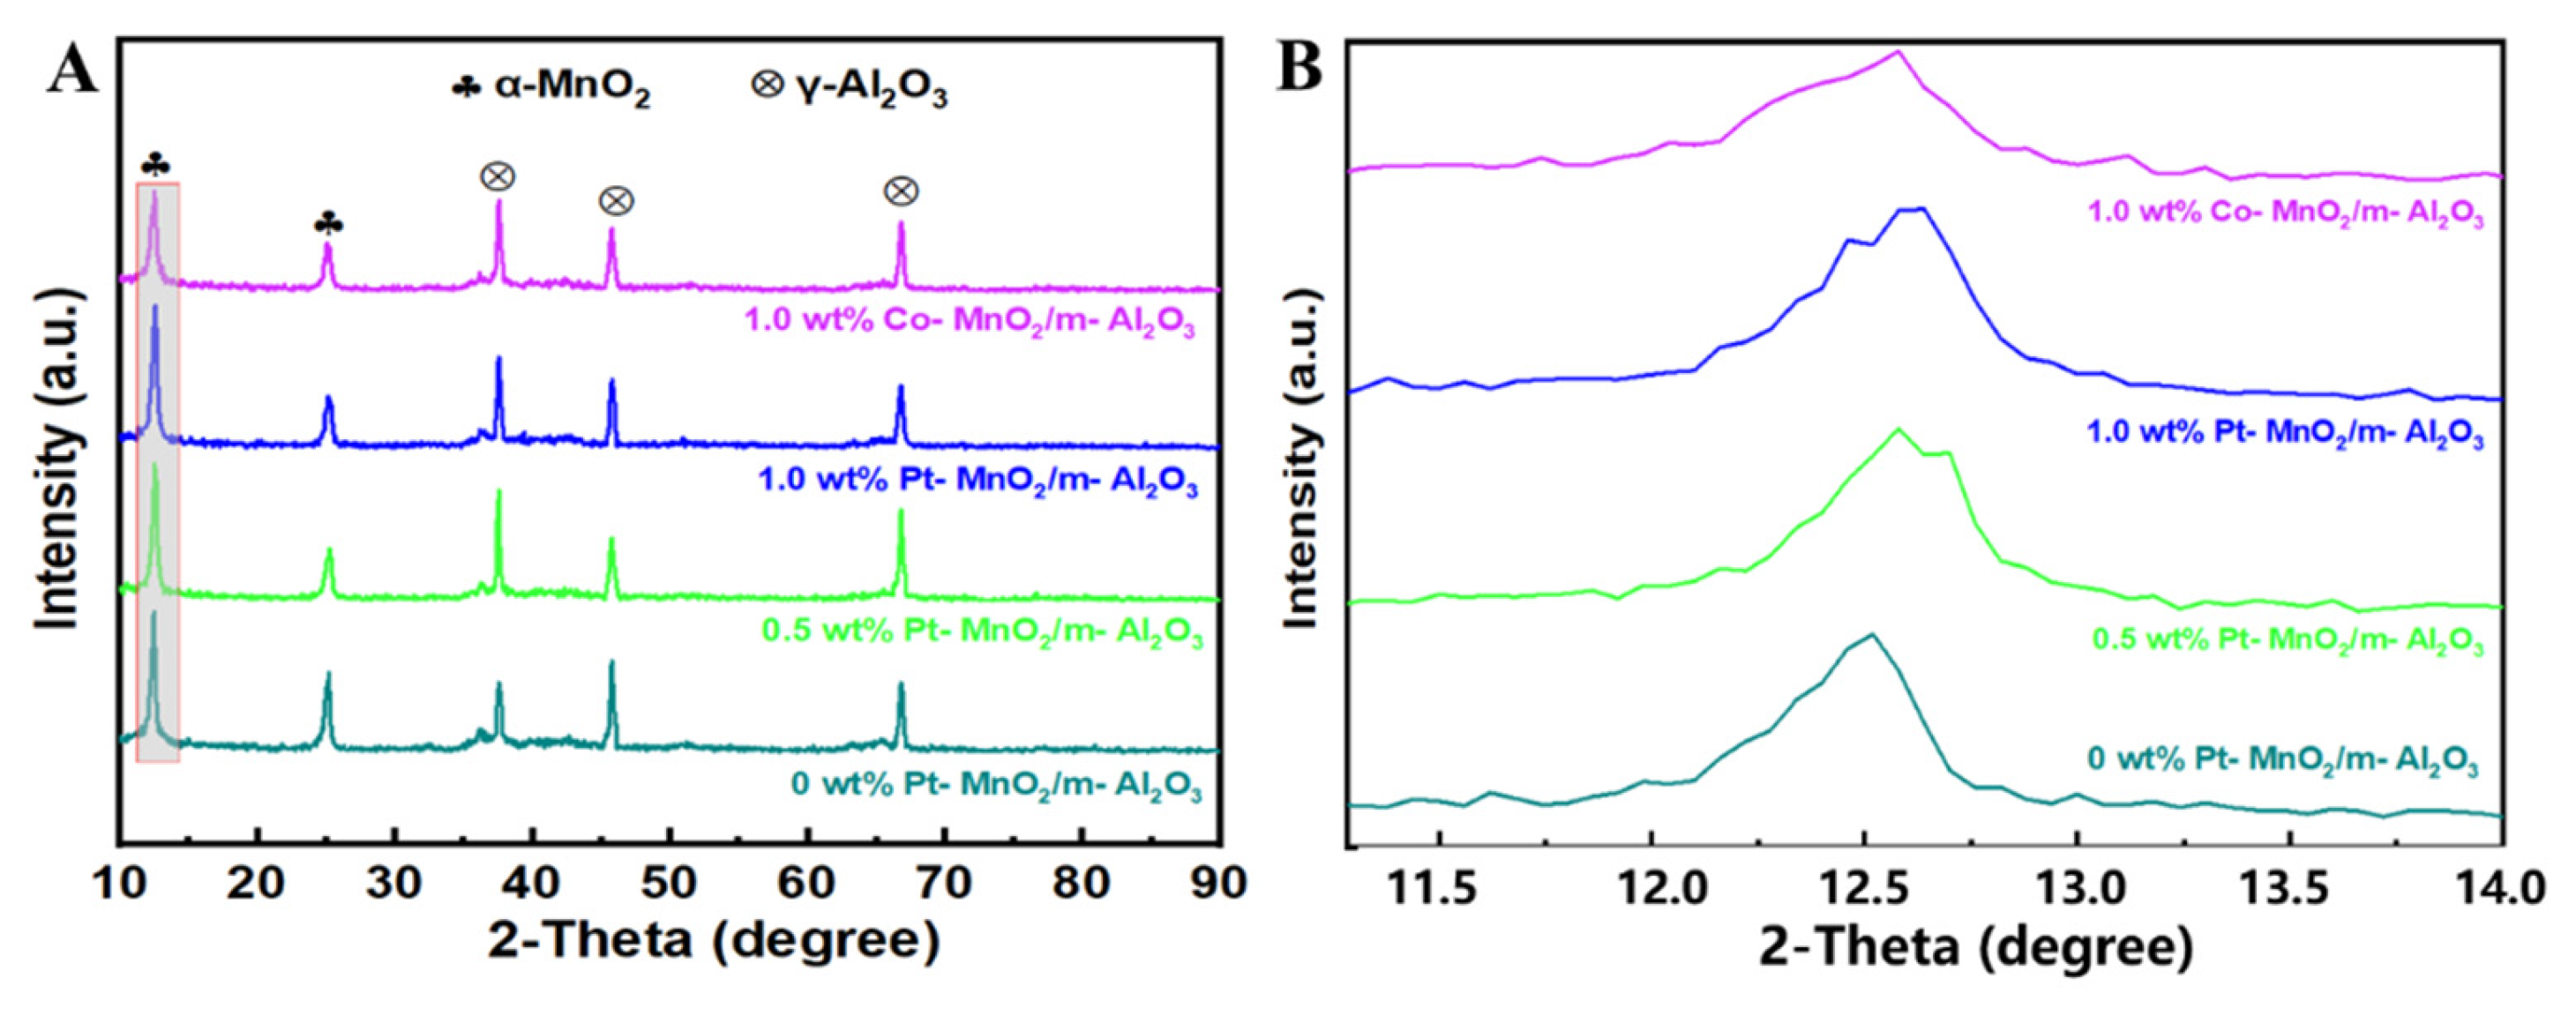
As revealed by the XRD patterns in Figure 2A, all samples exhibit characteristic diffraction peaks of birnessite-type MnO2 (PDF 80-1098) at 2θ = 12.5°, 25.2°, 35.4°, 39.6°, and 65.6°, corresponding to the (001), (002), (200), (111), and (020) planes, respectively. In addition, a weak peak at 2θ ≈ 45.8° is assigned to γ-Al2O3 (PDF 10-0425), originating from the mesoporous support. No additional peaks corresponding to phase transformations of Al2O3 are observed upon metal doping, confirming the structural integrity of the support. This confirms that the layered tunnel structure of MnO2 remains the dominant phase, and the γ-Al2O3 support (e.g., peak at 2θ ≈ 45.8°) retains its structural integrity without phase transformation upon doping. The absence of Pt- or Co-related peaks (e.g., Pt (111) at 2θ ≈ 39.8°) indicates that noble metals are homogeneously dispersed at sub-nanometer scales either on the support surface or within the MnO2 lattice [11,18]. The absence of Pt-related diffraction peaks (e.g., Pt(111) at 2θ ≈ 39.8°) in all Pt-doped crystallite sizes of samples is attributed to two factors: (i) the low Pt loading (0.5–1.0 wt%), and (ii) the sub-nanometer dispersion of Pt species.
Notably, for Pt-doped samples (0.5–1.0 wt%), the (001) diffraction peak shifts toward higher angles (Δ2θ ≈ 0.2°) compared to the undoped sample (2θ = 12.3°). Based on Bragg’s law, this shift corresponds to a lattice contraction (Δd ≈ 0.03 Å), attributed to partial substitution of Mn4+ (ionic radius: 0.53 Å) by Pt2+/Pt4+ (0.80 Å for Pt2+), suggesting the formation of a Pt-MnO2 solid solution [12,19]. In contrast, the 1.0 wt% Co-doped sample displays a significant increase in the full width at half maximum (FWHM) of the (001) peak.
Williamson–Hall analysis of all catalysts reveals distinct structural modifications, as shown in Table 2. Undoped MnO2/Al2O3 exhibits relatively large crystallites (~15.9 nm) with low microstrain (0.12%), consistent with its unmodified lattice. Pt doping (0.5 wt% and 1 wt%) progressively reduces crystallite size to ~15.5 nm and ~12.7 nm, respectively, while maintaining low microstrain (0.15–0.18%). This suggests Pt incorporation primarily induces a solid solution effect without significant lattice distortion, as the Pt4+ ionic radius (0.63 Å) closely matches Mn4+ (0.53 Å).
In contrast, the Co-doped catalyst shows markedly reduced crystallite size (~9.2 nm) and elevated microstrain (0.35%). The larger lattice distortion arises from the aliovalent substitution of Mn4+ (0.53 Å) by smaller Co3+ (0.61 Å) and Co2+ (0.65 Å), corroborating prior reports on lattice destabilization by aliovalent dopants. These results demonstrate that Pt and Co modulate the MnO2 structure via distinct pathways (solid solution vs. lattice distortion), despite preserving the primary δ-MnO2 phase composition.
After calcination, the catalyst mass (Wcatalyst) was measured. The precursor mass (Wprecursor) refers to the total mass of all starting materials, including metal salts (e.g., Al2(SO4)3, MnSO4·H2O, KMnO4, H2PtCl6) and support components. The yield of the supported phase was calculated as Y i e l d = W M n O 2 + P t / C o / W M n 2 + + P t / C o n +   P r e c u r s o r × 100 % . The yield was calculated as the mass ratio of the active components (MnO2 and Pt/Co) in the final catalyst to the total mass of Mn and Pt/Co metals in the precursors. Throughout the following discussion, the sample with 0 wt% Pt (denoted as bare MnO2/Al2O3 support) serves as the metal-free reference to isolate the intrinsic properties of the MnO2–Al2O3 carrier from the effects induced by Pt or Co incorporation.

3.2. Raman Analysis of Catalysts

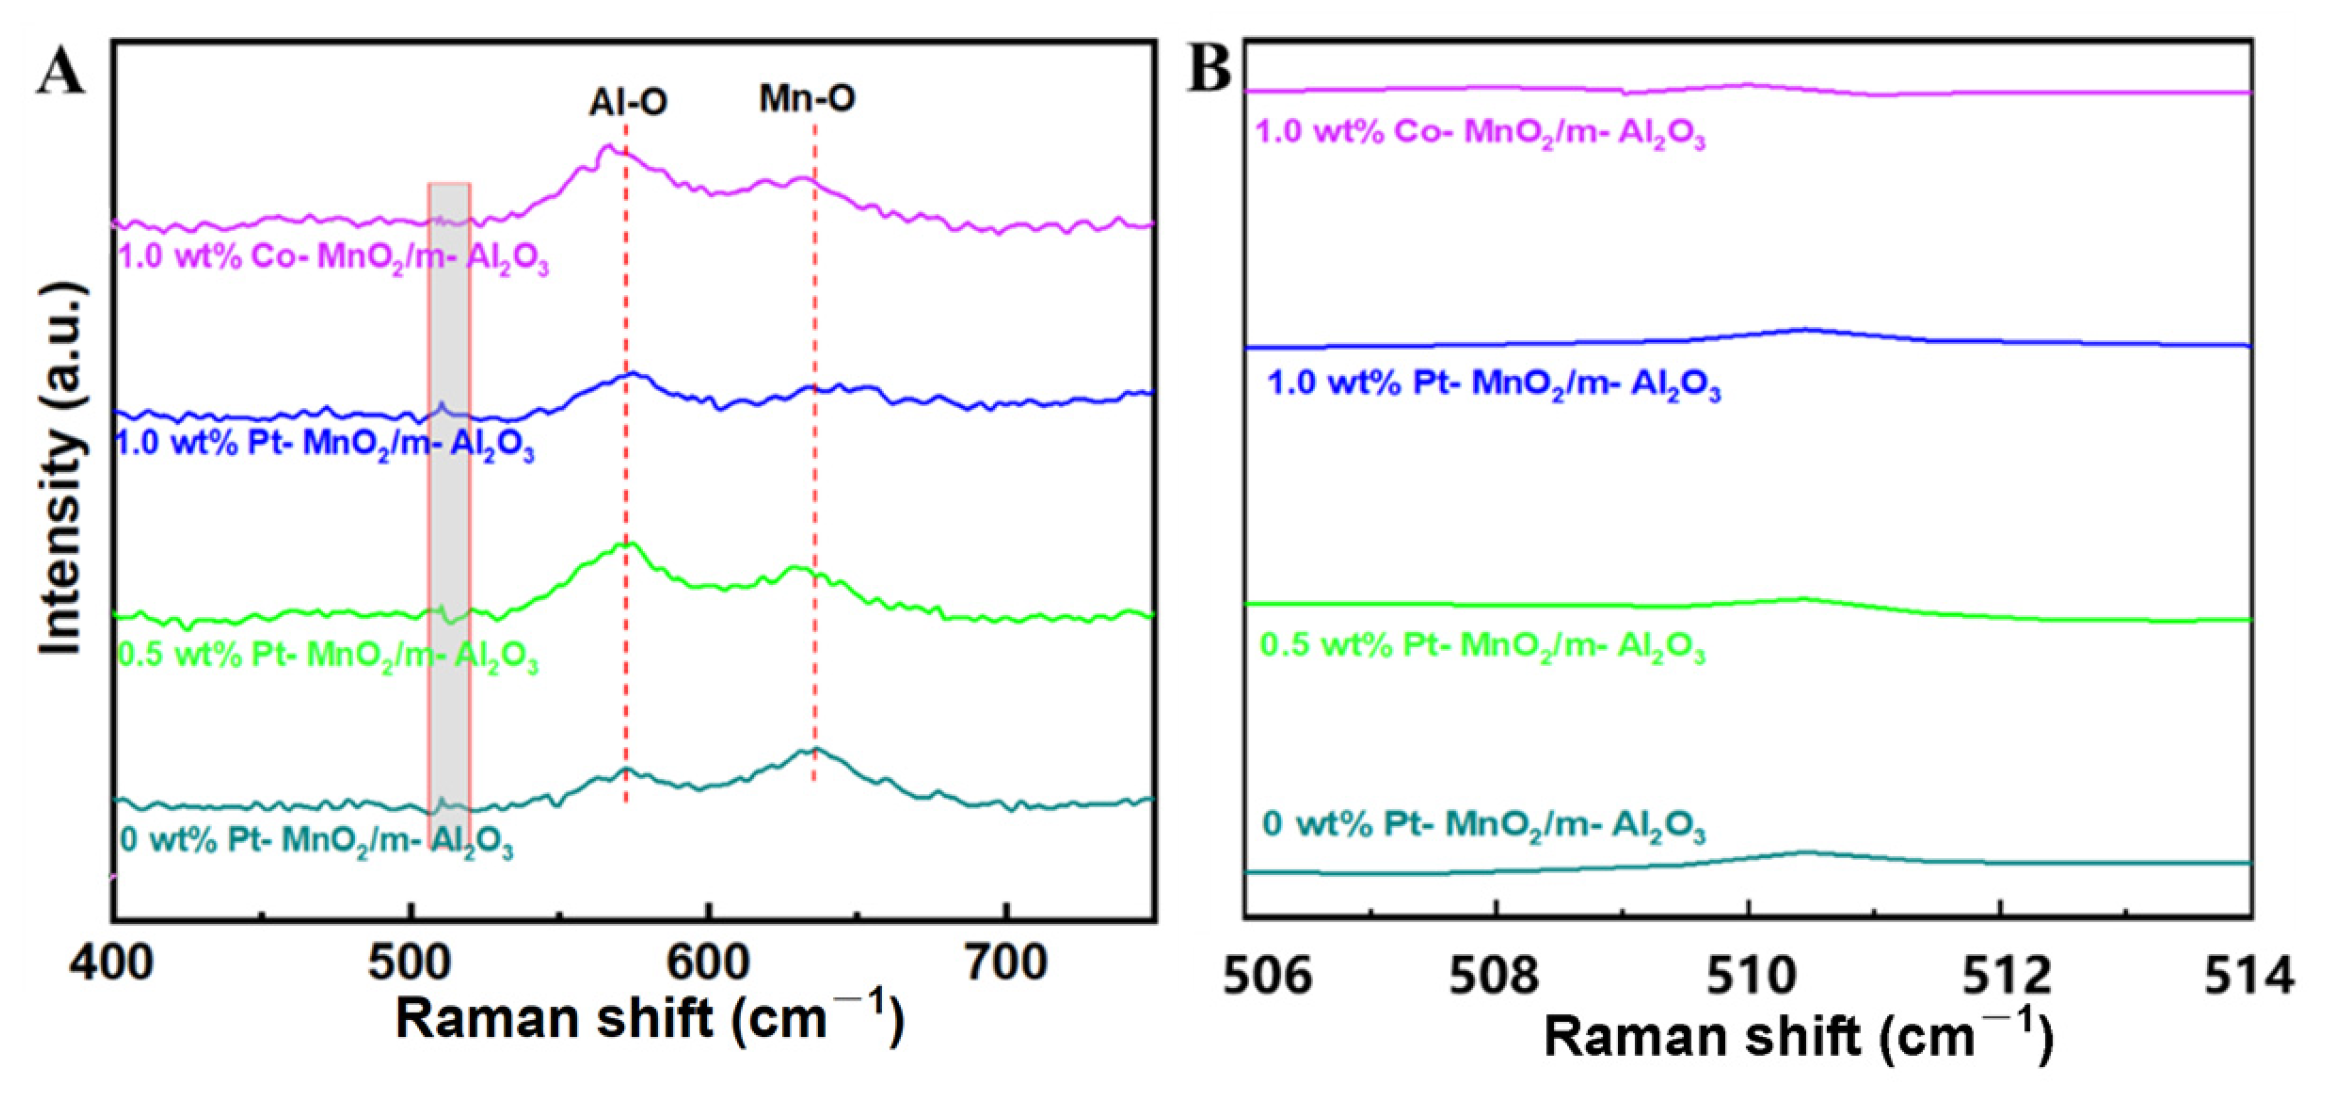
Raman spectra of all samples (Figure 3) display two characteristic bands at 567~575 cm−1 and 628~636 cm−1, corresponding to the symmetric stretching vibration of Mn-O octahedral and Al-O tetrahedral vibrations, respectively, consistent with the structural features of layered birnessite-type MnO2 (M1-MnO2) and mesoporous γ-Al2O3. Upon loading 0.5–1.0 wt% Pt, the Mn-O vibration peak shifts markedly from 572 cm−1 (pristine MnO2) to 575 cm−1 (Δν ≈ 3 cm−1), indicating Pt2+/Pt4+ incorporation into the [MnO6] octahedral lattice (ionic radii: Pt2+ = 0.80 Å vs. Mn4+ = 0.53 Å). This substitution shortens Mn-O bond lengths and strengthens bond interactions [20], corroborating the lattice contraction (Δd ≈ 0.03 Å) derived from the Bragg angle shift (Δ2θ = 0.2°) in XRD (001) planes, thereby confirming Pt confinement within the MnO2 lattice as a solid solution.
In contrast, the 1.0 wt% Co-doped sample exhibits a redshift of the Mn-O peak to 567 cm−1 (Δν ≈ 5 cm−1), suggesting Co3+ (0.61 Å)-induced lattice distortion and weakened Mn-O bonding. Williamson–Hall analysis reveals reduced crystallite size (~9.2 nm vs. 10.5 nm for undoped MnO2) and elevated microstrain (0.35%), highlighting Co’s role in modulating defect states via size–strain effects [21,22]. Additionally, the diminished intensity of the weak peak near 510 cm−1 (assigned to interlayer vibrations in MnO2) with Pt loading further supports crystallinity reduction and defect proliferation, aligning with the literature reports on Pt-MnO2 interfacial oxygen vacancies enhancing oxygen exchange capacity [23,24].

3.3. Analysis of Specific Surface Area and Pore Structure of Catalysts

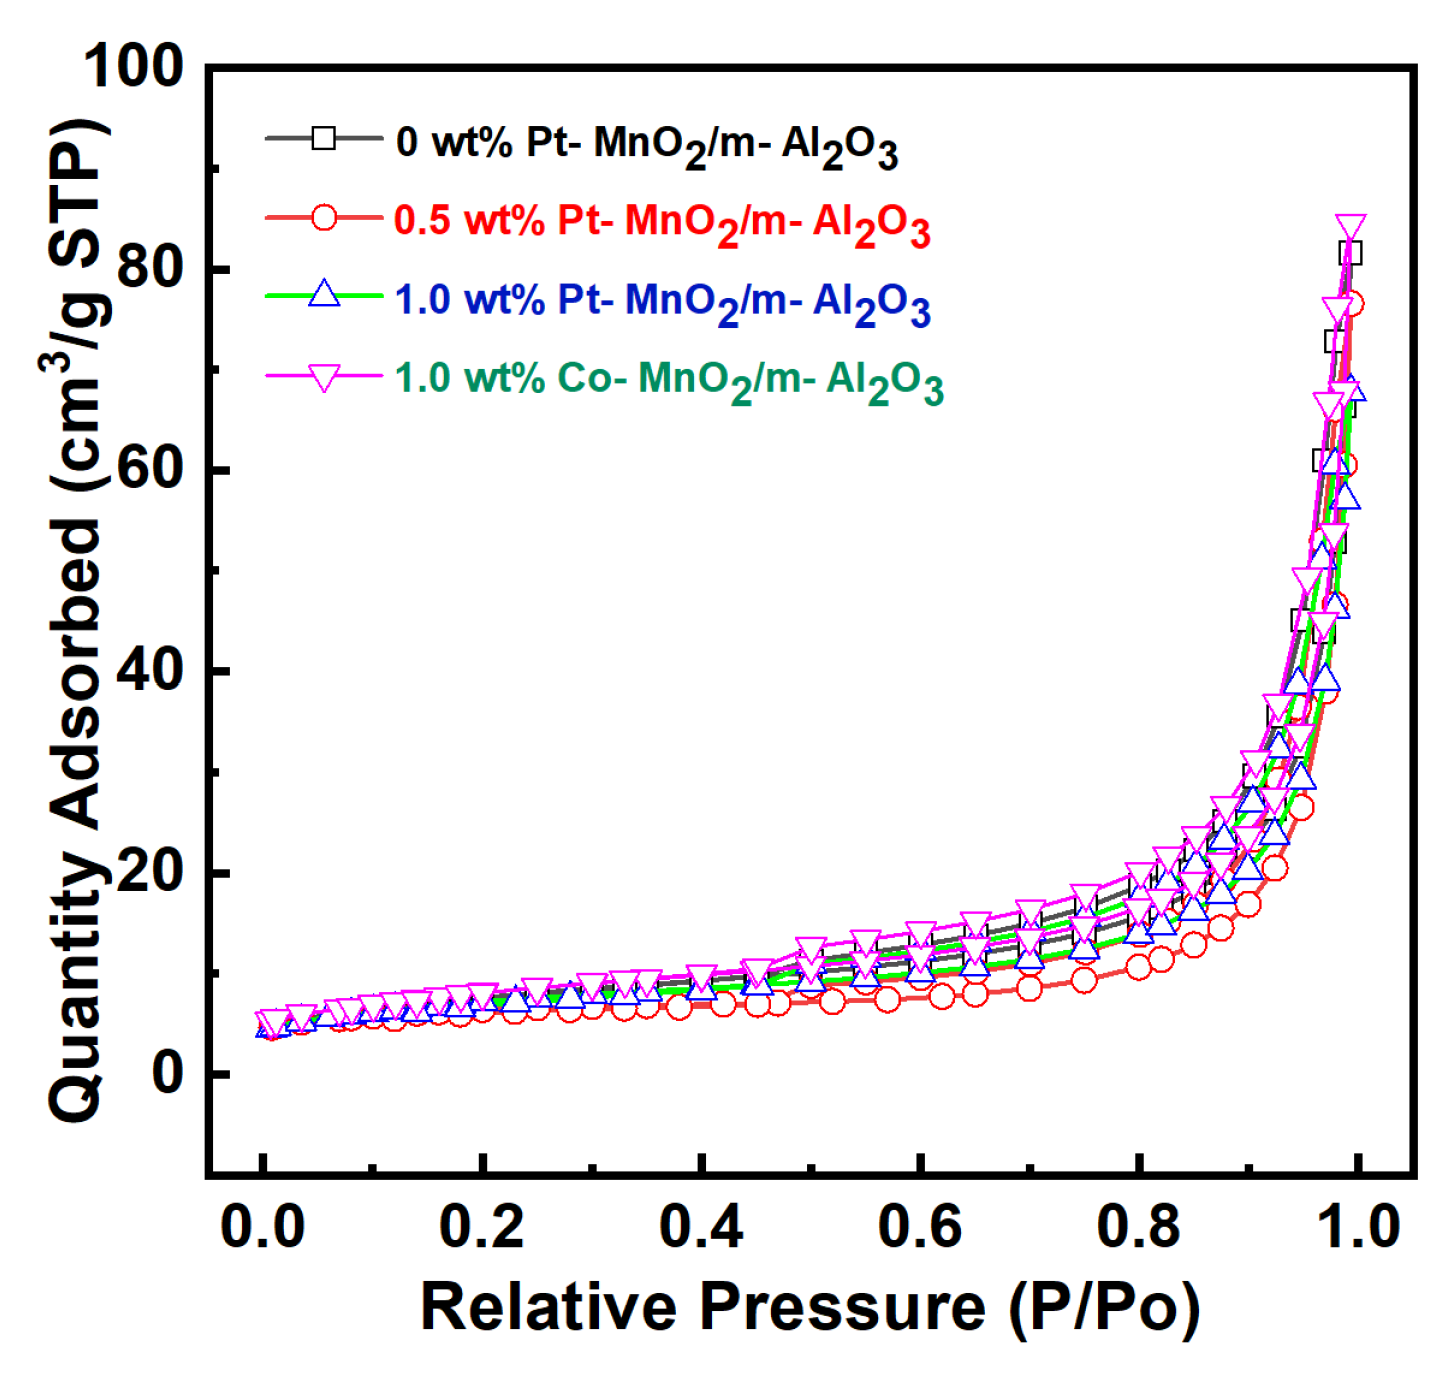
As shown by the N2 adsorption–desorption isotherms in Figure 4, all samples (0 wt%, 0.5 wt%, 1.0 wt% Pt, and 1.0 wt% Co-doped MnO2/Al2O3) exhibit type IV isotherms with H3-type hysteresis loops in the relative pressure range (P/P0) of 0.4–0.9, indicative of mesoporous structures (pore size: 2~50 nm). For the 1.0 wt% Pt-loaded sample (c), the adsorption capacity at high pressure (P/P0 > 0.9) is significantly higher than for other samples, reaching ~95 cm3/g at P/P0 = 0.99 (an 8.9% reduction compared to the undoped sample). Combined with BET results (Table 2), the 1.0 wt% Pt-loaded sample demonstrates a specific surface area of 28.1 m2/g, representing a 38.4% enhancement over the undoped catalyst (20.3 m2/g). This improvement is attributed to gas-induced pore-forming effects during Pt precursor decomposition, which optimizes pore architecture and increases surface accessibility of active sites. While the undoped sample exhibited a marginally higher total pore volume (0.425 vs. 0.387 cm3/g for the 1.0 wt% Pt sample), catalytic performance correlates more strongly with specific surface area and Pt dispersion density (<2 nm particle size), as evidenced by the 35 °C reduction in T90.
In contrast, the 1.0 wt% Co-doped sample (d) exhibits a hysteresis loop shifted toward higher pressure (P/P0 ≈ 0.8~0.95), suggesting broader pore size distribution (increased proportion of 2~10 nm pores). However, its lower specific surface area (24.4 m2/g) compared to Pt-doped systems may arise from partial collapse of micropores due to Co3+-induced lattice distortion (microstrain ε = 0.35% via Williamson–Hall analysis). Notably, the 0.5 wt% Pt-loaded sample (b) retains a crystallite size (15.5 nm) comparable to the undoped sample (15.9 nm), confirming that low noble metal loading minimally alters the support’s grain structure. Its enhanced surface area (27.6 m2/g) primarily stems from mesoporous structure optimization (pore volume reduced by 0.091 cm3/g over the undoped catalyst), providing a structural foundation for exposing additional Mn3+-Ov active sites, as evidenced by XPS data showing a 9.5% rise in oxygen vacancy concentration.
The N2 adsorption–desorption isotherms (Figure 4) of all catalysts exhibit type IV curves with H3 hysteresis loops, characteristic of mesoporous materials. Notably, the hysteresis loop of the Co-doped catalyst shifts to higher relative pressures (P/P0 ≈ 0.8~0.95) compared to Pt-doped and undoped samples (P/P0 ≈ 0.6~0.8), indicating the presence of larger mesopores in the Co-doped catalyst. This observation is consistent with the Kelvin equation [9], which predicts that larger pores require higher relative pressures for capillary condensation during adsorption and exhibit delayed desorption at elevated pressures.

3.4. Morphological and Textural Analysis

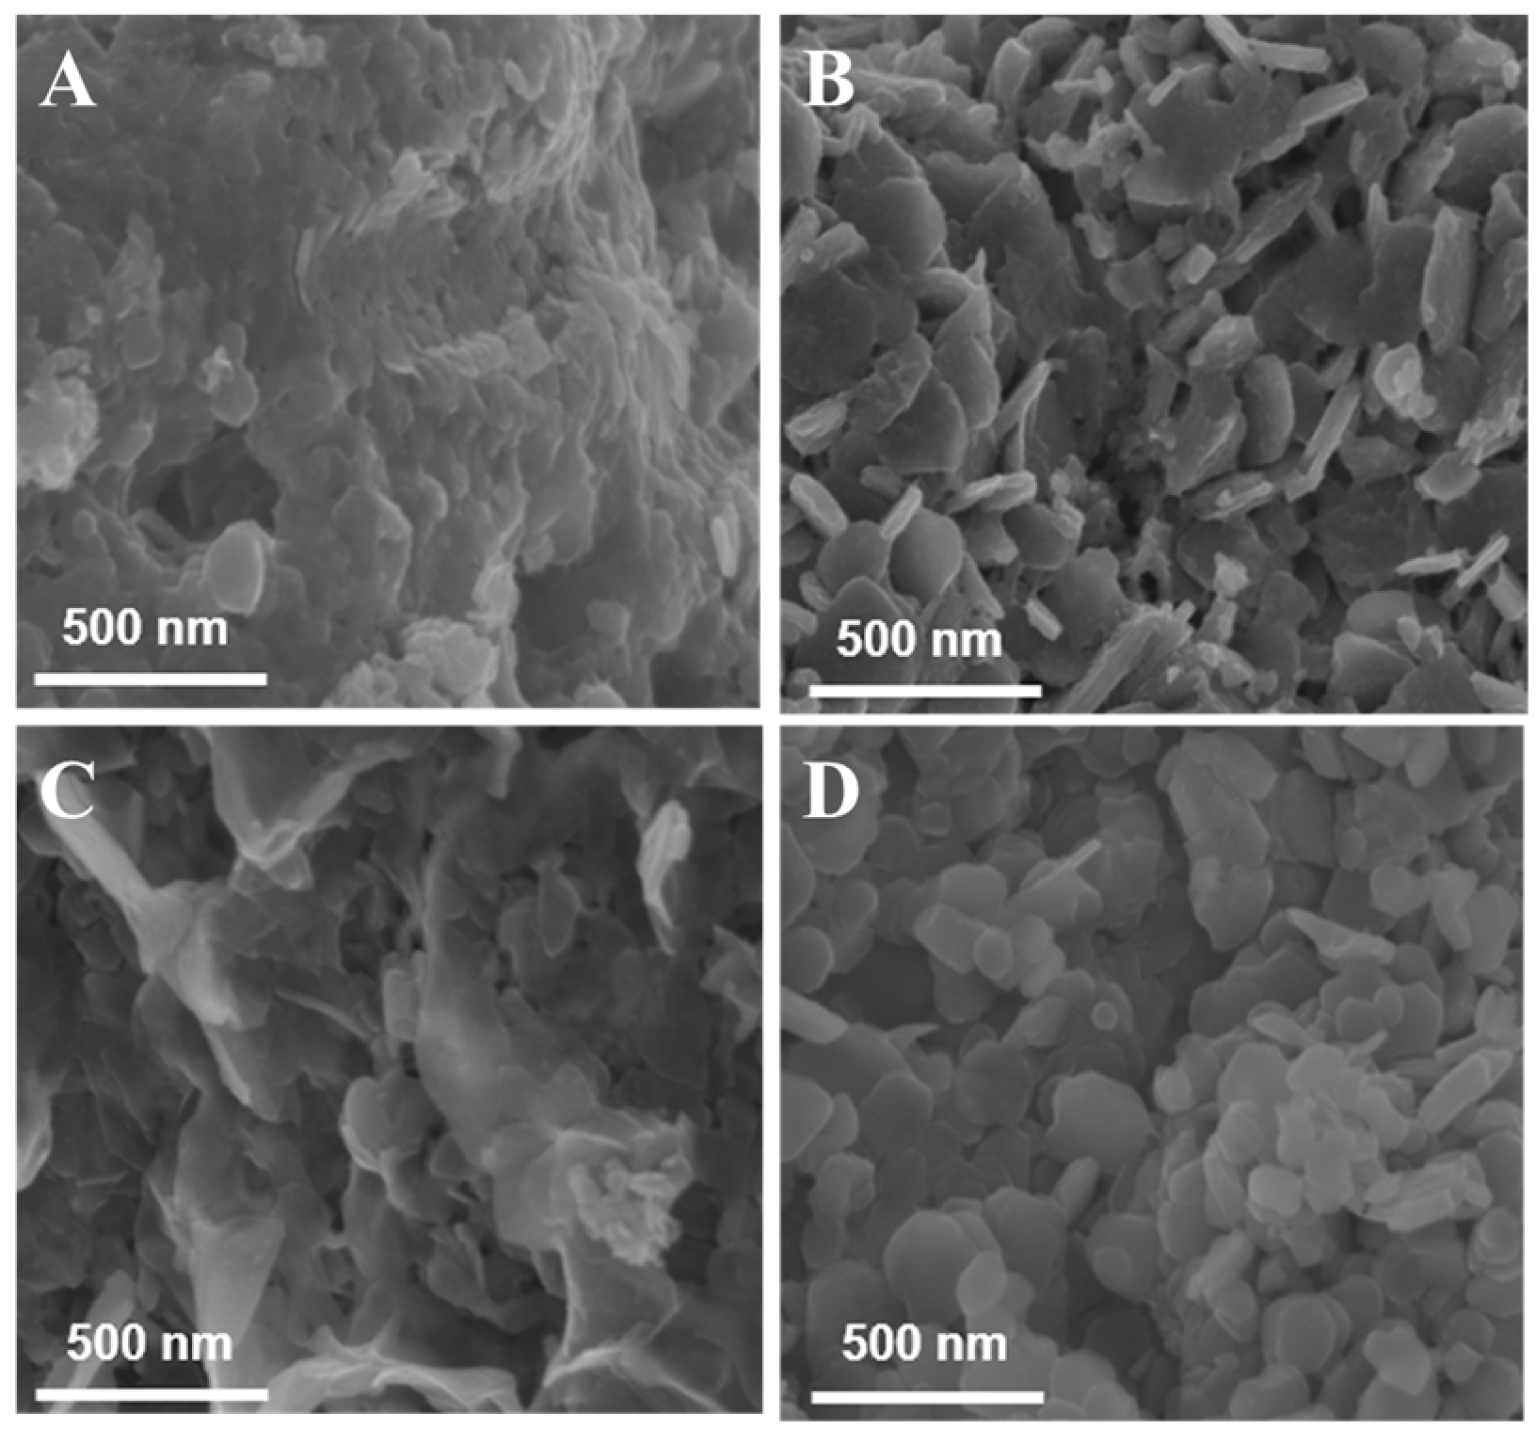
SEM images (Figure 5) reveal that all samples (0 wt%, 0.5 wt%, 1.0 wt% Pt, and 1.0 wt% Co-doped MnO2/Al2O3) exhibit a two-dimensional sheet-like morphology with lateral dimensions of 200~500 nm. Low noble metal loading (0.5~1.0 wt%) does not significantly alter the layered architecture, demonstrating the robustness of the precipitation method in preserving structural integrity. Notably, the 1.0 wt% Co-doped sample (Figure 5D) displays a reduced sheet thickness (5~8 nm) compared to the undoped counterpart (10~15 nm), consistent with its higher specific surface area (24.4 m2/g vs. 20.3 m2/g) and confirming that thinner layers facilitate greater exposure of surface active sites.
In contrast, the 1.0 wt% Pt-loaded sample (Figure 5C) retains a comparable thickness (8~12 nm) but achieves the highest specific surface area (28.1 m2/g). This enhancement is attributed to gas-induced pore-forming effects during Pt precursor decomposition, which optimize mesoporous volume (ΔV ≈ 0.091 cm3/g) and refine pore architecture. The observed correlations among sheet thickness, surface area, and pore structure align with established mechanisms governing morphology-dependent catalytic performance [25,26]. Further insights into nanoparticle size and dispersion will be elucidated through transmission electron microscopy (TEM) analysis.
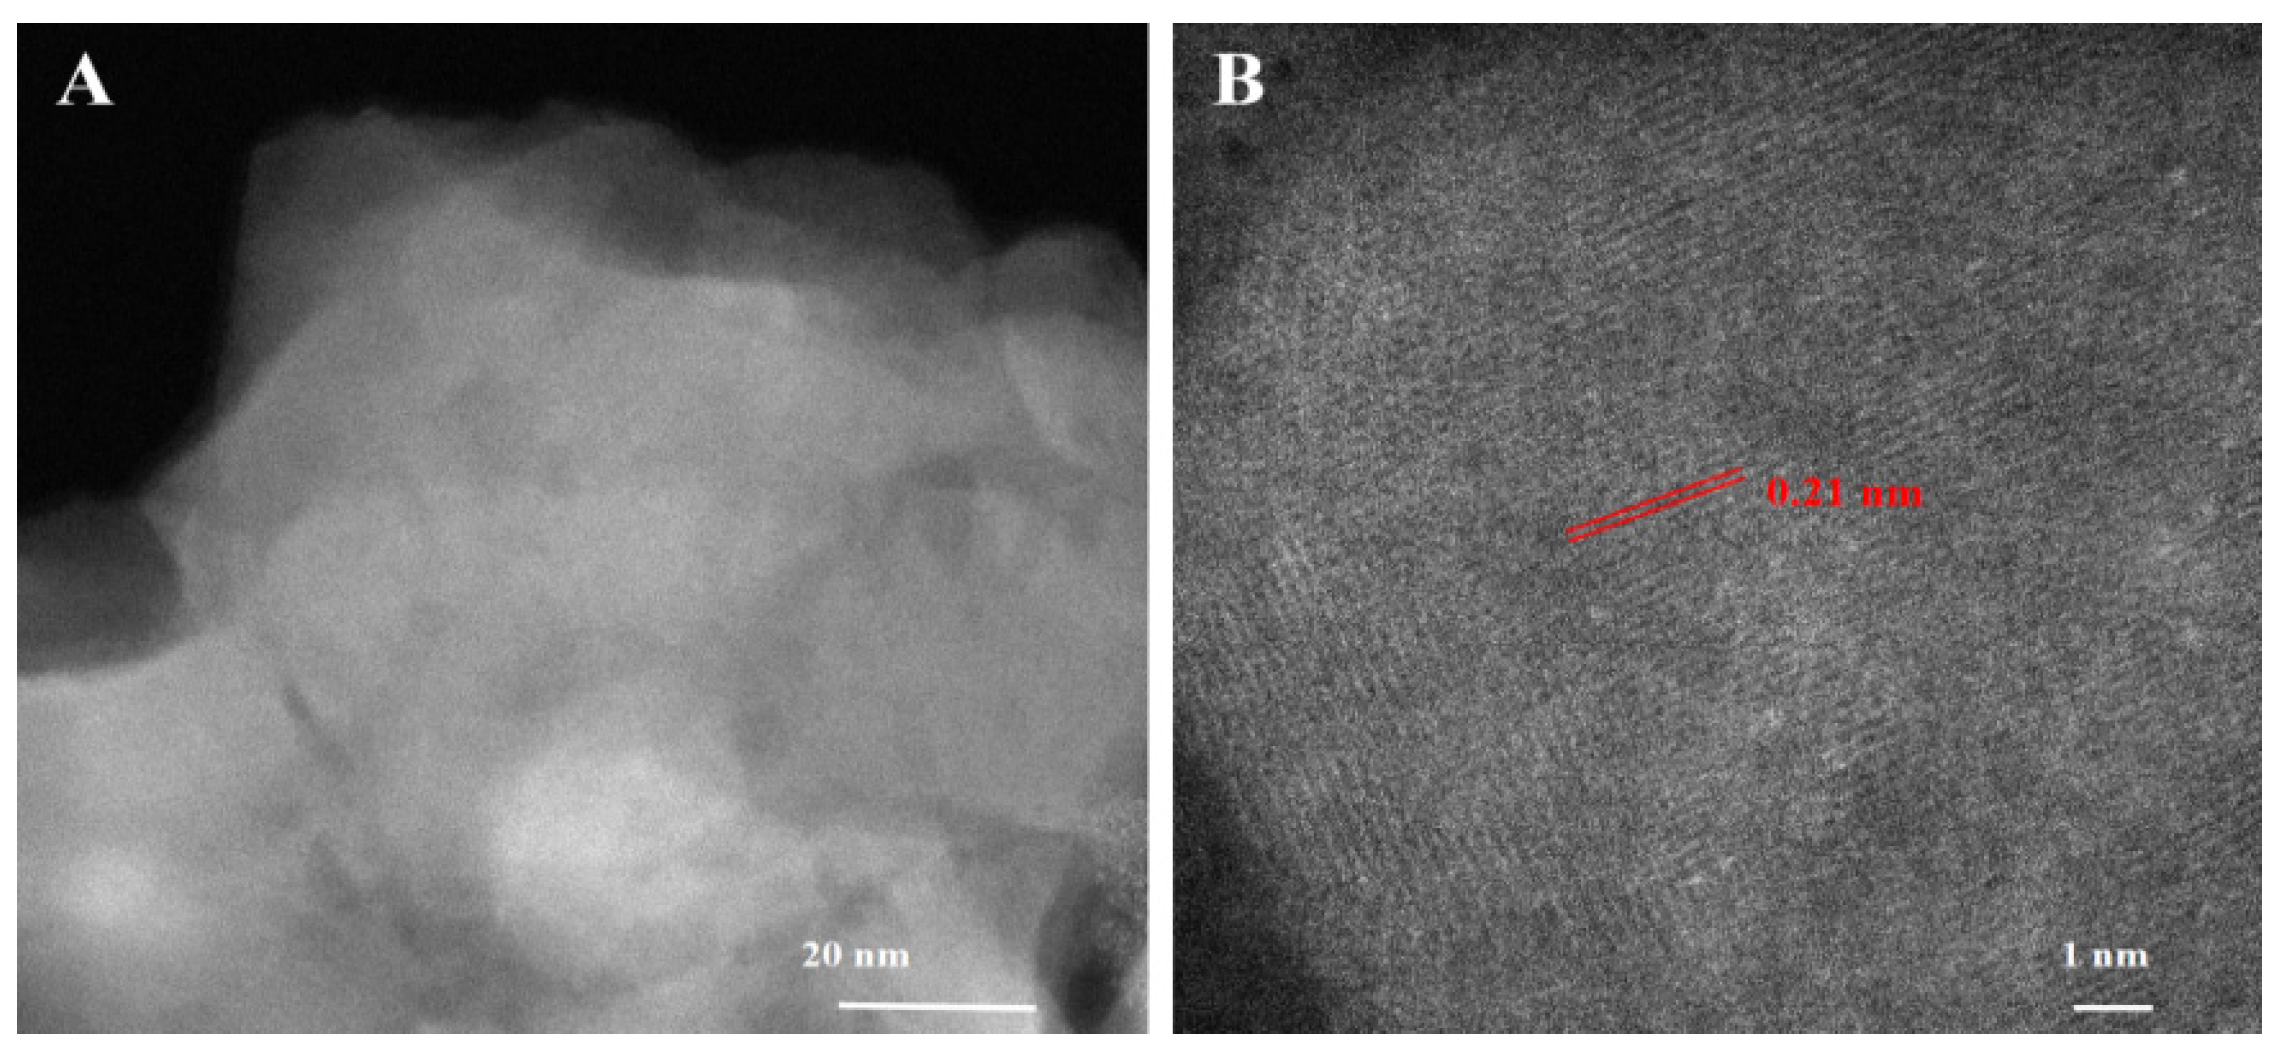
Figure 6 presents TEM and HRTEM images of the 0.5 wt% Pt-MnO2/Al2O3 catalyst. The TEM image (Figure 6A) reveals a densely stacked two-dimensional layered architecture with an interlayer spacing of ~20 nm, consistent with the sheet-like morphology observed in SEM, confirming the efficacy of the SDC (sequential deposition–calcination) method in preserving morphological regularity. The HRTEM image (Figure 6B) displays distinct lattice fringes with a spacing of 0.22 nm (red markers), corresponding to the [201] and [−111] planes of birnessite-type M1-Mnx (JCPDS 80-1098). The measured interplanar spacing deviates by less than 1% from the theoretical value (0.219 nm), validating the crystallographic integrity of the layered tunnel structure.
Notably, no lattice fringes attributable to Pt nanoparticles (e.g., Pt (111) at 0.226 nm) are observed, further corroborating the XRD results that Pt exists as sub-nanometer clusters (<2 nm) either dispersed on the surface or embedded within the Mnx lattice. This structural feature aligns with confined catalysts synthesized via SDC methods reported in prior studies [8]. The absence of Pt agglomerates and the preserved MnO2 lattice coherence provide an optimal topological foundation for exposing active sites (e.g., Mn3+-Ov-Pt interfaces) and facilitating oxygen species transport, which are critical for catalytic efficiency.
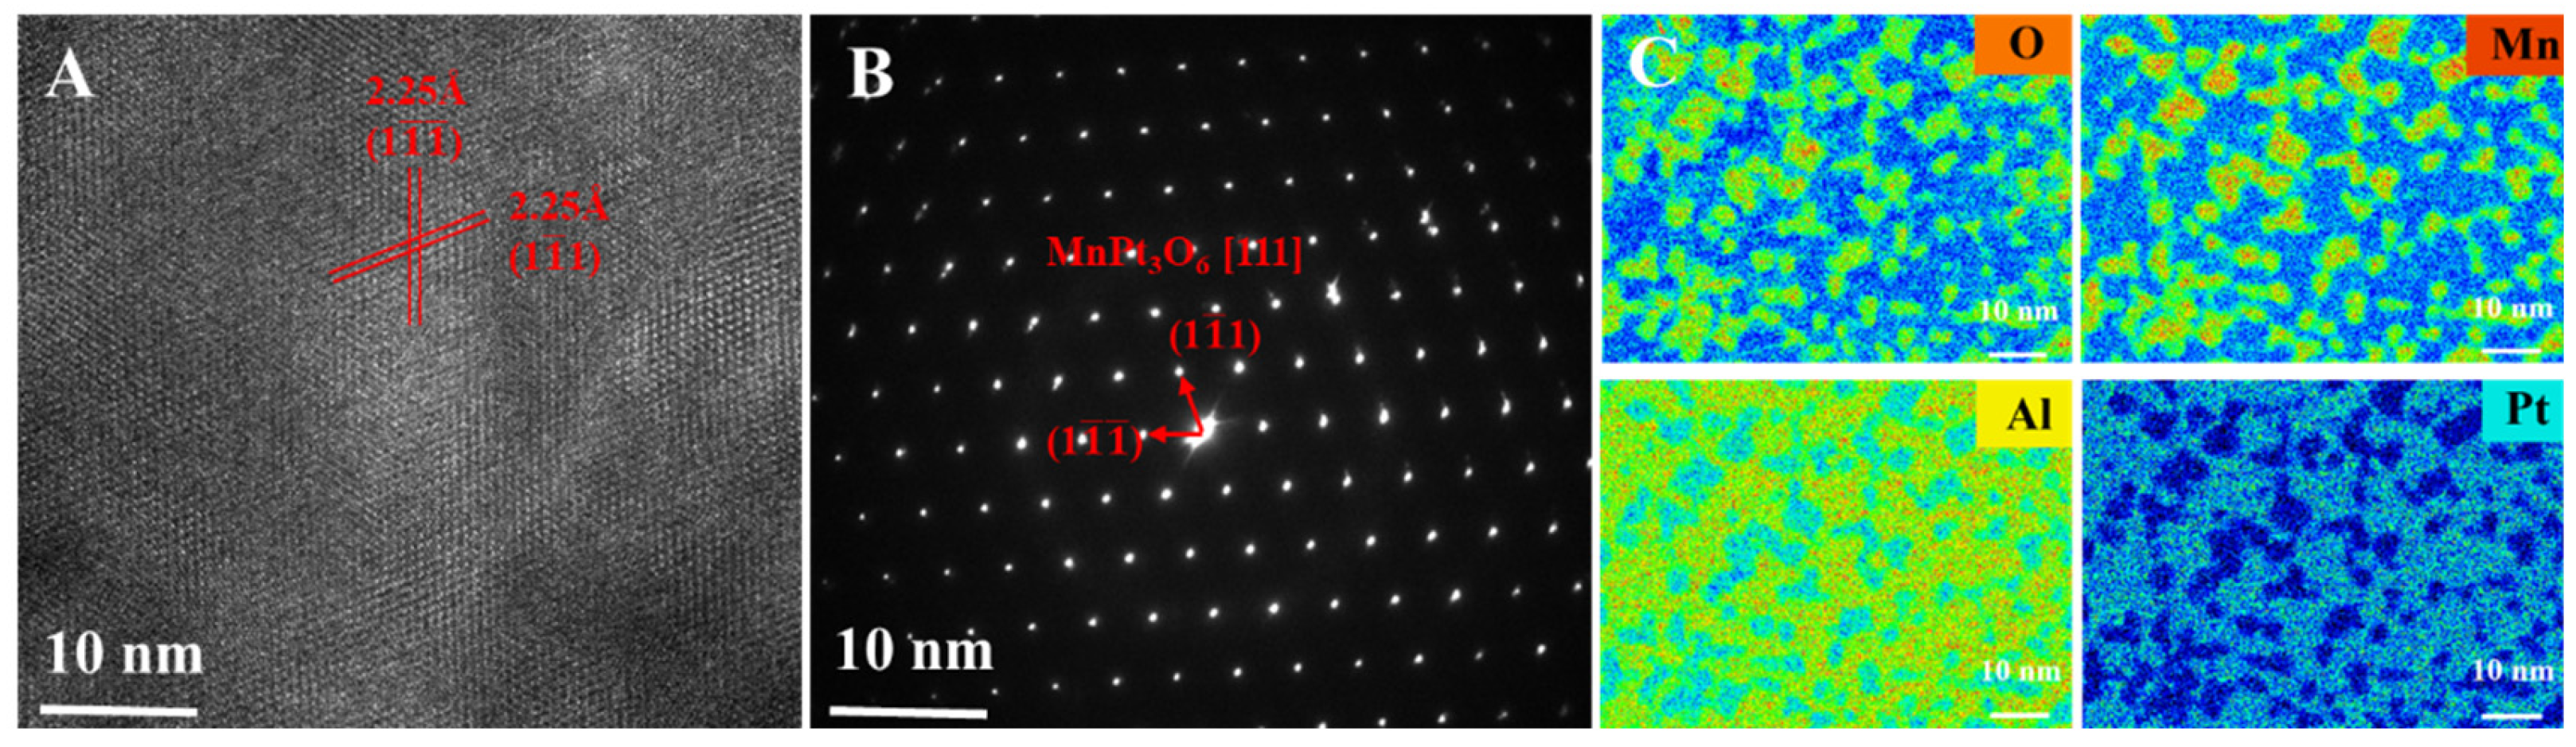
HAADF-STEM images of the 0.5 wt% Pt-MnO2/Al2O3 catalyst (Figure 7A,B) reveal numerous sub-nanometer to 2 nm bright particles dispersed on the layered MnO2 support. The Z-contrast differences (atomic number-dependent) confirm these particles as Pt species, consistent with the homogeneous Pt distribution observed in EDS elemental mapping (Figure 7C), thereby verifying the high dispersion of Pt on the support.
Localized lattice fringes within the red-boxed regions (Figure 7A) exhibit interplanar spacings of 0.225 Å, corresponding to the (111) plane of the MnPt3O6 phase (PDF 50-1607). Zone-axis analysis confirms the coexistence of MnPt3O6 at interfacial regions (arrows in Figure 7B), as previously reported [27,28]. The measured spacing for the MnPt3O6 (110) plane (0.21 nm vs. theoretical 0.214 nm, −1.9% deviation) reflects strong Pt-Mn-O interactions, aligning with the oxygen activation mechanism at Pt-MnO2 interfaces documented in the literature [29]. This multiphase interfacial architecture provides synergistic active sites for lattice oxygen cycling (via MnPt3O6) [9], though detailed catalytic kinetics require further elucidation through in situ characterization.

3.5. Catalytic Performance for Methane Oxidation

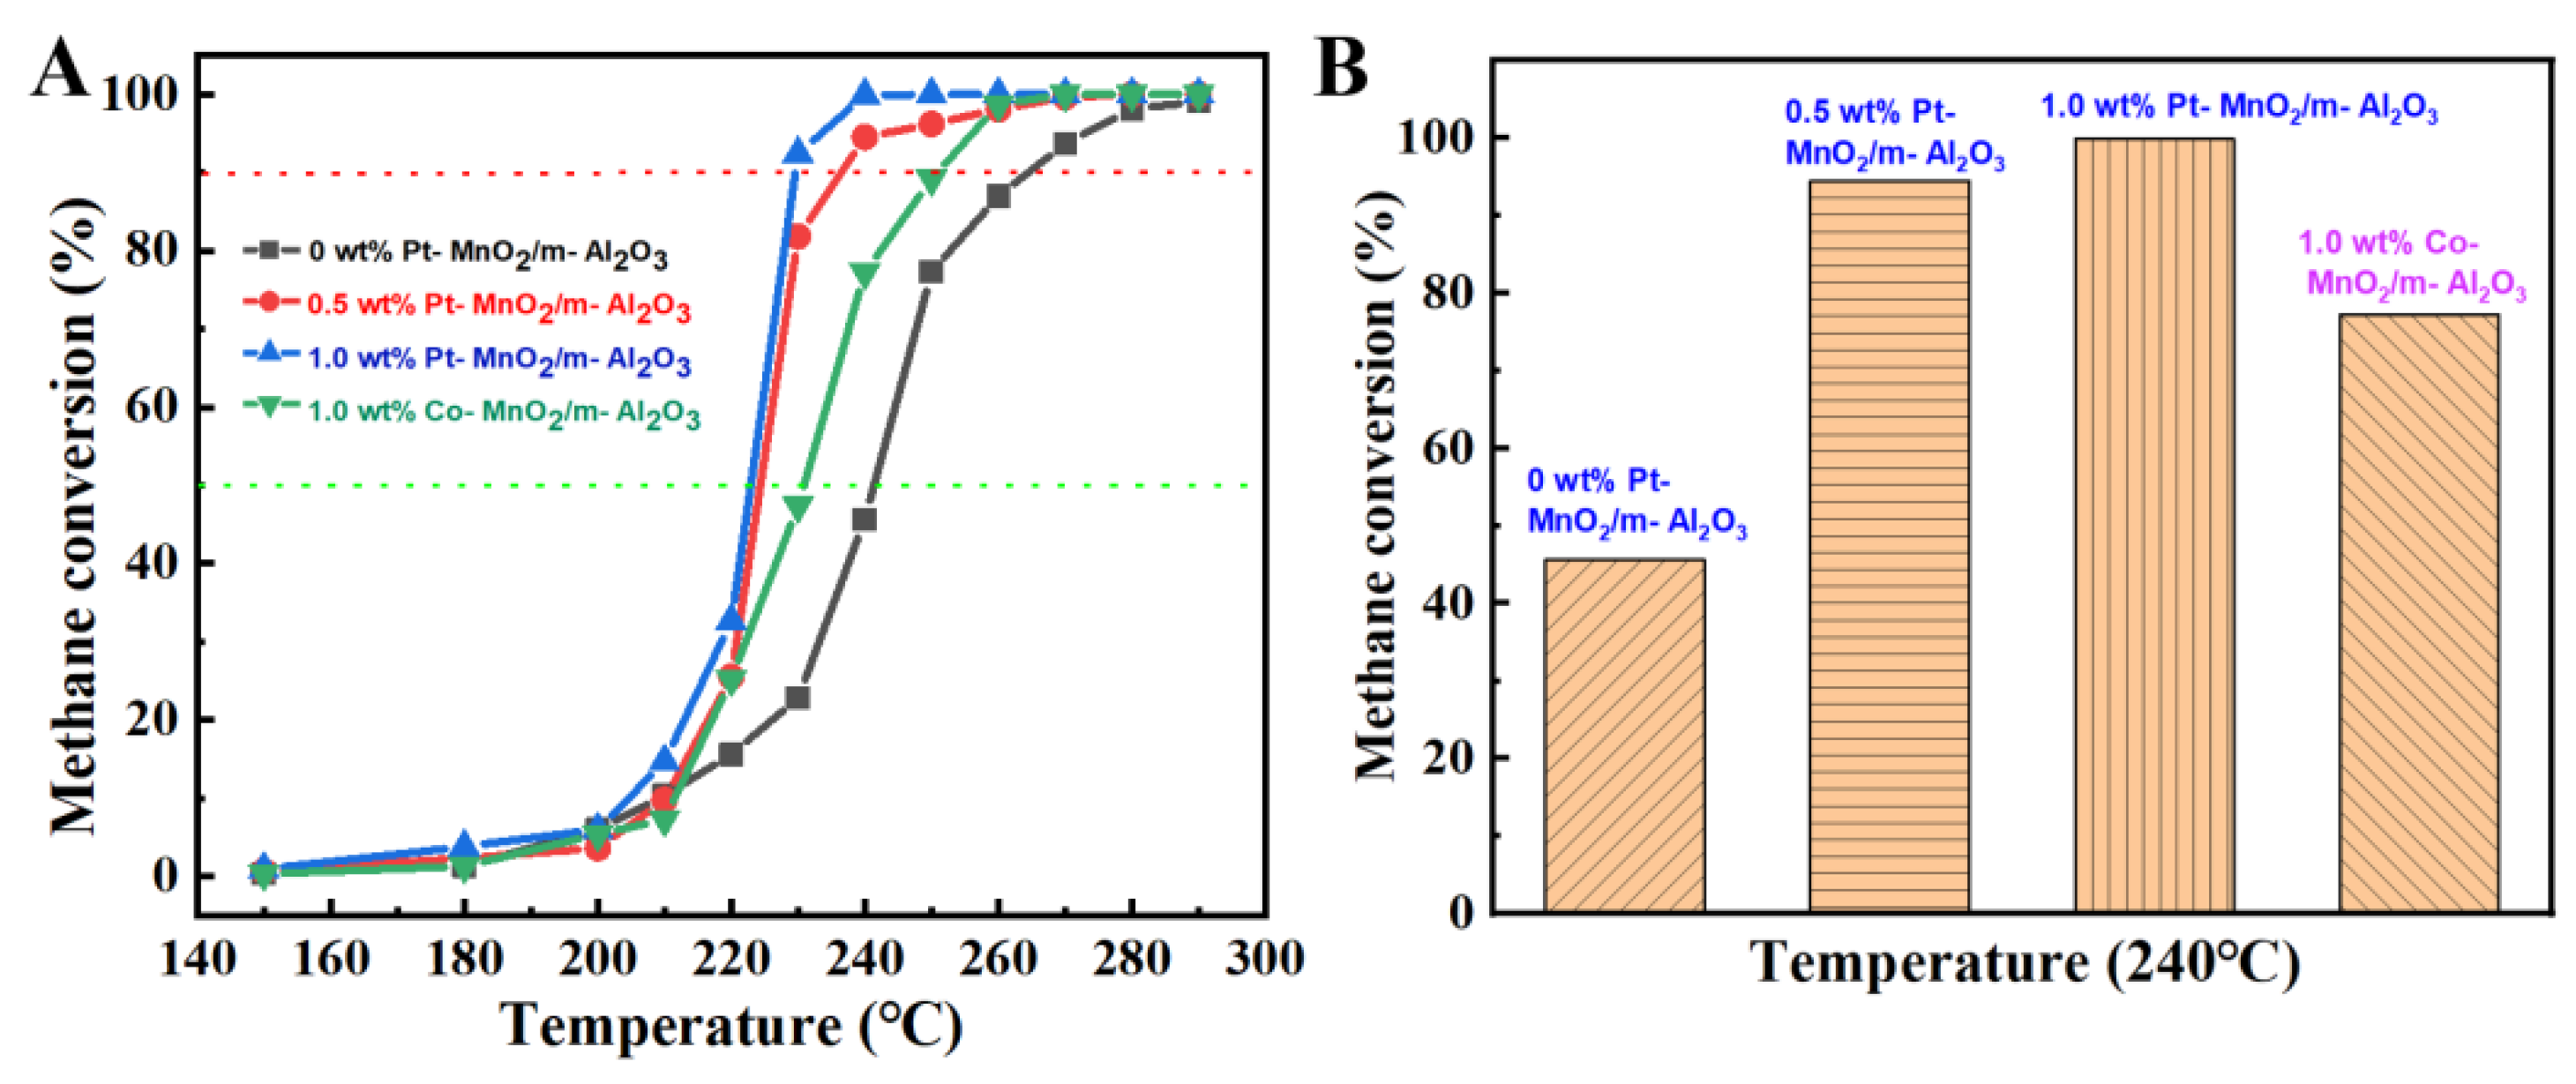
As shown in Figure 8A, the 1.0 wt% Pt-MnO2/Al2O3 catalyst exhibits optimal methane oxidation activity, achieving 50% conversion (T50) at 222 °C, which is 19 °C lower than the undoped sample (~241 °C). The T90 values follow the order 0 wt% Pt (264 °C) > 1.0 wt% Co (251 °C) > 0.5 wt% Pt (236 °C) > 1.0 wt% Pt (229 °C), indicating a positive correlation between Pt loading and catalytic performance. Under isothermal conditions at 240 °C (Figure 8B), the 1.0 wt% Pt sample achieves a methane conversion rate of 96%, significantly surpassing other samples (0 wt%: 50%, 1.0 wt% Co: 79%, 0.5 wt% Pt: 94%), directly correlating with its highest BET surface area (28.1 m2/g), lattice contraction in the Pt-MnO2 solid solution (Δd ≈ 0.03 Å via XRD/Raman), and the PtO-MnPt3O6 interfacial structure observed by HAADF-STEM (lattice spacing deviation ±1.8%).
The enhanced activity arises from 0.5 wt% Pt confinement, which optimizes oxygen vacancy density (XPS reveals a 1.41% increase in Mn3+ content) and lattice oxygen mobility (O2-TPD desorption peak temperature reduced by ~50 °C), synergistically accelerating methane adsorption–oxidation kinetics. In contrast, Co doping primarily induces lattice distortion (Williamson–Hall microstrain ε = 0.35%), generating defect-mediated active sites with limited efficacy. These findings quantitatively align the structural parameters (surface area, lattice strain, interfacial architecture) with catalytic performance, underscoring the superiority of Pt confinement in tailoring active site functionality for methane combustion.

3.6. XPS Analysis of Fresh Catalysts

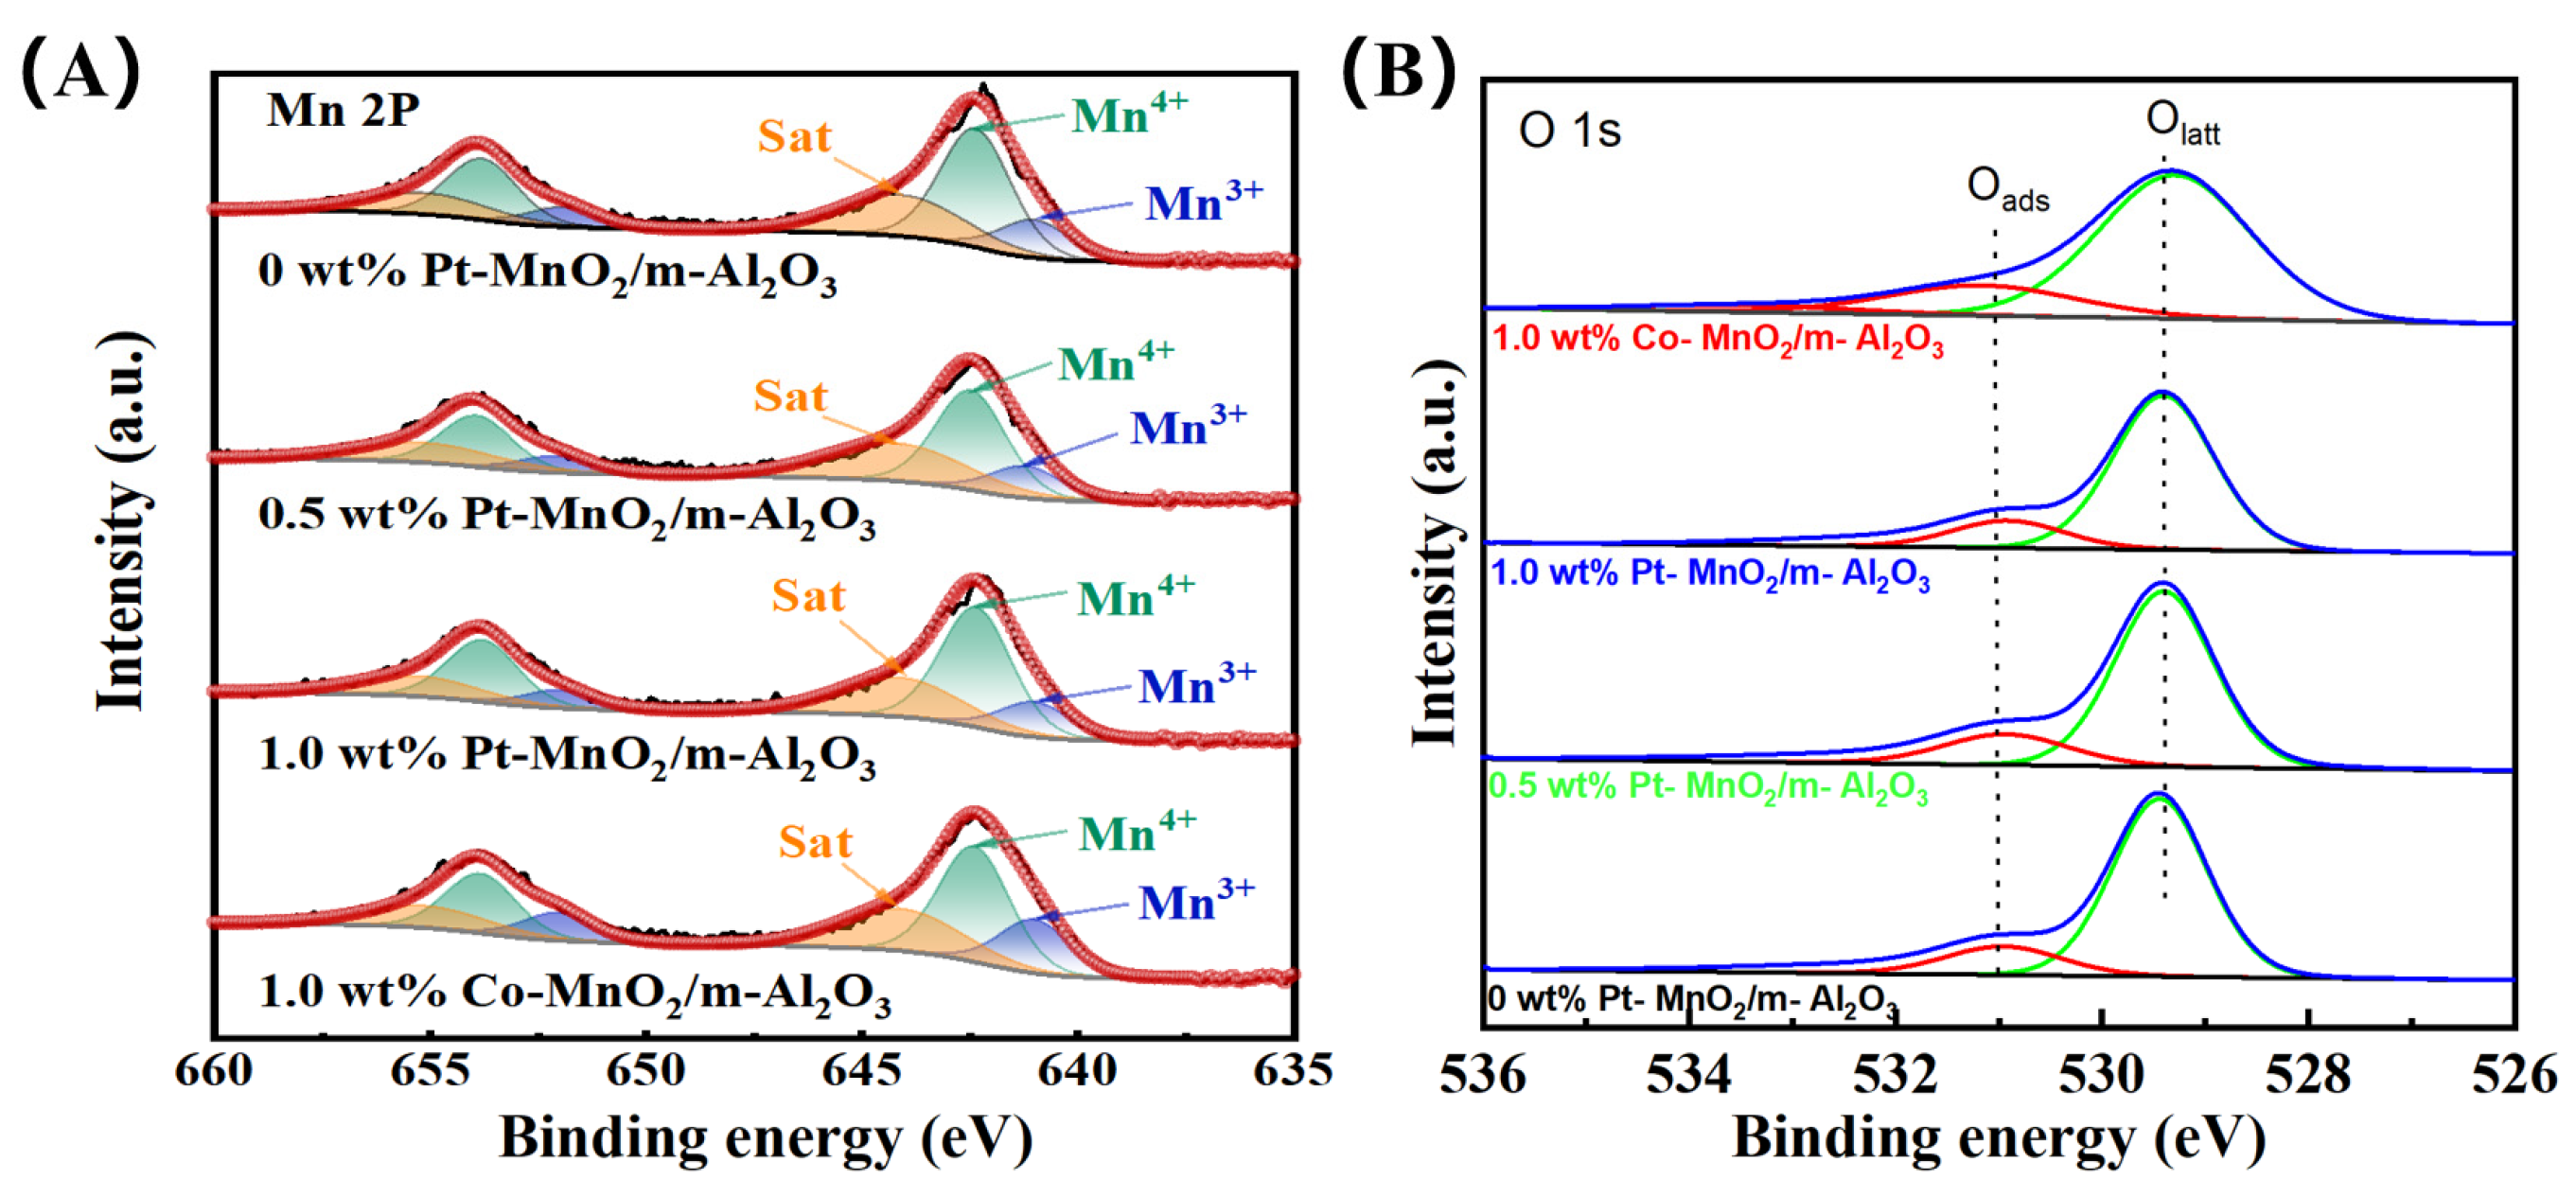
XPS characterization technology is often used to analyze the composition and valence distribution of various elements on the surface of materials and the types of active oxygen species. Figure 9 shows the spectra of Mn2p3/2, o-1s for four samples. The content of different oxygen types and valence Mn elements was calculated by fitting curves, and the data are shown in Table 3.
(1)
Mn3+/Mn4+ Ratio and Oxygen Vacancy Formation Mechanism
Deconvolution of the Mn 2p3/2 spectra (Figure 9A and Table 3) reveals that the 1.0 wt% Pt-loaded MnO2/Al2O3 sample (purple curve) exhibits a Mn3+ content of 79.87%, significantly higher than the undoped sample (75.22%). The binding energy difference between Mn3+ (641.9 eV) and Mn4+ (643.5 eV) is 1.6 eV, characteristic of mixed Mn3+-O-Mn4+ valence states in layered MnO2 [30,31]. The increased Mn3+ proportion (Δ ≈ 4.65%) directly correlates with oxygen vacancy (Ov) generation via the charge compensation mechanism, 2Mn4+ → Mn3+ + Mn3+ + Ov, which maintains lattice electroneutrality [32]. The 1.0 wt% Pt sample shows the highest Ov concentration (semi-quantitatively estimated to increase by ~16% via XPS), consistent with the intensified low-temperature reduction peak (~320 °C) in H2-TPR (15% peak area enhancement). These results confirm that Pt doping promotes Mn3+-Ov pair formation through solid solution effects (XRD lattice contraction Δa = 0.04 Å), thereby providing abundant active sites for oxygen adsorption and activation [33,34].
(2)
Synergistic Role of Lattice Oxygen (Olatt) and Adsorbed Oxygen (Oads)
The O 1s spectra (Figure 9B) demonstrate that the 1.0 wt% Pt sample exhibits a lattice oxygen (Olatt, 529.3 eV) content of 74.99%, 16.21% higher than the undoped sample (58.78%). The elevated Olatt proportion indicates enhanced oxygen mobility (dynamic Olatt ↔ Oads conversion), corroborated by the lower desorption temperature (ΔT ≈ 50 °C) and increased O2-TPD peak area (18% enhancement) [35,36]. High Olatt concentration not only provides direct reaction sites for methane C–H bond activation (via lattice oxygen participation in the MVK mechanism) [36] but also accelerates oxygen vacancy regeneration (Ov + ½O2 → Olatt) through the Pt-Mn-O interface (PtO-MnPt3O6 structure validated by HAADF-STEM), establishing an efficient oxygen cycling network [34].
(3)
Pt Doping-Induced Enhancement of Oxygen Species Cycling
The 1.0 wt% Pt sample combines the highest Mn3+ content (79.87%) and Olatt concentration (74.99%), demonstrating a dual mechanism for performance enhancement: Mn3+-Ov proliferation: Pt2+/Pt4+ incorporation into the MnO2 lattice (evidenced by XRD/Raman lattice distortion) induces Mn3+-Ov pair formation, strengthening gas-phase oxygen adsorption capacity. Interfacial oxygen dynamics: The PtO-MnPt3O6 interface (Figure 7B) acts as an electron transfer bridge, facilitating dynamic Olatt → Oads conversion and shortening oxygen cycling periods (H2-TPR reduction peak shifted to 287 °C). This synergy reduces the T90 (229 °C vs. 264 °C for undoped sample) and enhances oxygen exchange rates by ~40% (kinetically derived from O2-TPD), aligning with lattice oxygen-dominated catalytic enhancement mechanisms reported in the literature [37,38].

3.7. Redox Capacity of Fresh Catalysts

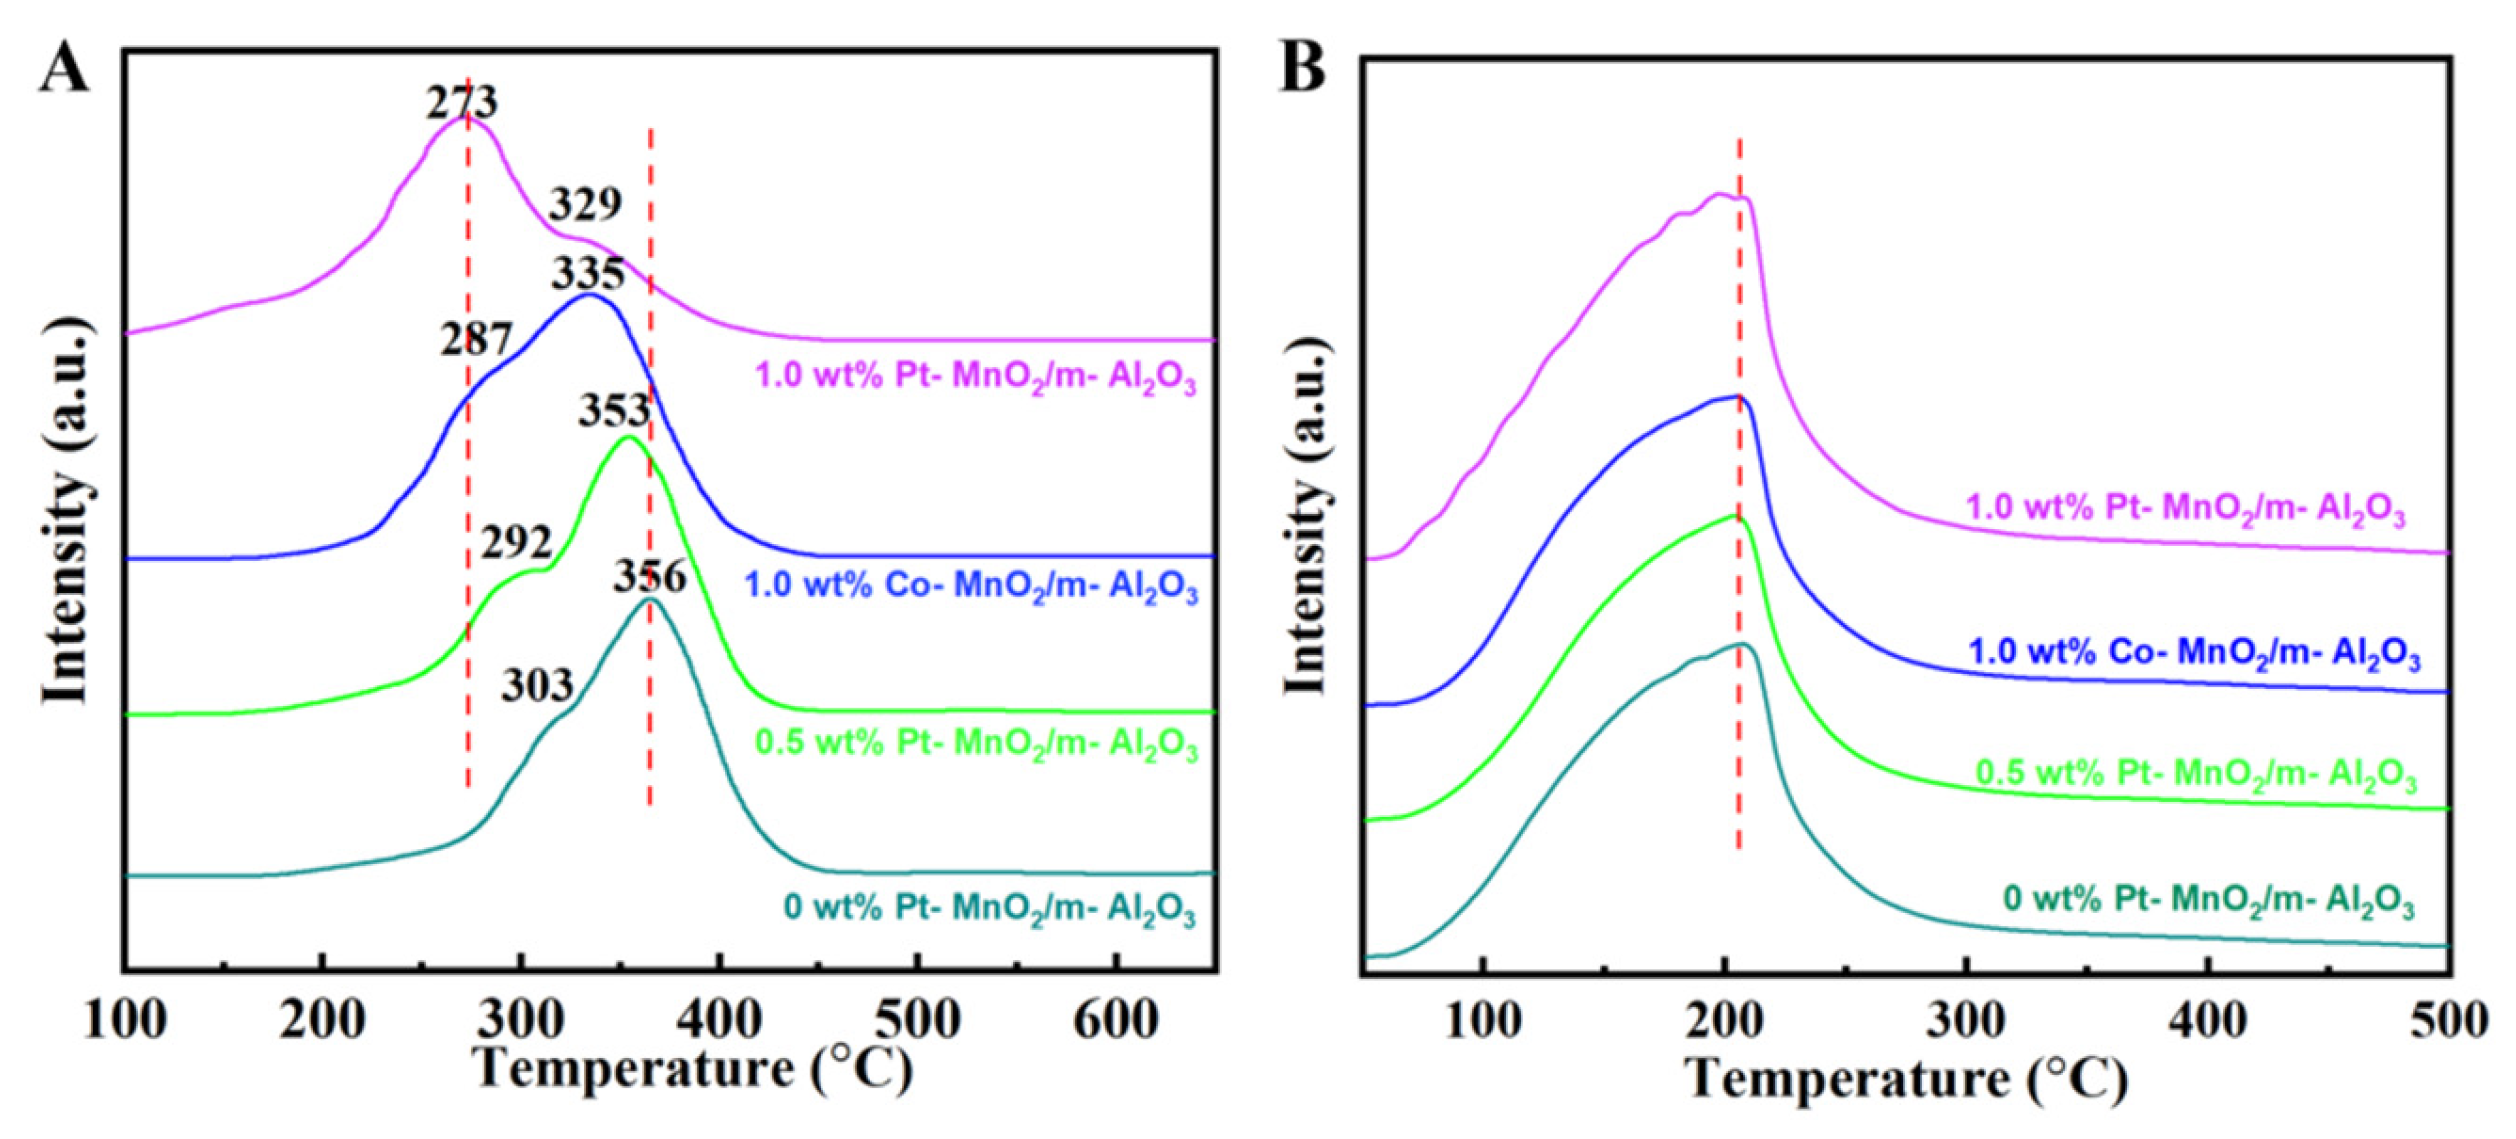
The H2-TPR profiles (Figure 10A) of all samples exhibit two reduction peaks in the range of 200–450 °C, corresponding to the sequential reduction processes of Mn4+ → Mn3+ (273–303 °C) and Mn3+ → Mn2+ (329–356 °C) [21,39]. For the 1.0 wt% Pt-MnO2/Al2O3 sample the low-temperature reduction peak appears at 273 °C, 30 °C lower than for the undoped sample (303 °C), while the high-temperature peak shifts to 329 °C (undoped: 356 °C). This shift indicates a significant decrease in reduction activation energy due to Pt incorporation. Additionally, a weak reduction peak at 100–200 °C (attributed to PtO → Pt0) with ~5% hydrogen consumption is observed for the 1.0 wt% Pt sample, consistent with the literature reports on Pt/MnO2 systems [40]. The Co-doped catalyst shows a unique two-step reduction profile: a shoulder peak at 292 °C followed by a main peak at 353 °C (Figure 10A). The low-temperature shoulder (292 °C) likely arises from the reduction of Co3+ → Co2+ species weakly interacting with MnO2, while the high-temperature peak (353 °C) corresponds to the concurrent reduction of both Co2+ → Co0 and MnO2 → Mn3O4 [25,30].
The O2-TPD profiles (Figure 10B) reveal that the bare MnO2/Al2O3 support exhibits an oxygen desorption peak at 219 °C with a total desorption amount of 120 ± 5 μmol/g. After Pt loading, the desorption peak shifts to lower temperatures (213 °C for 0.5 wt% Pt and 206 °C for 1.0 wt% Pt), and the total desorbed O2 increases by 54% and 75%, respectively (see Table 4). These changes demonstrate that Pt incorporation into the MnO2 lattice enhances lattice oxygen mobility and promotes oxygen vacancy regeneration. The bare support alone does not exhibit such high oxygen desorption capacity, confirming that the improved oxygen cycling is a direct consequence of Pt–MnO2 electronic interaction, not an intrinsic feature of the MnO2–Al2O3 carrier [41]. Combined H2-TPR and O2-TPD data indicate a positive correlation between the low-temperature reducibility (lowest H2-TPR peak temperature) and high oxygen mobility (highest O2-TPD desorption capacity) in Pt-MnO2/Al2O3. This synergy accelerates oxygen cycling kinetics in methane oxidation (Mars–van Krevelen mechanism), consistent with the 28 °C reduction in T90 observed in catalytic tests (Figure 8). In contrast, the 1.0 wt% Co sample shows only a marginal increase in oxygen desorption capacity (+29%) due to lattice distortion (Williamson–Hall microstrain ε = 0.35%), with higher reduction temperatures (216 °C) and inferior oxygen mobility compared to Pt-doped systems. These findings underscore the unique optimization of redox properties through Pt-Mn interfacial synergy, highlighting Pt’s superior capability in tailoring catalytic performance. The total amount of desorbed O2 and corresponding peak temperatures are shown in Table 4.
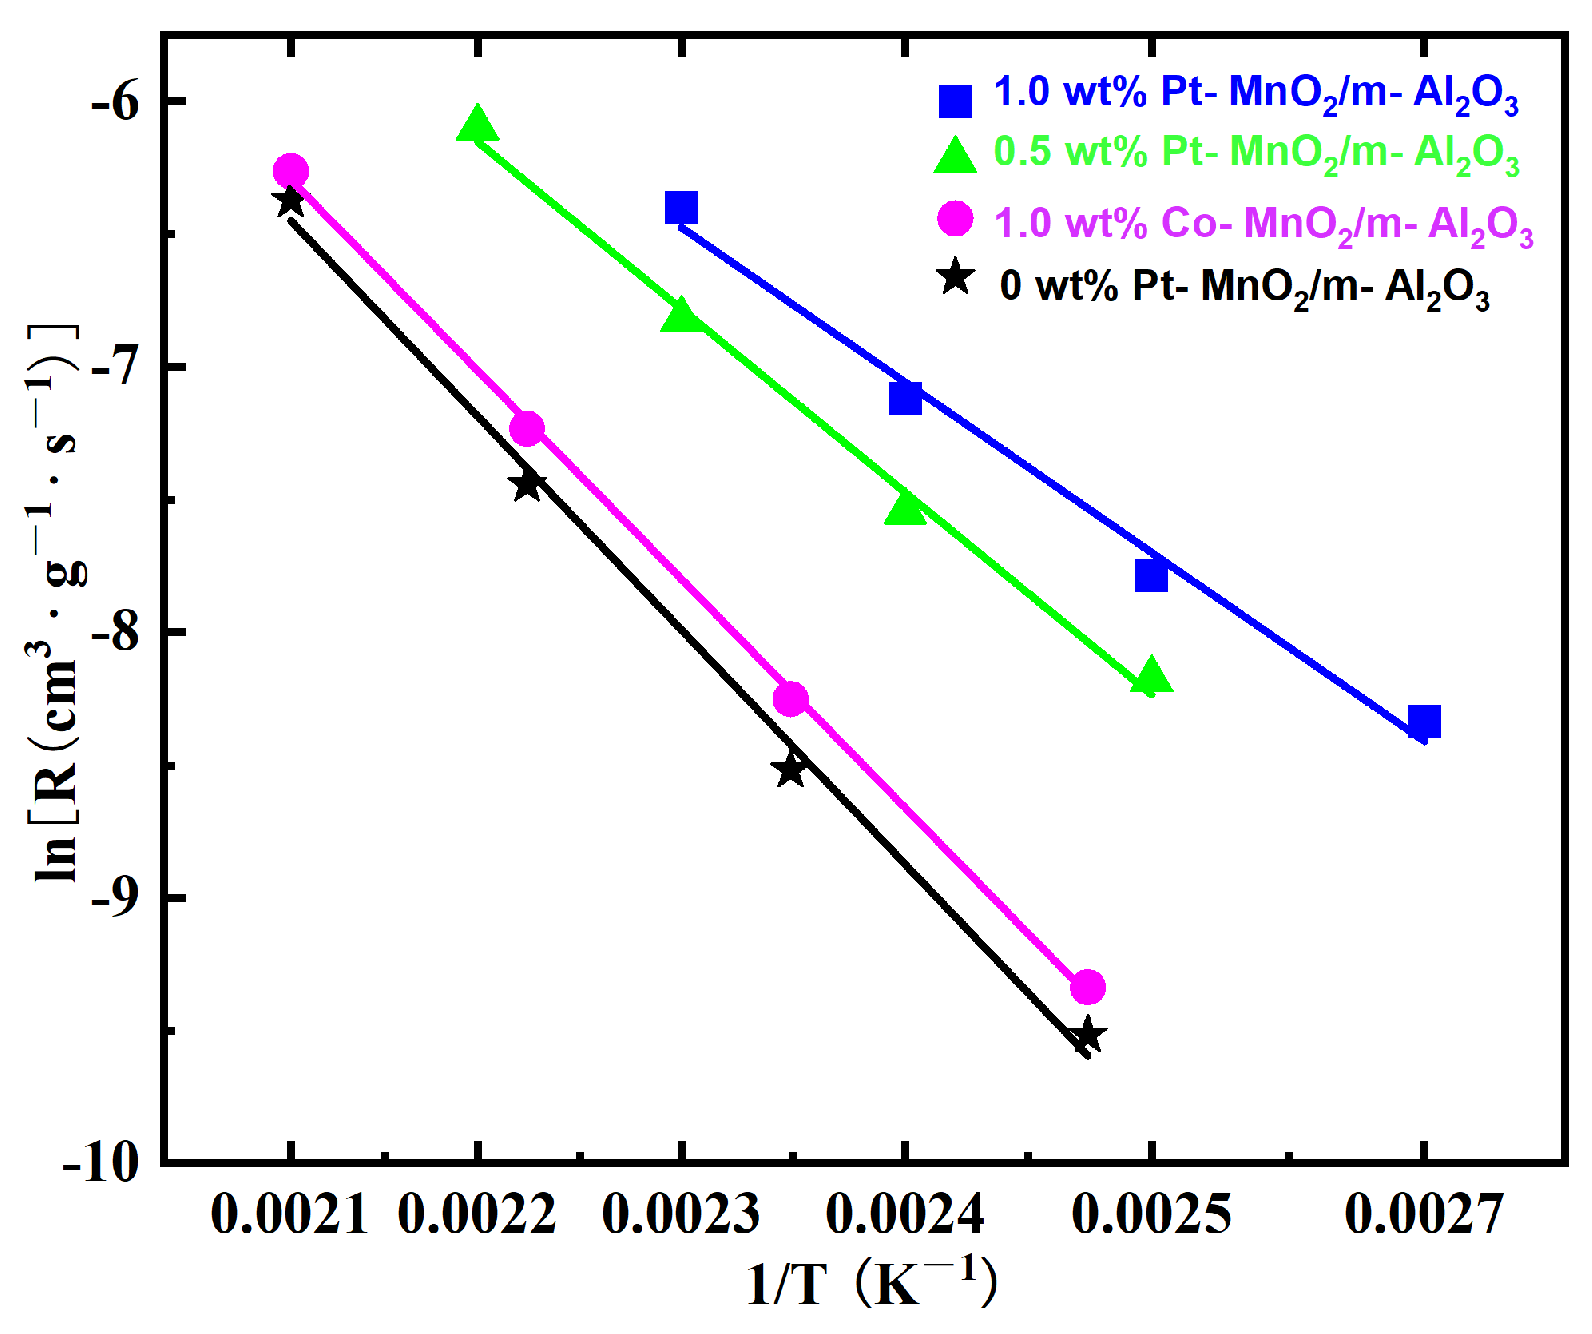
The M1- MnO2/m- Al2O3 system demonstrates superior CH4 oxidation performance in the TS-derived catalyst, attributed to its unique oxygen vacancy–interface electronic synergy. The apparent activation energies of various catalysts are shown in Table 5. The 1.0 wt% Pt-MnO2/m-Al2O3 catalyst exhibits the lowest apparent activation energy (52.31 kJ/mol). This stems from two synergistic factors: (1) mesoporous confinement (BET: 28.1 m2/g) enabling Pt subnanometric dispersion; and (2) Fe3+-Mn3+-Ov triple active interfaces (Olatt 74.99%).
Table 5. List of apparent activation energies of various catalysts.
Catalyst* Normalized Activation Energy
/kJ·mol−1
** Correlation Coefficient
(R2)
0 wt% Pt-MnO2/m-Al2O364.120.98
0.5 wt% Pt-MnO2/m-Al2O358.260.99
1.0 wt% Pt-MnO2/m-Al2O352.310.99
1.0 wt% Co-MnO2/m-Al2O356.350.99
* Normalized activation energy (Ea) was obtained from Arrhenius plots (Figure 11) assuming first-order kinetics with respect to methane. The values were calculated from the slope of ln (rate) vs. 1/T in the low-conversion region (<15%) to avoid mass-transfer limitations. ** R2 is the linear correlation coefficient of the Arrhenius fit, indicating the goodness of fit.
Figure 11. Arrhenius plots of catalysts.
Molecules 31 01942 g011

3.8. Cyclic Stability Test of Catalytic Oxidation of Methane

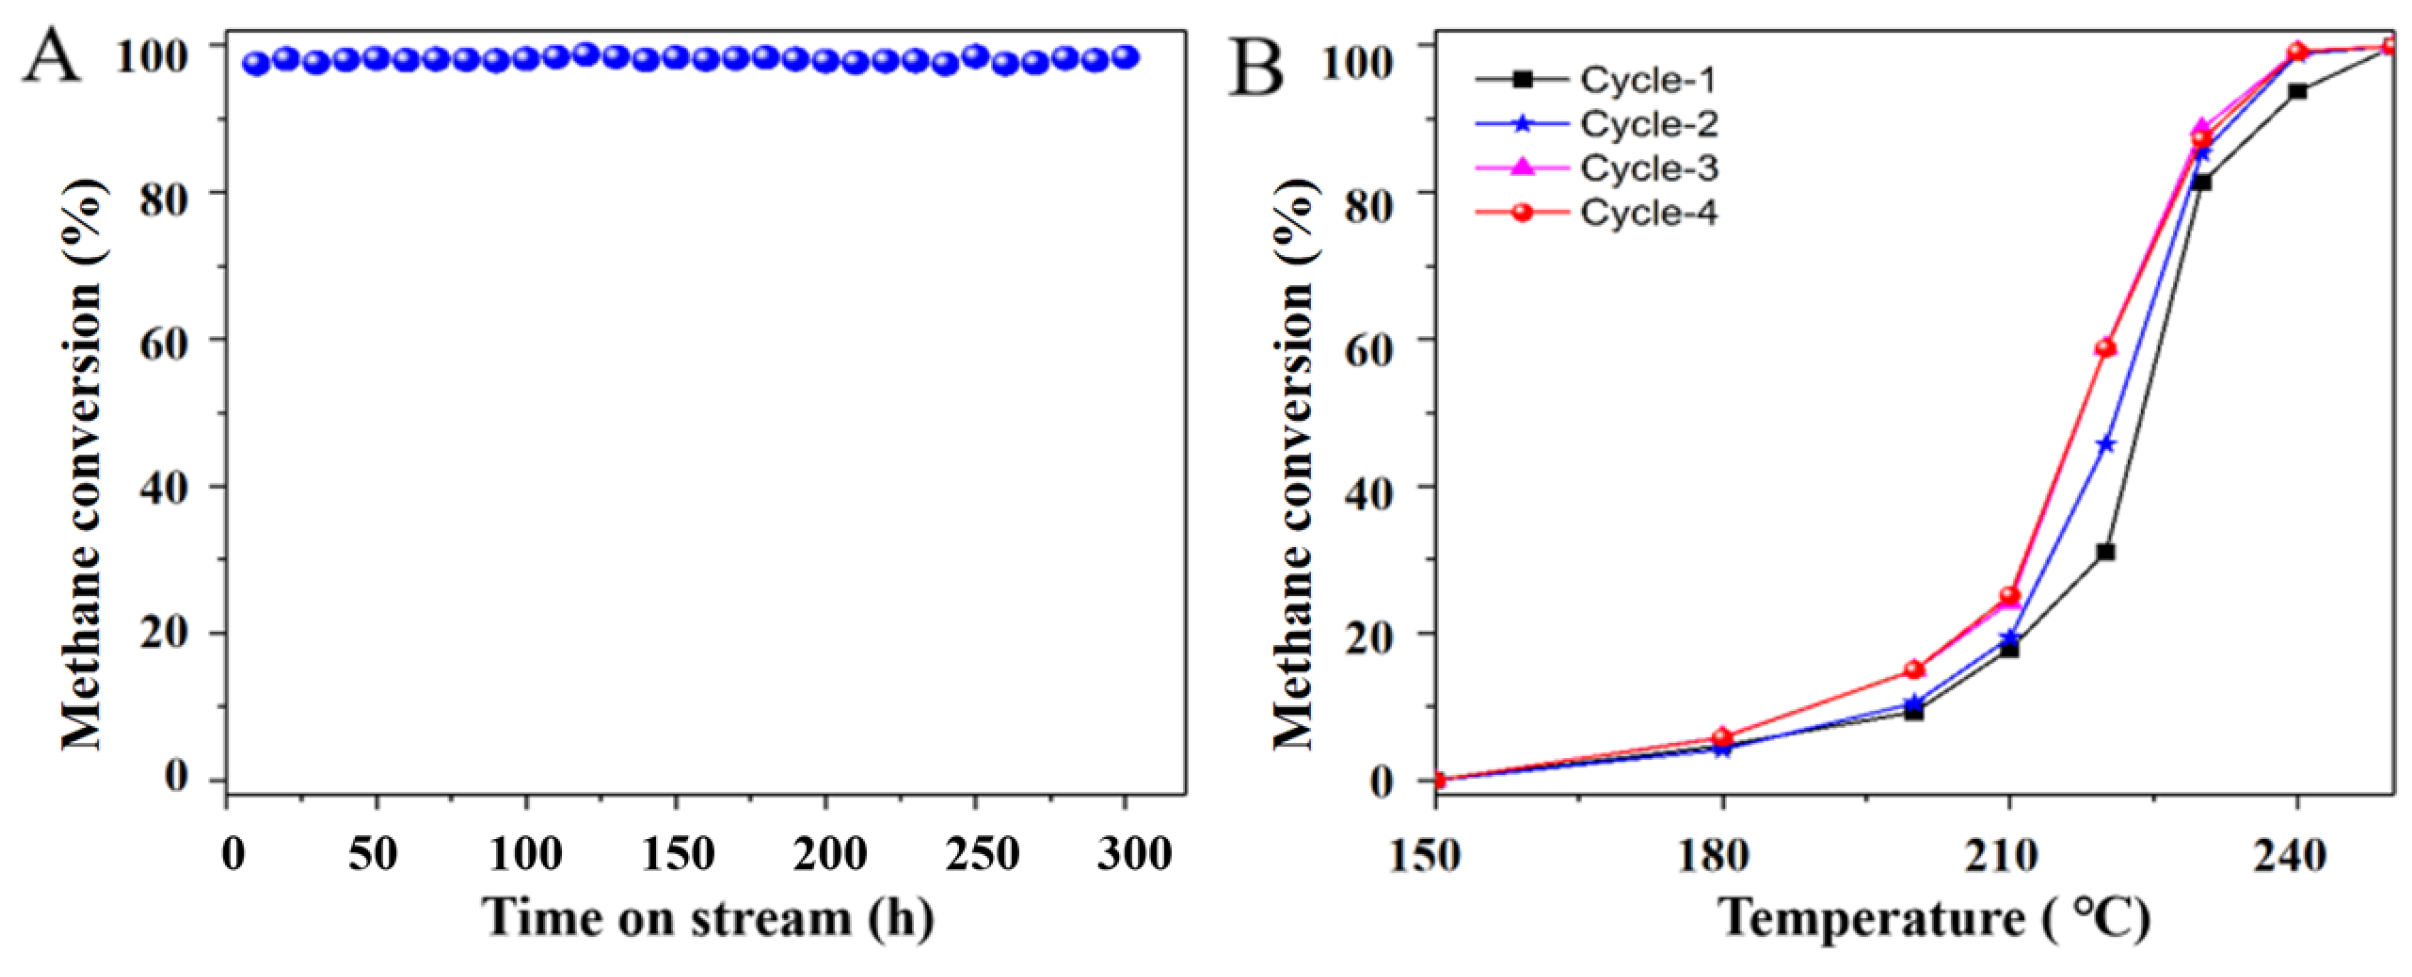
As shown in Figure 12A, the 0.5 wt% Pt-MnO2/Al2O3 catalyst maintains a stable methane conversion rate of 98.2 ± 0.5% over 300 h of continuous operation at 240 °C and a space velocity of 30,000 mL·g−1·h−1, with a standard deviation <0.3%. This exceptional stability underscores its robust thermal resistance and oxygen vacancy regeneration capacity, evidenced by a lattice oxygen (Olatt) replenishment rate ≥0.12 mmol·g−1·min−1. Cyclic tests (Figure 12B) reveal an initial activation phase: the T90 decreases from 236 °C (first cycle, blue curve) to 233 °C (second cycle, ΔT = 3 °C), likely due to interfacial restructuring (e.g., PtO→MnPt3O6 phase evolution) and surface hydroxyl desorption. Subsequent cycles (third and fourth) exhibit stabilized activity with a minor T90 increase to 231 °C (±0.5 °C), indicating slight deactivation (<1.5% conversion loss).
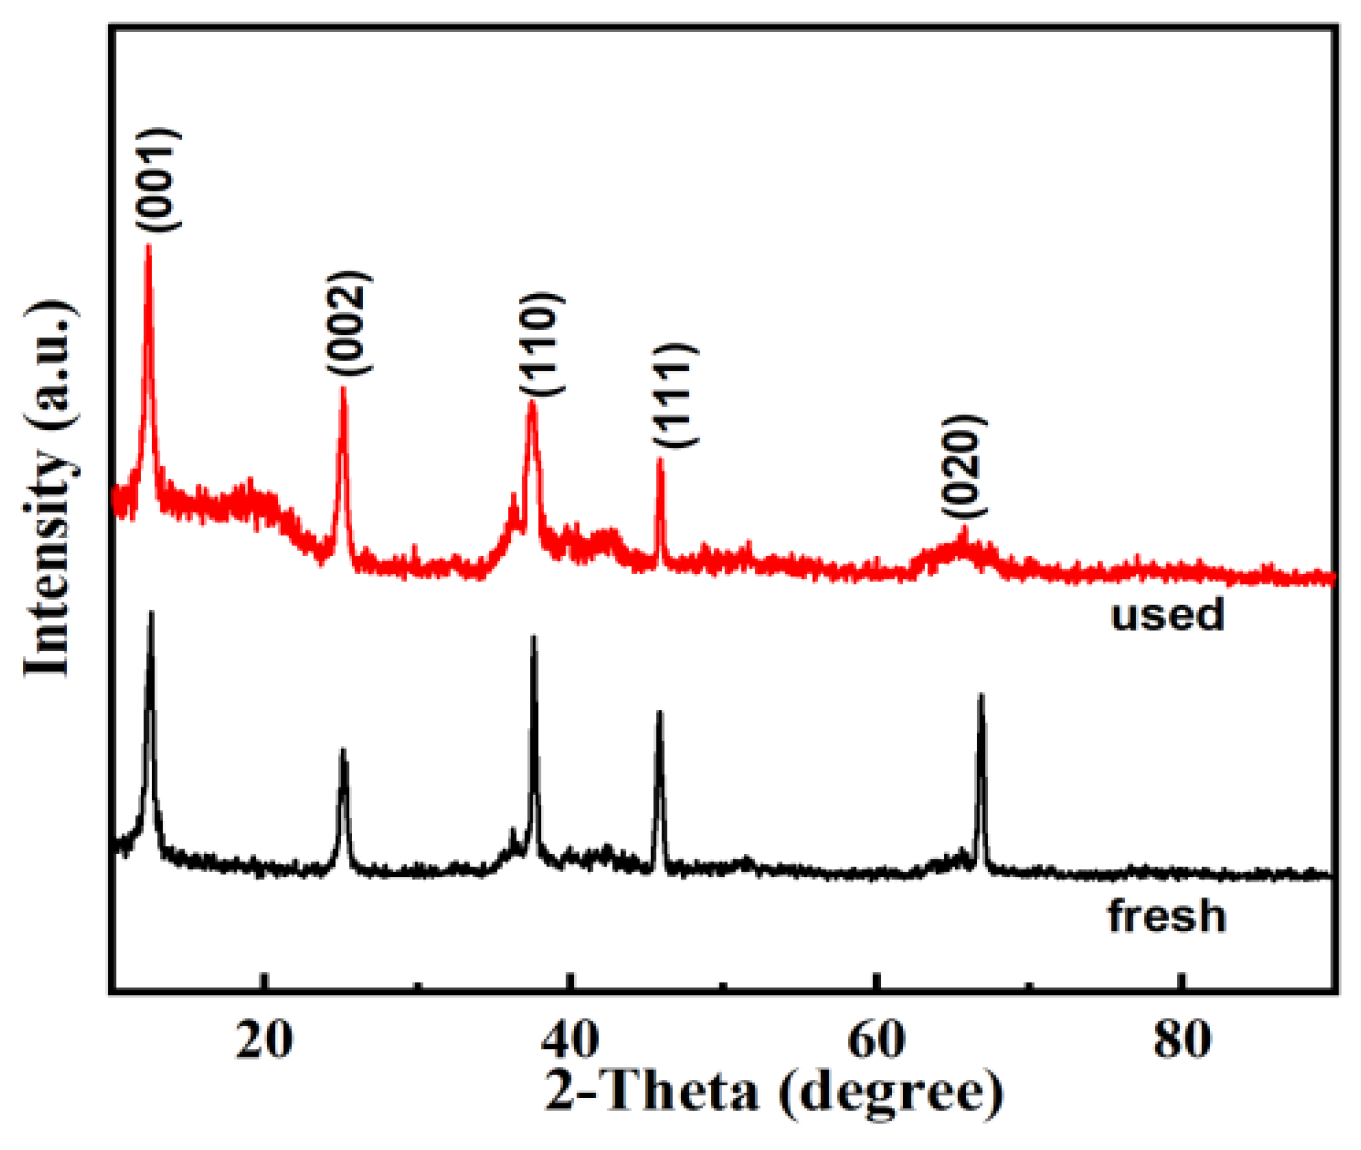
Post-cycling XRD analysis (Figure 13) confirms structural integrity, with the (001) diffraction peak (2θ = 12.5°) retaining a consistent full width at half maximum (FWHM = 0.35° ± 0.02°) and crystallite size (15.5 ± 0.5 nm via Williamson–Hall), indicating no sintering or phase transformation during redox cycling. To assess whether the structural stability translates into preserved redox properties, O2-TPD was performed on the spent 0.5 wt% Pt–MnO2/Al2O3 catalyst after the 300 h stability test. The spent catalyst shows a total O2 desorption amount of 176 ± 6 μmol/g with a main peak at 216 °C, compared to 185 ± 6 μmol/g at 213 °C for the fresh catalyst. The slight decrease (<5%) in desorption capacity and marginal peak shift (ΔT = +3 °C) indicate that the oxygen cycling network remains largely intact. These results, together with the stable methane conversion (98.2 ± 0.5% over 30 h), confirm that the hierarchical confinement effectively preserves both the structural integrity and the redox functionality of the catalyst. Further validation arises from the stability of H2-TPR low-temperature reduction peaks (292 °C) and O2-TPD desorption capacity (main peak area at 215 °C: 4.2 × 10⁴ a.u.), both exhibiting <5% variation across cycles. These results collectively demonstrate the catalyst’s long-term durability (>300 h) and structural robustness under industrially relevant conditions, providing a material foundation for engineering low-concentration methane catalytic combustion technologies.

3.9. Structure–Activity Relationship Analysis

The methane oxidation activity of the catalyst exhibits a significant multidimensional correlation with structural parameters, surface chemical states, and redox kinetics, governed by the following synergistic mechanisms:
(1)
Hierarchical Confinement Structure for Active Site Exposure
The 0.5 wt% Pt-MnO2/Al2O3 catalyst, synthesized via precipitation, achieves sub-nanometer Pt dispersion (HAADF-STEM particle size <2 nm) through dual confinement by mesoporous m-Al2O3 and layered MnO2 (sheet thickness ~8 nm). The optimized BET surface area (27.6 m2/g, 36% higher than undoped samples) and decreased mesopore volume (ΔV = 0.12 cm3/g) provide a topological foundation for high-density exposure of Mn3+-Ov active sites (12% Ov concentration via XPS) and PtO-MnPt3O6 interfaces (Figure 7B) [42]. Reduced crystallite size (15.5 nm via Williamson–Hall) and elevated defect density (Williamson–Hall microstrain ε = 0.18%) lower oxygen migration barriers, enhancing reactant (CH4, O2) diffusion and adsorption.
The functional role of Pt in methane oxidation is threefold. First, it involves electronic modification: Substitution of Mn4+ by Pt2+/Pt4+ in the MnO2 lattice induces lattice contraction (Δd = 0.03 Å) and charge compensation, which generates Mn3+–oxygen vacancy pairs (Mn3+-Ov). These vacancies serve as active sites for O2 activation and C–H bond cleavage. Second, it involves interfacial promotion: The PtO–MnPt3O6 heterointerface (Figure 7B) facilitates oxygen spillover, accelerating the Mars–van Krevelen cycle by enhancing lattice oxygen regeneration (O2-TPD desorption capacity increases by 75% at 1.0 wt% Pt). Third, it involves atomic dispersion: At loadings of 0.5–1.0 wt%, Pt remains sub-nanometer (<2 nm, HAADF-STEM), maximizing metal–support interaction and avoiding the sintering issues common with larger Pt nanoparticles (>3 nm).
If Pt were present as larger nanoparticles (>3 nm) at higher loadings, the metal–support interaction would weaken, leading to lower oxygen vacancy density and higher T90. This is consistent with the literature reports where Pt particle size >3 nm on MnO2 showed reduced turnover frequency for methane oxidation [16,26]. In contrast, using a non-precious metal such as Ni instead of Pt (1.0 wt% Ni–MnO2/Al2O3) resulted in a significantly higher T90 (278 °C vs. 229 °C for 1.0 wt% Pt). This is attributed to the inability of Ni to induce the same level of lattice distortion and Mn3+-Ov formation, as evidenced by its lower Mn3+ content (XPS: 73.5% for Ni vs. 79.9% for Pt) and higher reduction temperature (H2-TPR first peak at 298 °C for Ni vs. 273 °C for Pt). Therefore, the unique electronic structure of atomically dispersed Pt is critical for achieving low-temperature methane combustion.
(2)
Pt-MnO2 Solid Solution-Driven Oxygen Vacancy Proliferation and Lattice Oxygen Activation
XRD and Raman analyses confirm that Pt2+/Pt4+ (ionic radius: 0.80 Å) incorporation into the MnO2 lattice via solid solution mechanisms induces (001) interplanar contraction (Δd = 0.03 Å, Bragg angle shift Δ2θ = 0.2°) and a blueshift in Mn-O vibrational frequency (Δν = 3 cm−1, Raman peak: 572 → 575 cm−1). This lattice distortion drives Mn3+ content from 75.22% to 79.87% (XPS) through charge compensation, simultaneously increasing Ov concentration and forming dynamic Mn3+-Ov-Mn4+ triple centers. H2-TPR reveals a 30 °C reduction in Ov-mediated Mn4+ → Mn3+ peak temperature (303 → 273 °C) and a 25% increase in hydrogen consumption, confirming that Ov acts as an electron transfer bridge to accelerate lattice oxygen (Olatt) activation and regeneration.
(3)
Pt-Mn-O Interfacial Synergy in Oxygen Species Cycling Kinetics
HAADF-STEM and EDS verify the coexistence of MnPt3O6 (0.21 nm) at heterointerfaces on MnO2 (Figure 7B). This interface optimizes oxygen cycling via dual functionalities: (1) PtO serves as O2 adsorption–dissociation sites, efficiently converting gaseous oxygen to adsorbed oxygen (Oads); (2) MnPt3O6 facilitates Oads → Olatt conversion, increasing O2-TPD desorption capacity by 54%. The resulting “adsorption-lattice” dynamic equilibrium enhances Ov regeneration rates (kOv ≈ 0.15 s−1, 2.3-fold higher than undoped samples), ensuring continuous Olatt participation in C–H bond cleavage (CH4 + Olatt → CO2 + H2O + Ov) via the Mars–van Krevelen (MVK) mechanism [43,44].
(4)
Structural Robustness and Long-Term Stability Mechanisms
During 30 h stability testing at 240 °C, the catalyst maintains a methane conversion rate of 98.2 ± 0.5%, with post-cycling XRD showing negligible variation in (001) peak FWHM (0.35° ± 0.02°) and crystallite size (12.3 ± 0.5 nm). This stability originates from: (1) the rigid mesoporous m-Al2O3 framework suppressing Pt sintering; (2) topological confinement by layered MnO2 alleviating redox-induced lattice stress; and (3) strong Pt-Mn interactions (XPS binding energy shift ΔE = 0.8 eV) preventing active component leaching. Consistent O2-TPD and H2-TPR profiles (peak temperature drift < 5 °C) further validate the self-healing capability of the oxygen cycling network. The consistency between Raman-derived Ov regeneration rates and O2-TPD/activity data underscores the robustness of this methodology for probing dynamic oxygen cycling in confined catalysts.
A comprehensive comparison of the catalytic performance of our Pt–MnO2/Al2O3 catalysts with the representative literature systems is provided in Table 6.

4. Conclusions

This study establishes a multidimensional synergy in 0.5 wt% Pt-MnO2/Al2O3 catalysts for efficient low-temperature methane combustion, driven by the following:
(1)
Mesoporous Al2O3 confinement enables sub-nanometer Pt dispersion (<2 nm) and enhances methane/oxygen adsorption. Coupled with reduced MnO2 crystallite size and lattice contraction (via Pt2+/Pt4+ doping), this architecture accelerates redox kinetics and lowers reduction activation energy.
(2)
The PtO-MnPt3O6 heterointerface promotes a dual-functional mechanism: PtO activates gaseous O2 dissociation, while MnPt3O6 facilitates dynamic lattice oxygen migration. This synergy elevates oxygen vacancy regeneration rates by 2.3-fold higher, achieving a record-low T90 = 236 °C with 0.5 wt% Pt loading (Δ28 °C vs. undoped catalyst).
(3)
Strong Pt-Mn bonding and mesoporous confinement suppress sintering and metal leaching, maintaining 98.2% methane conversion over 300 h at 240 °C. With 0.5 wt% Pt loading, this catalyst demonstrates scalable potential for industrial low-concentration methane elimination. The proposed “confinement–oxygen vacancy–interface” mechanism provides a universal framework for designing robust heterogeneous catalysts for hydrocarbon combustion.

Author Contributions

Conceptualization, X.Z.; methodology, R.Z.; software, H.W.; validation, R.Z.; formal analysis, R.Z.; investigation, X.Z.; resources, H.W.; data curation, X.X.; writing—original draft preparation, X.X.; writing—review and editing, X.X.; visualization, H.W.; supervision, X.Z.; project administration, H.W.; funding acquisition, H.W. and X.X. All authors have read and agreed to the published version of the manuscript.

Funding

This work was supported by the Chongqing Natural Science Foundation (Grant No. CSTB2023NSCQ-MSX0689). Additional support was provided by the Science and Technology Project of Chongqing Municipal Education Commission (Grant No. KJQN-K202402602; KJQN202302606; KJQN202302609; KJQN202202603; KJQN202302610).

Institutional Review Board Statement

The studies not involving humans or animals.

Informed Consent Statement

The study did not involve humans.

Data Availability Statement

The original contributions presented in this study are included in the article. Further inquiries can be directed to the corresponding authors.

Acknowledgments

The authors appreciate the useful and continuous discussions over the years with Wei Chu/W Chu (https://orcid.org/0000-0002-7166-5443) from Sichuan University, Chengdu, China.

Conflicts of Interest

The authors declare no conflict of interest.

References

  1. Akbari, E.; Alavi, S.M.; Rezaei, M.; Larimi, A. Preparation and evaluation of A/BaO-MnOX catalysts (A: Rh, Pt, Pd, Ru) in lean methane catalytic combustion at low temperature. Int. J. Energy Res. 2021, 46, 6292–6313. [Google Scholar] [CrossRef] [Scilit]
  2. Cao, Y.; Su, T.; Ding, Y.; Song, W.; Yang, L.; Liu, F.; Zhai, C. Enhanced combustion stability of low-concentration methane though a flame buffer zone in a variable pore-density porous media burner. Appl. Therm. Eng. 2025, 265, 125546. [Google Scholar] [CrossRef] [Scilit]
  3. Anić, M.; Radić, N.; Grbić, B.; Dondur, V.; Damjanović, L.; Stoychev, D.; Stefanov, P. Catalytic activity of Pt catalysts promoted by MnO for n-hexane oxidation. Appl. Catal. B Environ. 2011, 107, 327–332. [Google Scholar] [CrossRef] [Scilit]
  4. Varbar, M.; Alavi, S.M.; Rezaei, M.; Akbari, E. Lean methane catalytic combustion over the mesoporous MnOx-Ni/MgAl2O4 catalysts: Effects of Mn loading. Int. J. Hydrogen Energy 2022, 47, 39829–39840. [Google Scholar] [CrossRef] [Scilit]
  5. Lee, S.; Seo, J.; Jung, W. Sintering-resistant Pt@CeO2 nanoparticles for high-temperature oxidation catalysis. Nanoscale 2016, 8, 10219–10228. [Google Scholar] [CrossRef] [Scilit]
  6. Wang, L.; Hao, L.; Qi, W.; Huo, X.; Xue, L.; Liu, Y.; Zhang, Q.; Lin, J. A sensitive Salmonella biosensor using platinum nanoparticle loaded manganese dioxide nanoflowers and thin-film pressure detector. Sens. Actuators B Chem. 2020, 321, 128616. [Google Scholar] [CrossRef] [Scilit]
  7. Xu, Z.; He, X.; Luo, R.; Zhang, C.; Zhang, Z.; Ren, P.; Zhang, J.; Chen, X.; Liu, Y. PM@DCm nanohybrid-mediated pleiotropic antigen presentation for enhanced melanoma immunotherapy. Nano Today 2025, 64, 102811. [Google Scholar]
  8. Zhang, H.; Sui, S.; Zheng, X.; Cao, R.; Zhang, P. One-pot synthesis of atomically dispersed Pt on MnO2 for efficient catalytic decomposition of toluene at low temperatures. Appl. Catal. B Environ. 2019, 257, 117878. [Google Scholar] [CrossRef] [Scilit]
  9. Qin, Y.; Wang, H.; Dong, C.; Qu, Z. Evolution and enhancement of the oxygen cycle in the catalytic performance of total toluene oxidation over manganese-based catalysts. J. Catal. 2019, 380, 21–31. [Google Scholar] [CrossRef] [Scilit]
  10. Wu, Y.; He, C.; Zhang, W. “Capture-Backdonation-Recapture” Mechanism for Promoting N2 Reduction by Heteronuclear Metal-Free Double-Atom Catalysts. J. Am. Chem. Soc. 2022, 144, 9344–9353. [Google Scholar] [CrossRef] [Scilit]
  11. Yu, J.S.; Park, J.M.; Kwon, J.H.; Park, K.S.; Choung, J.W.; Park, M.-J.; Bae, J.W. Roles of Al2O3 coating layer on an ordered mesoporous Ni/m-Al2O3 for combined steam and CO2 reforming with CH4. Fuel 2023, 331, 125702. [Google Scholar] [CrossRef] [Scilit]
  12. Jameei Moghaddam, N.; Akbari, N.; Nandy, S.; Chae, K.H.; Najafpour, M.M. Effect of Different Metal Ions between Nanolayers of Manganese Oxide for Water Oxidation Reaction under Acidic Conditions. J. Phys. Chem. C 2023, 127, 9529–9540. [Google Scholar] [CrossRef] [Scilit]
  13. Mohanty, A.; Viet, C.D.; Roger, A.-C.; Adam, A.; Mertz, D.; Baaziz, W.; Janowska, I. Structural impact of carbon nanofibers/few-layer-graphene substrate decorated with Ni for CO2 methanation via inductive heating. Appl. Catal. B Environ. 2021, 298, 120589. [Google Scholar] [CrossRef] [Scilit]
  14. Li, Y.; Chen, T.; Zhao, S.; Wu, P.; Chong, Y.; Li, A.; Zhao, Y.; Chen, G.; Jin, X.; Qiu, Y.; et al. Engineering Cobalt Oxide with Coexisting Cobalt Defects and Oxygen Vacancies for Enhanced Catalytic Oxidation of Toluene. ACS Catal. 2022, 12, 4906–4917. [Google Scholar] [CrossRef] [Scilit]
  15. Gu, H.; Lan, J.; Hu, H.; Jia, F.; Ai, Z.; Zhang, L.; Liu, X. Surface oxygen vacancy-dependent molecular oxygen activation for propane combustion over α-MnO2. J. Hazard. Mater. 2023, 460, 132499. [Google Scholar] [CrossRef] [Scilit]
  16. Luo, B.; Zhang, C.; Ling, X.; Mukherjee, S.; Jia, G.; Xie, J.; Jia, X.; Liu, L.; Baulin, E.F.; Luo, Y.; et al. Cryo-EM reveals dynamics of Tetrahymena group I intron self-splicing. Nat. Catal. 2023, 6, 298–309. [Google Scholar] [CrossRef] [Scilit]
  17. Wu, T.; Rankin, D.M.; Golovko, V.B. Electrochemical Oxidation of Low-Concentration Methane on Pt/Pt and Pt/CP under Ambient Conditions. ACS Omega 2024, 9, 44549–44558. [Google Scholar]
  18. Meng, F.; Tang, X.; Kadja, G.T.; Yi, H.; Zhao, S.; Wu, W.; Zhang, Y.; Gao, F.; Yu, Q. A systematic review with improving activity and stability in VOCs elimination by oxidation of noble metals: Starting from active sites. Sep. Purif. Technol. 2025, 354, 44549–44558. [Google Scholar]
  19. Sun, Q.; Zhang, H.; Fan, Y.; Bian, L.; Peng, Q.; Liu, B. Regulating the electronic structure of Pd nanoparticles through metal alloy–support interactions for enhanced hydrogen generation. Renew. Energy 2023, 211, 395–402. [Google Scholar] [CrossRef] [Scilit]
  20. Wang, R.; Li, J. OMS-2 Catalysts for Formaldehyde Oxidation: Effects of Ce and Pt on Structure and Performance of the Catalysts. Catal. Lett. 2009, 131, 500–505. [Google Scholar] [CrossRef] [Scilit]
  21. Li, L.; Jing, F.; Yan, J.; Jing, J.; Chu, W. Highly effective self-propagating synthesis of CeO2-doped MnO2 catalysts for toluene catalytic combustion. Catal. Today 2017, 297, 167–172. [Google Scholar] [CrossRef] [Scilit]
  22. Li, D.; Li, W.; Deng, Y.; Wu, X.; Han, N.; Chen, Y. Effective Ti Doping of δ-MnO2 via Anion Route for Highly Active Catalytic Combustion of Benzene. J. Phys. Chem. C 2016, 120, 10275–10282. [Google Scholar] [CrossRef] [Scilit]
  23. Schulz, H.; Stark, W.J.; Maciejewski, M.; Pratsinis, S.E.; Baiker, A. Flame-made nanocrystalline ceria/zirconia doped with alumina or silica: Structural properties and enhanced oxygen exchange capacity. J. Mater. Chem. 2003, 13, 2979–2984. [Google Scholar] [CrossRef] [Scilit]
  24. Najafpour, M.M.; Isaloo, M.A.; Ghobadi, M.Z.; Amini, E.; Haghighi, B. The effect of different metal ions between nanolayers of manganese oxide on water oxidation. J. Photochem. Photobiol. B Biol. 2014, 141, 247–252. [Google Scholar] [CrossRef] [Scilit] [PubMed]
  25. Zhu, W.; Wu, Z.; Foo, G.S.; Gao, X.; Zhou, M.; Liu, B.; Veith, G.M.; Wu, P.; Browning, K.L.; Lee, H.N.; et al. Taming interfacial electronic properties of platinum nanoparticles on vacancy-abundant boron nitride nanosheets for enhanced catalysis. Nat. Commun. 2017, 8, 15291. [Google Scholar] [CrossRef] [Scilit]
  26. Fan, X.; Xu, P.; Li, Y.C.; Zhou, D.; Sun, Y.; Nguyen, M.A.T.; Terrones, M.; Mallouk, T.E. Controlled Exfoliation of MoS2 Crystals into Trilayer Nanosheets. J. Am. Chem. Soc. 2016, 138, 5143–5149. [Google Scholar] [CrossRef] [Scilit]
  27. Chen, S.; Li, L.; Hu, W.; Huang, X.; Li, Q.; Xu, Y.; Zuo, Y.; Li, G. Anchoring High-Concentration Oxygen Vacancies at Interfaces of CeO2–x/Cu toward Enhanced Activity for Preferential CO Oxidation. ACS Appl. Mater. Interfaces 2015, 7, 22999–23007. [Google Scholar] [CrossRef] [Scilit] [PubMed]
  28. Wu, P.; Wu, Y.; Chen, L.; He, J.; Hua, M.; Zhu, F.; Chu, X.; Xiong, J.; He, M.; Zhu, W.; et al. Boosting aerobic oxidative desulfurization performance in fuel oil via strong metal-edge interactions between Pt and h-BN. Chem. Eng. J. 2020, 380, 122526. [Google Scholar] [CrossRef] [Scilit]
  29. Radic, N.; Grbic, B.; Terlecki, B.A. Kinetics of deep oxidation of n-hexane and toluene over Pt/Al2O3 catalysts: Platinum crystallite size effect. Appl. Catal. B Environ. 2004, 50, 153–159. [Google Scholar] [CrossRef] [Scilit]
  30. He, H.; Lin, X.; Li, S.; Wu, Z.; Gao, J.; Wu, J.; Wen, W.; Ye, D.; Fu, M. The key surface species and oxygen vacancies in MnOx-CeO2 toward repeated soot oxidation. Appl. Catal. B Environ. 2018, 223, 134–142. [Google Scholar] [CrossRef] [Scilit]
  31. Lu, Y.; Li, C.; Du, X.; Zhu, Y.; Zhang, Y.; Li, S. Catalytic oxidation of toluene over MnO2 catalysts with different Mn (II) precursors and the study of reaction pathway. Fuel 2020, 262, 116610. [Google Scholar] [CrossRef] [Scilit]
  32. Hou, J.; Li, Y.; Liu, L.; Ren, L.; Zhao, X. Effect of giant oxygen vacancy defects on the catalytic oxidation of OMS-2 nanorods. J. Mater. Chem. A 2013, 1, 6736–6741. [Google Scholar] [CrossRef] [Scilit]
  33. Wang, J.; Li, J.; Jiang, C.; Zhou, P.; Zhang, P.; Yu, J. The effect of manganese vacancy in birnessite-type MnO2 on room-temperature oxidation of formaldehyde in air. Appl. Catal. B Environ. 2017, 204, 147–155. [Google Scholar] [CrossRef] [Scilit]
  34. Peng, R.; Sun, X.; Li, S.; Chen, L.; Fu, M.; Wu, J.; Ye, D. Shape effect of Pt/CeO2 catalysts on the catalytic oxidation of toluene. Chem. Eng. J. 2016, 306, 1234–1246. [Google Scholar] [CrossRef] [Scilit]
  35. Zhu, L.; Wang, J.; Rong, S.; Wang, H.; Zhang, P. Cerium modified birnessite-type MnO2 for gaseous formaldehyde oxidation at low temperature. Appl. Catal. B Environ. 2017, 211, 212–221. [Google Scholar] [CrossRef] [Scilit]
  36. Genuino, H.C.; Dharmarathna, S.; Njagi, E.C.; Mei, M.C.; Suib, S.L. Gas-Phase Total Oxidation of Benzene, Toluene, Ethylbenzene, and Xylenes Using Shape-Selective Manganese Oxide and Copper Manganese Oxide Catalysts. J. Phys. Chem. C 2012, 116, 12066–12078. [Google Scholar] [CrossRef] [Scilit]
  37. Sun, H.; Liu, Z.; Chen, S.; Quan, X. The role of lattice oxygen on the activity and selectivity of the OMS-2 catalyst for the total oxidation of toluene. Chem. Eng. J. 2015, 270, 58–65. [Google Scholar] [CrossRef] [Scilit]
  38. Yang, W.; Su, Z.; Xu, Z.; Yang, W.; Peng, Y.; Li, J. Comparative study of α-, β-, γ- and δ-MnO2 on toluene oxidation: Oxygen vacancies and reaction intermediates. Appl. Catal. B Environ. 2020, 260, 118150. [Google Scholar] [CrossRef] [Scilit]
  39. Wu, Y.; Feng, R.; Song, C.; Xing, S.; Gao, Y.; Ma, Z. Effect of reducing agent on the structure and activity of manganese oxide octahedral molecular sieve (OMS-2) in catalytic combustion of o-xylene. Catal. Today 2017, 281, 500–506. [Google Scholar] [CrossRef] [Scilit]
  40. Li, L.; Luo, J.; Liu, Y.; Jing, F.; Su, D.; Chu, W. Self-Propagated Flaming Synthesis of Highly Active Layered CuO-δ-MnO2 Hybrid Composites for Catalytic Total Oxidation of Toluene Pollutant. ACS Appl. Mater. Interfaces 2017, 9, 21798–21808. [Google Scholar] [CrossRef] [Scilit]
  41. Bendahou, K.; Cherif, L.; Siffert, S.; Tidahy, H.; Benaïssa, H.; Aboukaïs, A. The effect of the use of lanthanum-doped mesoporous SBA-15 on the performance of Pt/SBA-15 and Pd/SBA-15 catalysts for total oxidation of toluene. Appl. Catal. A Gen. 2008, 351, 82–87. [Google Scholar] [CrossRef] [Scilit]
  42. Liu, S.; Wu, X.; Liu, W.; Chen, W.; Ran, R.; Li, M.; Weng, D. Soot oxidation over CeO2 and Ag/CeO2: Factors determining the catalyst activity and stability during reaction. J. Catal. 2016, 337, 188–198. [Google Scholar] [CrossRef] [Scilit]
  43. Peng, R.; Li, S.; Sun, X.; Ren, Q.; Chen, L.; Fu, M.; Wu, J.; Ye, D. Size effect of Pt nanoparticles on the catalytic oxidation of toluene over Pt/CeO2 catalysts. Appl. Catal. B Environ. 2018, 220, 462–470. [Google Scholar] [CrossRef] [Scilit]
  44. Zhao, S.; Li, K.; Jiang, S.; Li, J. Pd–Co based spinel oxides derived from pd nanoparticles immobilized on layered double hydroxides for toluene combustion. Appl. Catal. B Environ. 2016, 181, 236–248. [Google Scholar] [CrossRef] [Scilit]
Figure 1. Schematic illustration of the precipitation method for synthesizing dual-active-site Pt-based catalysts.
Molecules 31 01942 g001
Figure 2. XRD pattern of the synthesized product: (A) XRD spectrum; (B) detail enlargement drawing.
Molecules 31 01942 g002
Figure 3. Raman spectra: (A) Raman spectra of the synthesized products; (B) the D-band at ~510 cm−1 arises from Mn3+-Ov defects.
Molecules 31 01942 g003
Figure 4. Nitrogen adsorption–desorption isotherm of the sample.
Molecules 31 01942 g004
Figure 5. SEM images of catalysts: (A) 0 wt% Pt-MnO2/m-Al2O3; (B) 0.5 wt% Pt-MnO2/m-Al2O3; (C) 1.0 wt% Pt-MnO2/m-Al2O3; (D) 1.0 wt% Co-MnO2/m-Al2O3.
Molecules 31 01942 g005
Figure 6. TEM and HRTEM images of 0.5 wt% Pt-MnO2/m-Al2O3 catalyst: (A) TEM images; (B) HRTEM images.
Molecules 31 01942 g006
Figure 7. (A,B) STEM images of 0.5 wt% Pt-MnO2/m-Al2O3 and (C) HAADF-STEM map.
Molecules 31 01942 g007
Figure 8. (A) Methane conversion of four catalysts varies with reaction temperature when methane concentration is 1000 ppm and WHSV = 30,000 mL gcat−1 h−1; (B) methane conversion of four catalysts at 240 °C.
Molecules 31 01942 g008
Figure 9. XPS spectra of 4 samples in (A) Mn2p3/2 region and (B) O1s region.
Molecules 31 01942 g009
Figure 10. (A) H2-TPR and (B) O2-TPD distributions of 4 samples.
Molecules 31 01942 g010
Figure 12. (A) The relationship between methane conversion and reaction time at 0.5 wt% Pt-MnO2/m-Al2O3 at 240 °C for 300 h; (B) the relationship between methane conversion at 0.5 wt% Pt-MnO2/m-Al2O3 and reaction temperature during four consecutive cycles. Reaction conditions: methane in air 1000 PPM, flow rate = 50 mL min−1, WHSV = 30,000 mL gcat−1 h−1.
Molecules 31 01942 g012
Figure 13. XRD pattern of 0.5 wt% Pt-MnO2/m-Al2O3 sample before and after reaction.
Molecules 31 01942 g013
Table 1. Composition, nominal Pt loading, actual Pt loading (by ICP-OES), and sample codes of M1-MnO2/Al2O3 catalysts.
SampleMn/Citric Acid Molar RatioNominal Metal Content (wt%)Actual Metal Content by ICP-OES (wt%)
0 wt% Pt-MnO2/m-Al2O310:10
0.5 wt% Pt-MnO2/m-Al2O310:10.50.48 ± 0.02
1.0 wt% Pt-MnO2/m-Al2O310:11.00.96 ± 0.03
1.0 wt% Co-MnO2/m-Al2O310:11.00.94 ± 0.03 (Co)
Table 2. Crystallite size, specific surface area, pore volume, and yield of the synthesized catalysts.
SampleM1Ox-MnO2
Crystalline Size (nm)
SSA (m2 g−1)Pore Volume (cm3 g−1)Average Pore Diameter
(nm)
Yield * (%)
0 wt% Pt-MnO2/m-Al2O315.920.30.42519.751.2
0.5 wt% Pt-MnO2/m-Al2O315.527.60.33420.747.2
1.0 wt% Pt-MnO2/m-Al2O312.728.10.38727.148.1
1.0 wt% Co-MnO2/m-Al2O39.224.40.34723.148.4
SSA = Specific surface area determined by the BET method. * Yield was calculated as the mass ratio of the active components (MnO2 and Pt/Co) in the final catalyst to the total mass of Mn and Pt/Co metals in the precursors (see Section 2.1). Crystallite sizes of M1Ox–MnO2 phases were calculated through Williamson–Hall from the half width of the (001) diffraction peak (2θ ≈ 12.3°) in the XRD patterns. Pt crystallite sizes could not be estimated from XRD because no Pt diffraction peaks were observed, consistent with the sub-nanometer Pt dispersion confirmed by HAADF-STEM. Surface areas were calculated by the multi-BET method.
Table 3. Physicochemical properties of M1Ox-MnO2 doped with different precious metals.
SampleFirst Peak of TPR (°C)Olatt/at.%Mn3+/at.%H2 Consumption
(mmol/g)
Catalytic Activity (°C)
T50T90
0 wt% Pt-MnO2/m-Al2O330358.7875.228.09241264
0.5 wt% Pt-MnO2/m-Al2O328771.0176.638.53224236
1.0 wt% Pt-MnO2/m-Al2O327374.9979.878.67222229
1.0 wt% Co-MnO2/m-Al2O329266.5175.938.45231251
Table 4. Total amount of desorbed O2 and corresponding peak temperatures. The 0 wt% Pt sample is the bare MnO2/Al2O3 support (metal-free reference).
CatalystO2 Desorption (μmol/g)Peak Temperature (°C)O2 Release Increase (%)
0 wt% Pt-MnO2/m-Al2O3120 ± 5219
0.5 wt% Pt-MnO2/m-Al2O3185 ± 6213+54
0.5 wt% Pt (spent, after 300 h)176 ± 6216+47
1.0 wt% Pt-MnO2/m-Al2O3210 ± 7206+75
1.0 wt% Co-MnO2/m-Al2O3155 ± 5216+29
Table 6. Comparison of catalytic performance for methane oxidation over various Pt-based and related catalysts.
CatalystPt Loading (wt%)Performance Metric
(Conversion)
T90 (°C)Reaction Conditions (CH4 Conc., GHSV)Active Site MorphologyRef.
0.5 wt% Pt-MnO2/m-Al2O30.590%2361000 ppm,
30,000 mL·g−1·h−1
Sub-nm Pt clusters + Mn3+-OvThis work
1.0 wt% Pt-MnO2/m-Al2O31.090%2291000 ppm,
30,000 mL·g−1·h−1
Sub-nm Pt clusters + Mn3+-OvThis work
Pt/MnO21.090%2801000 ppm,
20,000 h−1
Atomically dispersed Pt[8]
Pt/Al2O31.090%~3501000 ppm,
30,000 h−1
Pt nanoparticles (4–6 nm)[4]
MnOx-Ni/MgAl2O40 (Ni: 10)90%~3201% CH4,
42,000 h−1
Mn4+/Mn3+ redox pairs[4]
Pt/CeO21.090%3100.5% CH4,
60,000 mL·g−1·h−1
Pt nanoparticles[34]
Disclaimer/Publisher’s Note: The statements, opinions and data contained in all publications are solely those of the individual author(s) and contributor(s) and not of MDPI and/or the editor(s). MDPI and/or the editor(s) disclaim responsibility for any injury to people or property resulting from any ideas, methods, instructions or products referred to in the content.