Article

Vibronic Spectroscopy and Cationic Features of p-Diethynylbenzene: Insights into Electronic Conjugation and Accidental Resonances

1
State Key Laboratory of Quantum Optics Technologies and Devices, Institute of Laser Spectroscopy, Shanxi University, Taiyuan 030006, China
2
Department of Physics and Electronics Engineering, Jinzhong University, Jinzhong 030619, China
3
Collaborative Innovation Center of Extreme Optics, Shanxi University, Taiyuan 030006, China
*
Author to whom correspondence should be addressed.
Molecules 2026, 31(10), 1741; https://doi.org/10.3390/molecules31101741
Submission received: 23 April 2026 / Revised: 13 May 2026 / Accepted: 18 May 2026 / Published: 20 May 2026
(This article belongs to the Special Issue 30th Anniversary of Molecules—Recent Advances in Physical Chemistry)

Abstract

We report a comprehensive spectroscopic investigation of p-diethynylbenzene (pDEB) using two-color resonance-enhanced multiphoton ionization (REMPI) and mass-analyzed threshold ionization (MATI) spectroscopy, complemented by density functional theory (DFT) calculations. The S1 ← S0 electronic origin is observed at 34,255 ± 2 cm−1. The adiabatic ionization energy (IE) is determined to be 69,095 ± 5 cm−1 from two-color MATI spectra recorded via the S1 origin. Notably, a narrow peak is observed at 32 cm−1 above the IE in the two-color MATI spectrum, which is assigned to a one-color, two-photon accidental resonance arising from the near-resonant condition where the S1 ← S0 transition energy (34,255 cm−1) is close to half of the IE (69,099/2 = 34,549.5 cm−1). This observation is consistent with similar reports for p-chlorofluorobenzene and p-difluorobenzene. Franck–Condon simulations show good agreement with the experimental spectra. The present results provide a spectroscopic basis for identifying pDEB and distinguishing it from its ortho and meta isomers.

1. Introduction

Diethynylbenzenes (DEBs) are important building blocks for the synthesis of novel conjugated polymers, molecular wires, and advanced optical materials [1,2,3]. Among the three isomers (ortho, meta, and para), p-diethynylbenzene (pDEB) has attracted particular interest due to its linear geometry and extended π-conjugation, which make it an ideal candidate for studying charge transport and electronic communication along molecular backbones [4,5]. Understanding the geometric and electronic structural changes in pDEB upon excitation and ionization is crucial for elucidating its charge transport mechanisms in molecular wire applications. Specifically, the adiabatic ionization energy (IE) and the vibrational frequencies of the cationic ground state (D0) serve as fundamental parameters for evaluating the stability and reactivity of charge carriers in pDEB-based materials. However, detailed spectroscopic characterization of pDEB in its electronically excited and cationic states remains limited, hindering a comprehensive understanding of its structure–property relationships.
The vibronic spectroscopy of pDEB has been previously investigated by Stearns and Zwier using resonant two-photon ionization (R2PI) and resonant ion-dip infrared spectroscopy [6]. They reported the S1 ← S0 origin at 34,255 cm−1 and identified several vibronic bands, with the spectrum dominated by false origins arising from vibronic coupling between the S1 (1B2u) and S2 (1B1u) states. However, a comprehensive vibrational analysis of the cation ground state (D0) has not been reported to date.
Resonance-enhanced multiphoton ionization (REMPI) [7,8,9,10,11] and mass-analyzed threshold ionization (MATI) spectroscopy [12,13,14,15,16] have proven to be powerful tools for investigating the vibronic structure of molecules in the gas phase. By combining supersonic jet cooling with mass-selective detection, these techniques allow unambiguous assignment of vibrational features for individual isomers, free from spectral congestion caused by impurities or conformational mixtures [17,18,19,20]. Moreover, MATI spectroscopy provides high-resolution information about the cation ground state (D0), including precise ionization energies (IEs) and vibrational frequencies [21,22,23,24,25,26,27,28].
An accidental resonance phenomenon is commonly observed in high-resolution MATI and ZEKE (zero kinetic energy) spectral analyses [29,30,31,32,33,34]. Such resonance signals typically appear as unexpected narrow peaks, whose width is significantly narrower than that of typical two-color MATI spectral bands, and cannot be assigned to a cation vibrational transition based on Franck–Condon considerations or calculated frequencies. Physically, this type of resonance originates from a one-color, two-photon excitation process, where the ionization laser alone (without the pump laser) excites the molecule from S0 to high-n Rydberg states via a single-color, two-photon process, followed by pulsed field ionization. Such accidental resonances are generally possible when the S1 ← S0 transition energy is close to half of the IE.
In this paper, we present a detailed spectroscopic investigation of pDEB using two-color R2PI and MATI techniques. A complete vibrational assignment is provided for both the S1 and D0 states. We discuss the observed accidental resonance in the MATI spectra and rationalize its occurrence based on the energy level structure of pDEB. Finally, we analyze the geometric changes upon electronic excitation and ionization with the aid of theoretical calculations.

2. Results

2.1. Two-Color R2PI Spectra of pDEB

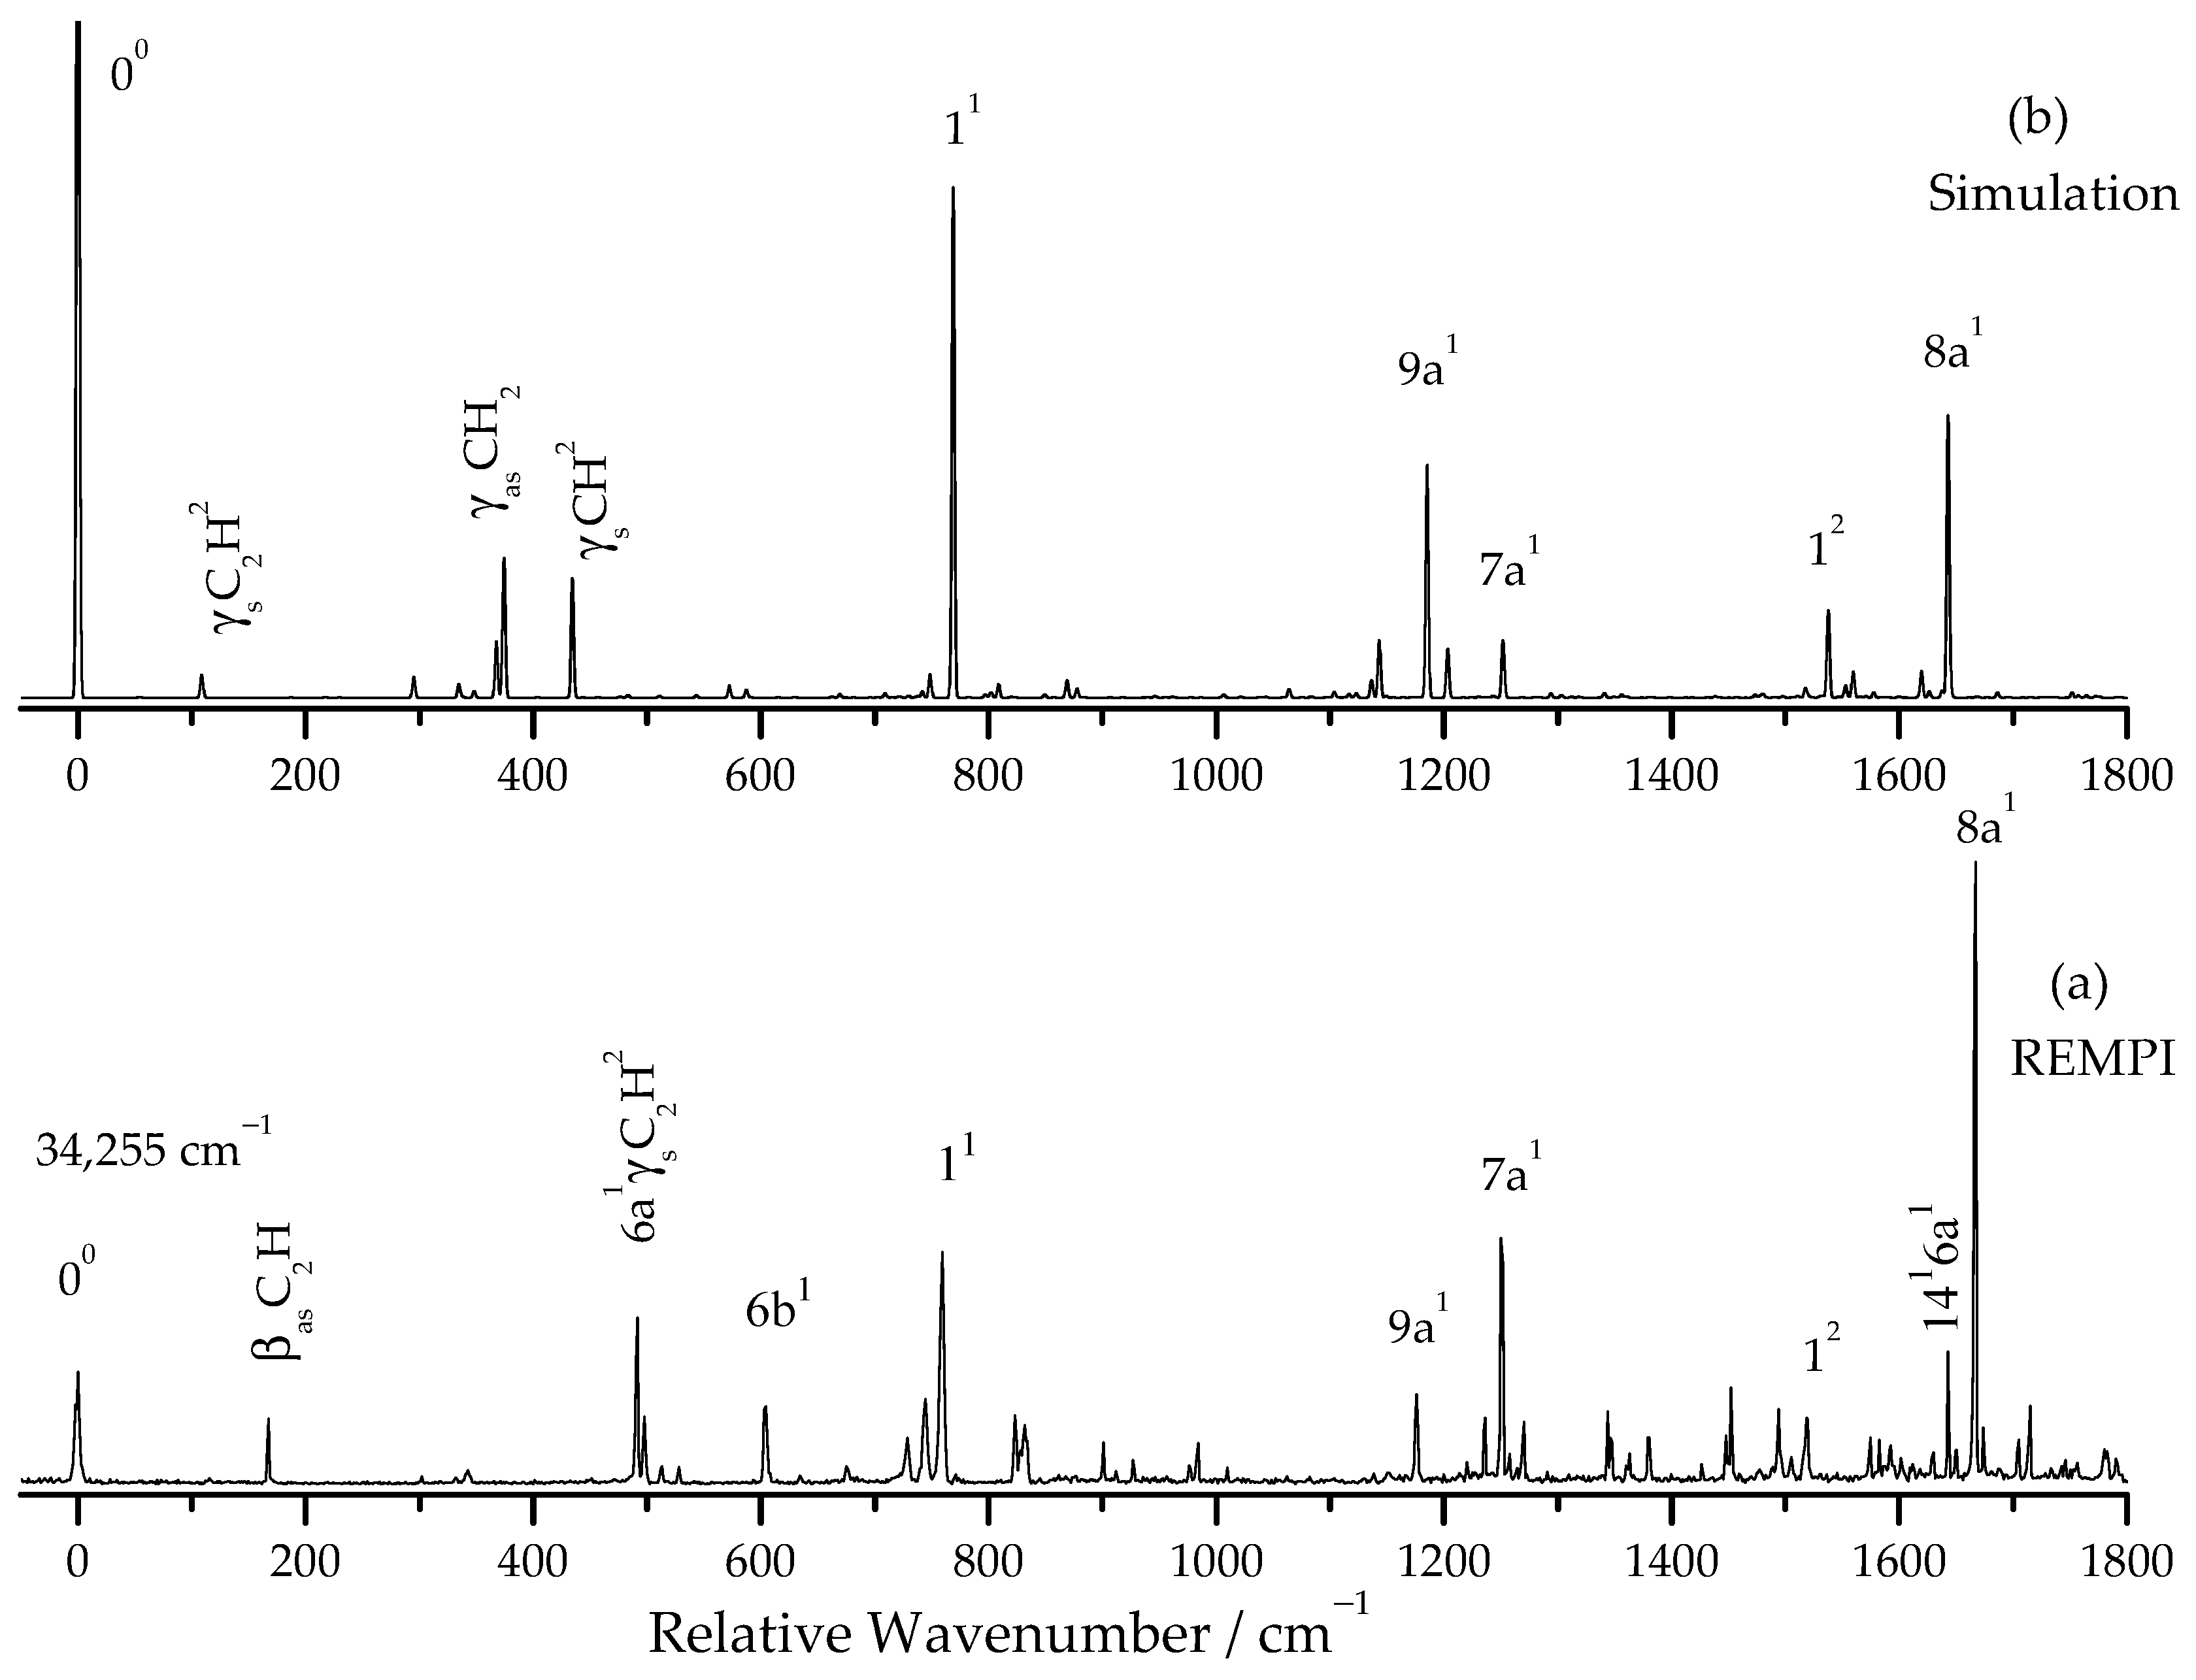
Figure 1a shows the two-color R2PI spectrum of pDEB in the vibrational frequency range of 0–1800 cm−1 (corresponding to excitation energies: 34,000–36,100 cm−1). The S1 ← S0 electronic origin is observed at 34,255 ± 2 cm−1, consistent with the value reported by Stearns and Zwier [6]. Table 1 presents the observed vibronic bands with their relative intensities, shifts from the origin, calculated frequencies, and assignments. The numbering system for ring vibrations follows Wilson notation [35,36], while substituent vibrations are designated using Greek letters with subscripts “s” and “as” to denote symmetric and antisymmetric motions, respectively.
The most intense bands in the spectrum are assigned to ring modes: 11 (breathing) at 759 cm−1, 6b1 at 604 cm−1, 9a1 at 1176 cm−1, 7a1 at 1250 cm−1, and 8a1 at 1667 cm−1. These assignments are consistent with those reported for phenylacetylene [37] and p-diethynylbenzene [6]. Several low-frequency bands are observed below 500 cm−1, including features at 167, 302, 332, and 492 cm−1, which are assigned to out-of-plane and in-plane bending modes involving the ethynyl substituents.

2.2. Two-Color MATI Spectrum and Observation of an Accidental Resonance

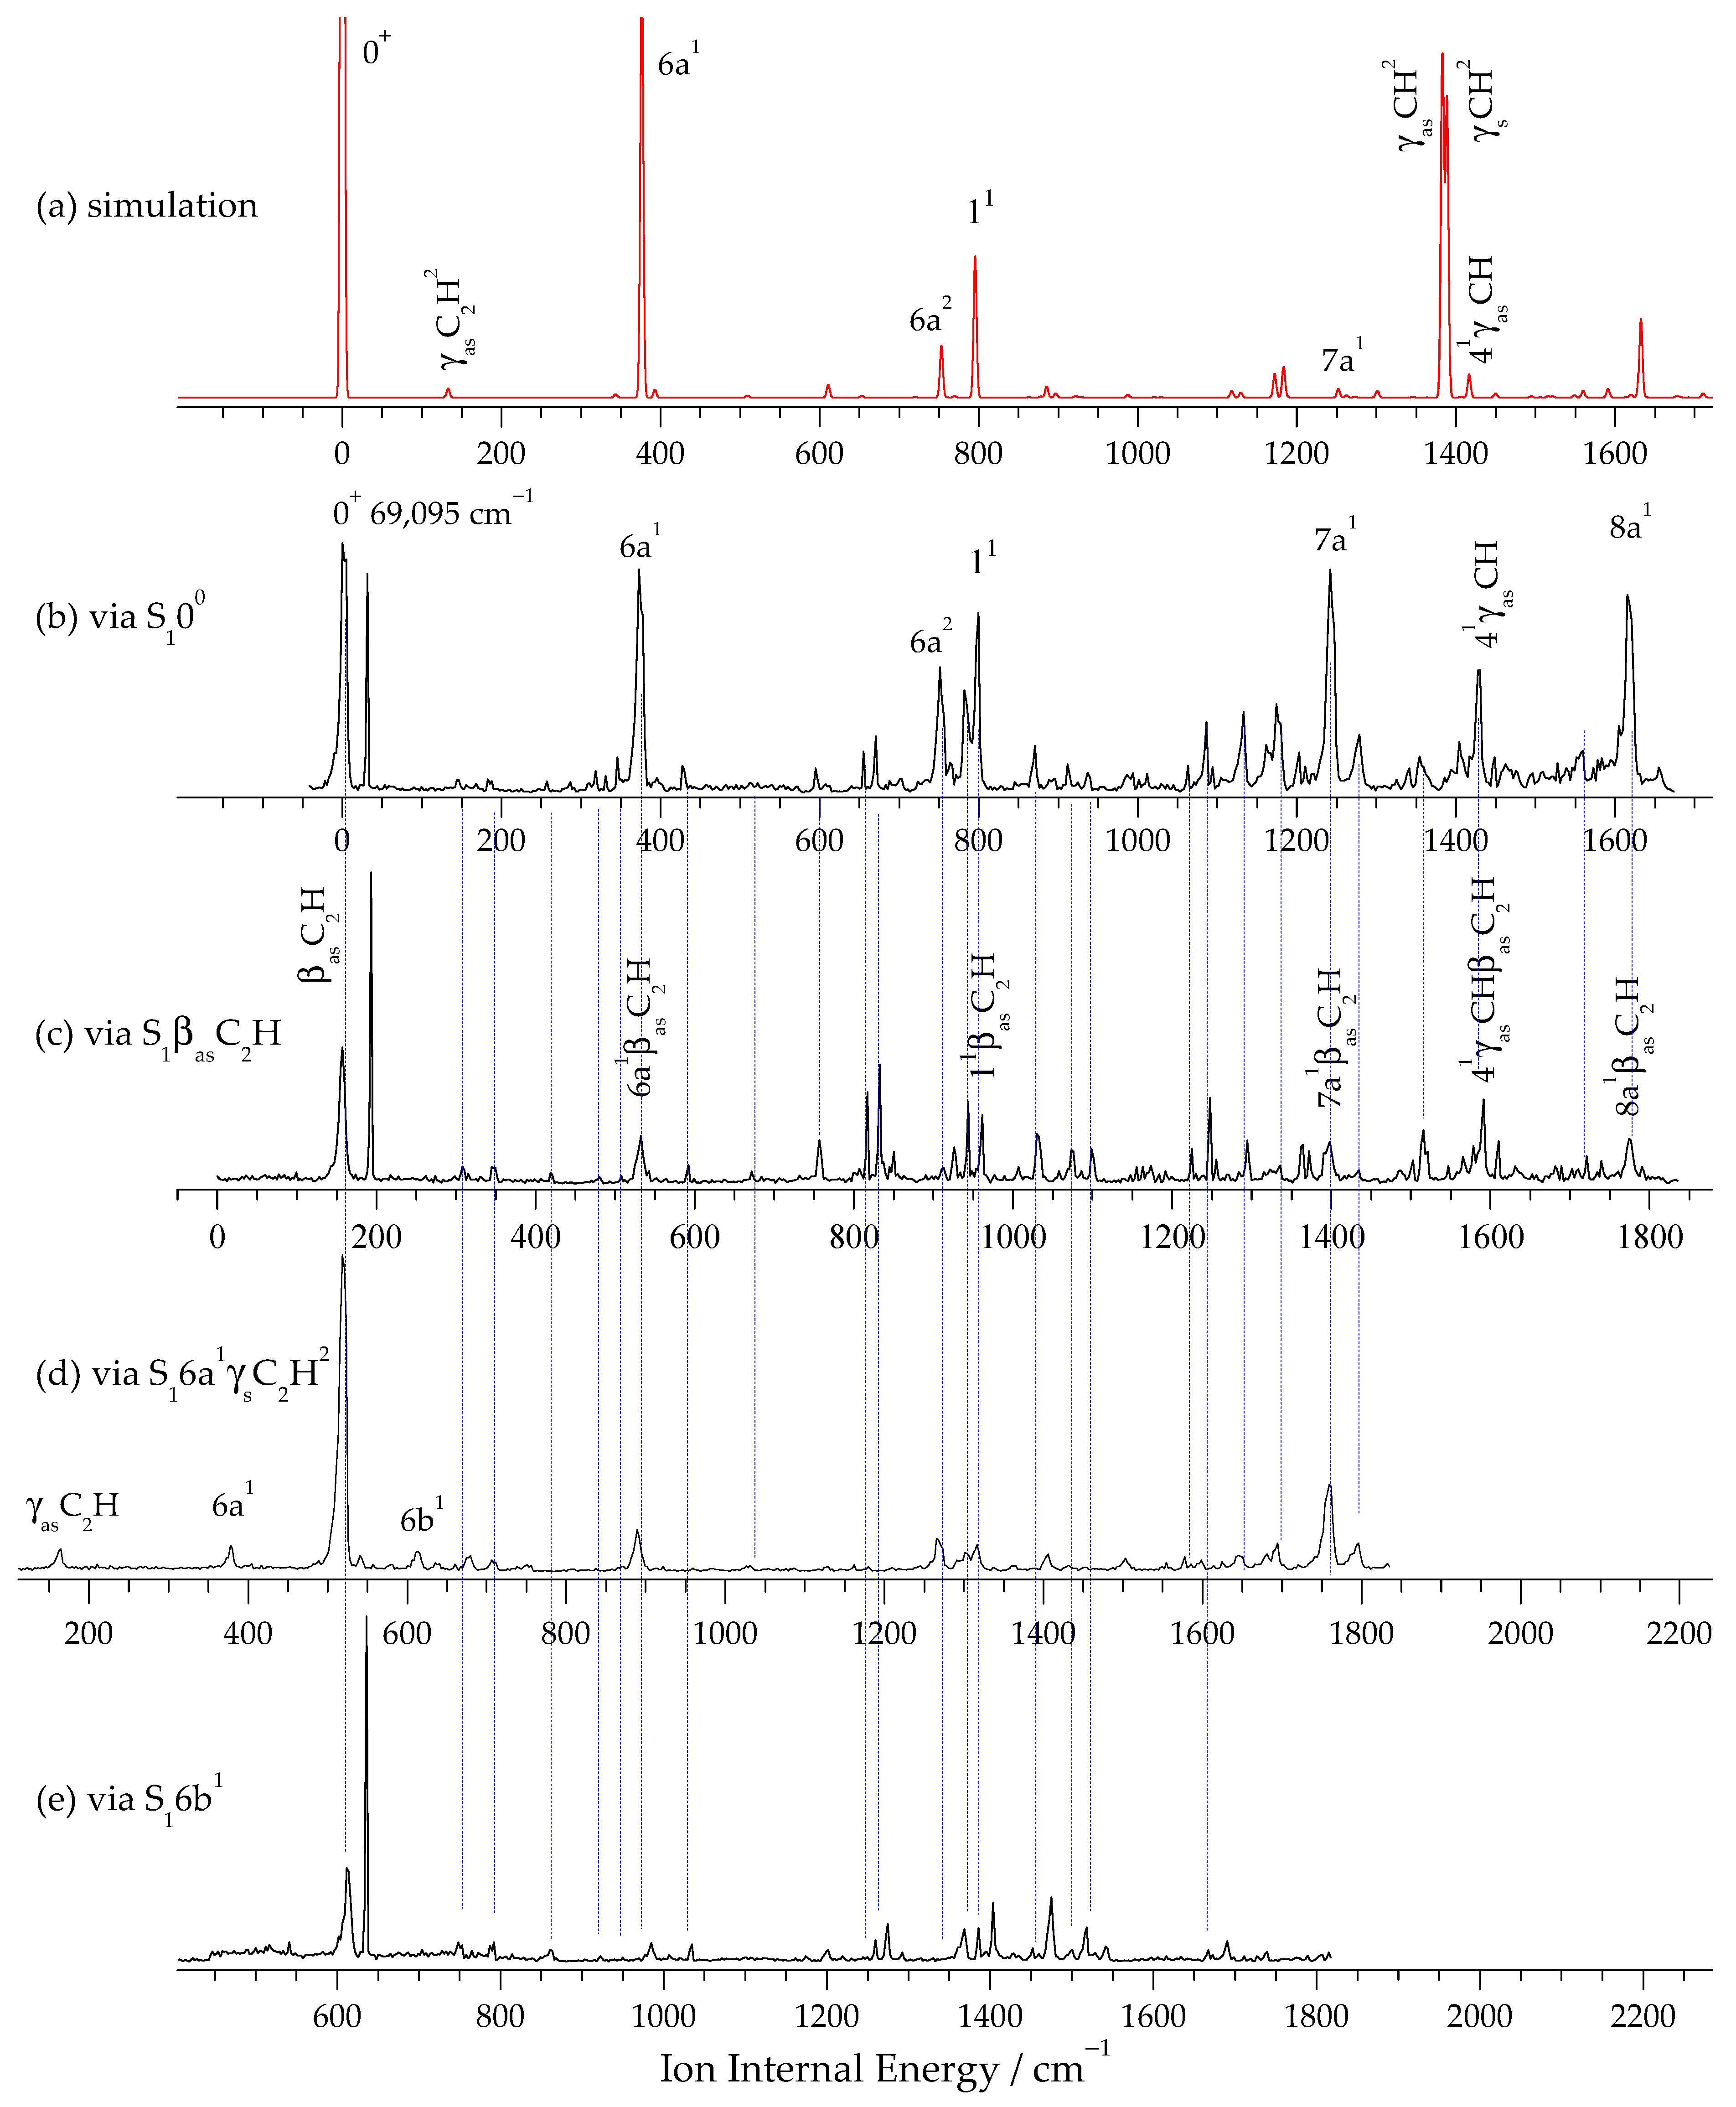
Figure 2a shows the Franck–Condon simulation, which is in good agreement with the experimental MATI spectrum (Figure 2b), supporting the vibrational assignments. The simulated spectrum was generated using the TD-DFT-optimized geometries and frequencies for the S1 and D0 states, with appropriate scaling factors of 0.98.
Figure 2b shows the two-color MATI spectrum of pDEB recorded by ionizing through the S100 level (34,255 cm−1). The spectrum exhibits a strong origin band, which corresponds to an adiabatic ionization energy (IE) of 69,095 ± 5 cm−1 (including a Stark shift correction of +4√F = +4√0.9 ≈ +3.8 cm−1). This IE value is in excellent agreement with the G4 and CBS-QB3 predictions (69,138 and 69,141 cm−1, respectively).
The vibrational frequencies of the pDEB cation (D0 state) are summarized in Table 2. The most intense bands correspond to totally symmetric ring modes, including 11 at 799 cm−1, 6a1 at 373 cm−1, and 9a1 at 1203 cm−1. The frequencies of these modes in the D0 state are slightly higher than those in the S1 state, reflecting the increased force constants upon removal of a π electron. For example, the breathing mode (11) shifts from 759 cm−1 in S1 to 799 cm−1 in D0.
In Figure 2b, an unexpected narrow peak is observed at approximately 32 cm−1 above the cationic origin 0+. This peak has a full width at half-maximum (FWHM) of approximately 2–3 cm−1, which is significantly narrower than the typical two-color MATI bands (FWHM ~7–10 cm−1) and cannot be assigned to any cation vibrational transition (D0 ← S1 00) based on Franck–Condon calculations or known vibrational frequencies of the pDEB cation. This phenomenon has been observed and analyzed in detail for several molecules. The underlying principle involves the ground-state molecule simultaneously absorbing two photons of the same frequency from the ionization laser (or a single strong laser) to reach Rydberg states, followed by pulsed-field ionization and detection. That is, it arises from a one-color, two-photon process. The probability of two-photon absorption is significant only under near-resonant conditions, making it readily observable. Specifically, this occurs when a molecule possesses an actual energy level very close to half the energy difference between the Rydberg state and the electronic ground state. Timothy G. Wright’s group has conducted detailed studies on this phenomenon, referring to it as an accidental resonance [31].
Figure 2c shows the MATI spectrum recorded via the intermediate state S1 βasC2H. This MATI spectrum is assigned to combination vibrations involving the βasC2H intermediate-state mode and the MATI-active modes observed via S1 00. The one-to-one correspondence between them is indicated by blue vertical lines in the figure. This implies that the ion retains the motion of the intermediate state. The accidental resonance is also observed. The strongest MATI peak appears at a shift of 158 cm−1 and is assigned to the cationic in-plane bending mode of the ethynyl group, βasC2H, consistent with the intermediate state mode. This Δν = 0 propensity rule indicates that the molecular structure does not undergo significant change upon transition from the excited state to the cationic ground state.
Figure 2d presents the MATI spectrum measured via the relatively strong intermediate state S1 6a1γsC2H2, achieving excellent signal-to-noise ratio and resolution. Similar to Figure 2c, apart from three new fundamental vibrations (γasC2H, 6a, 6b) observed on the low-frequency side, all other vibrational bands are assigned to combination vibrations involving the intermediate-state mode 6a1γsC2H2 and the MATI-active modes observed via S1 00. Another notable difference is that the MATI signal intensity is more than double that obtained via other intermediate states, while the accidental resonance line is not observed. This is likely due to a competitive effect between accidental resonance and conventional MATI. As can be seen from the REMPI spectrum in Figure 1a, the strong signal of this intermediate state indicates a large transition dipole moment from the ground state to this vibrational mode, resulting in a high population. Consequently, more molecules absorb the ionizing photon to reach the Rydberg state, leading to a stronger MATI signal. In other words, the ionizing photon is heavily absorbed during the two-color MATI process, making the one-color two-photon absorption—a nonlinear process required for accidental resonance—nearly impossible due to insufficient light intensity. Therefore, the accidental resonance line is not observed.
Figure 2e, similar to Figure 2c, shows no new fundamental vibrations; all signals can be assigned to combination vibrations of the intermediate-state mode 6b with the vibrations observed in Figure 2b.

3. Discussion

3.1. Molecular Geometry in the S0, S1, and D0 States

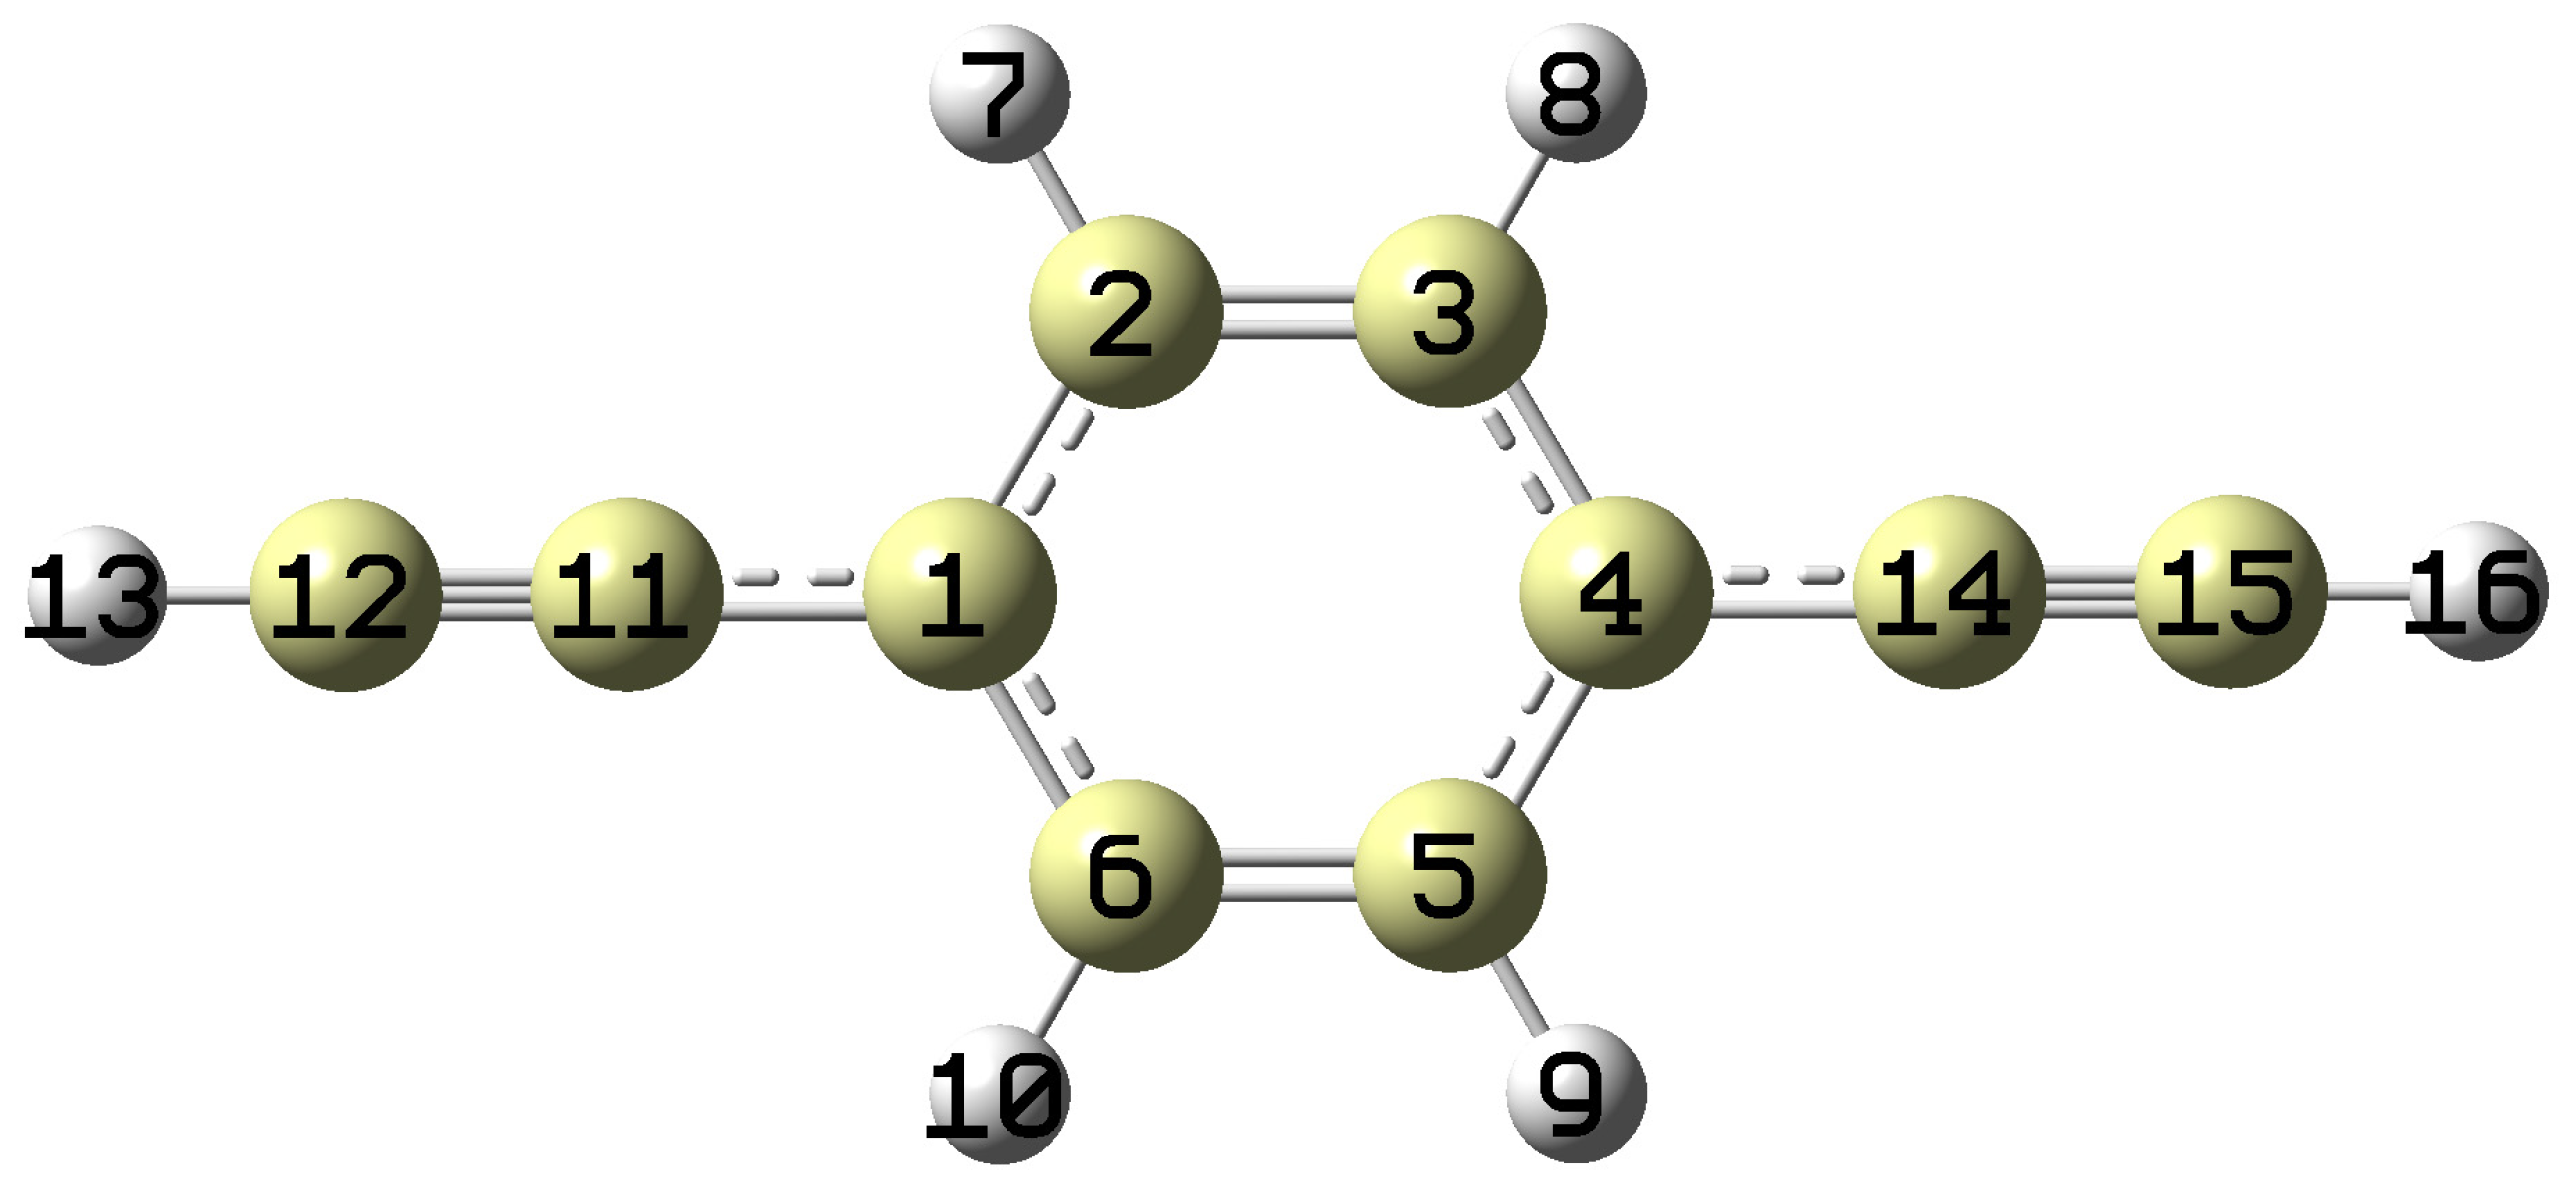
The optimized geometries of pDEB in the S0, S1, and D0 states are summarized in Table 3, with the atom labeling shown in Figure 3. Upon S1 ← S0 excitation, the C1–C2, C3–C4, C4–C5, and C6–C1 bonds (the long axes of the ring) elongate by 0.04 Å, while the C2–C3 and C5–C6 bonds (the short axes) contract by 0.02 Å. This pattern indicates a quinoidal distortion of the ring upon π → π* excitation, which is characteristic of para-disubstituted benzenes with electron-withdrawing or conjugated substituents [6]. The C1–C11 and C4–C14 bonds (connecting the ring to the ethynyl groups) shorten by 0.035 Å, indicating increased conjugation between the ring and the substituents in the excited state. The C≡C triple bonds elongate slightly by 0.021 Å, while the C–H bonds remain essentially unchanged.
Upon ionization (D0 ← S1), most geometric parameters revert toward their S0 values. The ring bonds that elongated in S1 contract slightly (by 0.017 Å), while the C1–C11 and C4–C14 bonds elongate slightly (by 0.004 Å). The C≡C bonds contract by 0.011 Å, approaching their S0 lengths. The bond angles show complementary changes: the C3–C4–C5 and C6–C1–C2 angles decrease by 0.44° in S1 and increase by 1.52° in D0, reflecting the rehybridization of the ring carbons upon electronic excitation and ionization.
These geometry changes provide direct evidence of the electronic redistribution upon excitation and ionization. The observed quinoidal distortion and the shortening of the C(ring)-C(ethynyl) bonds in the S1 state indicate a significant enhancement of π-conjugation between the benzene ring and the ethynyl substituents. This structural rigidity and extended conjugation are key features that facilitate efficient charge transport in pDEB-based molecular wires. Furthermore, the reversion of bond lengths in the D0 state suggests a different electronic distribution mechanism upon electron removal, which is critical for understanding the hole-transport properties of this molecule.

3.2. Vibrational Analysis of the S1 and D0 States

pDEB (C10H6) contains 16 atoms and has 42 normal vibrational modes. Following the approach of Varsányi [35,36], we classify these modes into two categories: (1) ring vibrations (30 modes) that resemble those of benzene, labeled using Wilson notation [38]; and (2) substituent vibrations (12 modes) associated with the two –C≡CH (or C2H)groups.
For the substituent vibrations, each –C≡CH group has six normal modes: ν(C–C≡C) stretching, β(C≡C–H) in-plane bending, γ(C≡C–H) out-of-plane bending, ν(C–H) stretching, β(C–H) in-plane bending, and γ(C–H) out-of-plane bending. Since pDEB has two equivalent ethynyl groups in para positions, each of these six vibrations splits into symmetric (s) and antisymmetric (as) components. We designate these using Greek letters with subscripts “s” and “as”: νs, νas; βs, βas; γs, γas; etc.
The assignment of substituent modes is based on comparisons with phenylacetylene [37] and diethynylbenzene [6], as well as on TD-DFT frequency calculations. For example, the band at 167 cm−1 is assigned to βasC2H (antisymmetric in-plane bending of the ethynyl, while the band at 492 cm−1 is assigned to 6a1γasC2H2 (a combination of ring mode 6a with two quanta of antisymmetric out-of-plane C≡C–H bending). The band at 1176 cm−1 is assigned to 9a1 (ring mode 9a, in-plane C–H bending), which is consistent with the assignment for p-diethynylbenzene reported by Stearns and Zwier [6].
For the D0 state cation, the vibrational frequencies are generally higher than those in S1, indicating stronger bonding upon ionization. For instance, the ring breathing mode (11) increases from 759 cm−1 in S1 to 799 cm−1 in D0, and the 6b1 mode increases from 605 cm−1 to 613 cm−1. This trend is consistent with the removal of an electron from a π orbital, which increases the effective nuclear charge experienced by the remaining electrons and strengthens the σ framework.

3.3. Accidental Resonances

The observation of accidental resonances in two-color MATI spectra has been reported for several molecules where the S1 ← S0 transition energy is close to half of the IE. This phenomenon occurs for pDEB because the S1 ← S0 transition energy of pDEB (34,255 cm−1) is very close to half of the IE (69,099/2 = 34,549.5 cm−1). Similar observations have been reported for ethyl bromide by Tang et al. [32] for ethyl iodide by Knoblauch et al. [33], and for p-difluorobenzene and p-chlorofluorobenzene by Kemp et al. [30,31]. In the latter study, Wright and co-workers observed “one-colour, two-photon accidental resonances” in ZEKE spectra of p-difluorobenzene and p-chlorofluorobenzene and assigned them to similar resonant conditions. Table 4 summarizes the relevant energy parameters for pDEB and related molecules.
For p-difluorobenzene (pDFB), Kemp et al. [30] reported similar accidental resonances in ZEKE spectra and attributed them to “one-colour, two-photon accidental resonances” where the ionization laser becomes resonant with an S1 ← S0 transition and additionally, the fixed excitation laser is then accidentally resonant with a transition from this S1 level to a level in the cation. The near-resonant condition in pDFB (IE/2 − S1 = 97 cm−1) is even closer than in pDEB (295 cm−1), leading to intense accidental signals.
For ethyl bromide, Tang et al. [32] systematically investigated one-color, two-photon MATI spectroscopy and observed extensive vibrational structure arising from resonance enhancement by a dissociative intermediate state (the à state). The A-band of ethyl bromide centers at approximately 200 nm (50,000 cm−1), which is roughly half of the IE (83,099 cm−1), making the molecule particularly suitable for one-color, two-photon studies.
The narrow linewidth of the accidental resonance (~2–3 cm−1) compared to the two-color MATI bands (~7–10 cm−1) can be understood by considering the different ionization mechanisms. Two-color MATI involves excitation to a specific intermediate level (S1 00) followed by a second photon to high-n Rydberg states, with rotational congestion contributing to broader linewidths. In contrast, the one-color, two-photon accidental resonance arises from a direct two-photon absorption transition from S0 to high-n Rydberg states via the near-resonant S1 level, which can exhibit narrower linewidths due to more stringent selection rules.
It is worth noting that similar one-color, two-photon accidental resonances have also been observed in alkyl halides such as ethyl bromide [32], 1-bromopropane [34] and 2-bromopropane [29], where dissociative intermediate states provide the near-resonant condition. This suggests that accidental resonances may be a general phenomenon in MATI spectroscopy when the energy of an accessible intermediate state (either bound or dissociative) lies close to half the ionization energy.
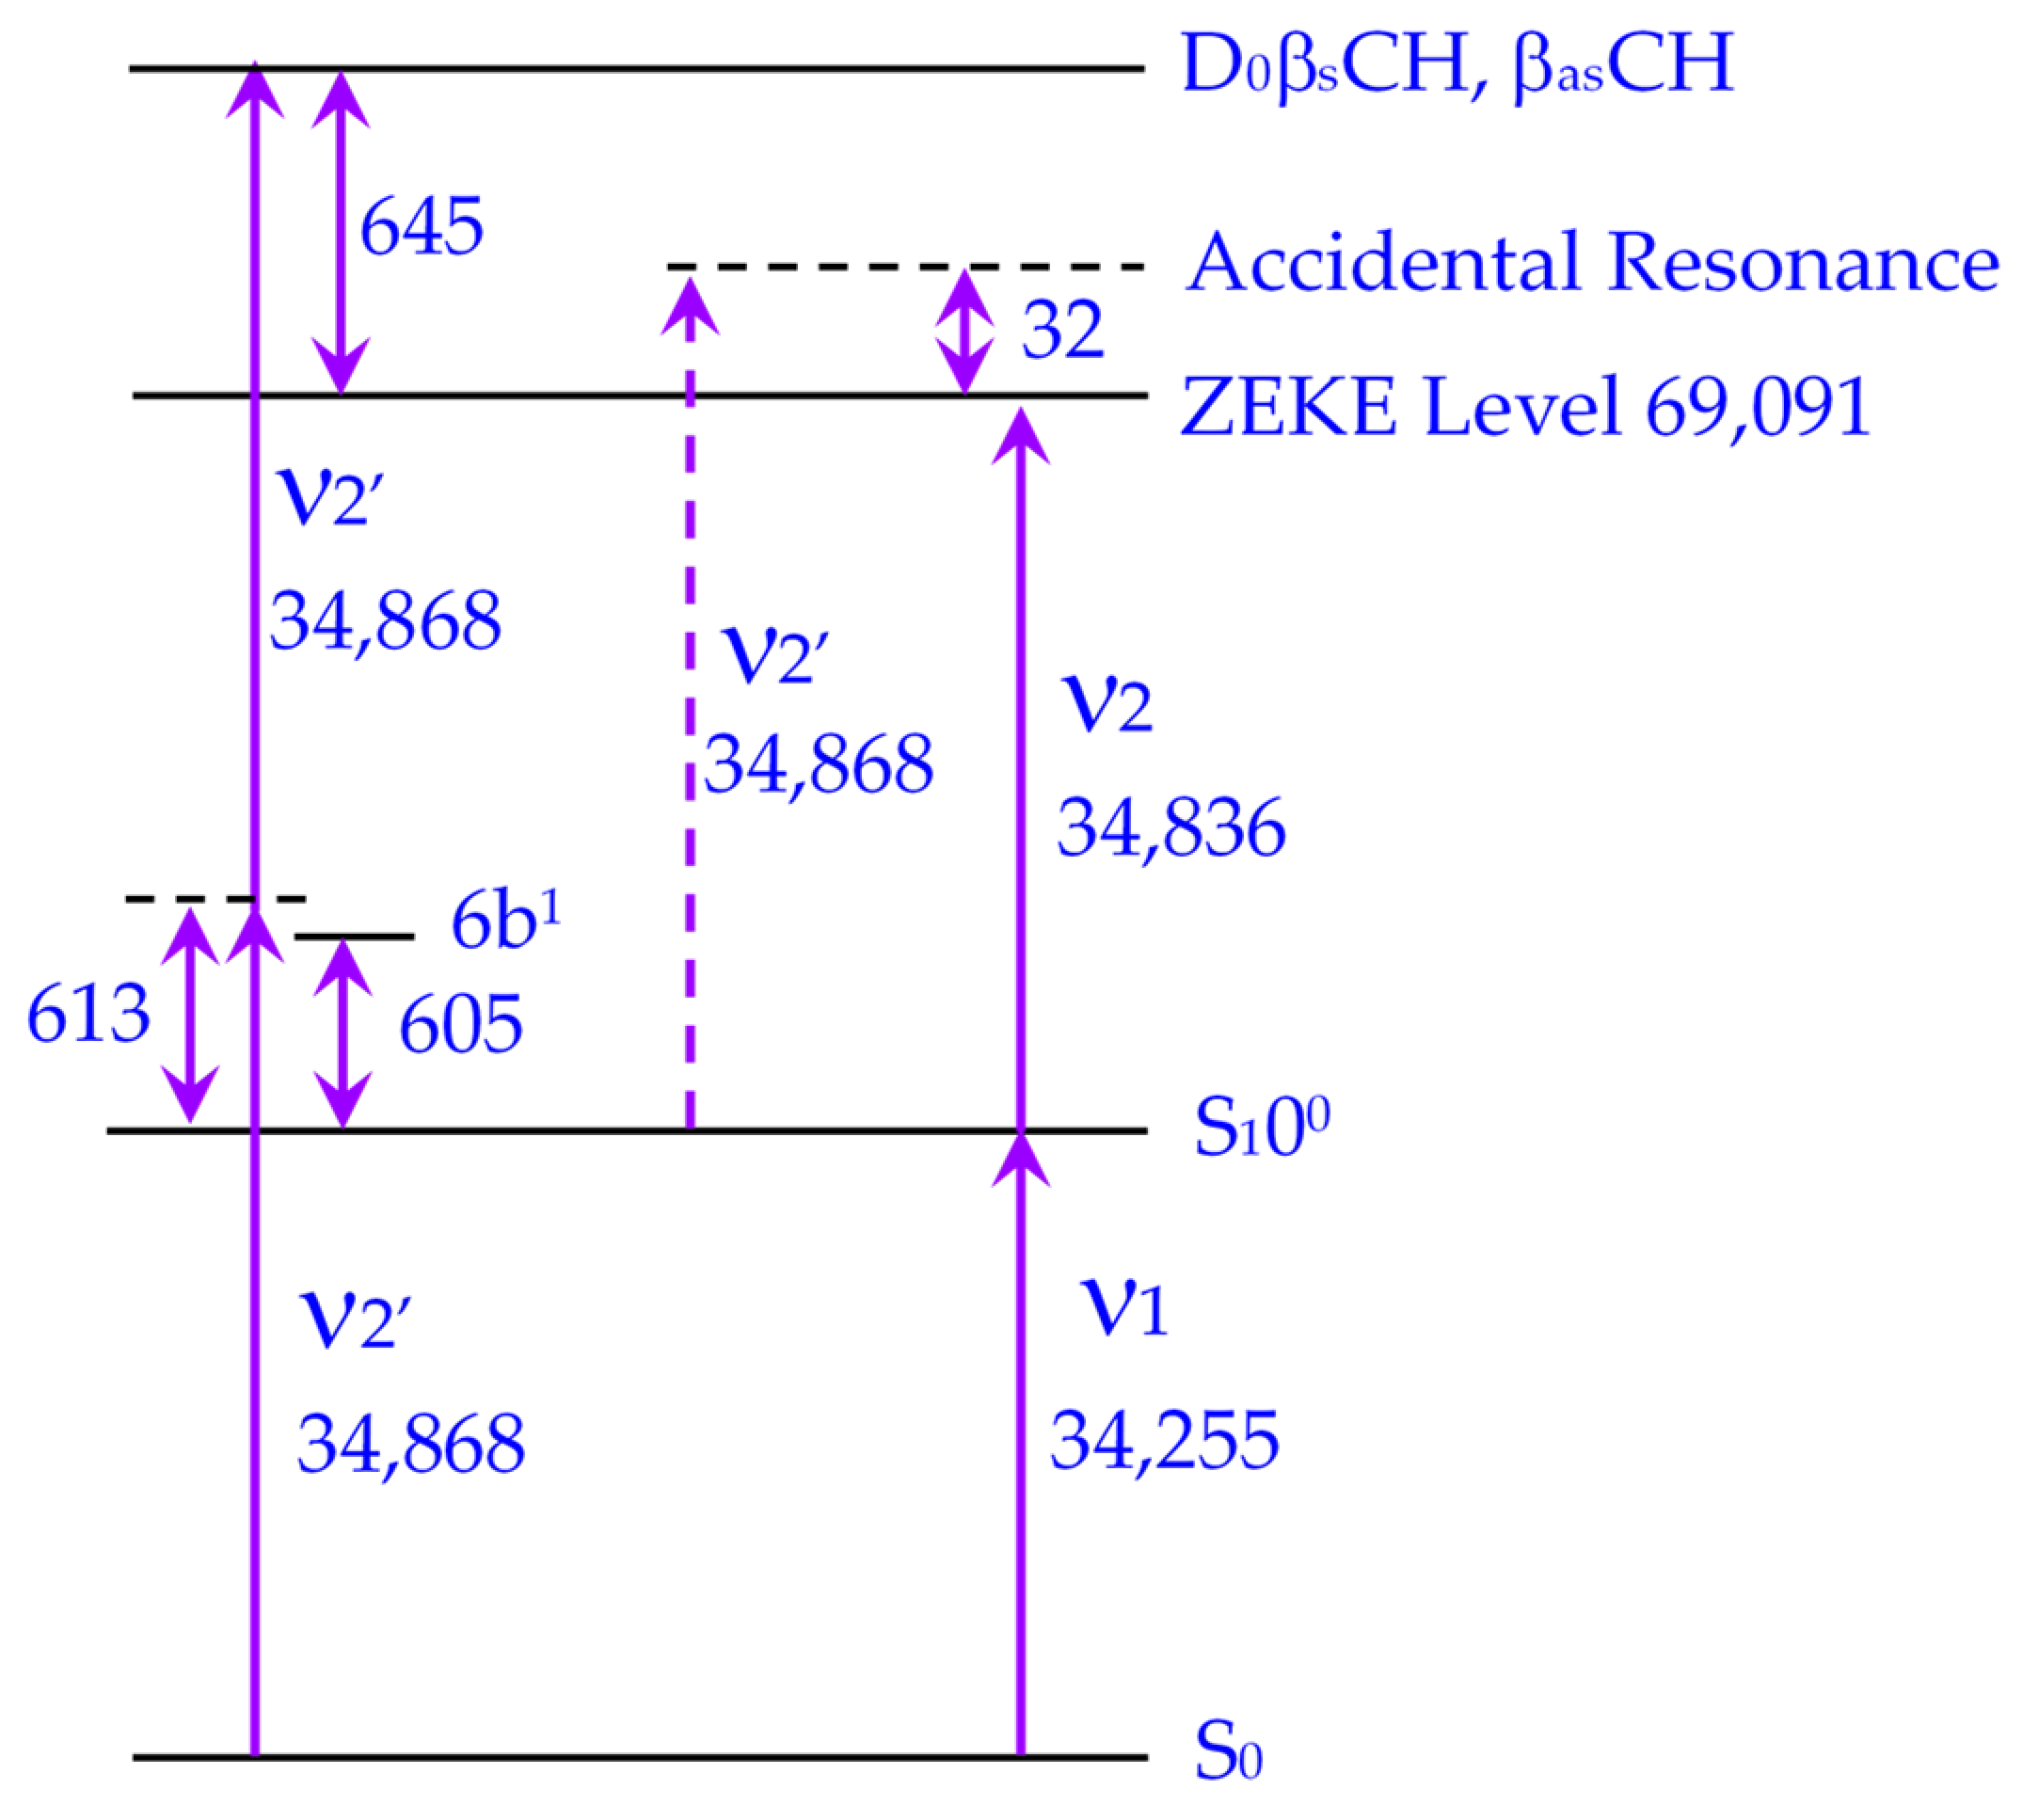
These comparative studies support our assignment of the narrow peak at 32 cm−1 above the IE in the pDEB MATI spectrum as a one-color, two-photon accidental resonance. The phenomenon arises from the specific energy level structure of pDEB (see Figure 4), where the S1 states 6b1 lie approximately halfway between S0 and D0βsCH, βasCH (The calculated frequencies of both are 650 cm−1), making the molecule susceptible to such resonances.

4. Materials and Methods

4.1. Sample Preparation and Molecular Beam

The pDEB sample (97% purity, purchased from Macklin Biochemical Co., Ltd., Shanghai, China) was placed in a sample reservoir heated to approximately 108 °C to achieve sufficient vapor pressure. The sample vapor was seeded in 3 bar of krypton (Kr) carrier gas and expanded through a pulsed valve (0.5 mm diameter orifice) into the source chamber. The resulting molecular beam was skimmed (1.0 mm diameter) before entering the ionization chamber. The pressures in the source and ionization chambers were maintained at approximately 1 × 10⁻⁴ Pa and 1 × 10⁻⁵ Pa, respectively.

4.2. Laser Systems and Spectroscopy

Two tunable UV laser systems were used for two-color R2PI experiments. The probe laser (excitation) was a Nd:YAG-pumped dye laser (CBR-D-24, Sirah Lasertechnik GmbH, Gottingen, Lower Saxony, Germany) with frequency-doubled output (277.5–293 nm). The ionization laser was a Nd:YAG-pumped dye laser (Precision Scan-D, Sirah Lasertechnik GmbH, Gottingen, Lower Saxony, Germany) with frequency-doubled output (fixed at 286 nm for two-color REMPI). Laser wavelengths were calibrated using a wavemeter (High-FinesseWS-7, HighFinesse GmbH, Offenburg, Germany).
Ions were accelerated by a two-stage electric field and detected by a microchannel plate (MCP) detector after passing through a 48 cm field-free region. Ion signals were processed by a multichannel scaler (SR430, Stanford Research Systems, Inc., Sunnyvale, CA, USA) and recorded by a personal computer using a self-written LabVIEW program. Mass spectra were accumulated at 0.02 nm intervals for R2PI and 0.04 nm intervals for MATI, with 300 laser shots per data point.
For MATI experiments, a pulsed electric field of −0.9 V/cm was applied approximately 180 ns after the laser pulses to reject prompt ions. After a delay of ~11.8 μs, a second pulsed field of +143 V/cm was applied to field-ionize long-lived high-n Rydberg states. The resulting threshold ions were detected in the same manner as prompt ions. Further experimental details can be found in our previously published papers [40,41].

4.3. Computational Methods

All calculations were performed using the Gaussian 16 software package [42]. Ground state (S0) geometries and harmonic vibrational frequencies were calculated using density functional theory (DFT) at the B3LYP/6-31G(d) level. Excited state (S1) geometries and frequencies were calculated using time-dependent DFT (TD-DFT) at the same level of theory. Cation ground state (D0) calculations were performed using unrestricted DFT (UB3LYP/6-31G(d)). The average value of S2 in the D0 state is 0.75 after spin annihilation (ca. 0.77 before annihilation), confirming that spin contamination is negligible and the use of UB3LYP is well justified. All calculated frequencies were scaled by appropriate factors (0.991 for S1, 0.98 for D0) to correct for basis set incompleteness and anharmonicity. The scaling factor is empirical and chosen to achieve the best consistency between calculated frequencies and experimental measurements. Based on the DFT results for the ground, excited, and cationic ground states, we performed simulations of the REMPI and MATI spectra using Gaussian 16. The spectral linewidths were set according to the experimental values (REMPI: SpecHwHm = 1.4 cm−1; MATI: FWHM = 2.3 cm−1). The spectral resolution (step size) was 0.2 cm−1. The transition from the ground state to the excited state included the first-order correction of the Taylor expansion, i.e., the Herzberg–Teller correction. The adiabatic excitation energy was determined from the calculated energies of the two relevant electronic states.
To provide accurate predictions that can guide experimental work, G4 and CBS-QB3 methods were employed. The calculated ionization energies are essential for determining the optimal laser wavelengths and selecting appropriate dyes, which significantly enhances experimental efficiency.

5. Conclusions

We have performed a detailed spectroscopic investigation of p-diethynylbenzene using two-color R2PI and MATI techniques. The S1 ← S0 electronic origin is located at 34,255 ± 2 cm−1, and the adiabatic ionization energy is determined to be 69,095 ± 5 cm−1 from two-color MATI spectroscopy via the S1 00 level. A complete vibrational analysis of the S1 and D0 states is presented. The assignments are supported by TD-DFT frequency calculations and Franck–Condon simulations.
An unexpected narrow peak at 32 cm−1 above the ionization threshold is observed in the two-color MATI spectrum and is assigned to a one-color, two-photon accidental resonance. This is consistent with similar reports for ethyl bromide [32], ethyl iodide [33], p-difluorobenzene [30] and p-chlorofluorobenzene [31], suggesting that accidental resonances are a general phenomenon in MATI/ZEKE spectroscopy of molecules with S1 states lying approximately halfway between S0 and D0.
The present results provide a comprehensive spectroscopic dataset and precise structural parameters for pDEB. These data not only allow for the unambiguous identification of pDEB and its distinction from ortho and meta isomers but also serve as a benchmark for theoretical modeling of conjugated molecular wires and advanced optical materials.

Author Contributions

Conceptualization, C.L. and S.J.; software, Y.Z.; formal analysis, K.Z. and C.L.; investigation, K.Z., R.W. and X.Q.; writing—original draft preparation, K.Z.; writing—review and editing, K.Z., X.Q. and C.L.; visualization, K.Z. and C.L.; supervision, C.L.; project administration, C.L. and S.J.; funding acquisition, C.L., Y.Z. and S.J. All authors have read and agreed to the published version of the manuscript.

Funding

This research was funded by the National Natural Science Foundation of China (Grant Nos. 12241408 and 61575115), PCSIRT (Grant No. IRT_17R70), 111 project (Grant No. D18001), and Shanxi Provincial Natural Science Foundation (Grant No. 202303021222265).

Institutional Review Board Statement

Not applicable.

Informed Consent Statement

Not applicable.

Data Availability Statement

The data that support the findings of this study are available from the corresponding author, Changyong Li, upon reasonable request.

Acknowledgments

All contributors who provided help during the research have been listed.

Conflicts of Interest

The authors declare no conflicts of interest.

References

  1. Zhan, X.; Yang, M.; Lei, Z.; Li, Y.; Liu, Y.; Yu, G.; Zhu, D. Photoluminescence, Electroluminescence, Nonlinear Optical, and Humidity Sensitive Properties of Poly(p-diethynylbenzene) Prepared with a Nickel Acetylide Catalyst. Adv. Mater. 2000, 12, 51–53. [Google Scholar] [CrossRef]
  2. Xie, R.; Xu, R.; Liang, Y.; Yin, Q.; Huang, Y.; Ying, L.; Huang, F.; Cao, Y. Diethynylbenzo[1,2-b:4,5-b′]dithiophene-based small molecule and cross-conjugated copolymers for organic solar cells. J. Polym. Sci. Part A Polym. Chem. 2017, 55, 660–671. [Google Scholar] [CrossRef]
  3. Chen, J.-H.; Wang, C.-S.; Li, Z.; Hu, J.; Yu, S.-Y.; Xu, Y.-T.; Lin, P.; Zhao, W.-W. Dual Functional Conjugated Acetylenic Polymers: High-Efficacy Modulation for Organic Photoelectrochemical Transistors and Structural Evolution for Bioelectronic Detection. Anal. Chem. 2023, 95, 4243–4250. [Google Scholar] [CrossRef]
  4. Le Narvor, N.; Lapinte, C. 1,4-Diethynylbenzene Bridged Fe(Cp*)(dppe) Units: Mixed-Valence 35-Electron and Bisiron(III) 34-Electron Complexes. Organometallics 1995, 14, 634–639. [Google Scholar] [CrossRef]
  5. Nitzan, A.; Ratner, M.A. Electron transport in molecular wire junctions. Science 2003, 300, 1384–1389. [Google Scholar] [CrossRef]
  6. Stearns, J.A.; Zwier, T.S. Infrared and Ultraviolet Spectroscopy of Jet-Cooled ortho-, meta-, and para-Diethynylbenzene. J. Phys. Chem. A 2003, 107, 10717–10724. [Google Scholar] [CrossRef]
  7. Zhang, Z.; Wang, Z.; Wang, Q.; Ma, X.; Wang, Z.; Hua, Z.; Yao, G.; Yang, X.; Sun, Z.; Qin, Z.; et al. Photoionization cross sections measurements of the excited states of lutetium and ytterbium in the near threshold region. J. Chem. Phys. 2024, 160, 164201. [Google Scholar] [CrossRef]
  8. Hua, Z.; Deng, J.; Sun, Z.; Yang, X.; Qin, Z.; Zheng, X. Spectroscopic signatures of the S0, S1, and D0 states of indan: An experimental and theoretical investigation. J. Photochem. Photobiol. A Chem. 2025, 461, 116175. [Google Scholar] [CrossRef]
  9. Qin, Z.; Ma, N.; Ren, Y.; Zheng, X.; Yao, G.; Zhang, X.; Cui, Z. Analysis of the S1 ← S0 and D0 ← S1 spectra in m-bromofluorobenzene via resonance-enhanced multiphoton ionization and slow electron velocity-map imaging spectroscopy. J. Quant. Spectrosc. Radiat. Transf. 2019, 224, 107–113. [Google Scholar] [CrossRef]
  10. Wu, C.; He, Y.; Kong, W. Polarization spectroscopy of gaseous tropolone in a strong electric field. J. Chem. Phys. 2004, 121, 4577–4584. [Google Scholar] [CrossRef]
  11. He, Y.; Wu, C.; Kong, W. Resonantly enhanced two photon ionization and zero kinetic energy spectroscopy of jet-cooled 4-aminopyridine. J. Chem. Phys. 2004, 120, 7497–7504. [Google Scholar] [CrossRef]
  12. Wu, C.; He, Y.; Kong, W. Two-color two-photon REMPI and ZEKE spectroscopy of supersonically cooled o-aminobenzoic acid. Chem. Phys. Lett. 2004, 398, 351–356. [Google Scholar] [CrossRef]
  13. Huang, J.; Huang, K.; Liu, S.; Luo, Q.; Tzeng, W. Molecular structures and vibrations of cis and trans m-cresol in the electronically excited S1 and cationic D0 states. J. Photochem. Photobiol. A Chem. 2007, 188, 252–259. [Google Scholar] [CrossRef]
  14. Huang, J.; Li, C.; Tzeng, W.B. Mass analyzed threshold ionization spectroscopy of p-methylanisole cation and the substitution effect. Chem. Phys. Lett. 2005, 414, 276–281. [Google Scholar] [CrossRef]
  15. Huang, J.; Lin, J.L.; Tzeng, W.B. Mass analyzed threshold ionization spectroscopy of the 35Cl and 37Cl isotopomers of p-chlorophenol and isotope effect. Chem. Phys. Lett. 2006, 422, 271–275. [Google Scholar] [CrossRef]
  16. Huang, J.; Lin, J.L.; Tzeng, W.B. Rotamers of m-cresol cation studied by mass-analyzed threshold ionization spectroscopy. Spectrochim. Acta A Mol. Biomol. Spectrosc. 2007, 67, 989–994. [Google Scholar] [CrossRef]
  17. Tzeng, W.B.; Narayanan, K.; Lin, J.L. Detection of Styrene Impurities in Phenylacetylene by Resonance-Enhanced Multiphoton Ionization Time-of-Flight Mass Spectrometry. Appl. Spectrosc. 1999, 53, 731–734. [Google Scholar] [CrossRef]
  18. Imasaka, T.; Moore, D.S.; Vo-Dinh, T. Critical assessment: Use of supersonic jet spectrometry for complex mixture analysis (IUPAC Technical Report). Pure Appl. Chem. 2003, 75, 975–998. [Google Scholar] [CrossRef]
  19. Gullett, B.; Touati, A.; Oudejans, L. Use of REMPI–TOFMS for real-time measurement of trace aromatics during operation of aircraft ground equipment. Atmos. Environ. 2008, 42, 2117–2128. [Google Scholar] [CrossRef]
  20. Lin, J.L.; Tzeng, W.B. Identification of impurities in phenylacetylene by species-selected mass-analyzed threshold ionization spectroscopy. Appl. Spectrosc. 2003, 57, 1178–1182. [Google Scholar] [CrossRef]
  21. Ketkov, S.; Tzeng, S.-Y.; Rychagova, E.; Tzeng, W.-B. Ionization of Decamethylmanganocene: Insights from the DFT-Assisted Laser Spectroscopy. Molecules 2022, 27, 6226. [Google Scholar] [CrossRef] [PubMed]
  22. Li, S.; Zhao, Y.; Hu, F.; Jiao, Y.; Zhao, J.; Li, C. The stable conformations and vibronic and cation spectroscopy of 2-ethoxybenzonitrile. J. Mol. Struct. 2023, 1293, 136278. [Google Scholar] [CrossRef]
  23. Li, S.; Zhao, Y.; Jiao, Y.; Zhao, J.; Li, C.; Jia, S. Vibronic and Cationic Features of 2-Fluorobenzonitrile and 3-Fluorobenzonitrile Studied by REMPI and MATI Spectroscopy and Franck-Condon Simulations. Molecules 2023, 28, 4702. [Google Scholar] [CrossRef]
  24. Zhao, Y.; Jin, Y.; Hao, J.; Yang, Y.; Wang, L.; Li, C.; Jia, S. Rotamers of p-isopropylphenol studied by hole-burning resonantly enhanced multiphoton ionization and mass analyzed threshold ionization spectroscopy. Spectrochim. Acta A Mol. Biomol. Spectrosc. 2019, 207, 328–336. [Google Scholar] [CrossRef]
  25. Nyambo, S.; Zhang, Y.; Yang, D.-S. Reactions of La and Ce with Propylamine: Formation and Threshold Ionization of Lanthanide Imido Radicals. J. Phys. Chem. A 2025, 129, 5570–5578. [Google Scholar] [CrossRef]
  26. Wu, L.; Roudjane, M.; Yang, D.-S. Structure and Bonding of Sc3C2 and La3C2 Clusters from MATI Spectroscopy and Theoretical Calculations. J. Phys. Chem. A 2025, 129, 9019–9026. [Google Scholar] [CrossRef] [PubMed]
  27. Ketkov, S.Y.; Tzeng, S.-Y.; Rychagova, E.A.; Lukoyanov, A.N.; Tzeng, W.-B. Effect of a single methyl substituent on the electronic structure of cobaltocene studied by computationally assisted MATI spectroscopy. Phys. Chem. Chem. Phys. 2024, 26, 1046–1056. [Google Scholar] [CrossRef] [PubMed]
  28. Xu, Y.; Tzeng, S.Y.; Shivatare, V.; Takahashi, K.; Zhang, B.; Tzeng, W.B. Identification of four rotamers of m-methoxystyrene by resonant two-photon ionization and mass analyzed threshold ionization spectroscopy. J. Chem. Phys. 2015, 142, 124314. [Google Scholar] [CrossRef]
  29. Wang, Y.; Zhang, S.; Tang, B.; Zheng, Q.; Zhang, B. One-color two-photon mass-analyzed threshold ionization spectroscopy of 2-bromopropane. Chem. Phys. Lett. 2005, 412, 101–105. [Google Scholar] [CrossRef]
  30. Kemp, D.J.; Gardner, A.M.; Tuttle, W.D.; Midgley, J.; Reid, K.L.; Wright, T.G. Identifying complex Fermi resonances in p-difluorobenzene using zero-electron-kinetic-energy (ZEKE) spectroscopy. J. Chem. Phys. 2018, 149, 94301. [Google Scholar] [CrossRef]
  31. Kemp, D.J.; Whalley, L.E.; Tuttle, W.D.; Gardner, A.M.; Speake, B.T.; Wright, T.G. Vibrations of the p-chlorofluorobenzene cation. Phys. Chem. Chem. Phys. 2018, 20, 12503–12516. [Google Scholar] [CrossRef] [PubMed]
  32. Tang, B.; Zhang, S.; Wang, Y.; Tang, Y.; Zhang, B. One-color two-photon mass-analyzed threshold ionization spectroscopy of ethyl bromide through a dissociative intermediate state. J. Chem. Phys. 2005, 123, 164305. [Google Scholar] [CrossRef] [PubMed]
  33. Knoblauch, N.; Strobel, A.; Fischer, I.; Bondybey, V.E. Two-photon ionization and dissociation of ethyl iodide. J. Chem. Phys. 1995, 103, 5417–5427. [Google Scholar] [CrossRef]
  34. Zhang, S.; Wang, Y.; Tang, B.; Zheng, Q.; Zhang, B. Mass-analyzed threshold ionization spectroscopy of 1-bromopropane through dissociative intermediate states. Chem. Phys. Lett. 2006, 419, 101–105. [Google Scholar] [CrossRef]
  35. Varsanyi, G.; Szoke, S. Vibrational Spectra of Benzene Derivatives; Academic Press: Cambridge, MA, USA, 1969. [Google Scholar]
  36. Varsanyi, G. Assignments of Vibrational Spectra of Seven Hundred Benzene Derivatives; Wiley: New York, NY, USA, 1974. [Google Scholar]
  37. Narayanan, K.; Chang, G.; Shieh, K.; Tung, C.; Tzeng, W. S1 ← S0 transition of phenylacetylene: Ab initio and resonant two-photon ionization studies. Spectrochim. Acta A Mol. Biomol. Spectrosc. 1996, 52, 1703–1716. [Google Scholar] [CrossRef]
  38. Wilson, E.B. The Normal Modes and Frequencies of Vibration of the Regular Plane Hexagon Model of the Benzene Molecule. Phys. Rev. 1934, 45, 706–714. [Google Scholar] [CrossRef]
  39. Giuliani, A.; Motte-Tollet, F.; Delwiche, J.; Mason, N.J.; Jones, N.C.; Gingell, J.M.; Walker, I.C.; Hubin-Franskin, M.-J. Electronic excitation and oscillator strength of ethyl bromide by vacuum ultraviolet photoabsorption and electron energy loss spectroscopy. J. Chem. Phys. 2000, 112, 6285–6292. [Google Scholar] [CrossRef]
  40. Qin, X.; Zhao, Y.; Ji, Z.; Li, C.; Jia, S. Study of Vibronic and Cationic Features of p-Diethoxybenzene via REMPI, Hole-Burning, and MATI Spectroscopy. Int. J. Mol. Sci. 2026, 27, 3362. [Google Scholar] [CrossRef]
  41. Qin, X.; Duan, C.; Zhao, Y.; Li, C.; Jia, S. Study of Vibronic and Cationic Features of m-Diethoxybenzene via REMPI, Hole-Burning, and MATI Spectroscopy. Int. J. Mol. Sci. 2025, 26, 11818. [Google Scholar] [CrossRef]
  42. Frisch, M.J.; Trucks, G.W.; Schlegel, H.B.; Scuseria, G.E.; Robb, M.A.; Cheeseman, J.R.; Scalmani, G.; Barone, V.; Mennucci, B.; Petersson, G.A.; et al. Gaussian 16 Revision C.01; Gaussian Inc.: Wallingford, CT, USA, 2016. [Google Scholar]
Figure 1. (a) Two-color R2PI spectrum of p-diethynylbenzene recorded in the vibrational frequency range of 0–1800 cm−1 (corresponding to excited energy: 34,000–36,100 cm−1) with the ionization laser fixed at 286 nm (34,965 cm−1). The S1 origin is observed at 34,255 cm−1. (b) The simulation spectra of the S1 ← S000 transition.
Molecules 31 01741 g001
Figure 2. (a) Simulated D0 ← S1 00 spectrum of pDEB. (be) MATI spectra recorded via the intermediate states S1 00 (b), S1 βasC2H (c), S1 6a1γsC2H2 (d), and S1 6b1 (e). The blue vertical lines indicate one-to-one correspondences. The MATI spectrum in (d) shows three additional fundamentals (γasC2H, 6a, 6b), and the accidental resonance is absent in (d) due to competition from strong two-color MATI absorption.
Molecules 31 01741 g002
Figure 3. Atom labeling for p-diethynylbenzene used in the geometric parameter calculations (Table 3). The carbon atoms of the benzene ring are numbered C1–C6, the ethynyl carbon atoms are C11, C12, C14, C15, and the hydrogen atoms are H13 and H16.
Molecules 31 01741 g003
Figure 4. Energy level diagram (unit: cm−1) illustrating the origin of the one-color, two-photon accidental resonance in pDEB.
Molecules 31 01741 g004
Table 1. Vibrational frequencies (in cm−1) and tentative assignments of observed bands in the REMPI experiment of p-Diethynylbenzene a.
EnergyShiftRel. Int.Cal.Assignment bEnergyShiftRel. Int.Cal.Assignment b
34,2550180S1 Origin, 0035,4911236111233γsCH4γasC2H2
34,42216711169βasC2H35,50512503912527a1
34,5573021296γasC2H235,5131258512598b1γsC2H2
34,5873321333γasC2asCH35,526127110126917b116b1
34,5983432348111γsC2H35,59913441213421110b1γasC2H
34,747492274776a1γsC2H235,6181363513617a1γsC2H2
34,75349811480γasCH2γsC2H235,63413798137816b2γasCH2
34,7685133509111γsCH35,68114263142617b16a1111
34,7835283540γsCH2γsC2H235,7071452151449112γsCH4
34,860605126156b135,749149412149511γsCH2γasCH1
34,8906351629γasCHγasC2H335,76115064151011γasCH4
34,93067536754135,773151811151812
34,9847297727γsCH2γasC2H235,83015757157111γsCH2γasCH2
35,00074514742γasCH435,8371582715857a1γasCH1γasC2H
35,014759377691135,8481593615901117b1γsC2H
35,0277722780111γsCH2γsC2H35,8851630516169a1γsCH2
35,0788231182017b1γsC2H35,89816432116237a1γasCH2
35,0878329829111γasCH2γsC2H335,90616515163111γsCH4
35,156901790616b1111γsC2H235,922166710016438a1
35,167912291110b1βasC2H2γasC2H35,9291674916688b19b1
35,182927493017b1γsC2H335,9601705716991117b1γsC2H3
35,2319763972γsCH4γsC2H235,970171513171210b2γsCH4
35,238983798711γsCH436,0011746417528a1γsC2H2
35,26510103100716b236,0121757317589a210b1γasC2H
35,43111761411859a136,0381780517729a1112
35,47512203122010b2γasC2H236,04517904178811112γsCH2
a The experimental frequencies are shifts from 34,255 cm−1, whereas the predicted values are obtained from the td-B3LYP/6-31G(d) calculations, scaled by 0.991. b Internal vibrations of the substituents: β, in-plane bending; γ, out-of-plane bending; the subscript ‘s’ and ‘as’, symmetric and antisymmetric motion, respectively.
Table 2. Vibrational frequencies (in cm−1) and tentative assignments of observed bands in the MATI experiment of PDEB a.
Intermediate StateAssignment bIntermediate StateAssignment b
00βasC2H6a1γsC2H2Calc.00βasC2H6a1 γsC2H2Calc.
0 0D0 Origin, 0+871 87810b2
32 accidental resonance912 92117b1γsC2H
146 133γsC2H2937 92811γsC2H2
158 173βasC2H986 98710b16a1γasC2H
165172γasC2H1012 1021111γsCH
257 234βsC2H21063 10639b2
286 266γsC2H41086 10819b16a1 βasC2H
318 316γsC2H3βsC2H1133 111816b2
331 327111 11306a3
346 343γasC2H2 960 11βasC2H
374 3773776a11161 11644110b1
395 393111γsC2H1174 1172116a1
427 γsC2H61203 11839a1
532 6a1βasC2H1242 12527a1
595 61010b1γasC2H1278 1273416a1γasC2H
6136186b11354 134617a116a1
655 654112 1398 7a1βasC2H
670 111γasC2H21430 141641γasCH
702 7059b1βasC2H 1592 41γasCHβasC2H
751 7536a21615 16328a1
782 786112γsC2H21655 16731110b2
799 79611 1774 8a1βasC2H
a Experimental values are shifts from 69,095 cm−1. Calculated values are from UB3LYP/6-31G(d) scaled by 0.98. b Internal vibrations of the substituents: β, in-plane bending; γ, out-of-plane bending; the subscript ‘s’ and ‘as’, symmetric and antisymmetric motion. The 32 cm−1 peak is assigned to a one-color, two-photon accidental resonance.
Table 3. Optimized geometric parameters of pDEB in the S0, S1, and D0 states (atom labels as in Figure 3) calculated at the B3LYP/6-31G(d), TD-B3LYP/6-31G(d), and UB3LYP/6-31G(d) levels of theory, respectively.
S0S1D0Δ(S1 − S0)Δ(D0 − S1)
Bond length (Å)
C1–C21.4091.4491.4320.04−0.017
C2–C31.3881.3681.371−0.020.003
C3–C41.4091.4491.4320.04−0.017
C4–C51.4091.4491.4320.04−0.017
C5–C61.3881.3681.371−0.020.003
C6–C11.4091.4491.4320.04−0.017
C1–C111.4281.3931.397−0.0350.004
C4–C141.4281.3931.397−0.0350.004
C11≡C121.211.2311.220.021−0.011
C14≡C151.211.2311.220.021−0.011
C12–H131.0661.0671.0711 × 10−30.004
C15–H161.0661.0671.0711 × 10−30.004
Bond angle (°)
C1–C2–C3120.60120.82120.06+0.22−0.76
C2–C3–C4120.60120.82120.06+0.22−0.76
C3–C4–C5118.80118.36119.88−0.44+1.52
C4–C5–C6120.60120.82120.06+0.22−0.76
C5–C6–C1120.60120.82120.06+0.22−0.76
C6–C1–C2118.80118.36119.88−0.44+1.52
C2–C1–C11120.60120.82120.06+0.22−0.76
C6–C1–C11120.60120.82120.06+0.22−0.76
C3–C4–C14120.60120.82120.06+0.22−0.76
C5–C4–C14120.60120.82120.06+0.22−0.76
C1–C11≡C12180.00180.00180.000.000.00
C4–C14≡C15180.00180.00180.000.000.00
Table 4. Comparison of S1 energies and IEs for molecules exhibiting one-color, two-photon accidental resonances (cm−1).
MoleculeS1IEIE/2Δ(IE/2 − S1)Reference
pDEB34,25569,09934,550+295This work
pDFB36,83873,86936,935+97[30]
p-Chlorofluorobenzene36,27572,91936,644+185[31]
Ethyl bromide~38,80083,09941,550+2750[32,39]
Ethyl iodide~38,80075,40637,703−1097[33]
Disclaimer/Publisher’s Note: The statements, opinions and data contained in all publications are solely those of the individual author(s) and contributor(s) and not of MDPI and/or the editor(s). MDPI and/or the editor(s) disclaim responsibility for any injury to people or property resulting from any ideas, methods, instructions or products referred to in the content.