


Simple Method for Controlling Gold Nanocluster Size in Mesoporous Silica: SBA-11


Abstract

1. Introduction
2. Results and Discussion
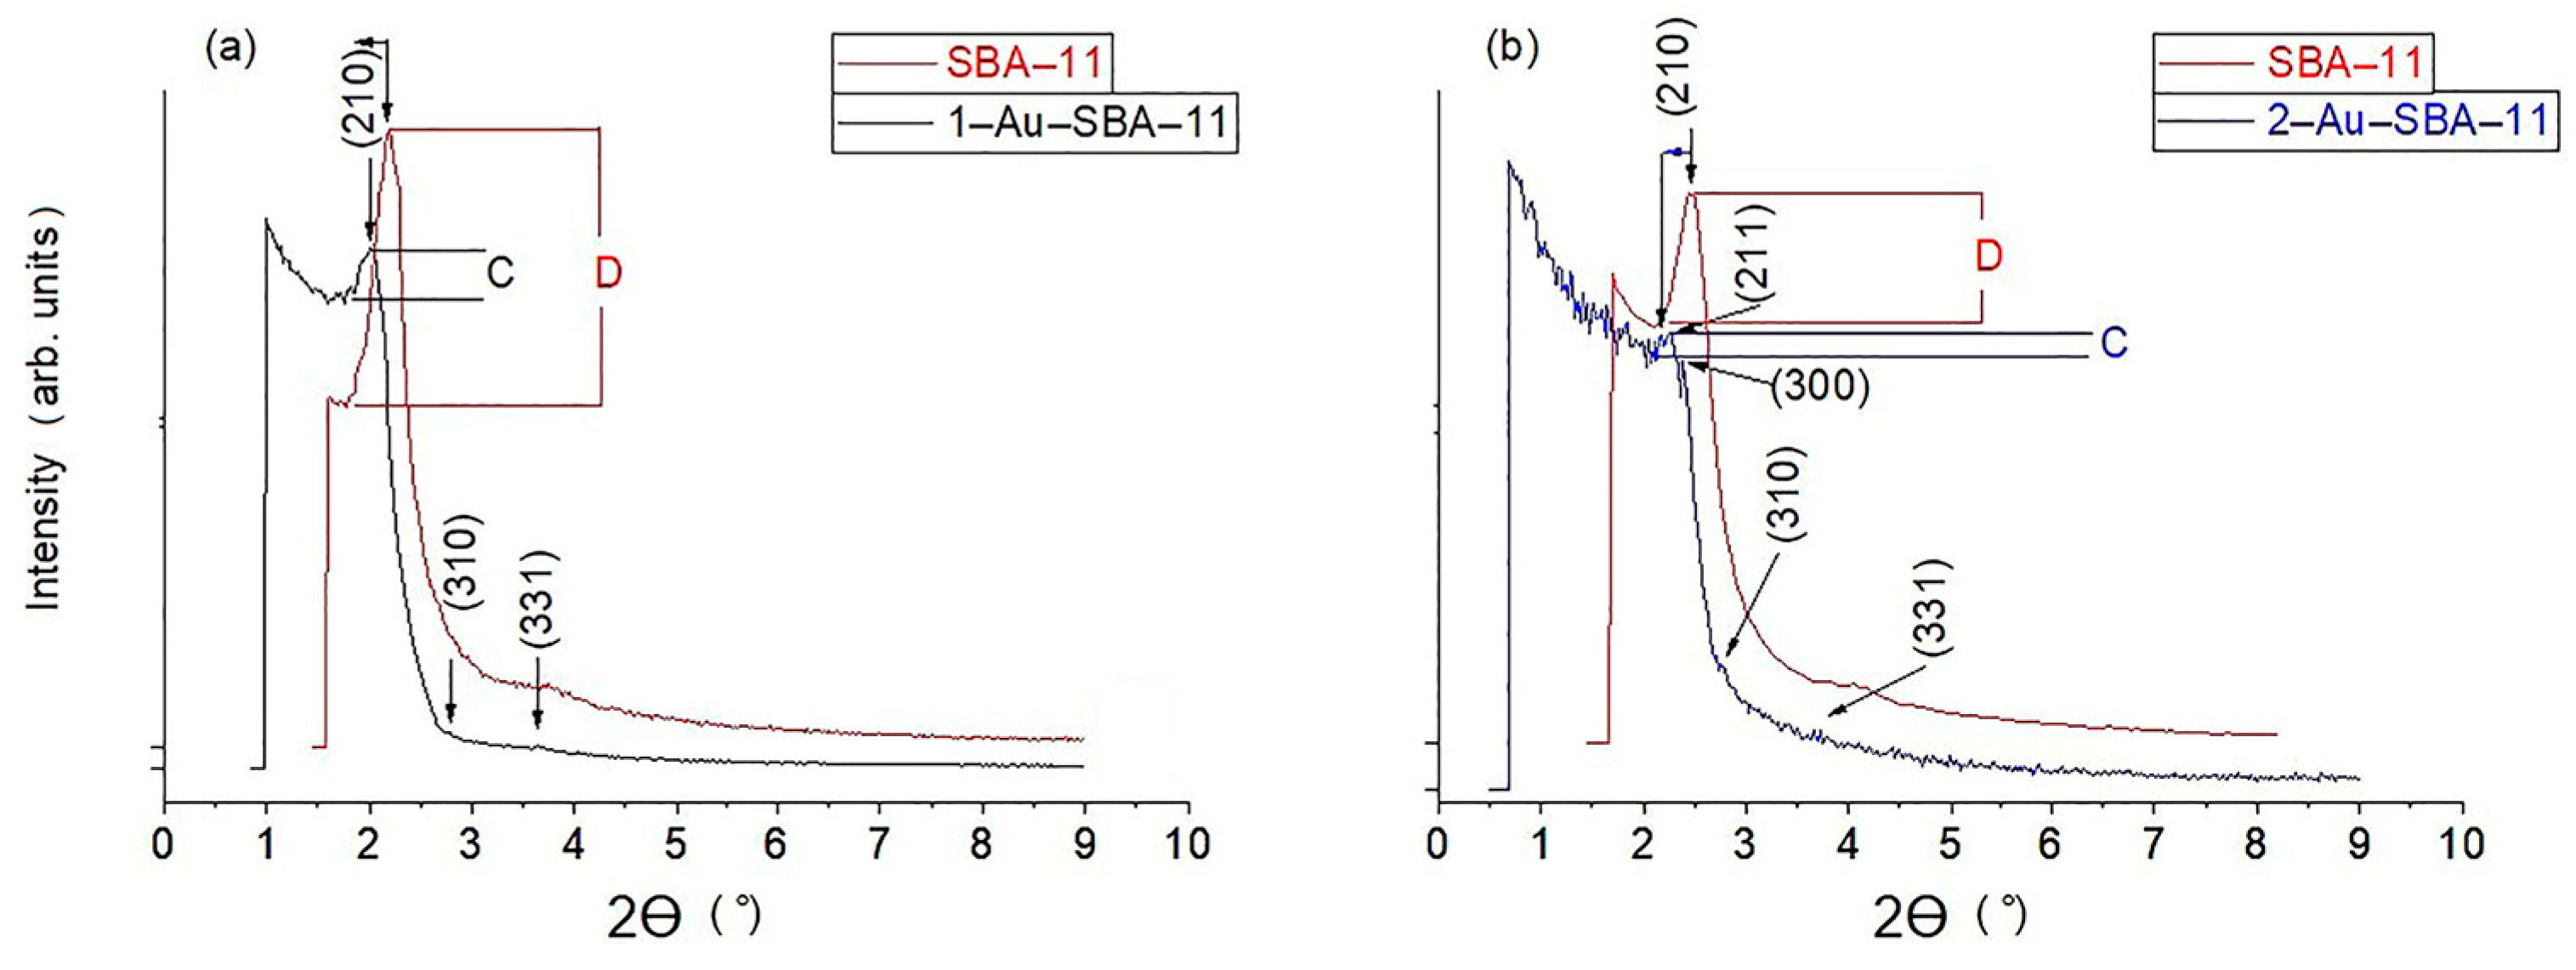
2.1. Narrow-Angle XRD
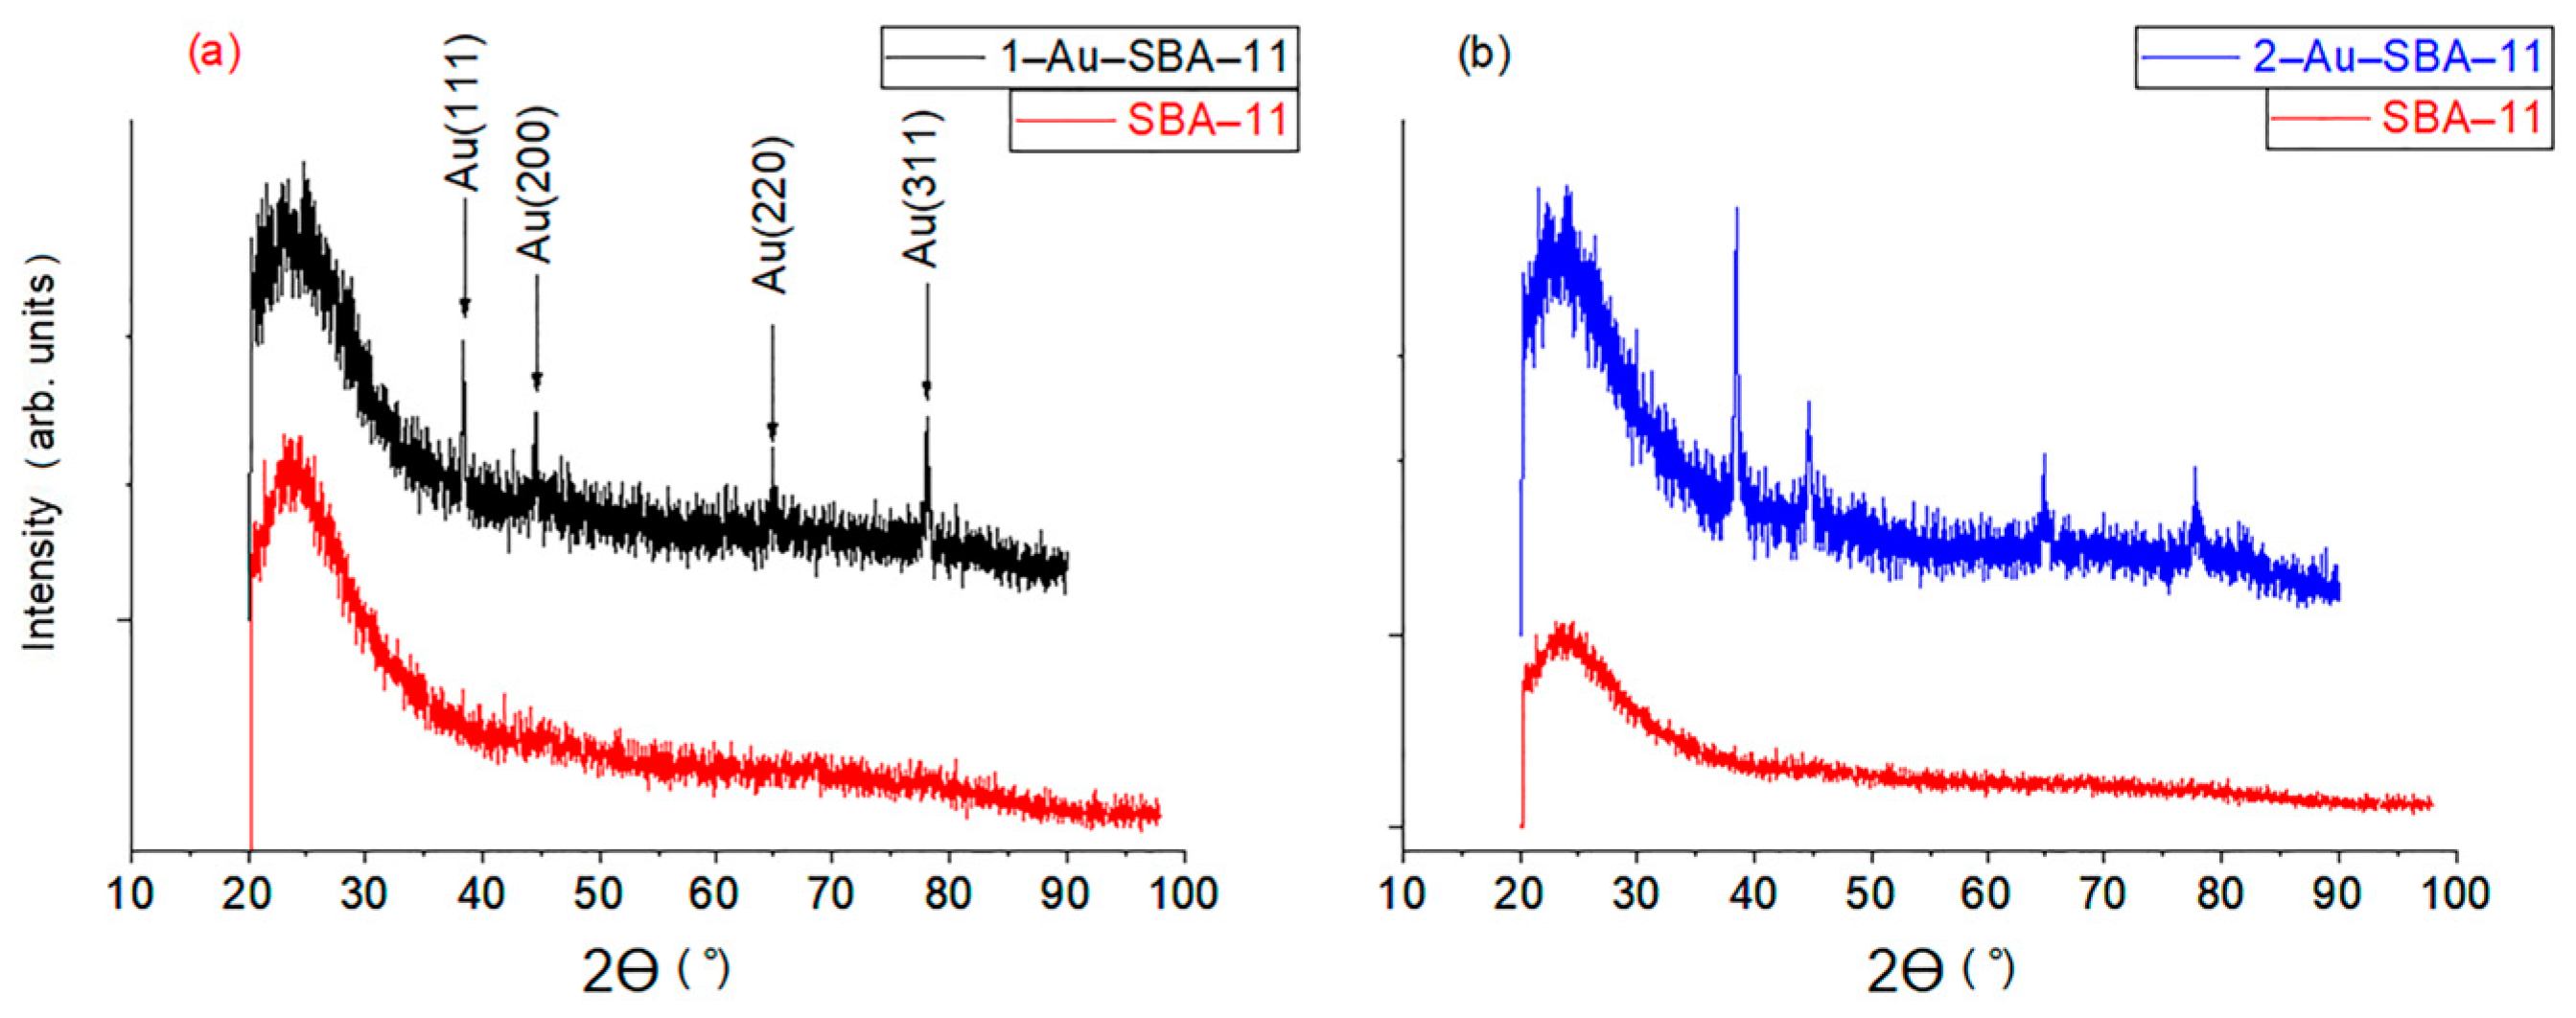
2.2. Wide-Angle XRD
2.3. HRTEM and EDX
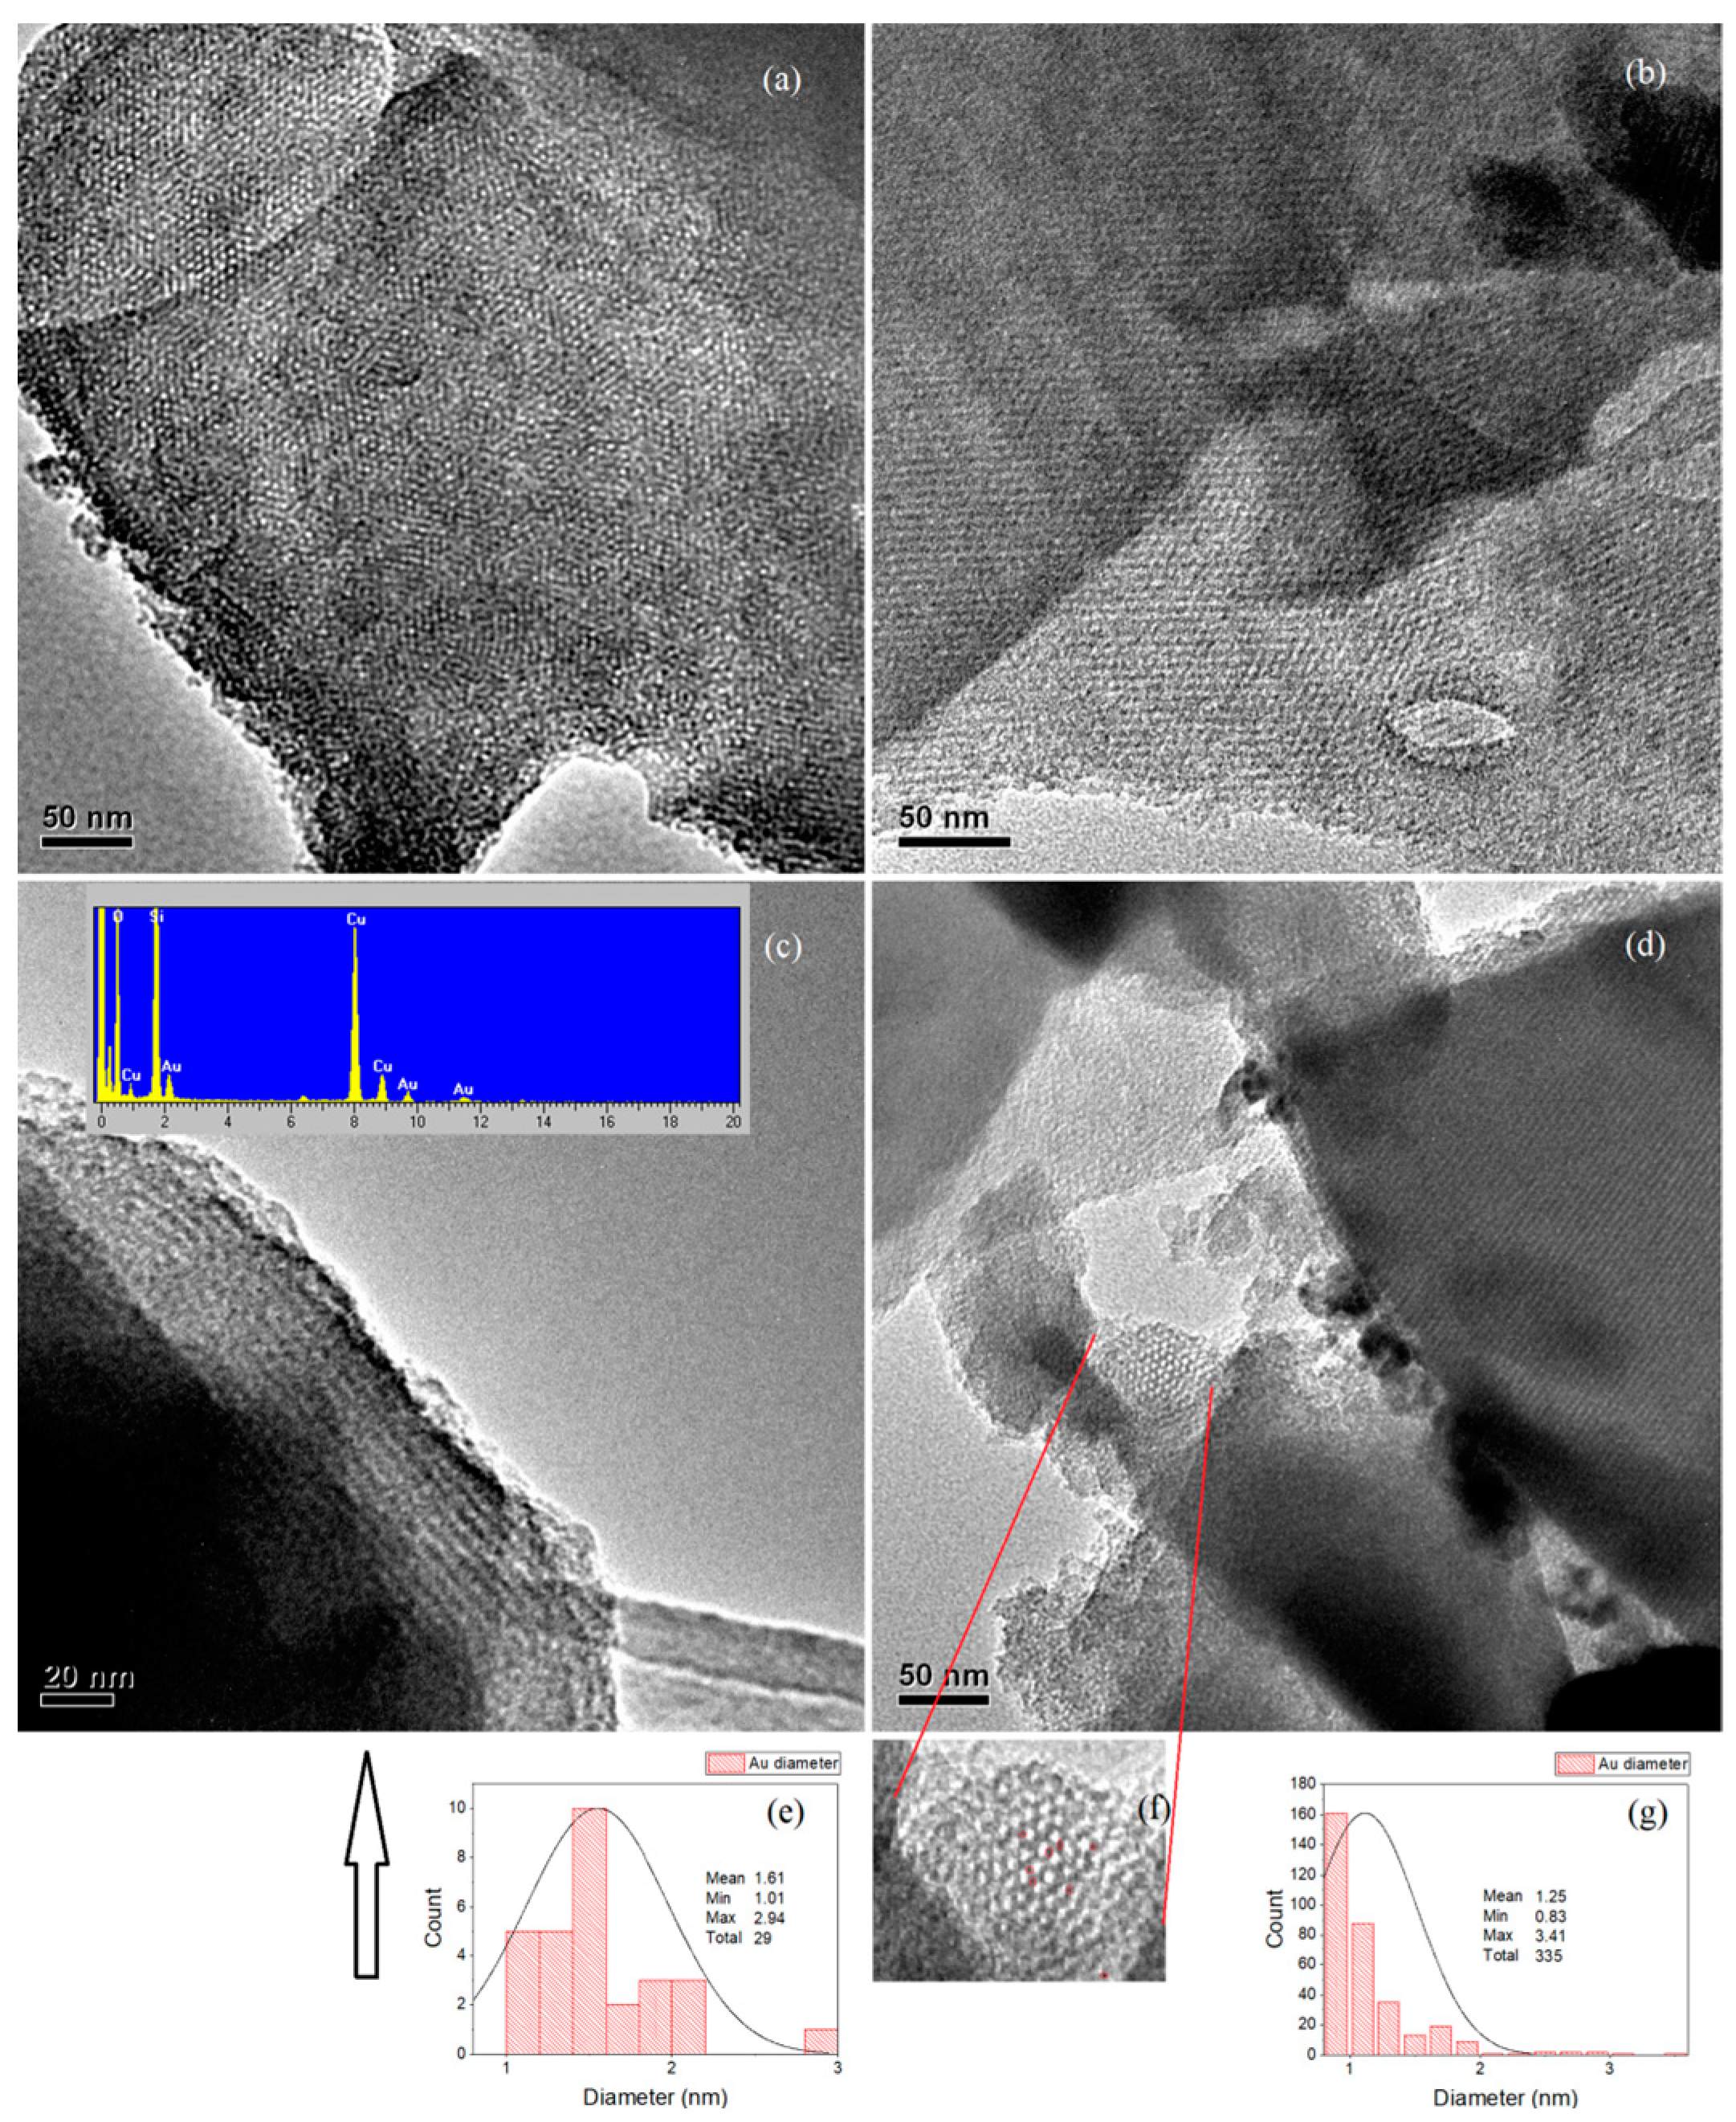
2.3.1. 1–Au–SBA-11
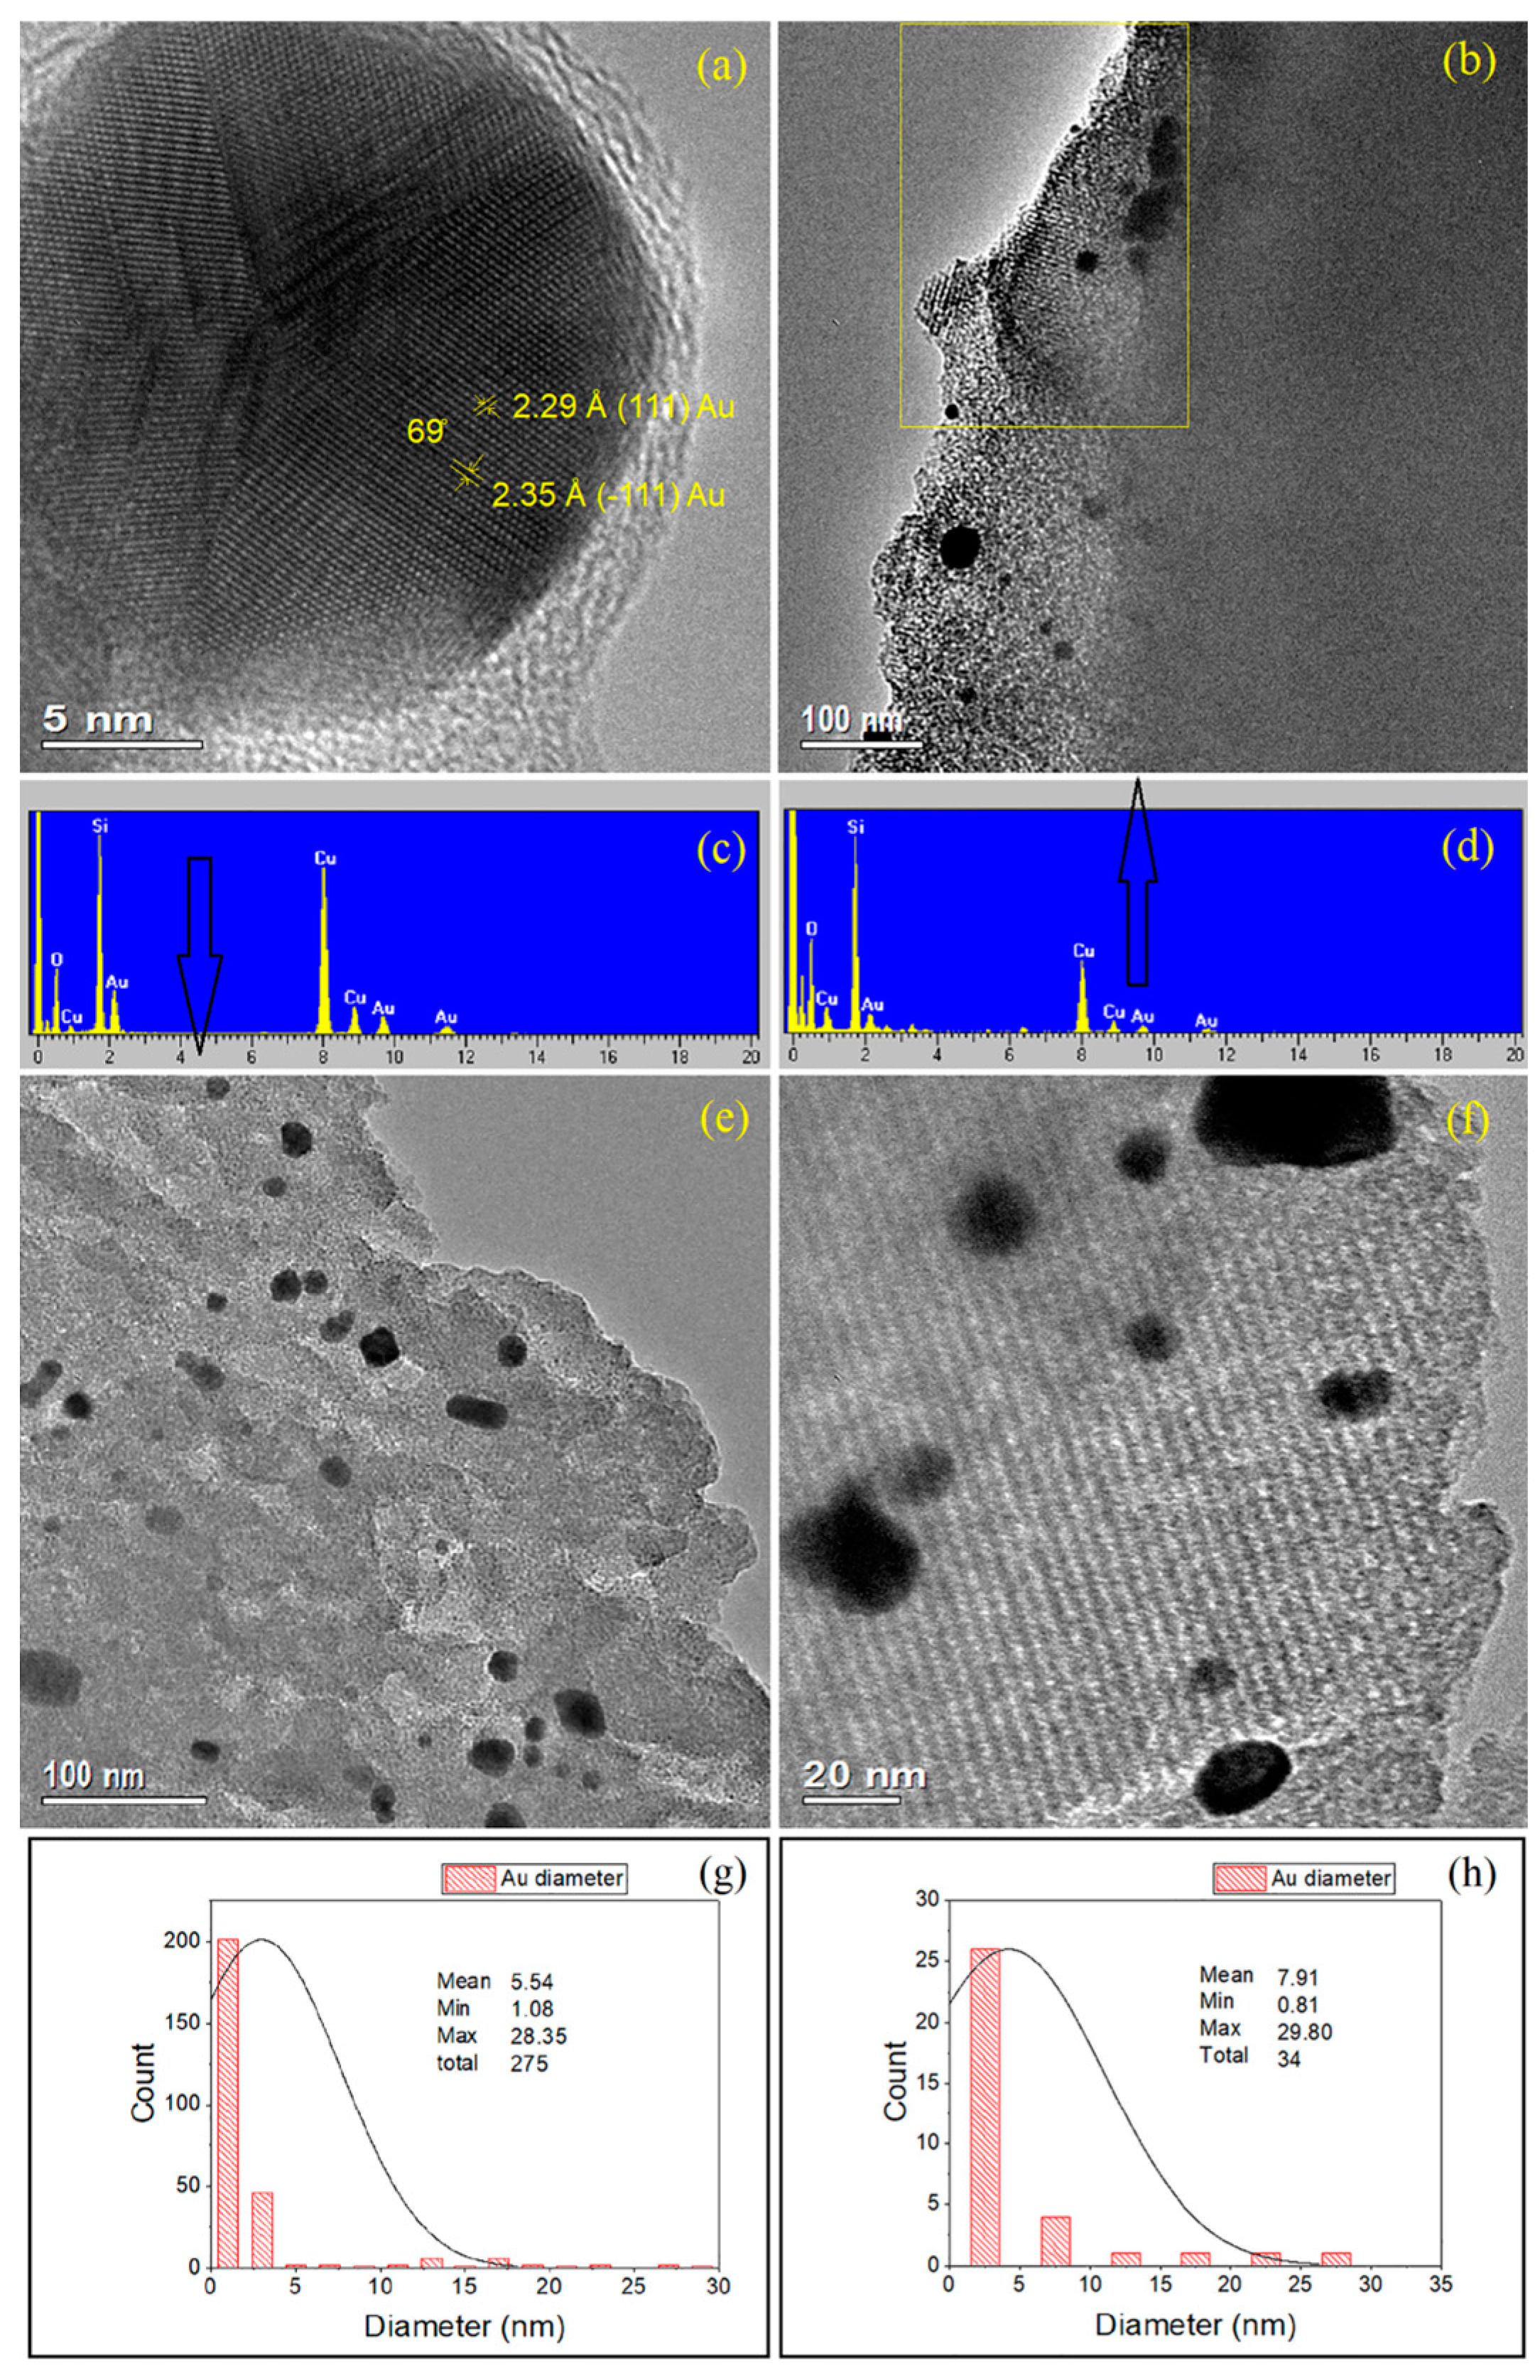
2.3.2. 2–Au–SBA-11
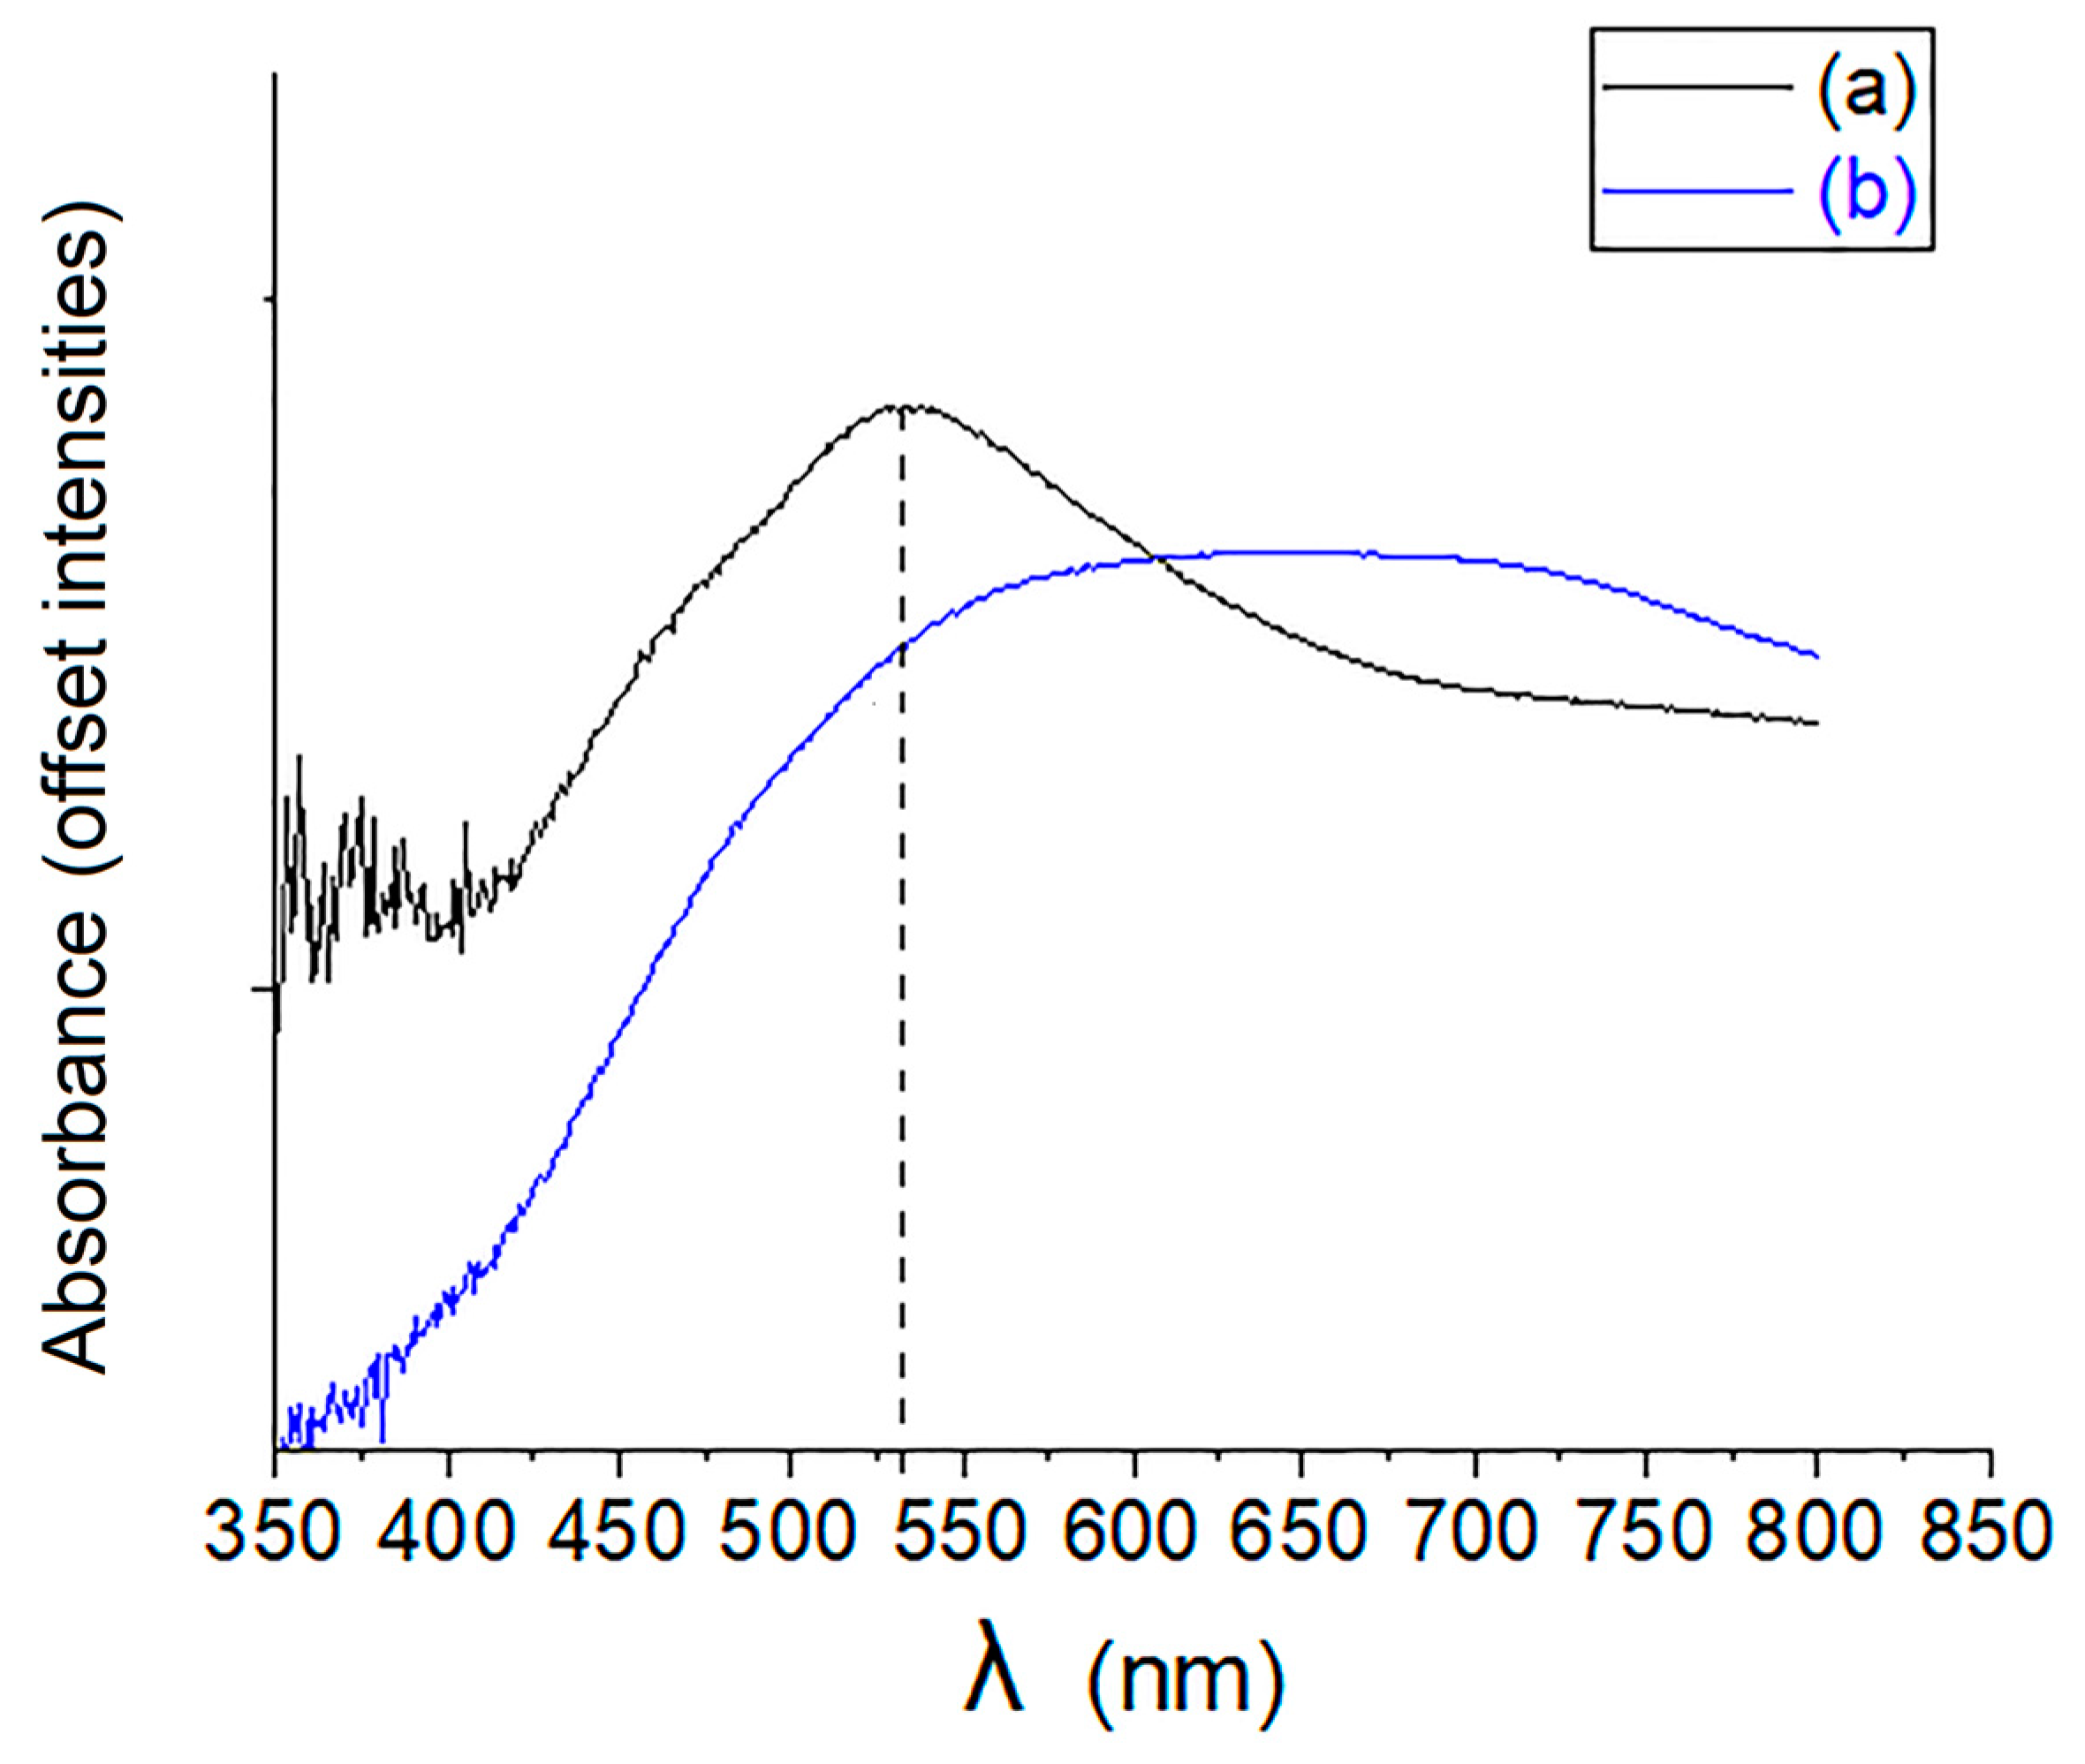
2.4. UV-Vis Spectra
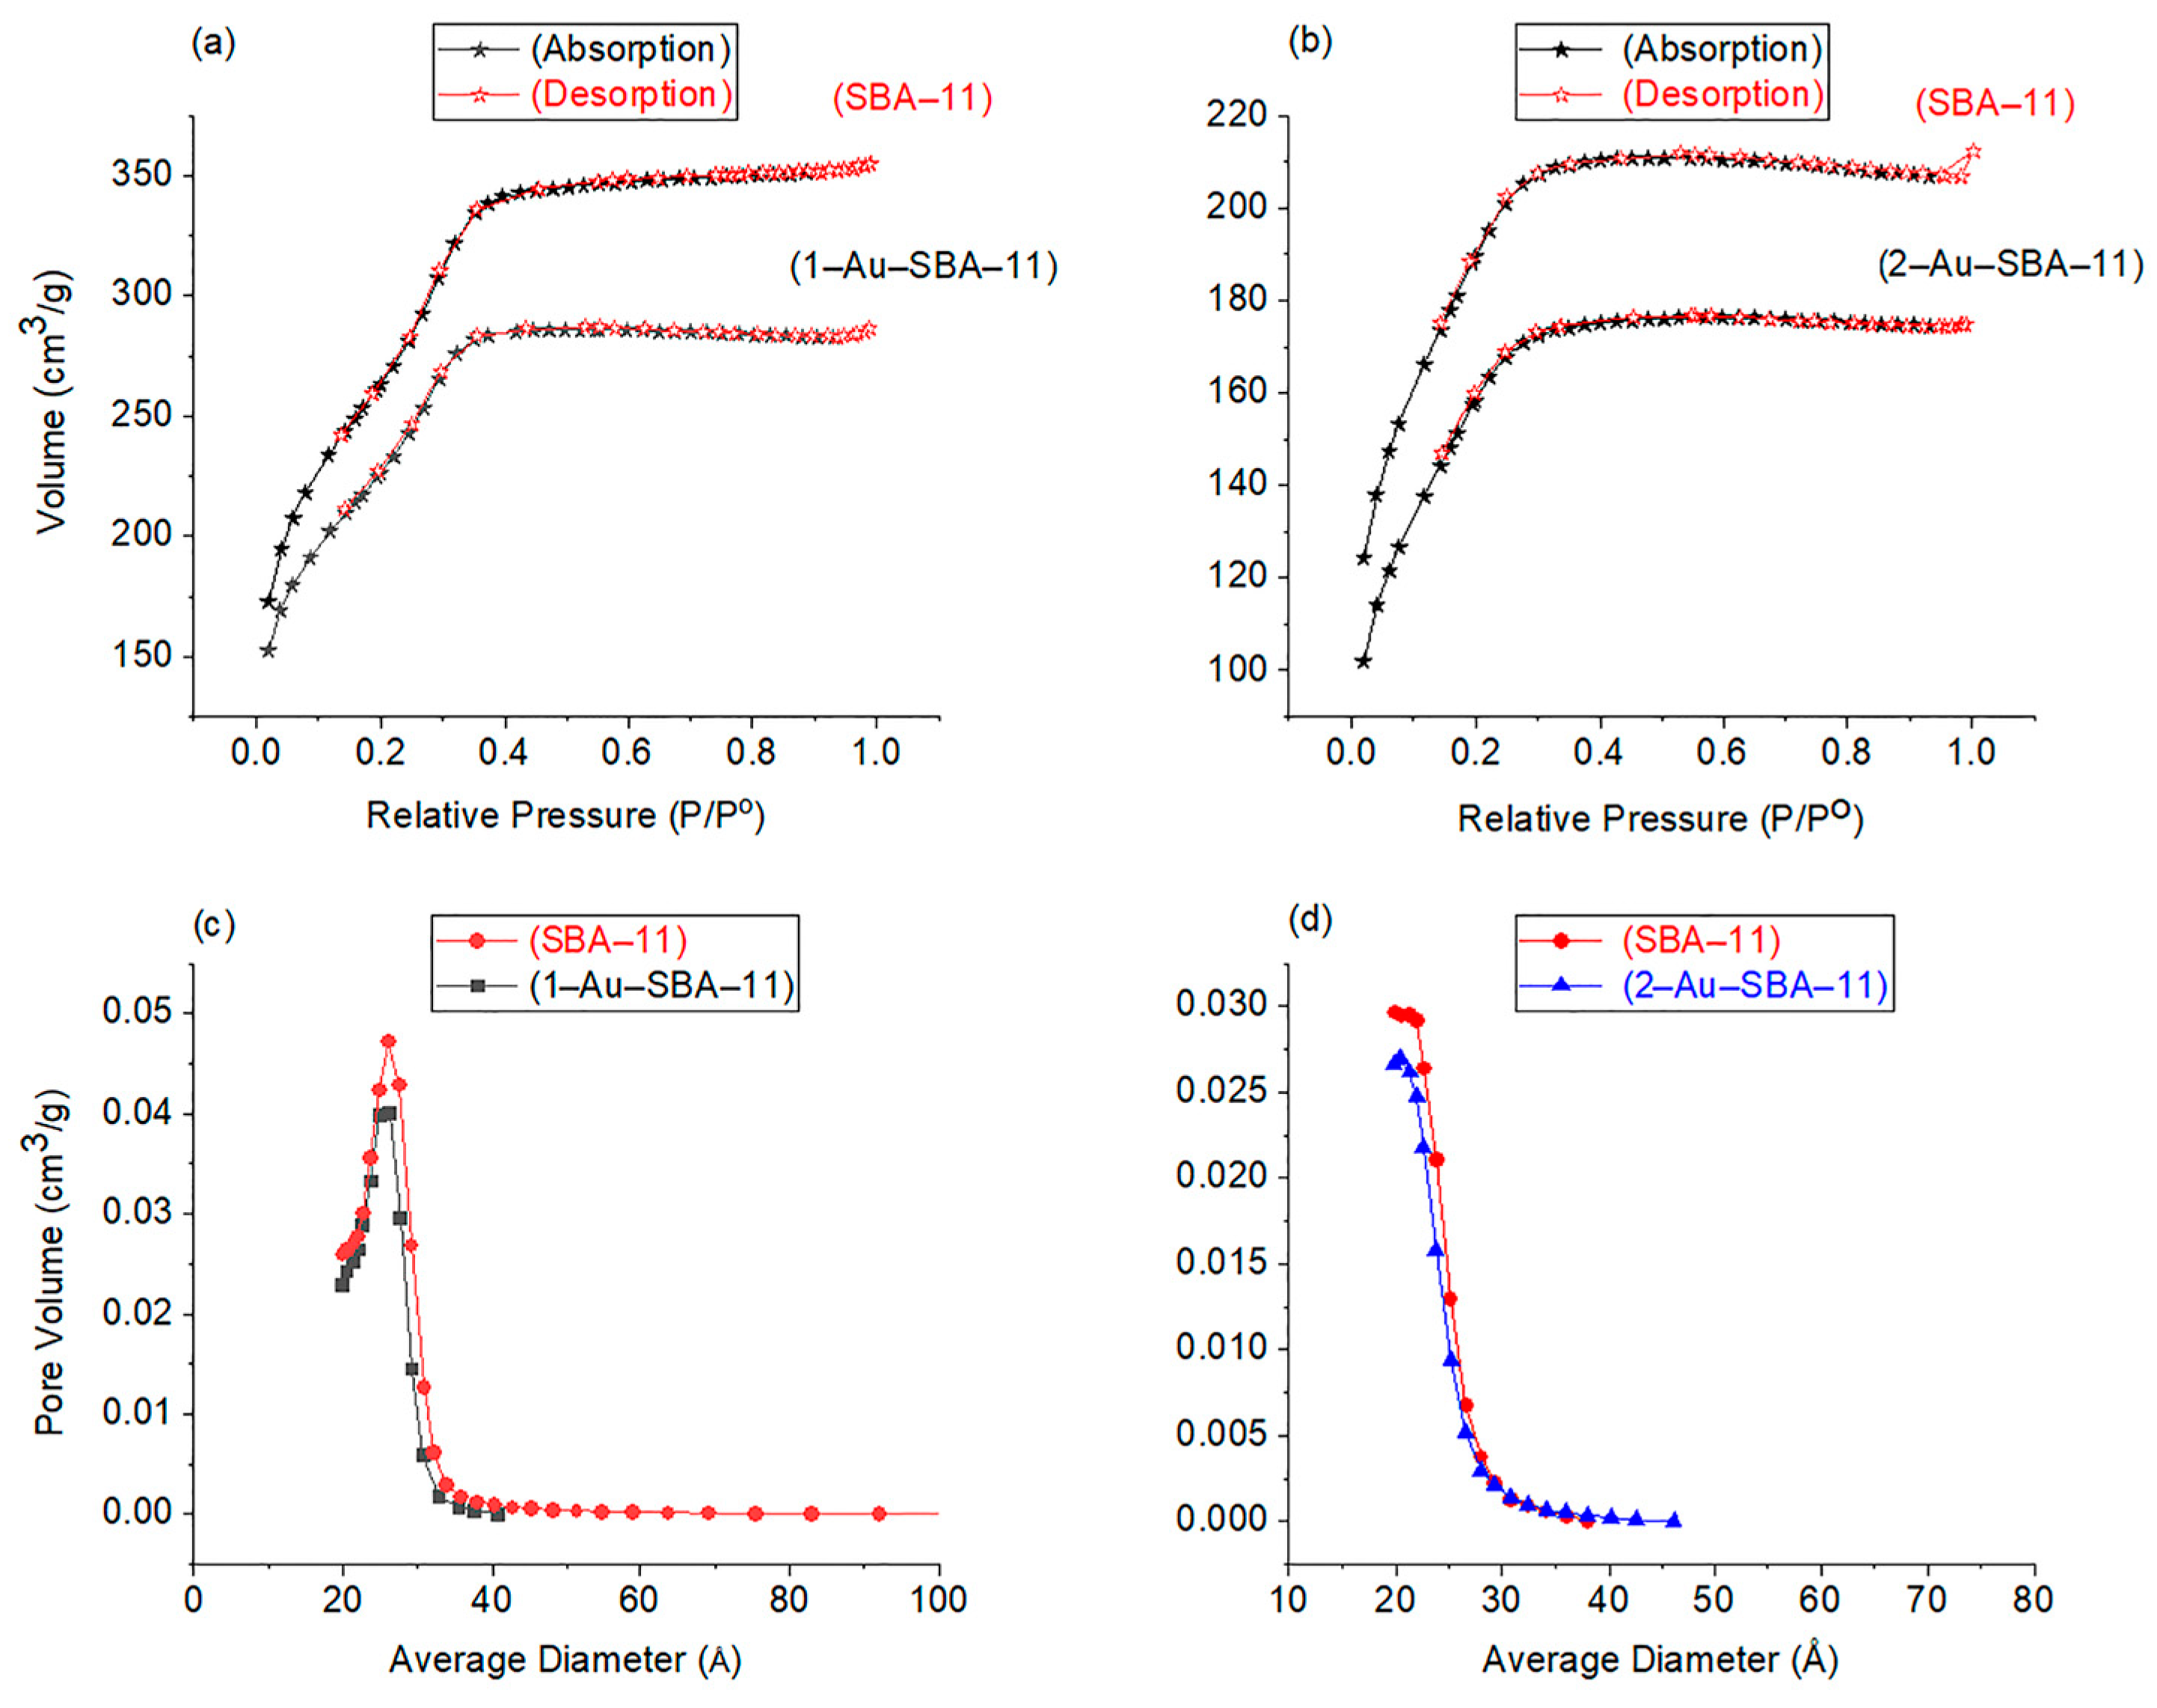
2.5. N2 Sorption Analysis
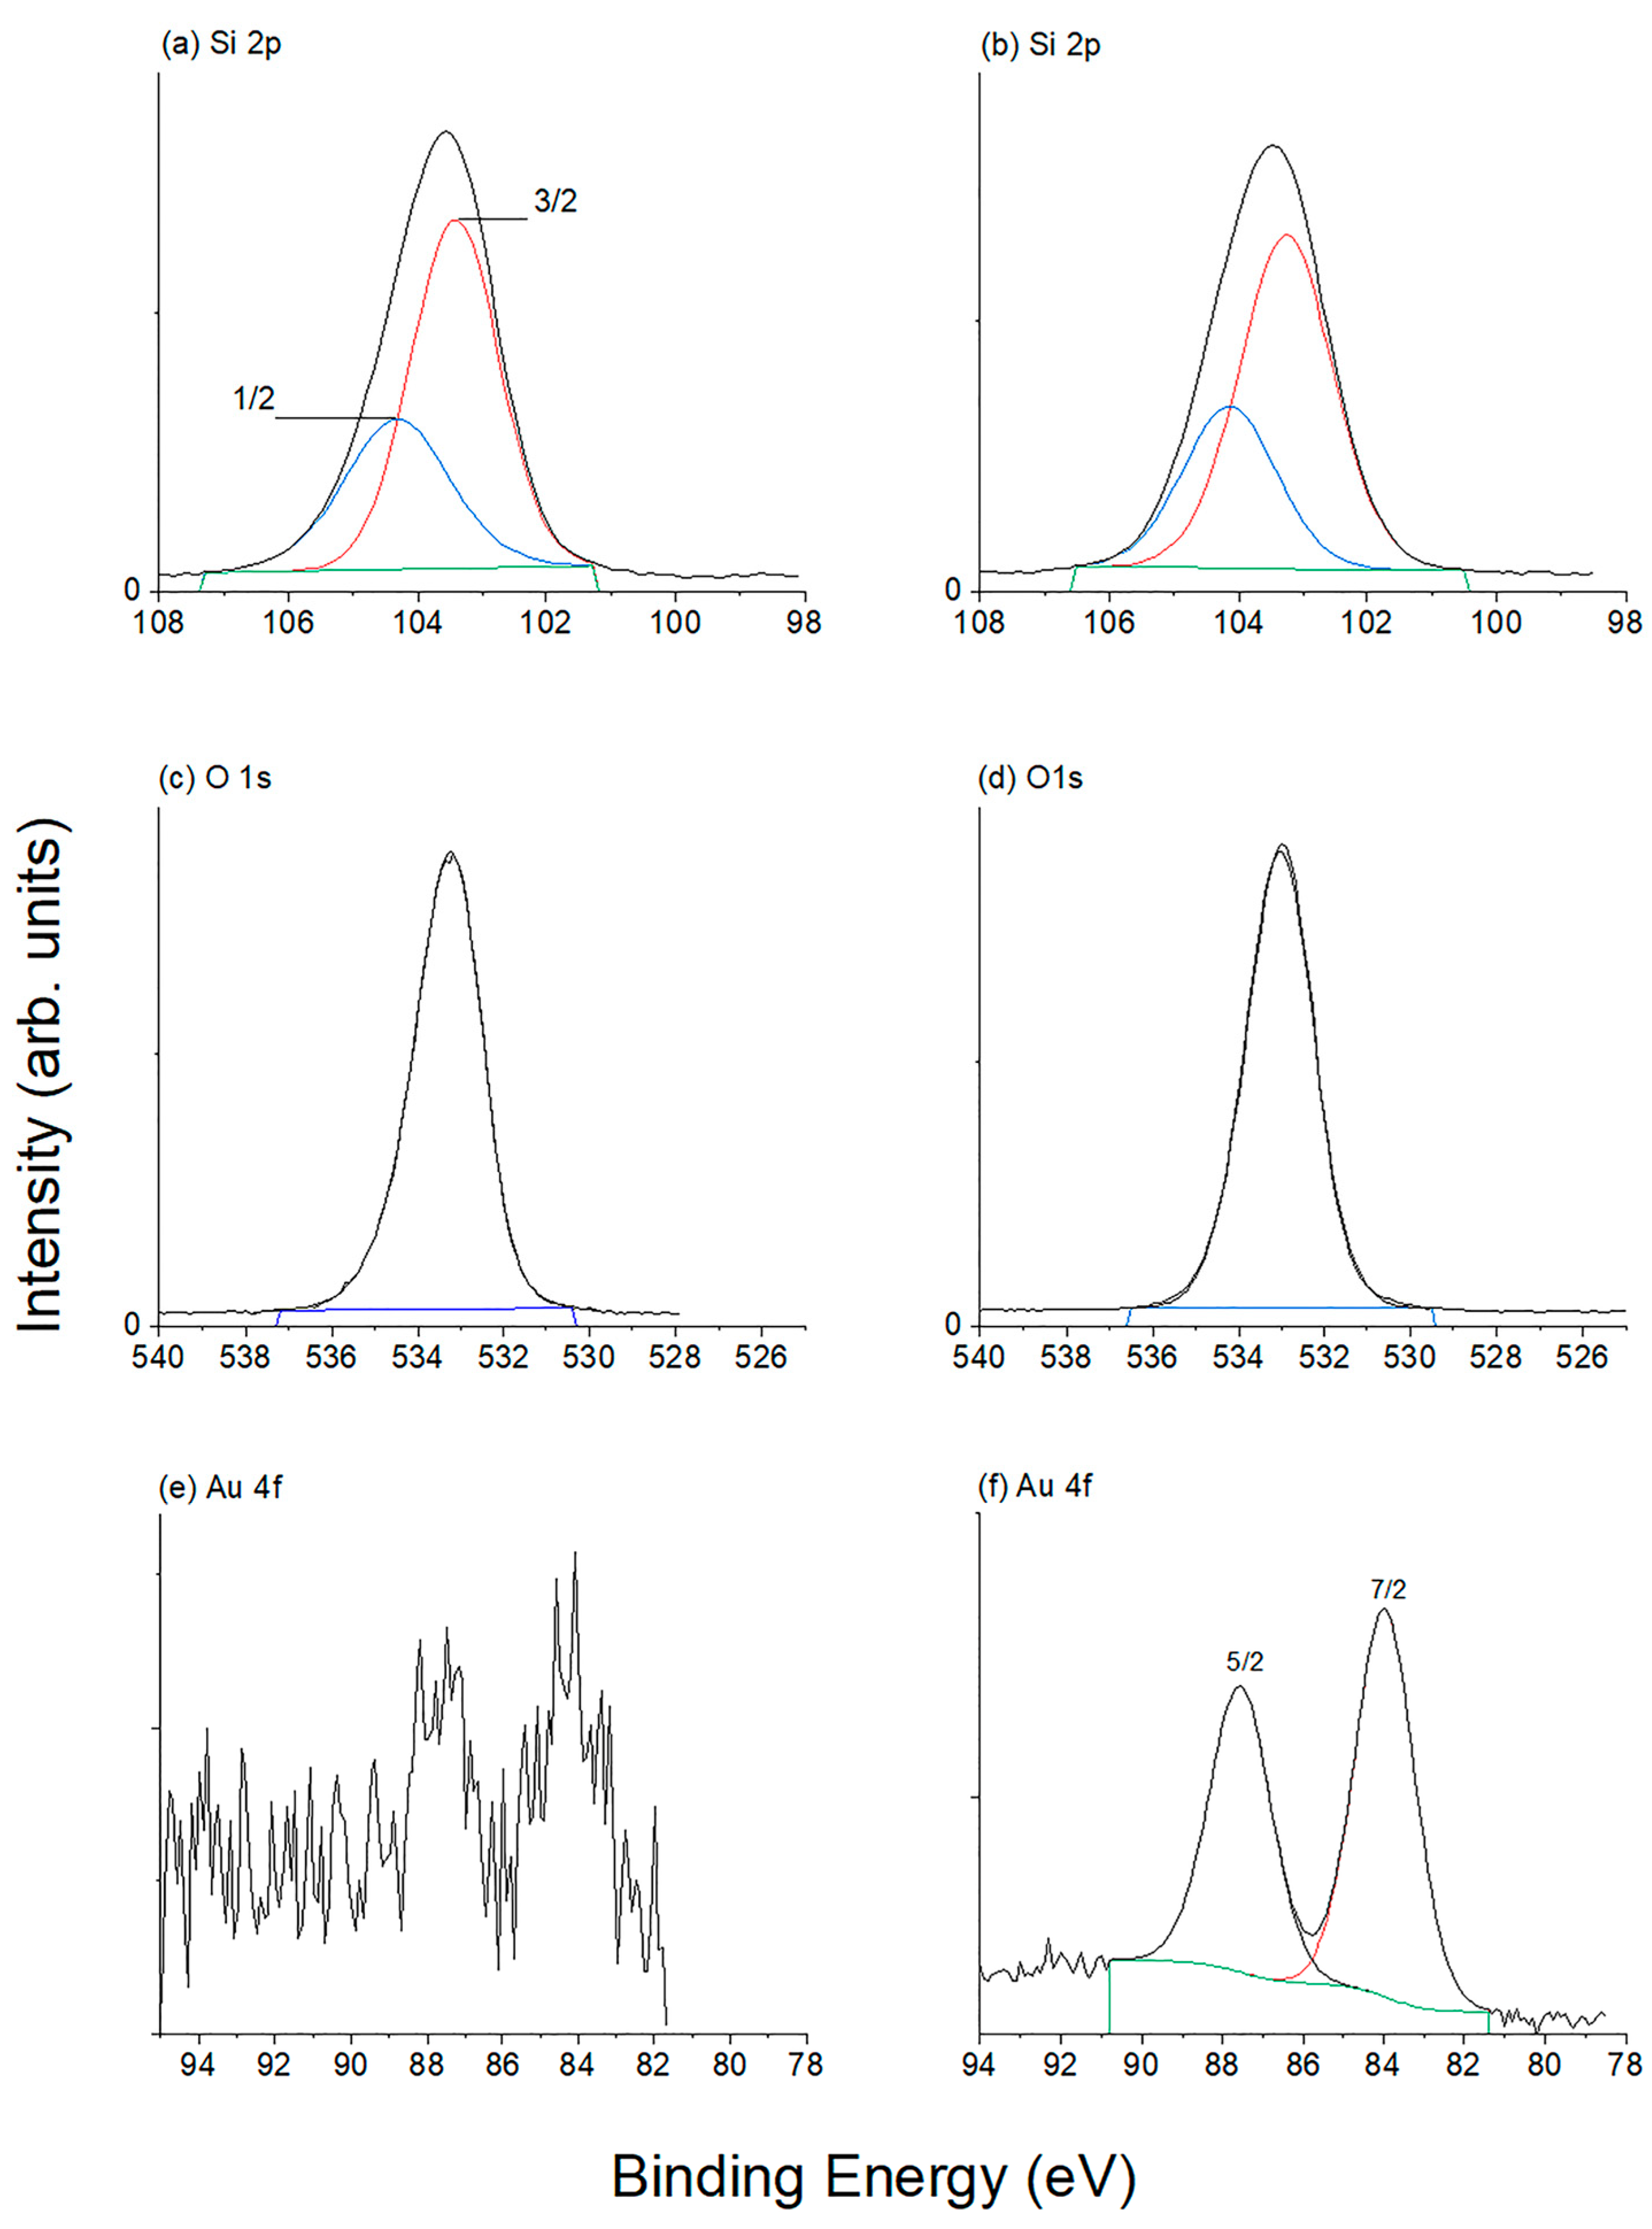
2.6. XPS
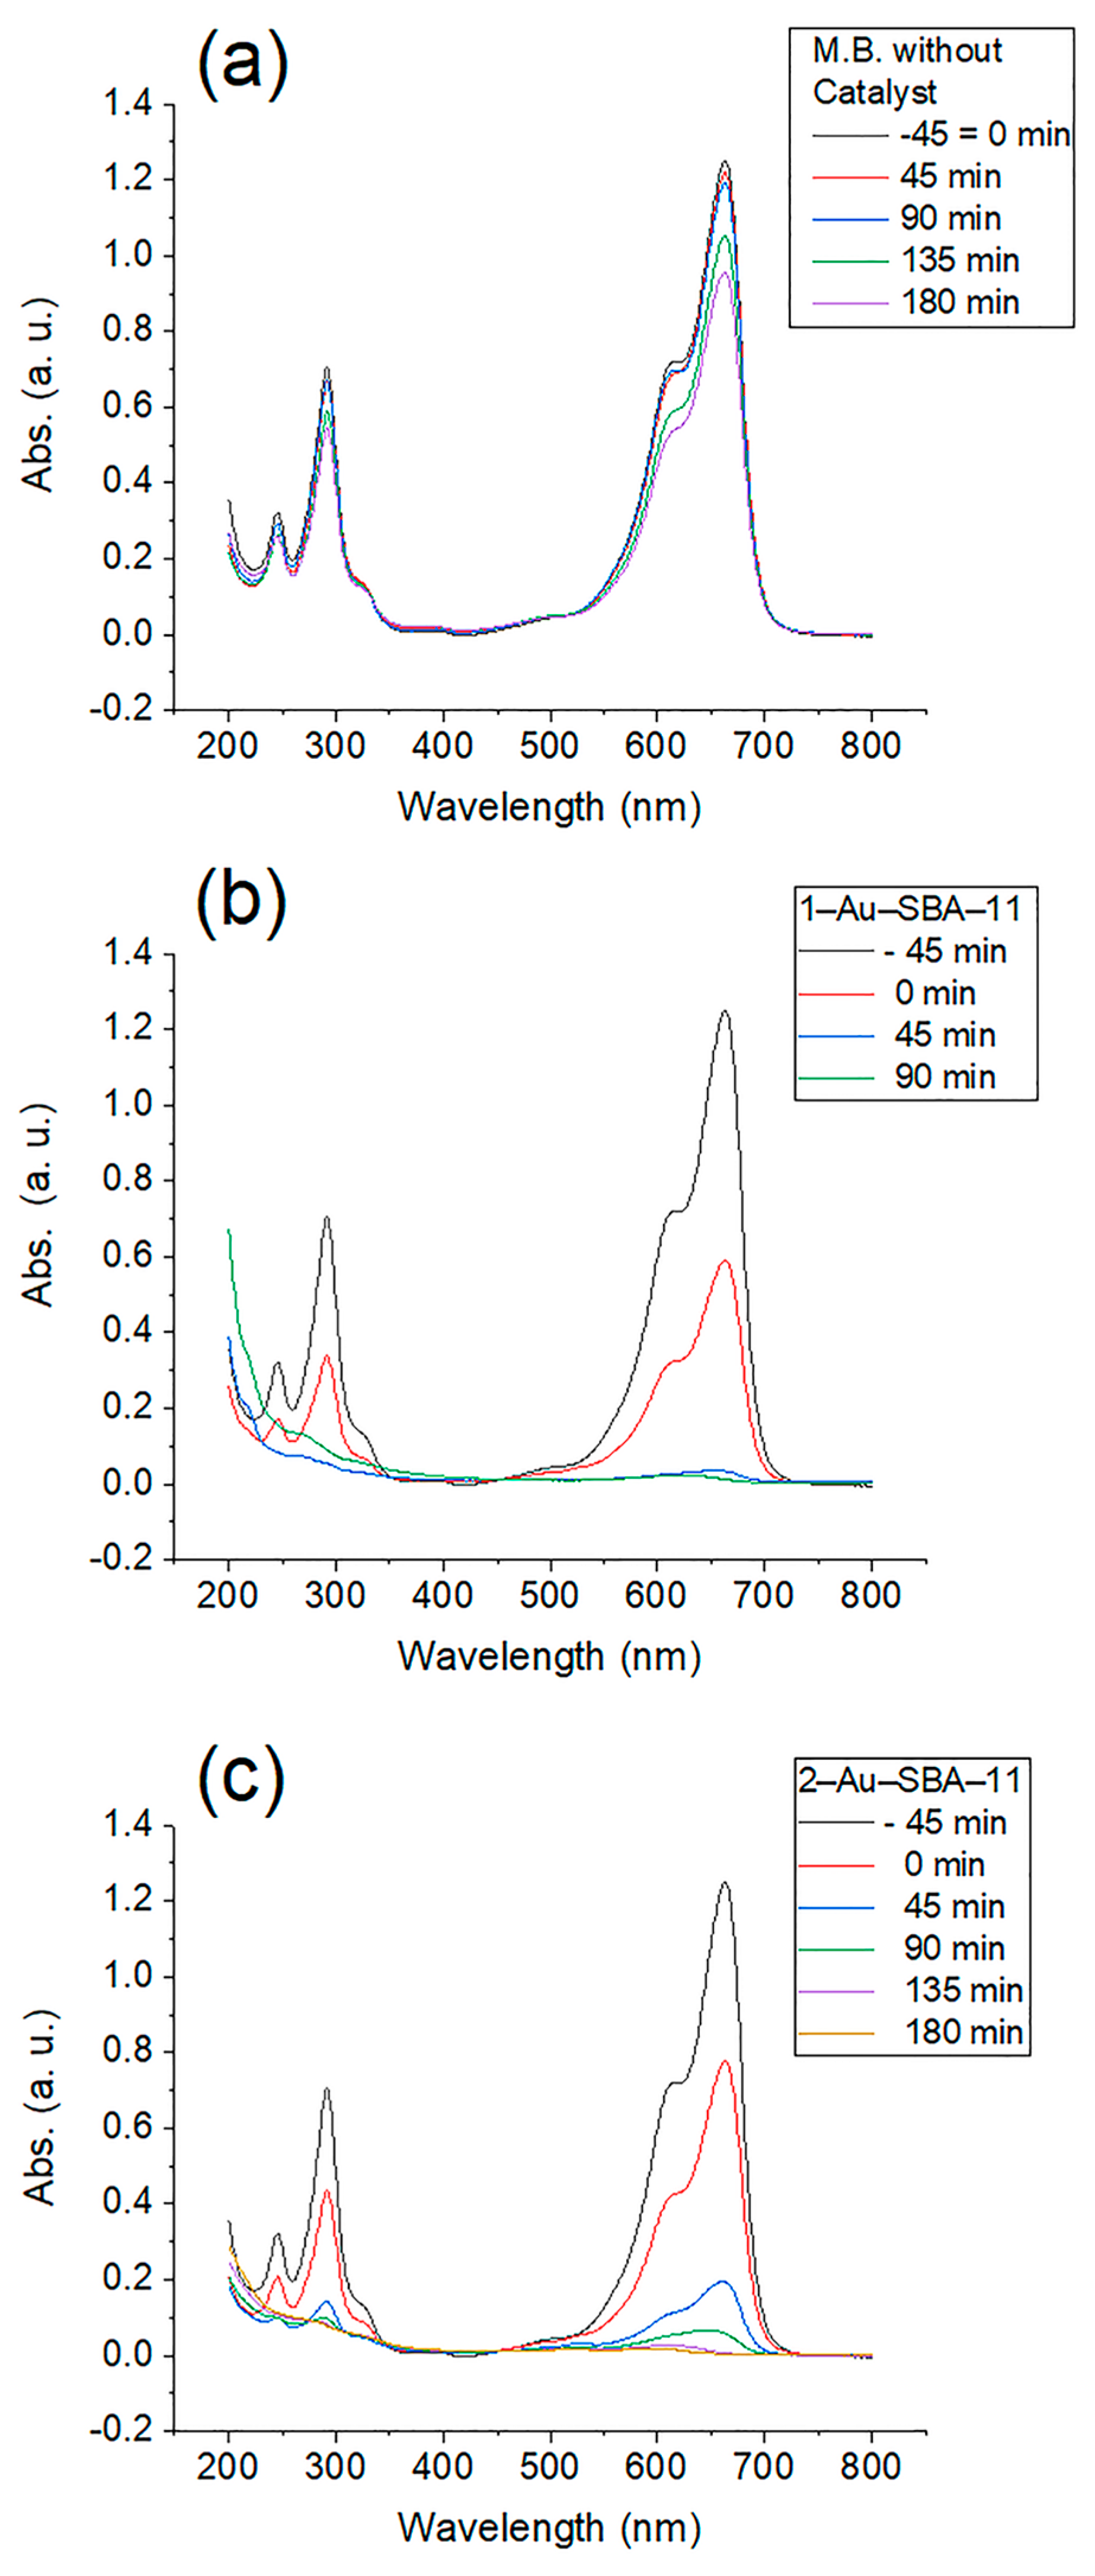
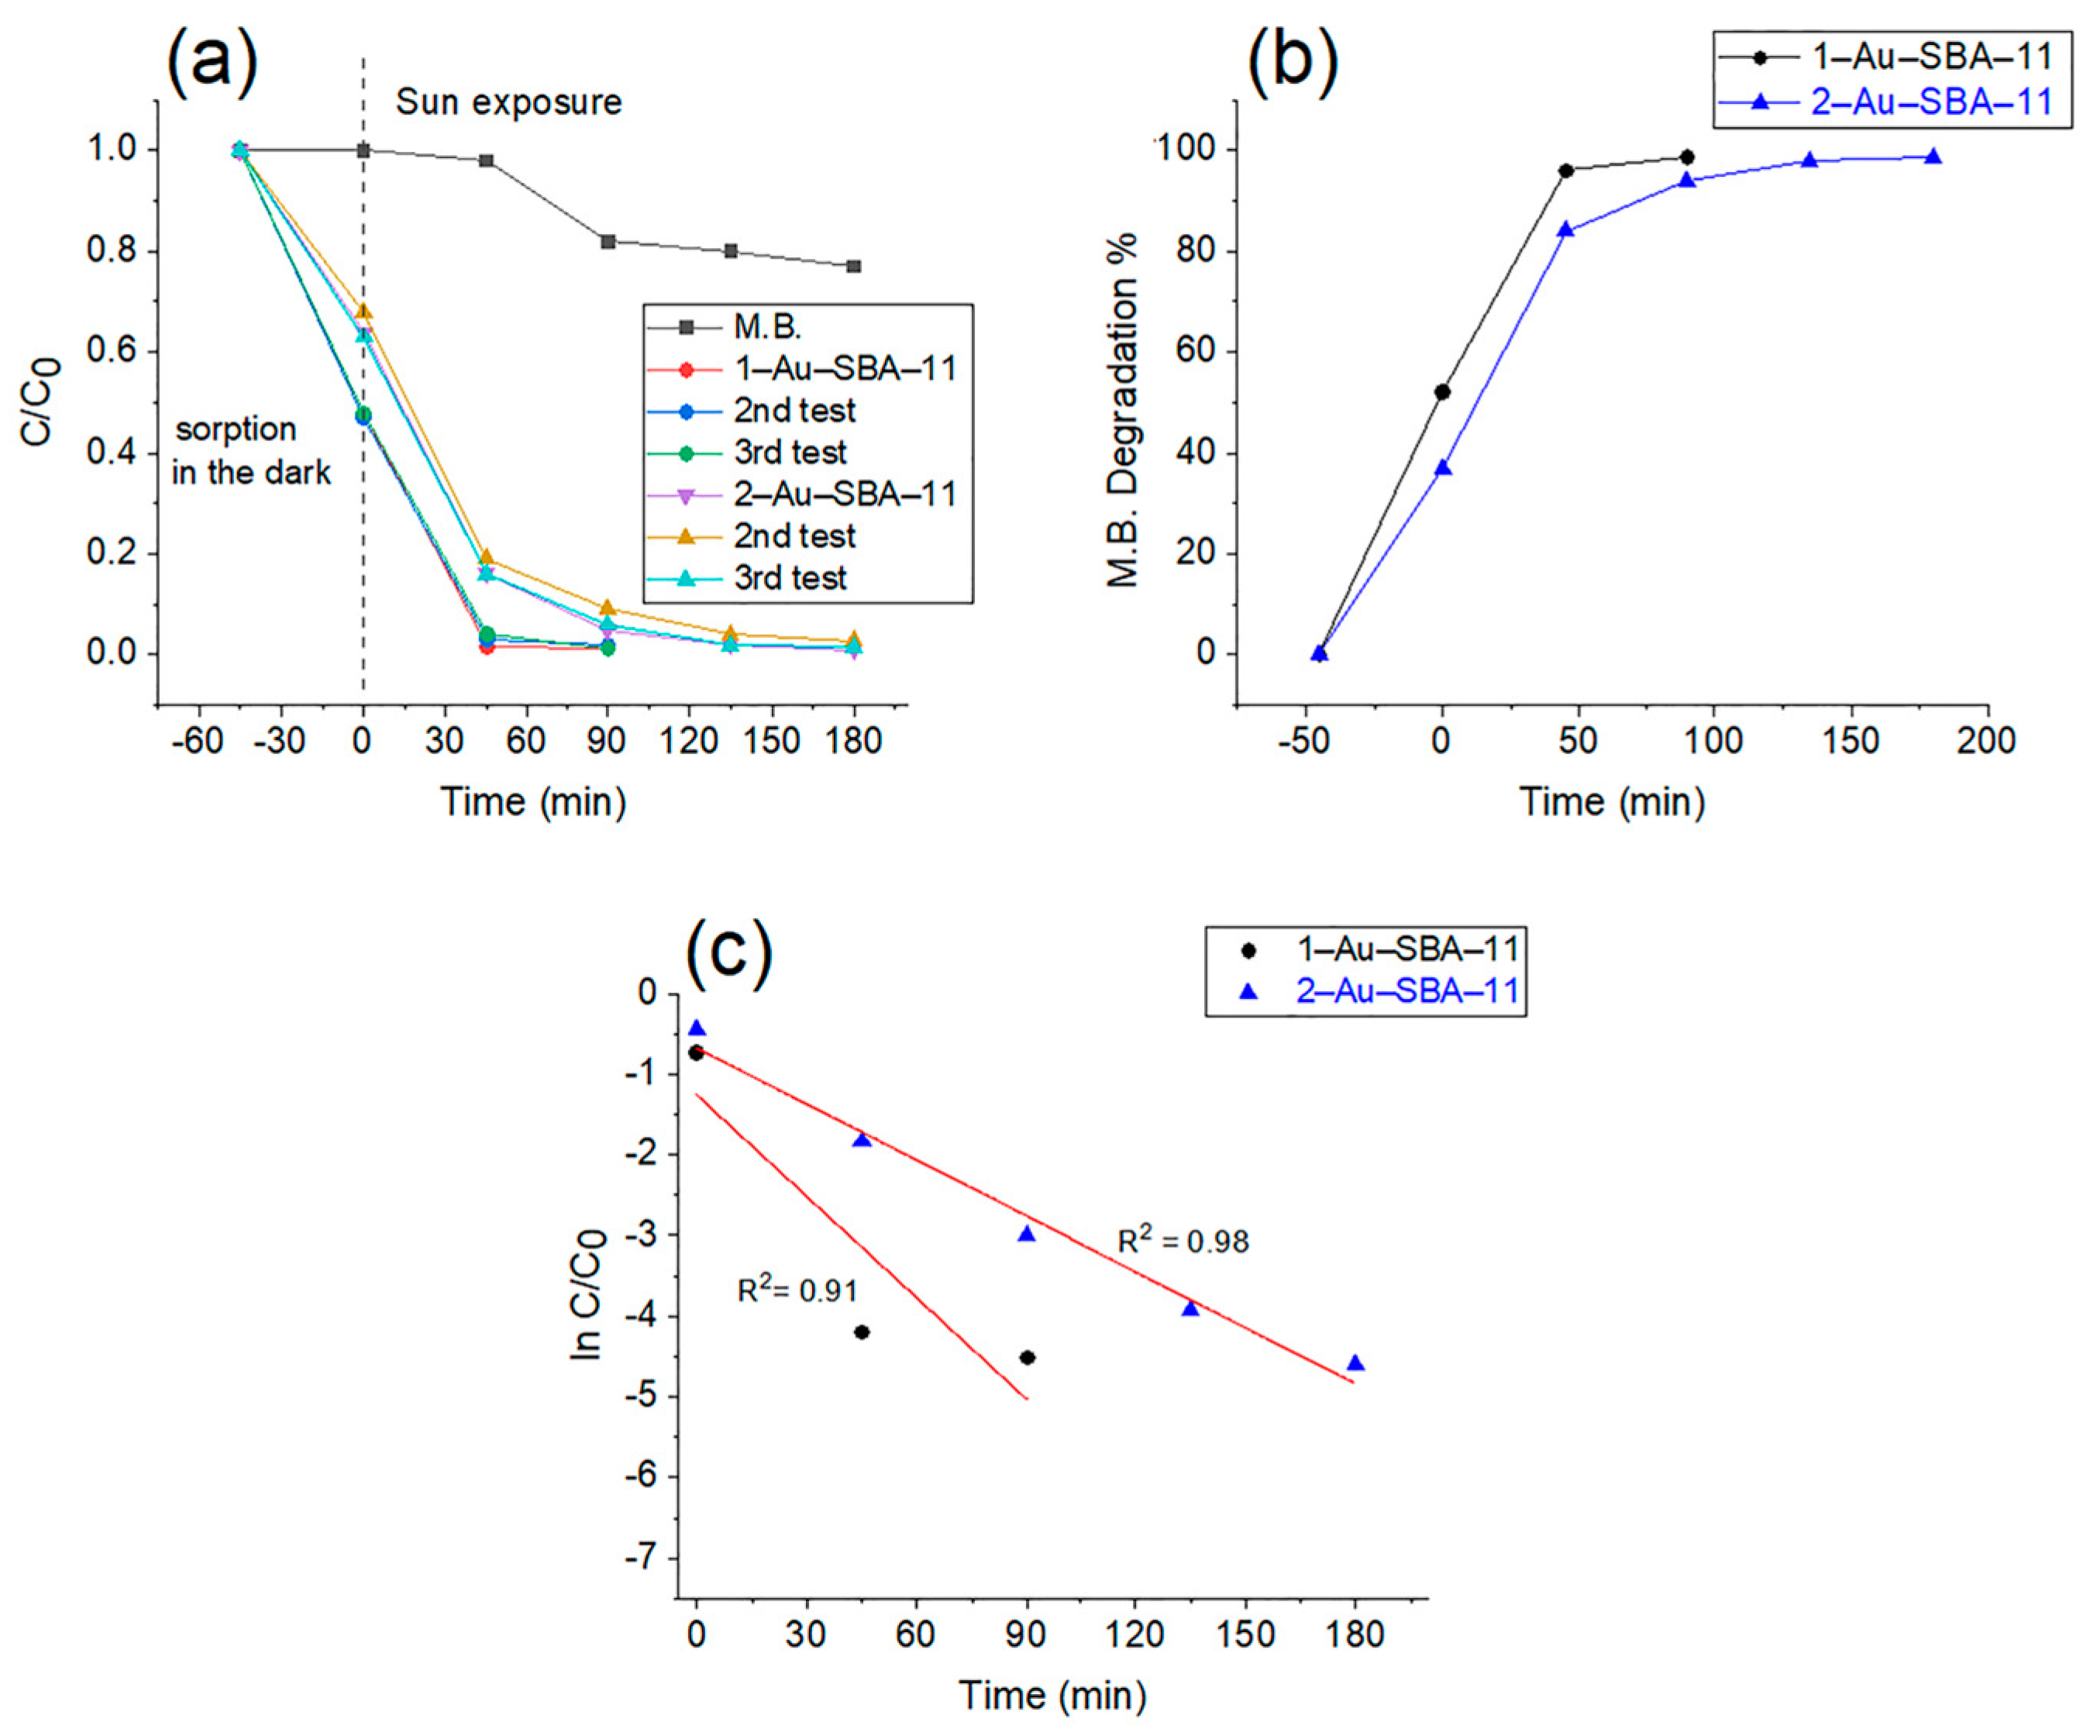
2.7. Photocatalytic Activity of Au–SBA-11
3. Materials and Methods
3.1. Synthesis of Mesoporous Silica (SBA-11)
3.2. Synthesis of Nanosized Au in Mesoporous Silica
3.3. Photocatalytic Activity of Au–SBA-11
3.4. Characterization Methods
4. Conclusions
Supplementary Materials
Author Contributions
Funding
Institutional Review Board Statement
Informed Consent Statement
Data Availability Statement
Acknowledgments
Conflicts of Interest
Abbreviations
| XRD | X-ray diffraction |
| EDX | energy-dispersive X-ray spectroscopy |
| HRTEM | high-resolution transmission electron microscopy |
| UV-vis | ultraviolet-visible |
| XPS | X-ray photoelectron spectroscopy |
| GI | gastrointestinal |
| Brij 56 | C36H74O11, also called C16EO10, polyethylene glycol hexadecyl ether, or polyoxyethylene (10) cetyl ether |
| TEOS | tetraethoxysilane |
| M.B. | methylene blue |
| Arb | Arbitrary |
References
- Peck, K.A.; Lien, J.; Su, M.; Stacy, A.D.; Guo, T. Bottom-up then top-down synthesis of gold nanostructures using mesoporous silica-coated gold nanorods. ACS Omega 2023, 8, 42667–42677. [Google Scholar] [CrossRef] [PubMed]
- Li, M.; Shi, Q.; Song, N.; Xiao, Y.; Wang, L.; Chen, Z.; James, T.D. Current trends in the detection and removal of heavy metal ions using functional materials. Chem. Soc. Rev. 2023, 52, 5827–5860. [Google Scholar] [CrossRef]
- da Silva, H.A.R.; Barbosa, K.M.; Alsaiari, R.A.; Silva, G.N.; de Oliveira Maciel Junior, J.L.; Rodrigues Cangussu, A.S.; Barros Araujo, S.B.; de Costa, L.S.; dos Santos Junior, J.R.; De Moura, C.V.R.; et al. Gold nanoparticle-loaded silica nanospheres for sensitive and selective electrochemical detection of bisphenol A. ACS Omega 2023, 8, 39023–39034. [Google Scholar] [CrossRef]
- Chen, Y.; Zheng, J.; Zhang, L.; Li, S.; Chen, Y.; Chui, K.K.; Zhang, W.; Shao, L.; Wang, J. Inversion of the Chiroptical Responses of Chiral Gold Nanoparticles with a Gold Film. ACS Nano 2024, 18, 383–394. [Google Scholar] [CrossRef] [PubMed]
- Amestoy, A.; Rangra, A.; Mansard, V.; Saya, D.; Pouget, E.; Mazaleyrat, E.; Severac, F.; Bergaud, C.; Oda, R.; Delville, M.H. Highly stable low-strain flexible sensors based on gold nanoparticles/silica nanohelices. ACS Appl. Mater. Interfaces 2023, 15, 39480–39493. [Google Scholar] [CrossRef] [PubMed]
- Tang, S.; Li, R.; Luo, T.; Huang, T.; Lu, X.; Wu, X.; Dong, Y.; Wu, C.; Xu, K.; Wang, Y. Preparation of Gd-doped AuNBP@mSiO2 nanocomposites for the MR imaging, drug delivery and chemo-photothermal synergistic killing of breast cancer cells. RSC Adv. 2023, 13, 23976–23983. [Google Scholar] [CrossRef]
- Hong, D.; Jo, E.J.; Bang, D.; Jung, C.; Lee, Y.E.; Noh, Y.S.; Shin, M.G.; Kim, M.G. Plasmonic approach to fluorescence enhancement of mesoporous silica-coated gold nanorods for highly sensitive influenza a virus detection using lateral flow immunosensor. ACS Nano 2023, 17, 16607–16619. [Google Scholar] [CrossRef]
- Zhang, Q.; Hou, D.; Wen, X.; Xin, M.; Li, Z.; Wu, L.; Pathak, J.L. Gold nanomaterials for oral cancer diagnosis and therapy: Advances, challenges, and prospects. Mater. Today Bio. 2022, 15, 100333. [Google Scholar] [CrossRef]
- Prasad, R.; Selvaraj, K. Effective distribution of gold nanorods in ordered thick mesoporous silica: A choice of noninvasive theranostics. ACS Appl. Mater. Interfaces 2023, 15, 47615–47627. [Google Scholar] [CrossRef]
- Zhang, T.; Shao, L.; Jaafar, A.; Zeimpekis, I.; de Groot, C.H.; Bartlett, P.N.; Hector, A.L.; Huang, R. Tunable neuromorphic switching dynamics via porosity control in mesoporous silica diffusive memristors. ACS Appl. Mater. Interfaces 2024, 16, 16641–16652. [Google Scholar] [CrossRef]
- Alshangiti, D.M.; Ghobashy, M.M.; Alqahtani, H.A.; El-damhougy, T.K.; Madani, M. The energetic and physical concept of gold nanorod-dependent fluorescence in cancer treatment and development of new photonic compounds|review. RSC Adv. 2023, 13, 32223–32265. [Google Scholar] [CrossRef]
- Lima-Sousa, R.; Alves, C.G.; Melo, B.L.; Costa, F.J.P.; Nave, M.; Moreira, A.F.; Mendonça, A.G.; Correia, I.J.; de Melo-Diogo, D. Injectable hydrogels for the delivery of nanomaterials for cancer combinatorial photothermal therapy. Biomater. Sci. 2023, 11, 6082–6108. [Google Scholar] [CrossRef] [PubMed]
- Das, S.S.; Sharma, D.; Rao, B.V.K.; Arora, M.K.; Ruokolainen, J.; Dhanka, M.; Singh, H.; Kesari, K.K. Natural cationic polymer-derived injectable hydrogels for targeted chemotherapy. Mater. Adv. 2023, 4, 6064–6091. [Google Scholar] [CrossRef]
- Onugwu, A.L.; Ugorji, O.L.; Ufondu, C.A.; Ihim, S.A.; Echezona, A.C.; Nwagwu, C.S.; Onugwu, S.O.; Uzondu, S.W.G.; Agbo, C.P.; Ogbonna, J.D.; et al. Nanoparticle-based delivery systems as emerging therapy in retinoblastoma: Recent advances, challenges and prospects. Nanoscale Adv. 2023, 5, 4628–4648. [Google Scholar] [CrossRef] [PubMed]
- Fergusson, J.; Wallace, G.Q.; Sloan-Dennison, S.; Carland, R.; Shand, N.C.; Graham, D.; Faulds, K. Plasmonic and photothermal properties of silica-capped gold nanoparticle aggregates. J. Phys. Chem. C 2023, 127, 24475–24486. [Google Scholar] [CrossRef]
- Esmaeili, H.; Patino-Guerrero, A.; Nelson, R.A.; Karamanova, N.; Fisher, T.M.; Zhu, W.; Perreault, F.; Migrino, R.Q.; Nikkhah, M. Engineered gold and silica nanoparticle-incorporated hydrogel scaffolds for human stem cell-derived cardiac tissue engineering. ACS Biomater. Sci. Eng. 2024, 10, 2351–2366. [Google Scholar] [CrossRef]
- Delpiano, G.R.; Casula, M.F.; Piludu, M.; Corpino, R.; Ricci, P.C.; Vallet-Regí, M.; Sanjust, E.; Monduzzi, M.; Salis, A. Assembly of multicomponent nano-bioconjugates composed of mesoporous silica nanoparticles, proteins, and gold nanoparticles. ACS Omega 2019, 4, 11044–11052. [Google Scholar] [CrossRef]
- Hernando, P.J.; Ivanova, I.M.; Chessa, S.; Marín, M.J.; Dedola, S.; Field, R.A. Sensitive dipstick assays for lectin detection, based on glycan–BSA conjugate immobilisation on gold nanoparticles. Org. Chem. Front. 2023, 10, 3819–3829. [Google Scholar] [CrossRef]
- Doveri, L.; Diaz Fernandez, Y.A.; Dacarro, G. Nanomaterials for photothermal antimicrobial surfaces. ACS Omega 2024, 9, 25575–25590. [Google Scholar] [CrossRef]
- Lenders, V.; Koutsoumpou, X.; Phan, P.; Soenen, S.J.; Allegaert, K.; de Vleeschouwer, S.; Toelen, J.; Zhao, Z.; Manshian, B.B. Modulation of engineered nanomaterial interactions with organ barriers for enhanced drug transport. Chem. Soc. Rev. 2023, 52, 4672–4724. [Google Scholar] [CrossRef]
- Jiang, P.; Liang, B.; Zhang, Z.; Fan, B.; Zeng, L.; Zhou, Z.; Mao, Z.; Xu, Q.; Yao, W.; Shen, Q. New insights into nanosystems for non-small-cell lung cancer: Diagnosis and treatment. RSC Adv. 2023, 13, 19540–19564. [Google Scholar] [CrossRef] [PubMed]
- Alizar, Y.Y.; Ramasamy, M.; Kim, G.W.; Ha, J.W. Tuning chemical interface damping: Competition between surface damping pathways in amalgamated gold nanorods coated with mesoporous silica shells. JACS Au 2023, 3, 3247–3258. [Google Scholar] [CrossRef] [PubMed]
- Soltani, S.; Khanian, N.; Rashid, U.; Yaw Choong, T.S.Y. Fundamentals and recent progress relating to the fabrication, functionalization and characterization of mesostructured materials using diverse synthetic methodologies. RSC Adv. 2020, 10, 16431–16456. [Google Scholar] [CrossRef] [PubMed]
- Wisniewska, J.; Sobczak, I.; Ziolek, M. The effect of the calcium dopant on the activity and selectivity of gold catalysts supported on SBA-15 and Nb-containing SBA-15 in methanol oxidation. Catal. Sci. Technol. 2021, 11, 2242–2260. [Google Scholar] [CrossRef]
- Dhameliya, T.M.; Donga, H.A.; Vaghela, P.V.; Panchal, B.G.; Sureja, D.K.; Bodiwala, K.B.; Chhabria, M.T. A decennary update on applications of metal nanoparticles (MNPs) in the synthesis of nitrogen- and oxygen-containing heterocyclic scaffolds. RSC Adv. 2020, 10, 32740–32820. [Google Scholar] [CrossRef]
- Nayl, A.A.; Abd-Elhamid, A.I.; Aly, A.A.; Bräse, S. Recent progress in the applications of silica-based nanoparticles. RSC Adv. 2022, 12, 13706–13726. [Google Scholar] [CrossRef]
- Pazos-Perez, N.; Fitzgerald, J.M.; Giannini, V.; Guerrini, L.; Alvarez-Puebla, R.A. Modular assembly of plasmonic core-satellite structures as highly brilliant SERS-encoded nanoparticles. Nanoscale Adv. 2019, 1, 122–131. [Google Scholar] [CrossRef]
- Cassiers, K.; Linssen, T.; Mathieu, M.; Benjelloun, M.; Schrijnemakers, K.; Van Der Voort, P.; Cool, P.; Vansant, E.F. A detailed study of thermal, hydrothermal, and mechanical stabilities of a wide range of surfactant assembled mesoporous silicas. Chem. Mater. 2002, 14, 2317–2324. [Google Scholar] [CrossRef]
- Kruk, M.; Jaroniec, M.; Ko, C.H.; Ryoo, R. Characterization of the porous structure of SBA-15. Chem. Mater. 2000, 12, 1961–1968. [Google Scholar] [CrossRef]
- Zhao, D.; Huo, Q.; Feng, J.; Chmelka, B.F.; Stucky, G.D. Nonionic Triblock and Star Diblock Copolymer and Oligomeric Surfactant Syntheses of Highly Ordered, Hydrothermally Stable, Mesoporous Silica Structures. J. Am. Chem. Soc. 1998, 120, 6024–6036. [Google Scholar] [CrossRef]
- Sanz-Ortiz, M.N.; Sentosun, K.; Bals, S.; Liz-Marzán, L.M. Templated growth of surface enhanced raman scattering-active branched gold nanoparticles within radial mesoporous silica shells. ACS Nano 2015, 9, 10489–10497. [Google Scholar] [CrossRef] [PubMed]
- Kashyap, T.; Jaiswal, M.K.; Choudhury, B. Weak plasmonic photocatalysis in unsupported colloidal gold nanorods. Next Mater. 2024, 4, 100213. [Google Scholar] [CrossRef]
- Hernández-Acosta, M.A.; Torres-Torres, C.; Bornacelli, J.; García-Merino, J.A.; Can-Uc, B.; Rangel-Rojo, R.; Oliver, A. A comprehensive study of the nonlinear optical response exhibited by ion-implanted silica plates with Au and Pt nanostructures. Results Opt. 2021, 4, 100098. [Google Scholar] [CrossRef]
- Tirkey, A.; Babu, P.J. Synthesis and characterization of citrate-capped gold nanoparticles and their application in selective detection of creatinine (A kidney biomarker). Sens. Int. 2024, 5, 100252. [Google Scholar] [CrossRef]
- Sapkota, K.; Chaudhary, P.; Han, S.S. Environmentally sustainable route to SiO2@Au-Ag nanocomposites for biomedical and catalytic applications. RSC Adv. 2018, 8, 31311–31321. [Google Scholar] [CrossRef]
- Thommes, M.; Kaneko, K.; Neimark, A.V.; Olivier, J.P.; Rodriguez-Reinoso, F.; Rouquerol, J.; Sing, K.S.W. Physisorption of gases, with special reference to the evaluation of surface area and pore size distribution (IUPAC Technical Report). Pure Appl. Chem. 2015, 87, 1051–1069. [Google Scholar] [CrossRef]
- Bai, Y.; Li, Z.; Cheng, B.; Zhang, M.; Su, K. Higher UV-shielding ability and lower photocatalytic activity of TiO2 @SiO2/APTES and its excellent performance in enhancing the photostability of poly(p-phenylene sulfide). RSC Adv. 2017, 7, 21758–21767. [Google Scholar] [CrossRef]
- Konashuk, A.S.; Filatova, E.O. Redistribution of valence and conduction band states depending on the method of modification of SiO2 structure. Phys. Chem. Chem. Phys. 2017, 19, 26201–26209. [Google Scholar] [CrossRef]
- Al Soubaihi, R.M.; Saoud, K.M.; Dutta, J. Low-temperature CO oxidation by silver nanoparticles in silica aerogel mesoreactors. Chem. Eng. J. 2023, 455, 140576. [Google Scholar] [CrossRef]
- Fan, Y.; Zhang, Z.; Yu, J.; Deng, X.; Shi, C.; Zhou, H.; Meng, F.; Feng, J. Atomic surface of quartz glass induced by photocatalytic green chemical mechanical polishing using the developed SiO2@TiO2 core-shell slurry. Nanoscale Adv. 2024, 6, 1380–1391. [Google Scholar] [CrossRef]
- Ci, D.; Wang, N.; Xu, Y.; Wu, S.; Wang, J.; Li, H.; Xuan, S.; Fang, Q. SiO2@AuAg/PDA hybrid nanospheres with photo-thermally enhanced synergistic antibacterial and catalytic activity. RSC Adv. 2024, 14, 4518–4532. [Google Scholar] [CrossRef] [PubMed]
- Chandraker, S.K.; Lal, M.; Shukla, R. DNA-binding, antioxidant, H2O2 sensing and photocatalytic properties of biogenic silver nanoparticles using Ageratum conyzoides L. leaf extract. RSC Adv. 2019, 9, 23408–23417. [Google Scholar] [CrossRef] [PubMed]
- Mondal, S.; De Anda Reyes, M.E.; Pal, U. Plasmon induced enhanced photocatalytic activity of gold loaded hydroxyapatite nanoparticles for methylene blue degradation under visible light. RSC Adv. 2017, 7, 8633–8645. [Google Scholar] [CrossRef]
- Cavusar, O.; Nakay, E.; Kazakoglu, U.; Abkenar, S.; Ow-Yang, C.; Acar, H. Synthesis of stable gold nanoparticles using linear polyethyleneimines and catalysis of both anionic and cationic azo dye degradation. Mater. Adv. 2020, 1, 2407–2417. [Google Scholar] [CrossRef]
Disclaimer/Publisher’s Note: The statements, opinions and data contained in all publications are solely those of the individual author(s) and contributor(s) and not of MDPI and/or the editor(s). MDPI and/or the editor(s) disclaim responsibility for any injury to people or property resulting from any ideas, methods, instructions or products referred to in the content. |
© 2025 by the authors. Licensee MDPI, Basel, Switzerland. This article is an open access article distributed under the terms and conditions of the Creative Commons Attribution (CC BY) license (https://creativecommons.org/licenses/by/4.0/).
Share and Cite
Aqeel, T.; Bumajdad, A. Simple Method for Controlling Gold Nanocluster Size in Mesoporous Silica: SBA-11. Molecules 2025, 30, 2035. https://doi.org/10.3390/molecules30092035
Aqeel T, Bumajdad A. Simple Method for Controlling Gold Nanocluster Size in Mesoporous Silica: SBA-11. Molecules. 2025; 30(9):2035. https://doi.org/10.3390/molecules30092035
Chicago/Turabian StyleAqeel, Tariq, and Ali Bumajdad. 2025. "Simple Method for Controlling Gold Nanocluster Size in Mesoporous Silica: SBA-11" Molecules 30, no. 9: 2035. https://doi.org/10.3390/molecules30092035
APA StyleAqeel, T., & Bumajdad, A. (2025). Simple Method for Controlling Gold Nanocluster Size in Mesoporous Silica: SBA-11. Molecules, 30(9), 2035. https://doi.org/10.3390/molecules30092035