
Hydrated Electrons in Phase-Matching Generation of Second-Order Stokes X-Waves in Water

Abstract
1. Introduction
2. Results
2.1. The Nonlinear Second-Order Stokes X-Waves in Water
2.2. The Conversion Efficiency of Second-Order Stokes in Water
2.3. The Forward Second-Order Stokes Spectrum in Water
3. Discussion
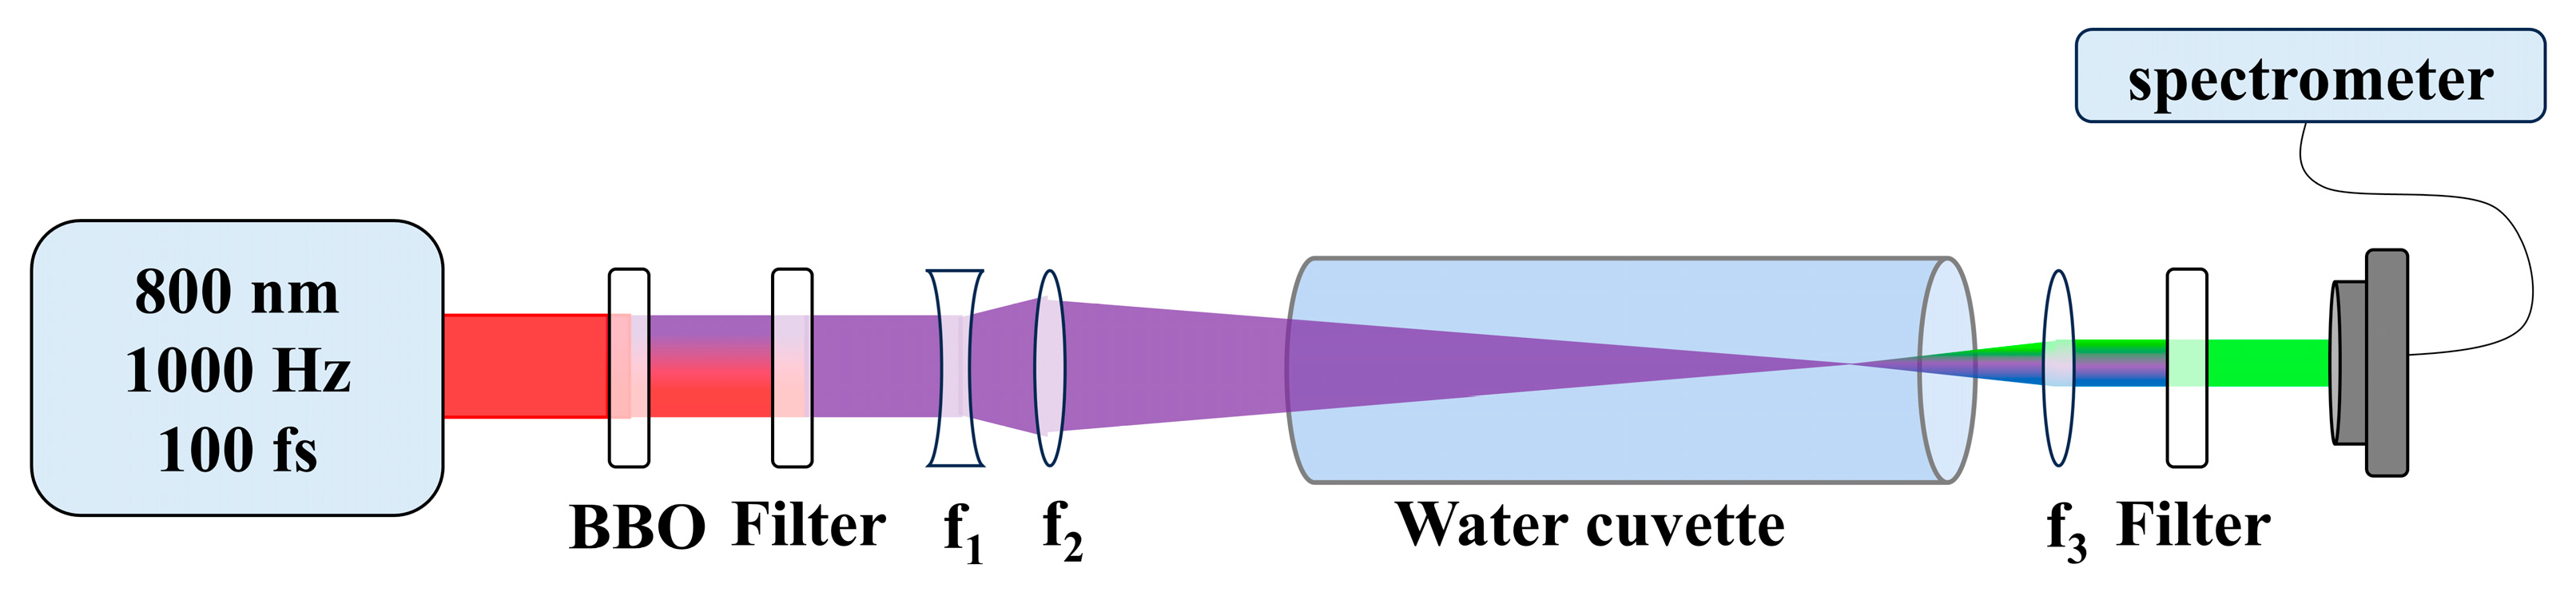
4. Experiments
5. Conclusions
Author Contributions
Funding
Institutional Review Board Statement
Informed Consent Statement
Data Availability Statement
Conflicts of Interest
References
- Stein, G. Some aspects of the radiation chemistry of organic solutes. Discuss. Faraday Soc. 1952, 12, 227–234. [Google Scholar] [CrossRef]
- Hart, E.J.; Boag, J.W. Absorption spectrum of the hydrated electron in water and in aqueous solutions. J. Am. Chem. Soc 1962, 84, 4090–4095. [Google Scholar] [CrossRef]
- Jordan, C.J.C.; Coons, M.P.; Herbert, J.M.; Verlet, J.R.R. Spectroscopy and dynamics of the hydrated electron at the water/air interface. Nat. Commun. 2024, 15, 182. [Google Scholar] [CrossRef] [PubMed]
- Neupane, P.; Bartels, D.M.; Thompson, W.H. Exploring the Unusual Reactivity of the Hydrated Electron with CO2. J. Phys. Chem. B 2024, 128, 567–575. [Google Scholar] [CrossRef]
- Pritchard, F.G.; Jordan, C.J.C.; Verlet, J.R.R. Probing photochemical dynamics using electronic vs vibrational sum-frequency spectroscopy: The case of the hydrated electron at the water/air interface. J. Chem. Phys. 2024, 161, 170901. [Google Scholar] [CrossRef]
- Kusumoto, T.; Danvin, A.; Mamiya, T.; Arnone, A.; Chefson, S.; Galindo, C.; Peaupardin, P.; Raffy, Q.; Kamiguchi, N.; Amano, D.; et al. Dose Rate Effects on Hydrated Electrons, Hydrogen Peroxide, and a OH Radical Molecular Probe Under Clinical Energy Protons. Radiat. Res. 2024, 201, 287–293. [Google Scholar] [CrossRef]
- Kai, T.; Toigawa, T.; Matsuya, Y.; Hirata, Y.; Tezuka, T.; Tsuchida, H.; Yokoya, A. Initial yield of hydrated electron production from water radiolysis based on first-principles calculation. RSC Adv. 2023, 13, 7076–7086. [Google Scholar] [CrossRef]
- Kambhampati, P.; Son, D.H.; Kee, T.W.; Barbara, P.F. Solvation Dynamics of the Hydrated Electron Depends on Its Initial Degree of Electron Delocalization. J. Phys. Chem. A 2002, 106, 2374–2378. [Google Scholar] [CrossRef]
- Herbert, J.M. Structure of the aqueous electron. Phys. Chem. Chem. Phys. 2019, 21, 20538–20565. [Google Scholar] [CrossRef]
- Long, F.H.; Lu, H.; Eisenthal, K.B. Femtosecond studies of the presolvated electron: An excited state of the solvated electron? Phys. Rev. Lett. 1990, 64, 1469–1472. [Google Scholar] [CrossRef]
- Yang, Z.; Zhang, C.; Zhang, H.; Lu, J. Transient electron temperature and density changes in water breakdown induced by femtosecond laser pulses. Opt. Commun. 2023, 546, 129803. [Google Scholar] [CrossRef]
- Dharmarathne, L.; Ashokkumar, M.; Grieser, F. On the Generation of the Hydrated Electron during the Sonolysis of Aqueous Solutions. J. Phys. Chem. A 2013, 117, 2409–2414. [Google Scholar] [CrossRef] [PubMed]
- Kerzig, C.; Goez, M. Combining energy and electron transfer in a supramolecular environment for the “green” generation and utilization of hydrated electrons through photoredox catalysis. Chem. Sci. 2016, 7, 3862–3868. [Google Scholar] [CrossRef] [PubMed]
- Kerzig, C.; Guo, X.; Wenger, O.S. Unexpected Hydrated Electron Source for Preparative Visible-Light Driven Photoredox Catalysis. J. Am. Chem. Soc. 2019, 141, 2122–2127. [Google Scholar] [CrossRef]
- Lu, H.; Long, F.H.; Bowman, R.M.; Eisenthal, K.B. Femtosecond studies of electron-cation geminate recombination in water. J. Phys. Chem. 1989, 93, 27–28. [Google Scholar] [CrossRef]
- Gobert, F.; Pommeret, S.; Vigneron, G.; Buguet, S.; Haidar, R.; Mialocq, J.C.; Lampre, I.; Mostafavi, M. Nanosecond kinetics of hydrated electrons upon water photolysis by high intensity femtosecond UV pulses. Res. Chem. Intermed. 2001, 27, 901–910. [Google Scholar] [CrossRef]
- Elkins, M.H.; Williams, H.L.; Shreve, A.T.; Neumark, D.M. Relaxation Mechanism of the Hydrated Electron. Science 2013, 342, 1496–1499. [Google Scholar] [CrossRef]
- Elkins, M.H.; Williams, H.L.; Neumark, D.M. Isotope effect on hydrated electron relaxation dynamics studied with time-resolved liquid jet photoelectron spectroscopy. J. Chem. Phys. 2016, 144, 184503. [Google Scholar] [CrossRef]
- Griffin, G.B.; Young, R.M.; Ehrler, O.T.; Neumark, D.M. Electronic relaxation dynamics in large anionic water clusters: (H2O)n(−) and (D2O)n(−) (n = 25–200). J. Chem. Phys. 2009, 131, 194302. [Google Scholar] [CrossRef]
- Baldacchino, G.; De Waele, V.; Monard, H.; Sorgues, S.; Gobert, F.; Larbre, J.P.; Vigneron, G.; Marignier, J.L.; Pommeret, S.; Mostafavi, M. Hydrated electron decay measurements with picosecond pulse radiolysis at elevated temperatures up to 350 °C. Chem. Phys. Lett. 2006, 424, 77–81. [Google Scholar] [CrossRef]
- Coe, J.V.; Williams, S.M.; Bowen, K.H. Photoelectron spectra of hydrated electron clusters vs. cluster size: Connecting to bulk. Int. Rev. Phys. Chem. 2008, 27, 27–51. [Google Scholar] [CrossRef]
- Lee, H.M.; Lee, S.; Kim, K.S. Structures, energetics, and spectra of electron–water clusters, e−–(H2O)2–6 and e−–HOD(D2O)1–5. J. Chem. Phys. 2003, 119, 187–194. [Google Scholar] [CrossRef]
- Turi, L.; Rossky, P.J. Theoretical Studies of Spectroscopy and Dynamics of Hydrated Electrons. Chem. Rev. 2012, 112, 5641–5674. [Google Scholar] [CrossRef] [PubMed]
- Pshenichnikov, M.S.; Baltuška, A.; Wiersma, D.A. Hydrated-electron population dynamics. Chem. Phys. Lett. 2004, 389, 171–175. [Google Scholar] [CrossRef]
- Yui, H.; Sawada, T. Interaction of excess electrons with water molecules at the early stage of laser-induced plasma generation in water. Phys. Rev. Lett. 2000, 85, 3512–3515. [Google Scholar] [CrossRef]
- Yui, H. Electron-enhanced Raman scattering: A history of its discovery and spectroscopic applications to solution and interfacial chemistry. Anal. Bioanal. Chem. 2010, 397, 1181–1190. [Google Scholar] [CrossRef]
- Yui, H.; Tomai, T.; Sawada, M.; Terashima, K. Generation of laser-induced plasma in supercritical water and vibrational spectroscopic study of accompanying stimulated Raman scattering. Appl. Phys. Lett. 2011, 99, 091504. [Google Scholar] [CrossRef]
- Herbert, J.M.; Coons, M.P. The hydrated electron. Annu. Rev. Phys. Chem. 2017, 68, 447–472. [Google Scholar] [CrossRef]
- Tang, J.; Wang, Z. Hydrated Electron Dynamics and Stimulated Raman Scattering in Water Induced by Ultrashort Laser Pulses. Molecules 2024, 29, 1245. [Google Scholar] [CrossRef]
- Tzortzakis, S.; Sudrie, L.; Franco, M.; Prade, B.; Mysyrowicz, A.; Couairon, A.; Bergé, L. Self-Guided Propagation of Ultrashort IR Laser Pulses in Fused Silica. Phys. Rev. Lett. 2001, 87, 213902. [Google Scholar] [CrossRef]
- Brodeur, A.; Ilkov, F.A.; Chin, S.L. Beam filamentation and the white light continuum divergence. Opt. Commun. 1996, 129, 193–198. [Google Scholar] [CrossRef]
- Faccio, D.; Trapani, P.D.; Minardi, S.; Bramati, A.; Bragheri, F.; Liberale, C.; Degiorgio, V.; Dubietis, A.; Matijosius, A. Far-field spectral characterization of conical emission and filamentation in Kerr media. J. Opt. Soc. Am. B 2005, 22, 862–869. [Google Scholar] [CrossRef]
- Théberge, F.; Aközbek, N.; Liu, W.; Becker, A.; Chin, S.L. Tunable Ultrashort Laser Pulses Generated through Filamentation in Gases. Phys. Rev. Lett. 2006, 97, 023904. [Google Scholar] [CrossRef] [PubMed]
- Faccio, D.; Averchi, A.; Dubietis, A.; Polesana, P.; Piskarskas, A.; Trapani, P.D.; Couairon, A. Stimulated Raman X waves in ultrashort optical pulse filamentation. Optics Lett. 2007, 32, 184–186. [Google Scholar] [CrossRef]
- Faccio, D.; Averchi, A.; Couairon, A.; Kolesik, M.; Moloney, J.V.; Dubietis, A.; Tamosauskas, G.; Polesana, P.; Piskarskas, A.; Trapani, P.D. Spatio-temporal reshaping and X Wave dynamics in optical filaments. Opt. Express 2007, 15, 13077–13095. [Google Scholar] [CrossRef]
- Faccio, D.; Dubietis, A.; Tamosauskas, G.; Polesana, P.; Valiulis, G.; Piskarskas, A.; Lotti, A.; Couairon, A.; Di Trapani, P. Phase- and group-matched nonlinear interactions mediated by multiple filamentation in Kerr media. Phys. Rev. A 2007, 76, 055802. [Google Scholar] [CrossRef]
- Chen, X.; Tang, J.; Gao, Q.; Xiao, K.; Zhou, Q.; Sun, J.; Wang, Z. Group velocity matched stimulated Raman conversion of X-waves within self-guided filaments in water. Light Sci. Appl. 2025. submitted. [Google Scholar]
- Jin, Q.; Yiwen, E.; Gao, S.; Zhang, X.-C. Preference of subpicosecond laser pulses for terahertz wave generation from liquids. Adv. Photonics 2020, 2, 015001. [Google Scholar] [CrossRef]
- Kennedy, P.K. A first-order model for computation of laser-induced breakdown thresholds in ocular and aqueous media. I. Theory. IEEE J. Quantum Electron. 1995, 31, 2241–2249. [Google Scholar] [CrossRef]
- Nikogosyan, D.N.; Oraevsky, A.A.; Rupasov, V.I. Two-photon ionization and dissociation of liquid water by powerful laser UV radiation. Chem. Phys. 1983, 77, 131–143. [Google Scholar] [CrossRef]
- Wittmann, M.; Penzkofer, A. Spectral superbroadening of femtosecond laser pulses. Opt. Commun. 1996, 126, 308–317. [Google Scholar] [CrossRef]
- Maier, S.A. Plasmonics: Fundamentals and Applications; Springer: New York, NY, USA, 2007; pp. 11–15. [Google Scholar]

Disclaimer/Publisher’s Note: The statements, opinions and data contained in all publications are solely those of the individual author(s) and contributor(s) and not of MDPI and/or the editor(s). MDPI and/or the editor(s) disclaim responsibility for any injury to people or property resulting from any ideas, methods, instructions or products referred to in the content. |
© 2025 by the authors. Licensee MDPI, Basel, Switzerland. This article is an open access article distributed under the terms and conditions of the Creative Commons Attribution (CC BY) license (https://creativecommons.org/licenses/by/4.0/).
Share and Cite
Chen, X.; Zhou, Q.; Wang, Z. Hydrated Electrons in Phase-Matching Generation of Second-Order Stokes X-Waves in Water. Molecules 2025, 30, 1969. https://doi.org/10.3390/molecules30091969
Chen X, Zhou Q, Wang Z. Hydrated Electrons in Phase-Matching Generation of Second-Order Stokes X-Waves in Water. Molecules. 2025; 30(9):1969. https://doi.org/10.3390/molecules30091969
Chicago/Turabian StyleChen, Xinxin, Qing Zhou, and Zhongyang Wang. 2025. "Hydrated Electrons in Phase-Matching Generation of Second-Order Stokes X-Waves in Water" Molecules 30, no. 9: 1969. https://doi.org/10.3390/molecules30091969
APA StyleChen, X., Zhou, Q., & Wang, Z. (2025). Hydrated Electrons in Phase-Matching Generation of Second-Order Stokes X-Waves in Water. Molecules, 30(9), 1969. https://doi.org/10.3390/molecules30091969