1. Introduction
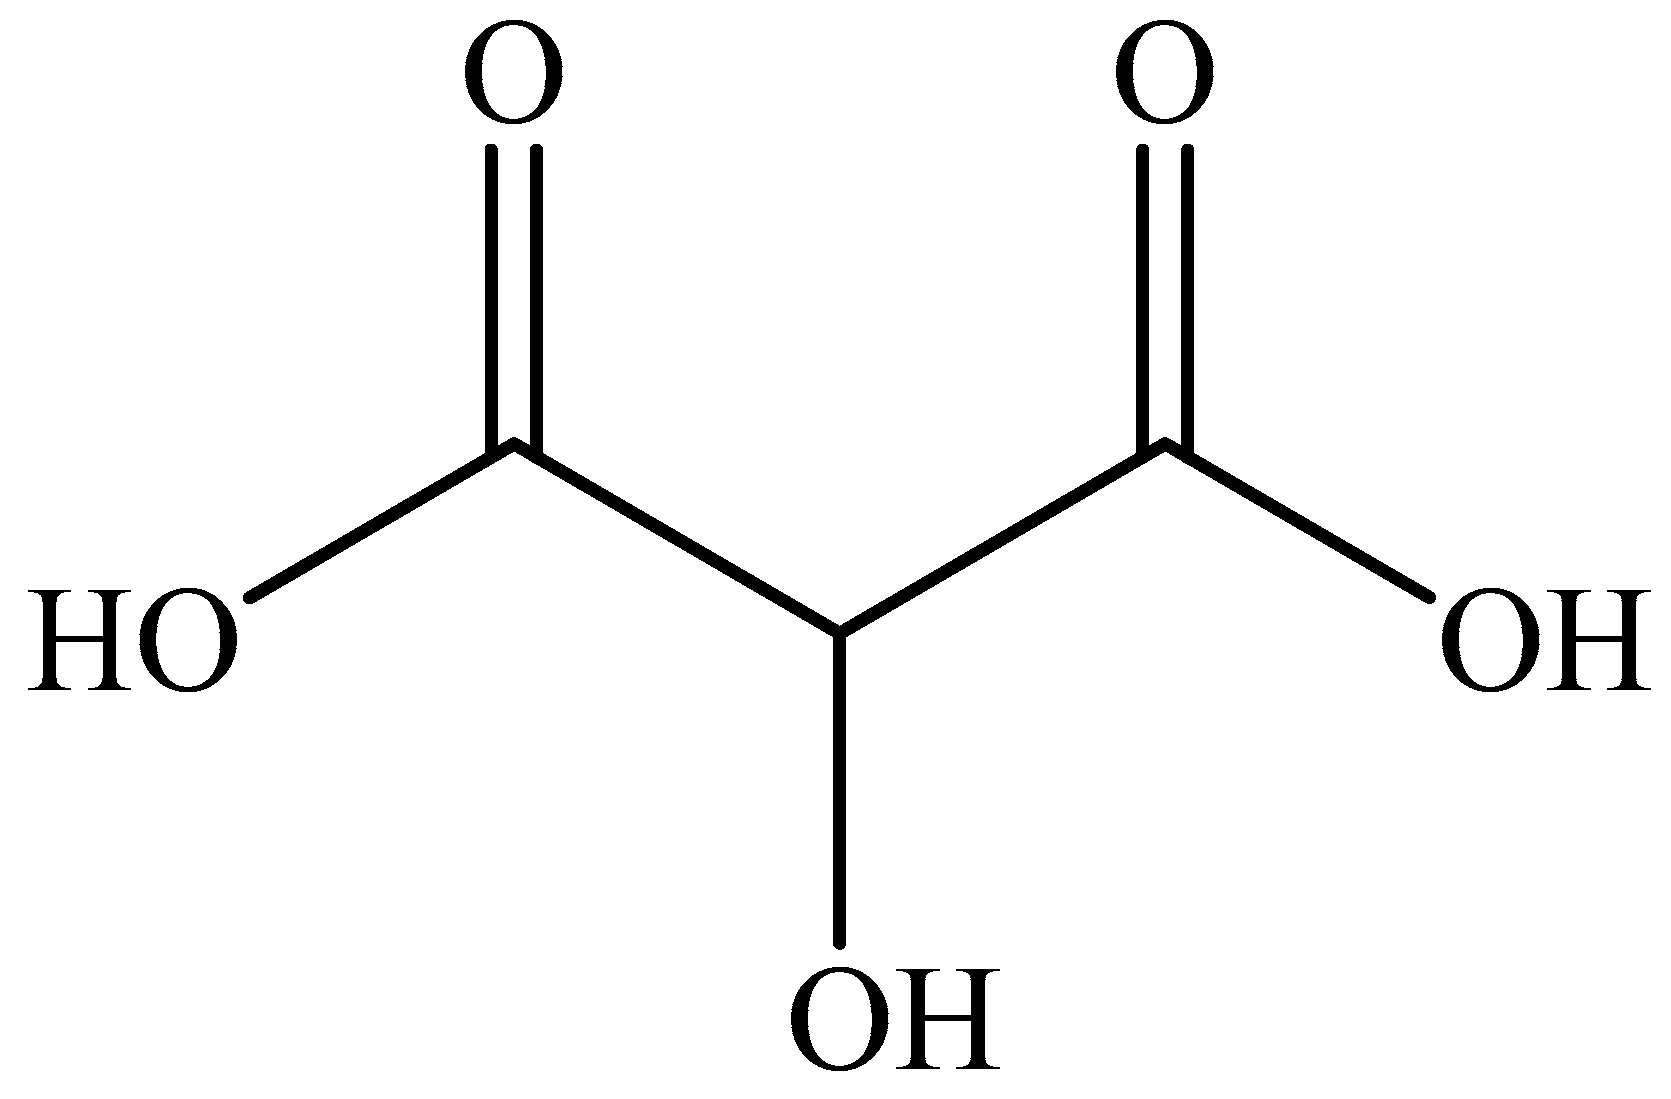
Tartronic acid (TA, L
2−,
Scheme 1) plays a vital role in plant and animal metabolism, functioning both as an intermediate and a regulator in various metabolic pathways [
1,
2,
3,
4]. Furthermore, it naturally occurs in various plant species [
5,
6,
7]. It is known to inhibit the transformation of carbohydrates into fat under fat-deficient conditions, though it can also promote lipogenesis, as reported by Shi et al. [
8]. As a key derivative of glycerol, tartronic acid is highly valued in the fine chemical industry [
9,
10,
11]. It is extensively used in the synthesis of fine chemicals and novel polymers, offering a sustainable alternative to fossil-derived olefins and carboxylic acids in polymer production [
12,
13,
14].
Beyond its biochemical roles, TA is employed as an anti-corrosive and protective agent, preventing oxidative degradation in the food industry and reducing corrosion in boilers and other high-temperature environments [
15]. Its increasing significance in medical and industrial applications is exemplified by recent studies that have highlighted its potential as a highly efficient inhibitor of calcium oxalate crystallization [
16]. In particular, the authors showed that the complexation between tartronic acid and Ca
2+ at experimental concentrations is minimal, whereas citric acid sequesters about half of the free Ca
2+ at the same concentration. This suggests that TA primarily inhibits calcium oxalate monohydrate crystallization through interactions with crystal surfaces rather than forming complexes with Ca
2+ in a solution.
Research on tartronic acid capability to form complexes with metal cations, both regarding the synthesis and isolation of these complexes [
17] as well as their behavior in aqueous solution [
18], is not extensively covered. The tartronate anion has five potentially coordinating oxygen atoms [
19], making it a promising chelator for metal cations.
From a thermodynamic perspective, particularly regarding the determination of stability constants of tartronic acid with various metal cations in aqueous solution, few studies are available. These are typically conducted at a single temperature and ionic strength. Campi et al. [
18] reported data for a series of divalent metal cations (Ba
2+, Ca
2+, Mg
2+, Ni
2+, Co
2+, Zn
2+, Cu
2+, and Cd
2+) at
I = 0.1 mol dm
−3 (in NaClO
4) at
T = 293 K. Micskei et al. [
20] determined pH metrically, at
I = 1 mol dm
−3 KCl at
T = 298.15 K, the complexes of tartronate with Cr
2+. Kirishima et al. [
21] used potentiometric and calorimetric titration techniques to determine the thermodynamic quantities (Δ
G, Δ
H, and TΔ
S) of U(VI) complexation with tartronate. Mukerjee et al. [
22] reported data for Mn
2+, Ni
2+, and Cu
2+, whereas Manning et al. [
23] focused on Eu
3+. However, these values did not meet the selection criteria according to the NIST database [
24].
Regarding protonation constants, the only available data are from Campi et al. [
18] at
I = 0.1 mol dm
−3 (in NaClO
4) at
T = 293 K. Stepwise protonation enthalpy changes (∆
H0) were determined via calorimetric titration by Kirishima et al. [
21] at
I = 1 mol dm
−3 in NaClO
4 at
T = 298.15 K.
The aim of this paper is to determine the protonation constants of tartronate in aqueous solutions of NaCl, KCl, (CH3)4NCl, and (C2H5)4NI by means of potentiometric measurements under different experimental conditions, including the reagent concentration, ionic strength, and temperature. Whenever possible, instrumentation was varied by using different glass and reference electrodes, as well as reagents from different batches, to minimize potential systematic errors, such as those caused by electrode calibration issues, thereby increasing the reproducibility of the experiments.
In this context, it is particularly important to emphasize that the determination of reliable thermodynamic parameters and the subsequent development of robust models depend heavily on the quality of the experiments, which must eliminate all potential sources of systematic error and ensure reproducibility. Once determined, protonation constants were modeled as a function of ionic strength and temperature to obtain data under standard conditions (e.g., infinite dilution) and formation constants of weak ion pairs between tartronate and alkaline metal cations of the supporting electrolyte using the ΔpK method and ionic strength dependence parameters (e.g., specific ion interaction coefficients). The above-mentioned parameters enable the calculation of equilibrium constants at any temperature and ionic strength within the range considered using established equations, such as the Debye–Hückel equation and the Specific Ion Interaction Theory (SIT). All the determined thermodynamic data could be useful for potential future investigations aimed at testing tartronic acid capability in environmental chemistry or pharmacology.
2. Results and Discussion
The protonation constants of tartronate were determined potentiometrically in NaCl
(aq), KCl
(aq), (CH
3)
4NCl
(aq), and (C
2H
5)
4NI
(aq) at various temperatures and ionic strengths. The results obtained for the first and second protonation constants are provided in
Table 1 in the molal concentration scale (complete experimental data, together with associated errors, are available in
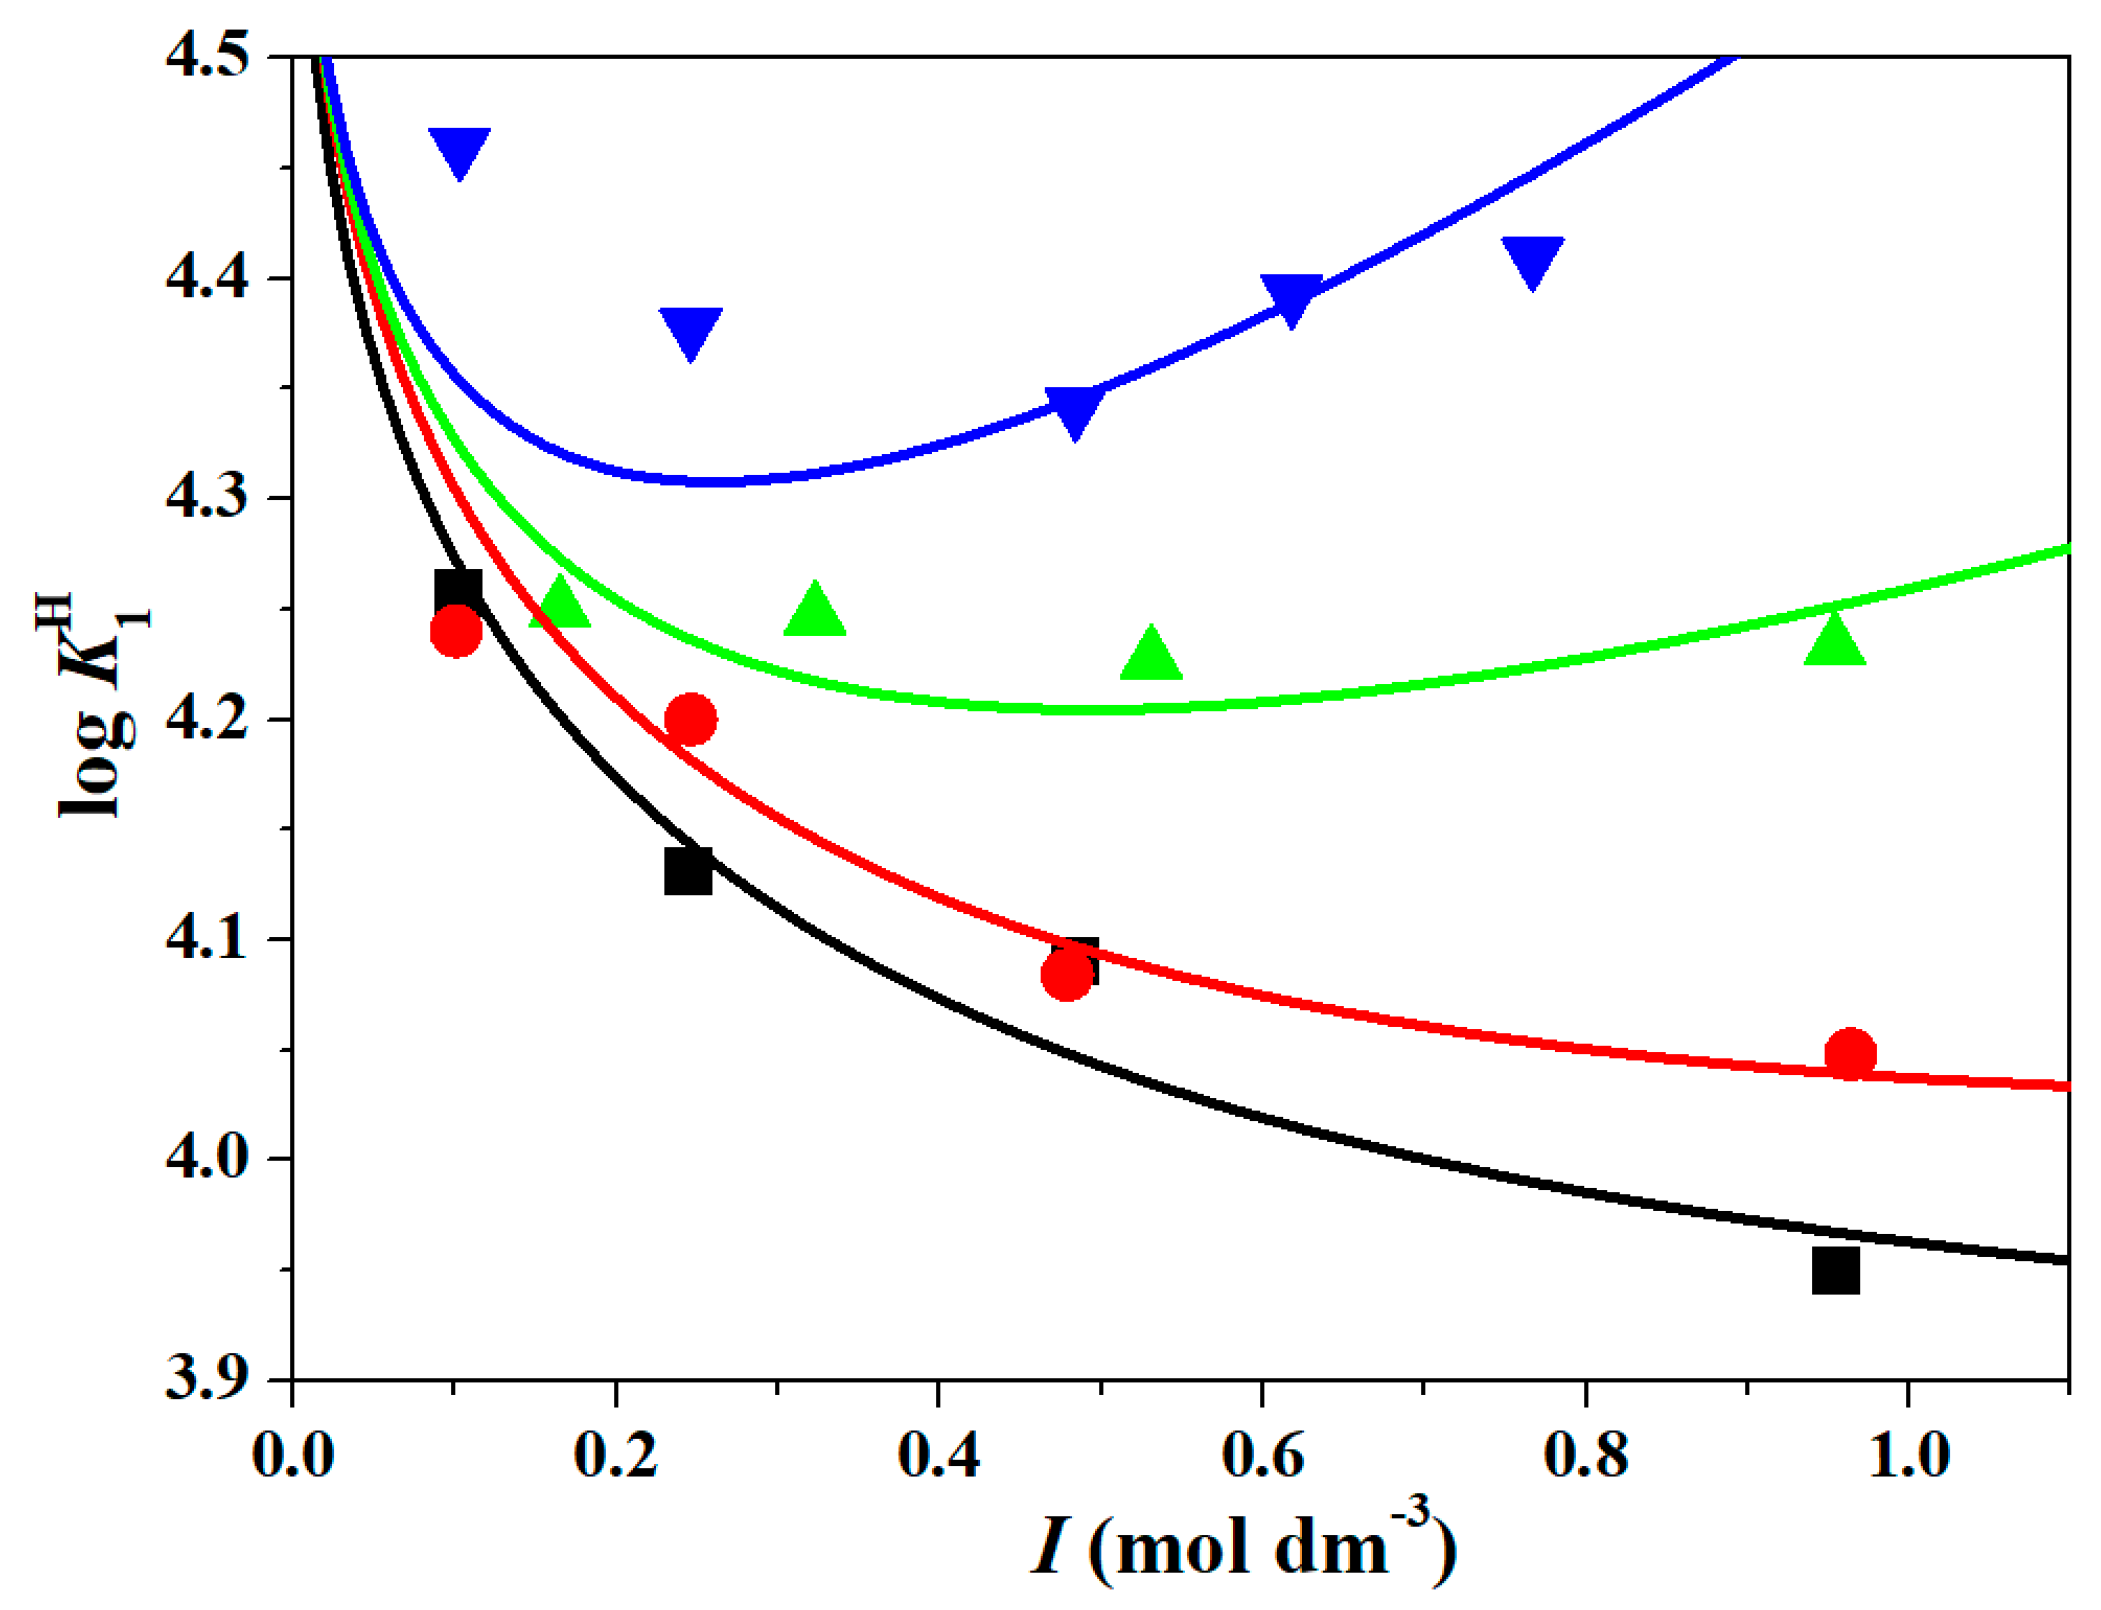
Tables S1–S4). As an example, the trend of the first tartronate protonation constant as a function of ionic strength is illustrated in
Figure 1 at
T = 288.15 K, together with the model equation according to the SIT approach (solid colored lines). A similar pattern is observed at other temperatures, although with greater deviations. The goodness of fit criteria suggested by Meloun [
25] and Gans [
26] were used to evaluate results obtained. As an example, for data obtained in NaCl at
T = 298.15 K (a total of eleven titrations), the arithmetic mean of residuals (the residual bias, the difference between calculated and measured
e.m.f. values) resulted in 0.087 mV, which is not statistically different from the theoretical value of 0 mV. The mean of the absolute value of residuals resulted in 0.3 mV, which is reasonably close to the uncertainty in the measured
e.m.f. value, namely, 0.15 mV; skewness was 0.9, and kurtosis was 3.5, which indicate that residuals are reasonably symmetric and with a slightly positive kurtosis.
The protonation constants of the ligand TA (L
2− in its fully deprotonated form) and the formation constants of weak complexes refer to the following equilibrium:
where X
+ can be Na
+ or K
+. If j = 0, equilibrium (1) refers to a protonation constant (instead of
Ki0k, they are reported as
).
As observed, the protonation constant values decrease as both the ionic strength and temperature increase. Additionally, the data in NaCl are noticeably lower than those in KCl, (CH3)4NCl, and (C2H5)4NI. This difference can be attributed to different activity coefficients of proton and tartronate species in different ionic chemical environments or to the formation of weak ion pairs involving the cations of the supporting electrolytes (X⁺) and the anionic tartronate species (L2− and HL− species). When comparing the protonation constants obtained with different electrolytes, the Na⁺ cation, being the smallest one, interacts more readily with the ligand. Consequently, the protonation equilibrium shifts toward the reactants, resulting in a lower conditional constant value. As the cation size increases (i.e., K⁺ → (CH3)4N⁺ → (C2H5)4N⁺), steric hindrance becomes more significant, reducing the likelihood of cation interactions with tartronate. This, in turn, causes the protonation equilibrium to shift less toward the reactants, leading to higher conditional protonation constants.
While only two protonation constants are reported in the tables, the formation of a third species was observed under specific conditions (i.e., in NaCl at
T = 288.15 and 298.15 K) corresponding to the following equilibrium:
This species could be tentatively described, assuming a proton acting as a bridge between two fully deprotonated tartronate molecules through the hydroxylate groups. However, the existence of this species is not documented in the literature, making a conclusive assessment difficult. Furthermore, the formation of this species was not observed under all experimental conditions. For this reason, the formation of the HL
23− species cannot be definitively proved unless dedicated measurements are performed. Nevertheless, some of the results obtained in NaCl
(aq) are provided in
Table 2.
The tabulated values indicate that the stability of the HL23− species is relatively low, slightly exceeding a decimal logarithm value of 1.0. Additionally, the stability of this species appears to increase with ionic strength, suggesting that the Na⁺ cation may contribute to shielding the negative charges of the two tartronate molecules. This hypothesis helps to explain the difficulty in refining the stability of the HL23− species in ionic media containing bulkier cations (e.g., tetraalkylammonium).
When HL
23− is excluded, the results from fitting the experimental data in the molal concentration scale to Equation (3) (see Section Materials and Methods) are summarized in
Table 3 (SIT model). Corresponding data in the molar concentration scale (the EDH model; more details are given in the
Supplementary Materials) are given in
Table S5.
Furthermore, by expressing
in terms of the species involved in the equilibria, as shown in Equation (S4), the individual specific interaction coefficient involving the tartronate species can be obtained, provided that the interaction coefficient of the proton with anions of the supporting electrolyte and the activity coefficient of the neutral H
2L
0(aq) species, computed by multiplying the Setschenow constants (
km) by ionic strength, are known. In this case,
ε(H
+, Cl
−) and
ε(H
+, I
−) were taken from the literature [
28], whereas the Setschenow coefficient is unknown. Typically, the
km value is experimentally determined through solubility measurements or solvent partitioning under varying electrolyte concentrations (e.g., NaCl). Some quick tests for both measurement types evidenced that the water solubility of tartronic acid is too high. During solubility experiments, the possible formation of dimeric or higher species cannot be excluded, while octanol/water partitioning measurements yielded negative results, as all the tartronic acid dissolved in water.
For these reasons, the Setschenow coefficient of the neutral H
2L
0(aq) species was predicted by the regression tree chemometric algorithm proposed by De Stefano et al. [
29], and it was considered to be valid in all ionic media. In this way, the unknown specific interaction coefficients can be obtained by fitting experimental data, in the molal concentration scale, to Equations (S3) and (S4) using LIANA software, and the results are reported in
Table 4.
The dependence of protonation constants on ionic strength in different ionic media has also been interpreted in terms of the formation of weak complexes between the cations of the supporting electrolyte and the anionic ligand species [
30,
31,
32,
33]. In this study, data were analyzed using ES2WC software, which enabled the determination of the formation constants of weak complexes, as well as the effective protonation constants (
Table 5).
The constant values of the weak ion pairs reveal that they decrease as the size of the cation increases (log TKNa+ > log TKK+ > log TK(CH3)4N+), a trend that is consistent with the previously observed variation in protonation constants across different ionic media.
A comparison of the protonation constants of tartronate with those of malonate (mal) and mesoxalate (mesox), as presented in
Table 6, reveals that the p
Ka values for malonate are higher than those for tartronate, while mesoxalate exhibits lower p
Ka values. This results in the following trend: malonate > tartronate > mesoxalate.
Differences can be attributed to the molecular structure of the three ligands, which features a different oxidation state of the central carbon atom. Compared to tartronic acid, malonic acid lacks the hydroxyl group bound to the central carbon atom, resulting in less acidic carboxylic hydrogen atoms. Conversely, mesoxalic acid displays a carbonyl group bond to the central carbon atom, which exerts an electron-withdrawing effect. As a result, the hydrogen atoms of the carboxylic groups of mesoxalate are more acidic than those of tartronic acid. Analyzing the data presented in
Table 6, it is clear that the first protonation constants differ by approximately one logarithmic unit, favoring malonate across all ionic strengths. For the second protonation constant, the difference is approximately 0.5–0.6 logarithmic units, again favoring malonate.
Regarding comparisons of tartronate protonation constants, no significant differences are observed between the values reported in the literature (
Table 6, log
= 4.24 and log
= 2.02 at
I = 0.1 and
T = 293 K in Na
+ medium) and those experimentally determined in this study (log
= 4.29 and log
= 2.08 under the same conditions).
Further comparisons between protonation constants and enthalpy change values of malonate and tartronate are presented in
Table 7. Regarding enthalpy changes, both ligands exhibit similar values for the first protonation step. However, more significant differences are observed in the second step. Specifically, the enthalpy changes for tartronate are positive, indicating an endothermic process, whereas for malonate, they are only slightly negative.
In
Figure 2, the thermodynamic parameters for the first step of protonation of malonate and tartronate are presented. As observed (the same findings apply to the second protonation step), the most significant contribution to stability is of an entropic nature. This is expected for the reaction between a proton and a carboxylate anion, primarily due to contributions such as charge neutralization and the displacement of water molecules (these factors also apply to the second protonation step).
4. Conclusions
In this study, potentiometric titrations were conducted under various conditions of ionic strength (0.1 <
I/mol dm
−3 ≤ 1.0), temperature (288.15 ≤
T/K ≤ 310.15), and ionic media (NaCl, KCl, (CH
3)
4NCl, and (C
2H
5)
4NI) to study the influence of the variation of such chemico-physical variables on the apparent protonation constants of tartronate. The ionic strength dependence and the medium effect were interpreted in two different ways, namely, considering the SIT approach and the “pure water” model. Both interpret differences measured in the protonation constants obtained in different media, assuming a certain interaction between the species involved in equilibria and the ions of the supporting electrolyte. The SIT approach is a hybrid chemico-physical model that considers specific short-range interaction coefficients; the pure water one is a chemical model that postulates the formation of weak ion pairs. As a result, in the case of the SIT approach, the output is a list of specific interaction coefficients between ions of opposite charge (e.g.,
ε(L
2−,Na
+),
ε(HL
−,K
+)) and protonation constants at infinite dilution, whereas in the case of the PW model, there are protonation constants at infinite dilution (that must be equal to those obtained to those of the SIT model), weak ion pair formation constants (e.g., log
KNaL− and log
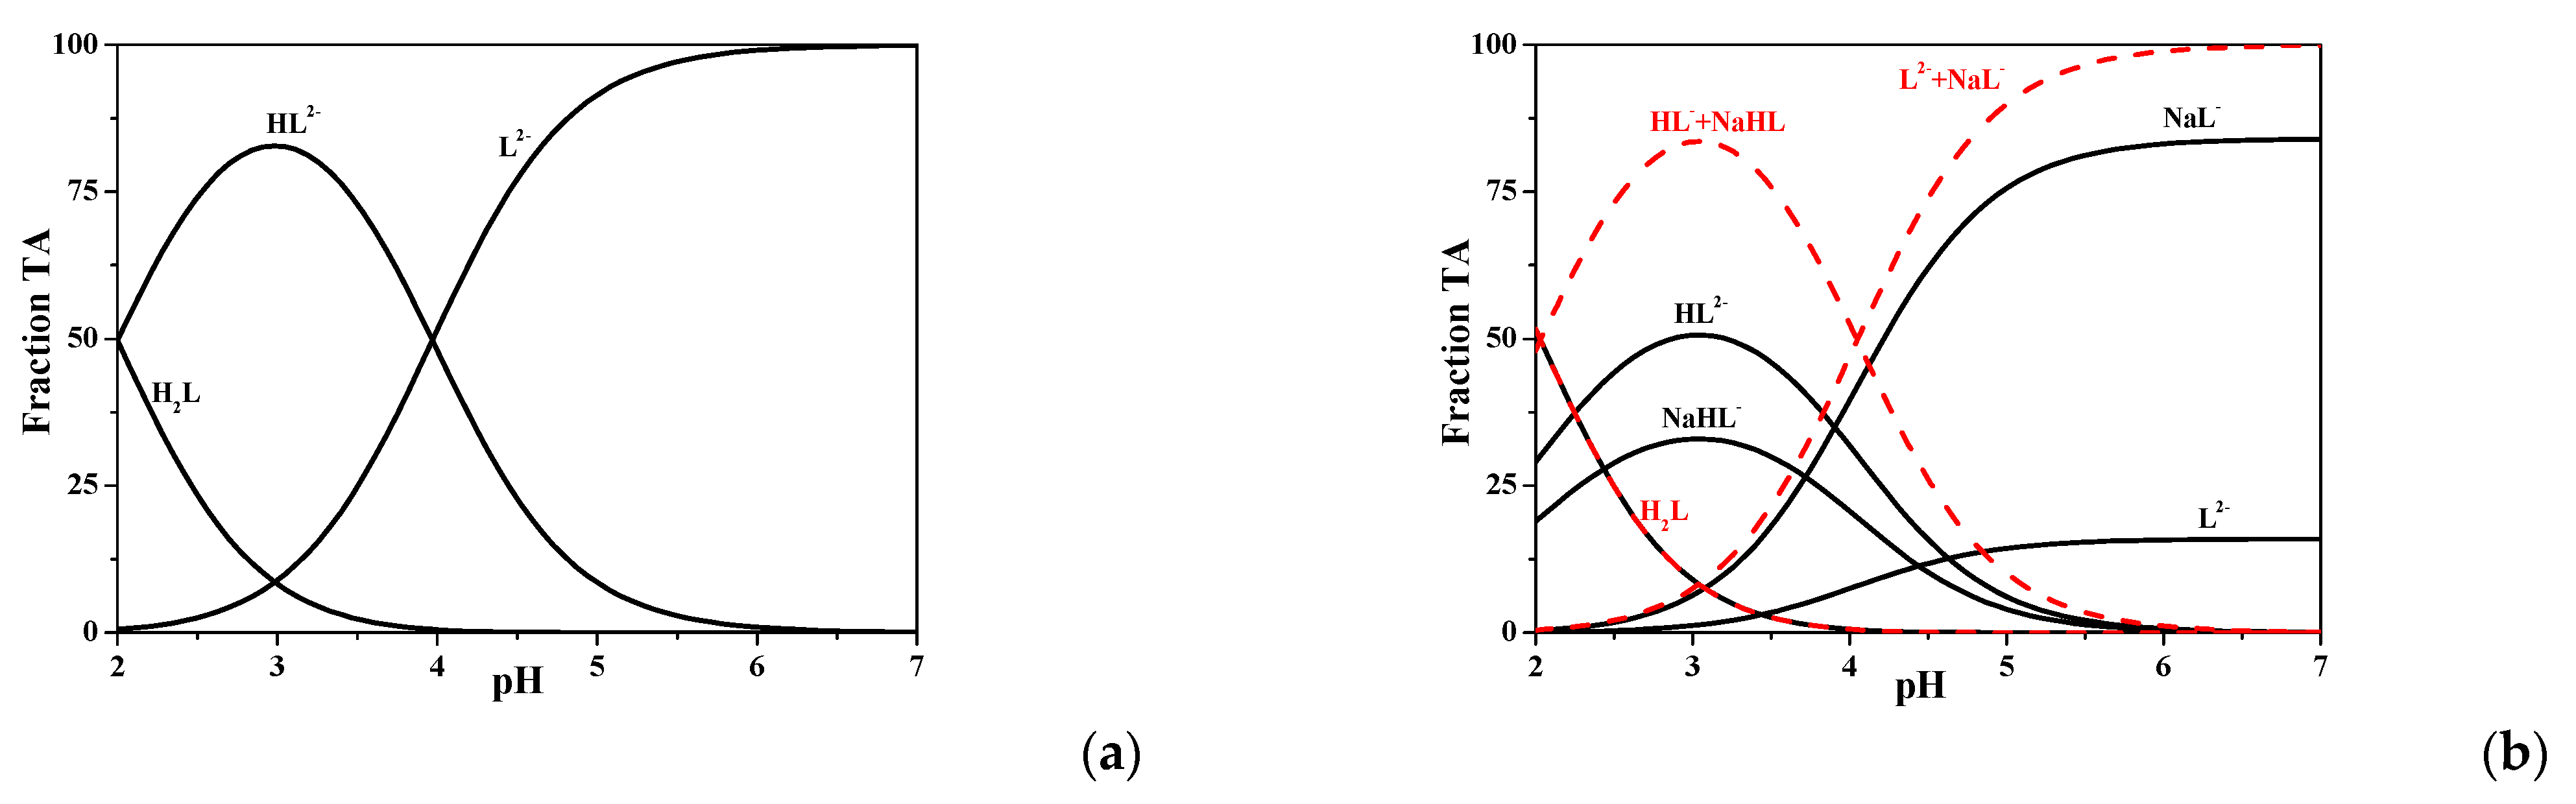
KKHL), and ionic strength dependence parameters equal to all species. However, even if the two models come from different assumptions, the modeling ability is often comparable in terms of chemical information carried. This can be demonstrated looking at
Figure 3, where the distribution diagram of the H
+/TA species is computed in a NaCl solution at
I = 0.7 mol dm
−3 (simulating ionic strength of seawater) and
T = 298.15 K.
In diagram a, HL− is the main species between pH ~ 2 and pH ~ 4, with a maximum of ~ 80% at pH ~ 3, and fully deprotonated tartronate is present at pH > 4. In diagram b, sodium species were also considered, and their formation percentage is quite high, as the NaHL0(aq) is present between pH ~ 2 and pH ~ 5, reaching 30% at pH ~ 3, whereas NaL− is the main species at pH > 4, achieving > 95% at pH > 6. The dotted red lines in diagram b represent the sum of the species containing tartronate at the same protonation degree. For example, HL− is summed up to NaHL0(aq), as well as NaL− to L2−. Diagram b, drawn only with the dotted red curves, is equivalent to diagram a, as differences in the crossover points are about 0.03 pH units.
Formation constants of weak complexes with cations from different ionic media were also determined, identifying ML− and MHL0(aq) as the main species formed. The results suggest that the tartronate ligand interacts with cations in the order Na+ > K+ > (CH3)4N+ > (C2H5)4N+, which is attributed to differences in ion size.
Given the structural similarity of tartronic acid to mesoxalic and malonic acids, a comparison of their protonation constants was performed to explore potential correlations between numerical values and molecular structures, with a particular emphasis on the oxidation state of the central carbon.
Thermodynamic parameters, including entropy and enthalpy changes, were analyzed and compared with those of the malonate ligand, revealing that the spontaneity of the tartronate protonation process is predominantly driven by entropic contributions.
In conclusion, this work enhances the understanding of the thermodynamic properties of tartronic acid and defines its chemical speciation acid across a broad range of experimental conditions, including those relevant to natural and biological fluids.


 ,
, 

