
Properties of Sunflower Straw Biochar Activated Using Potassium Hydroxide

Abstract
1. Introduction
2. Results and Discussion
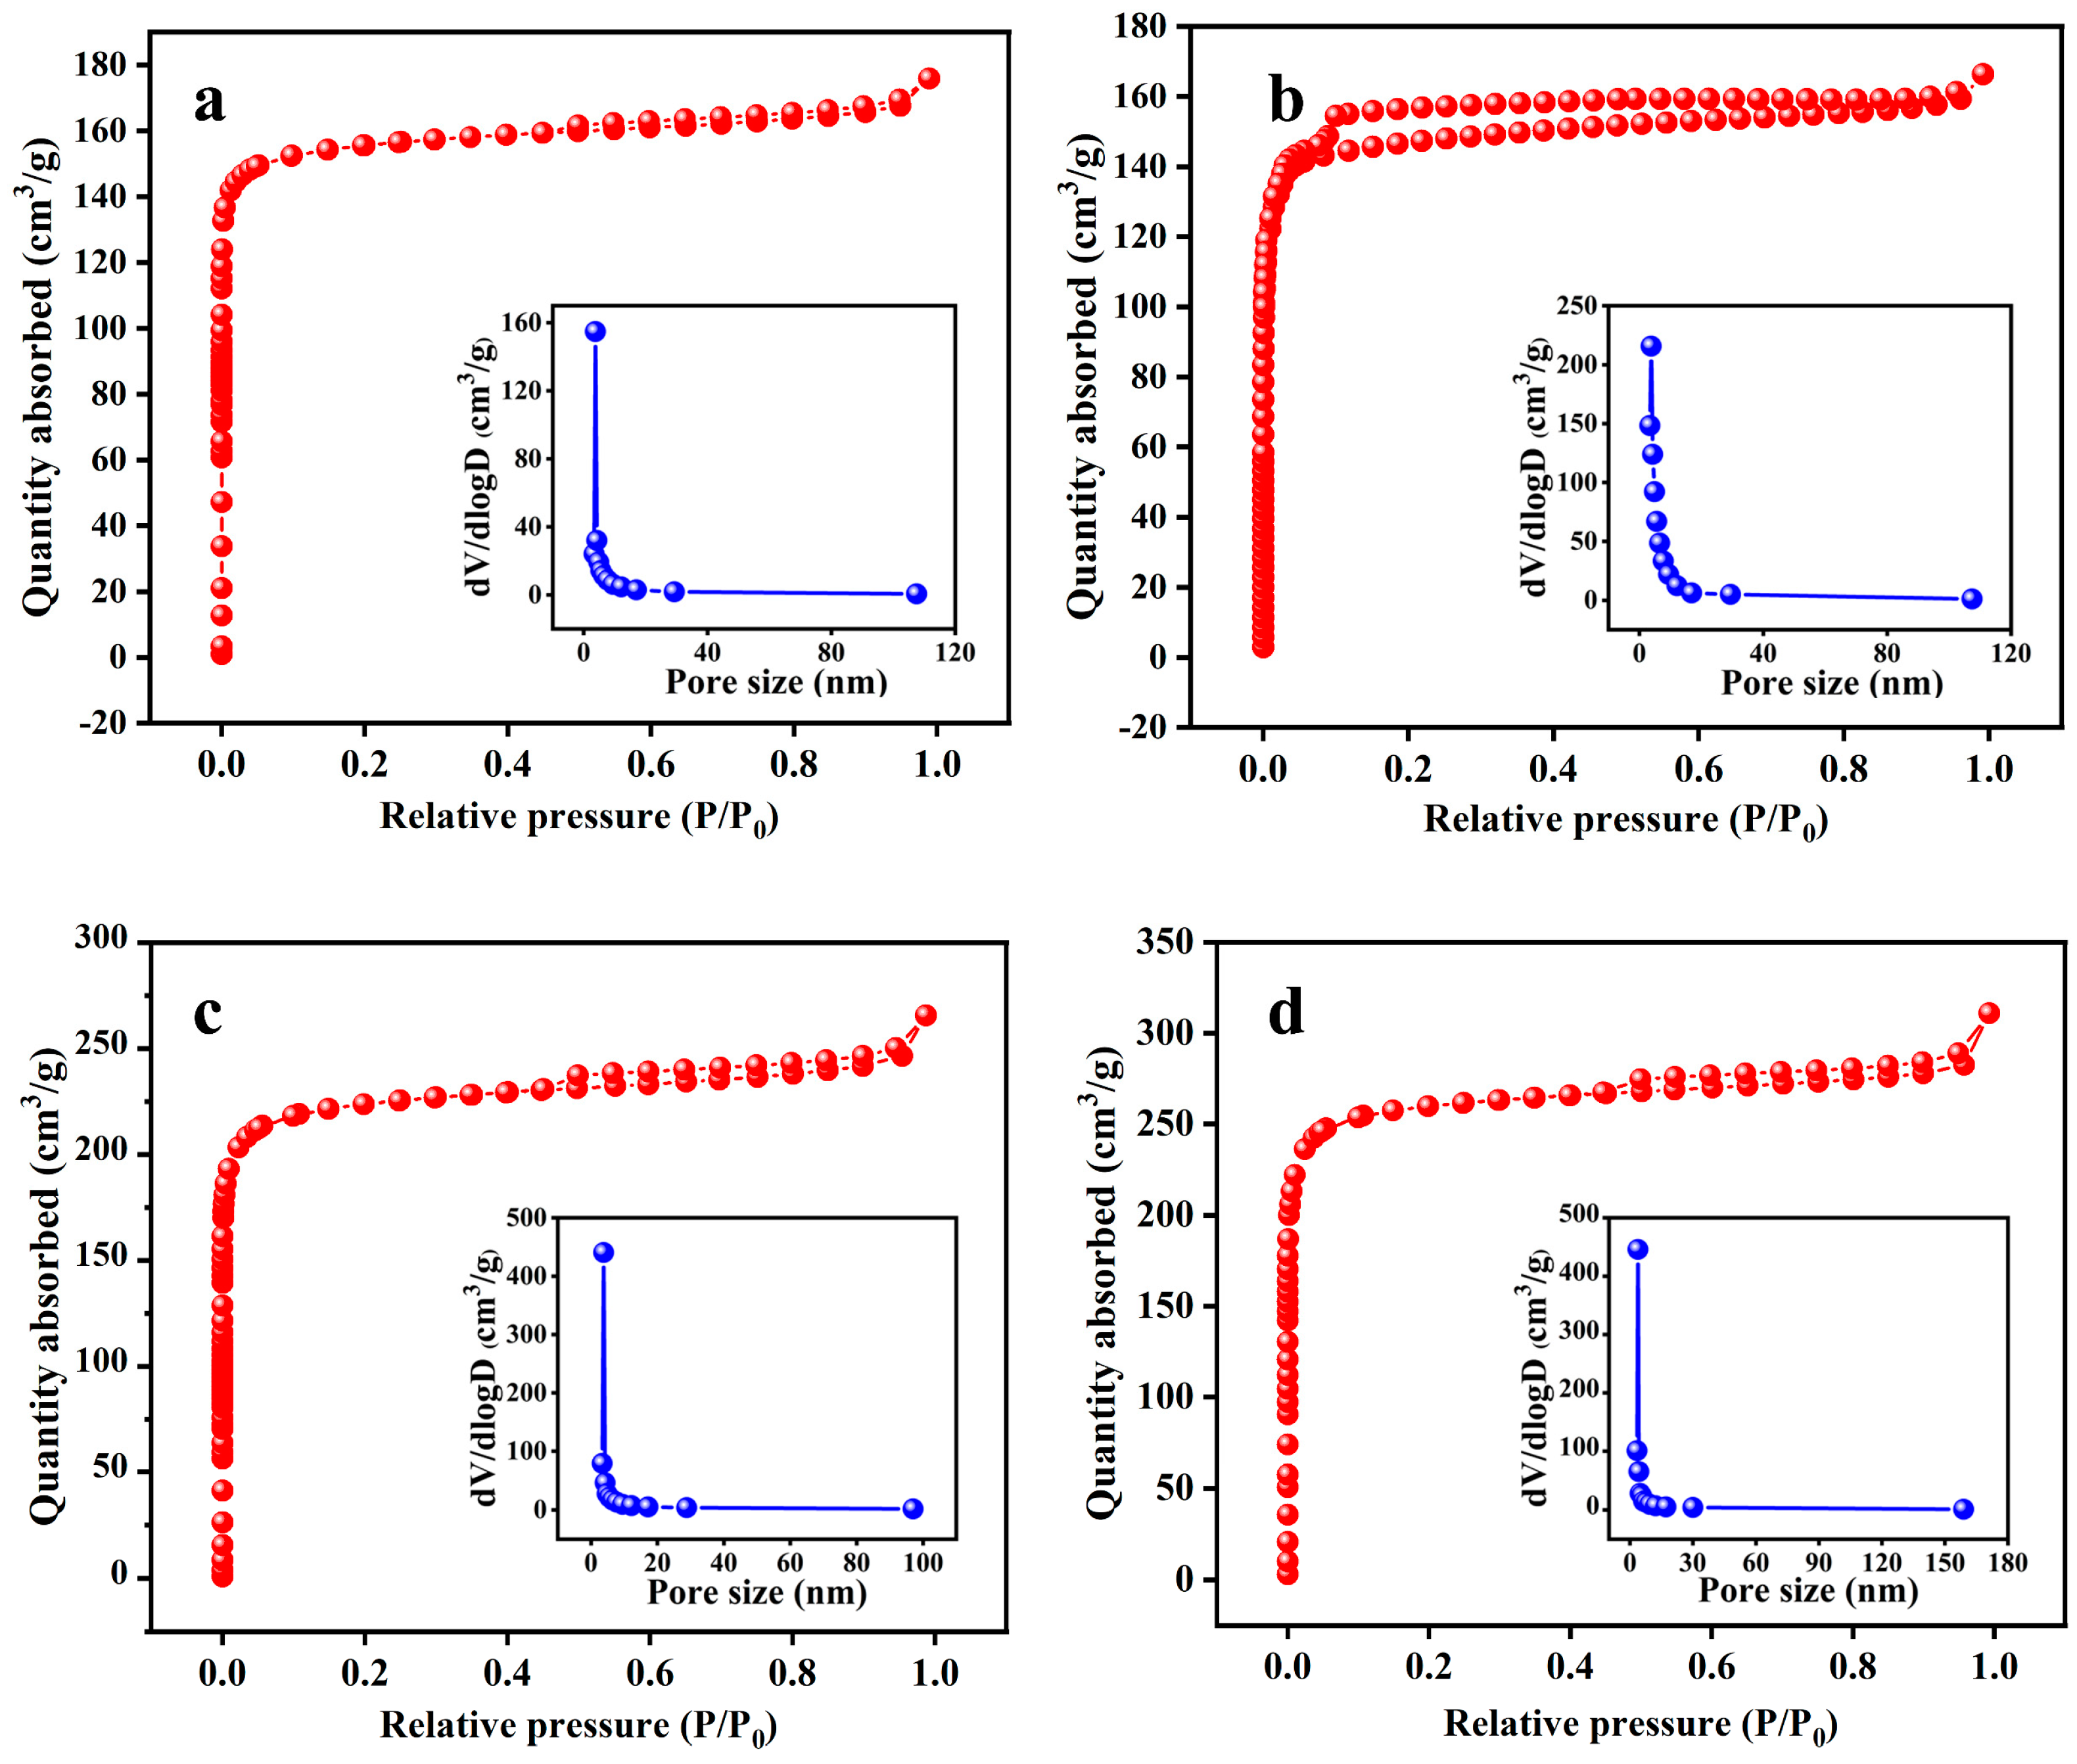
2.1. Effects of the Impregnation Ratio
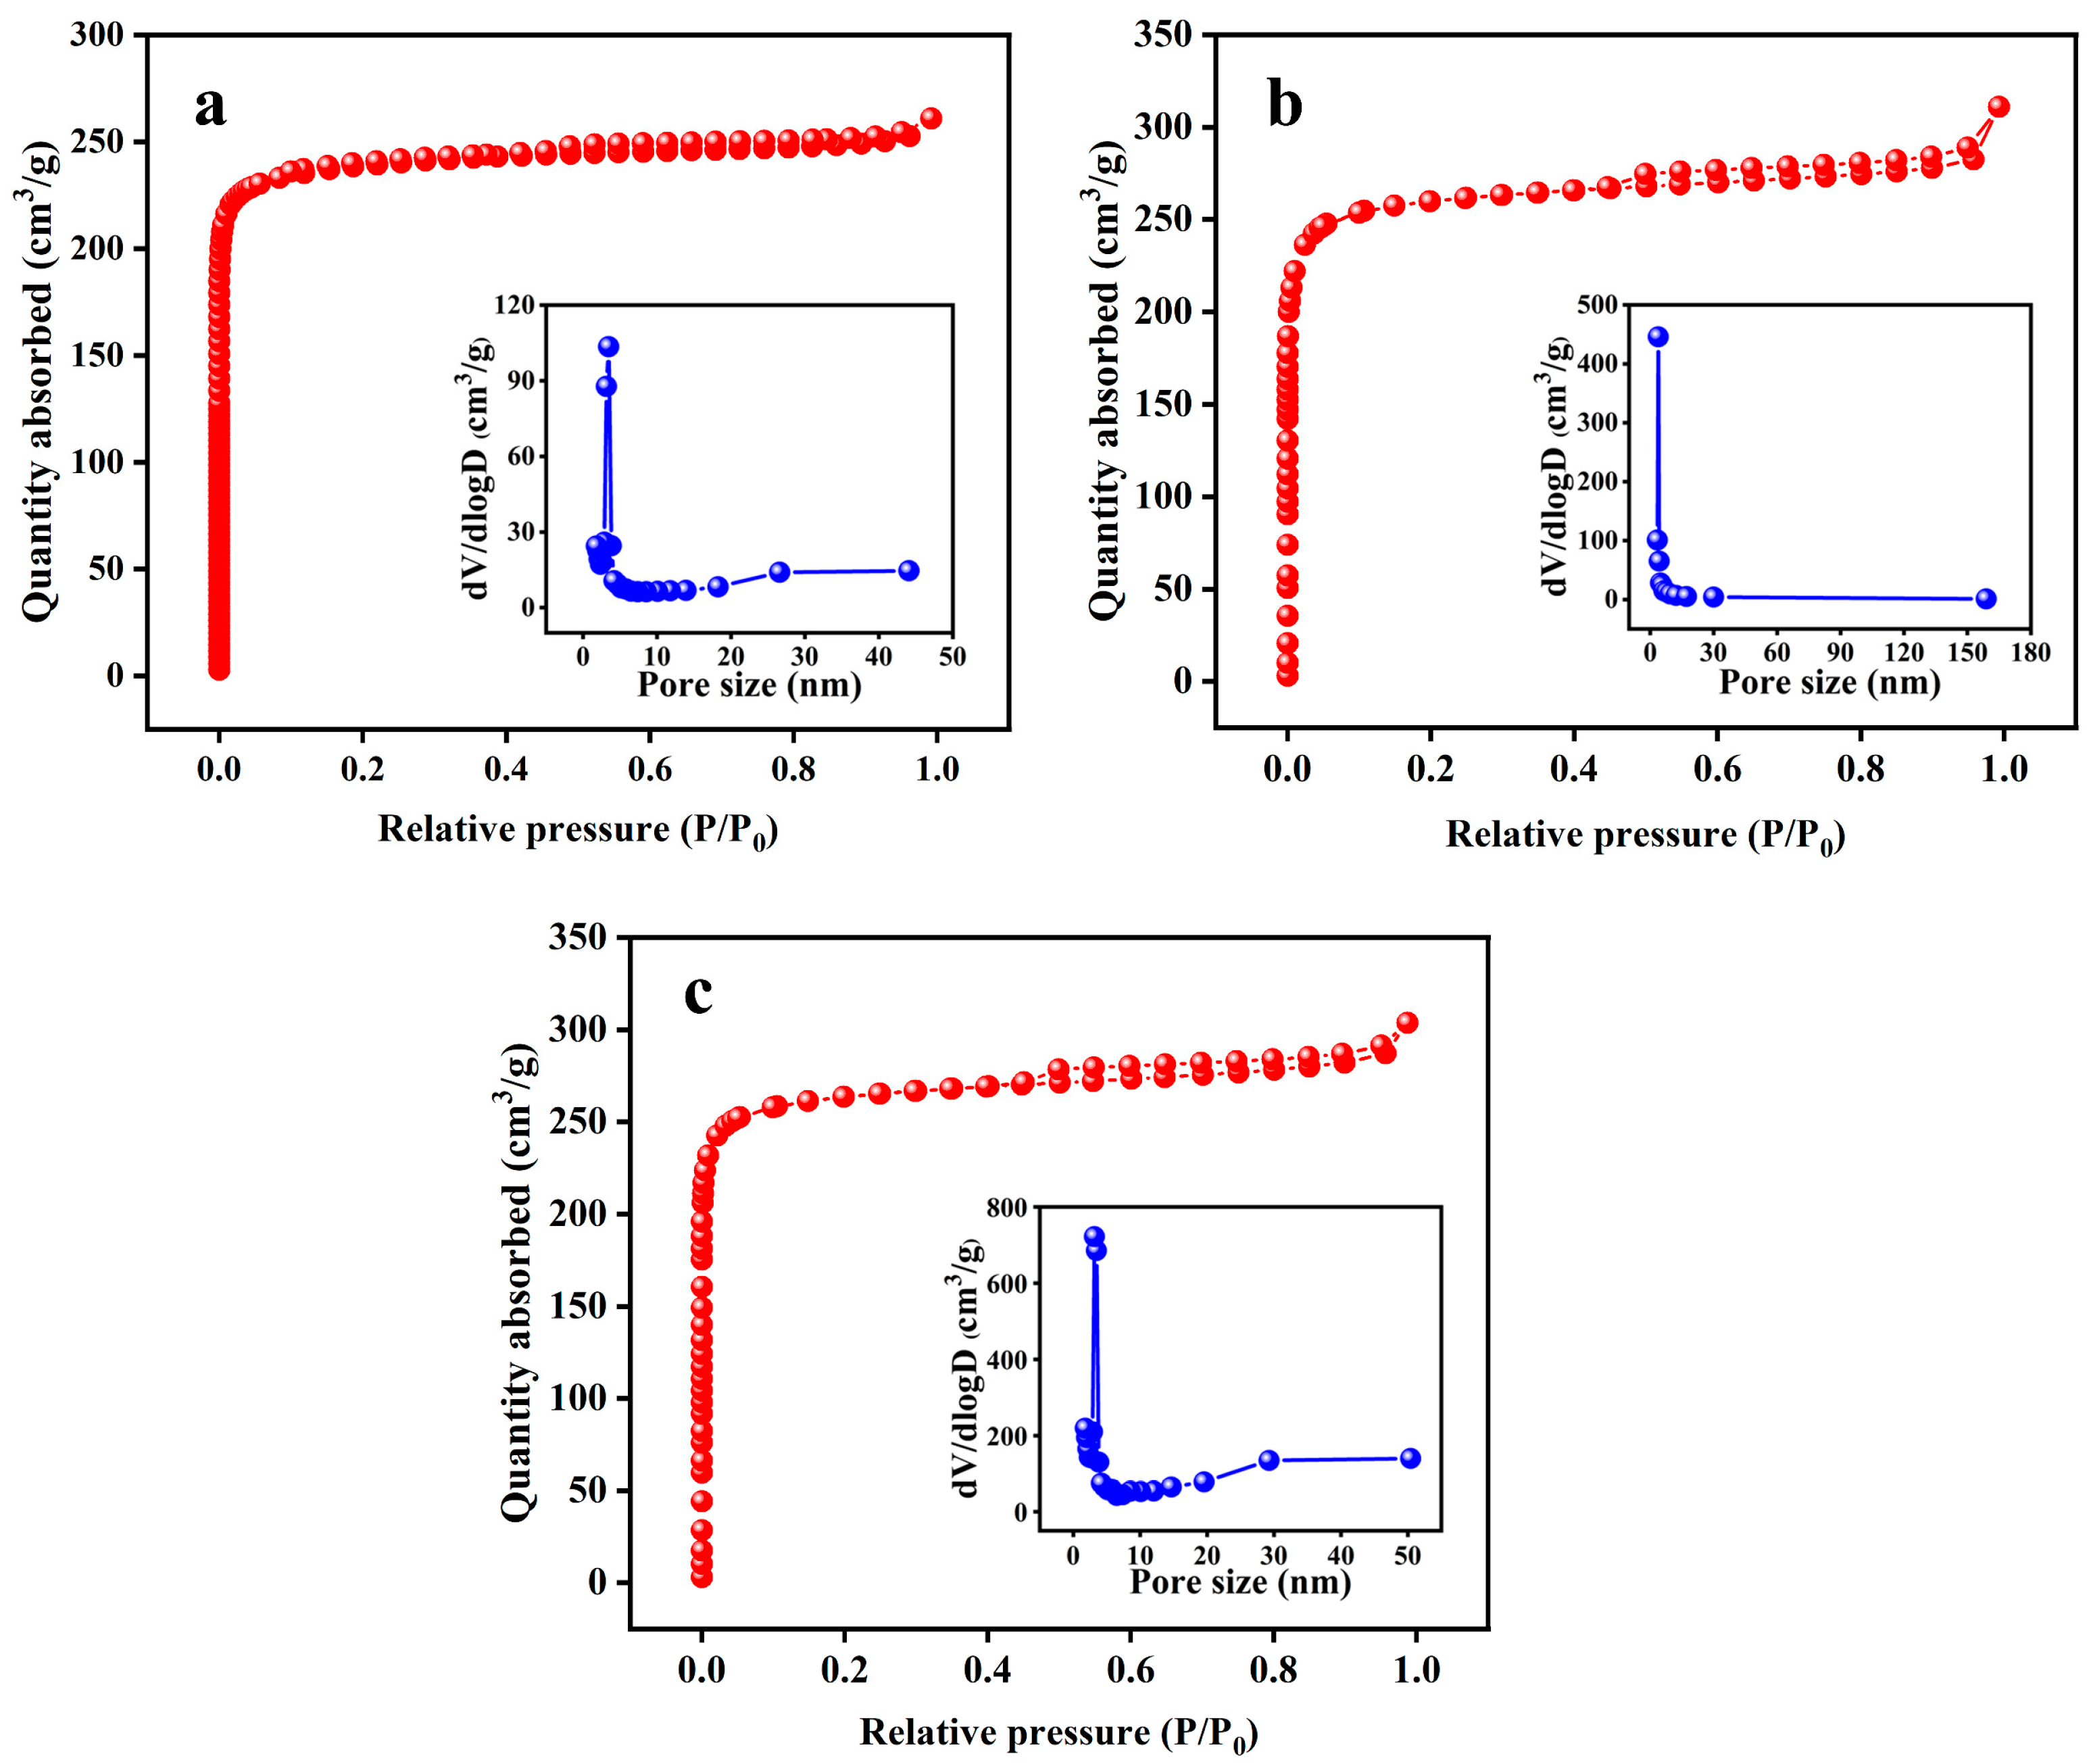
2.2. Effect of Activation Temperature
2.3. Effects of Activation Time
2.4. Characterization of KBC
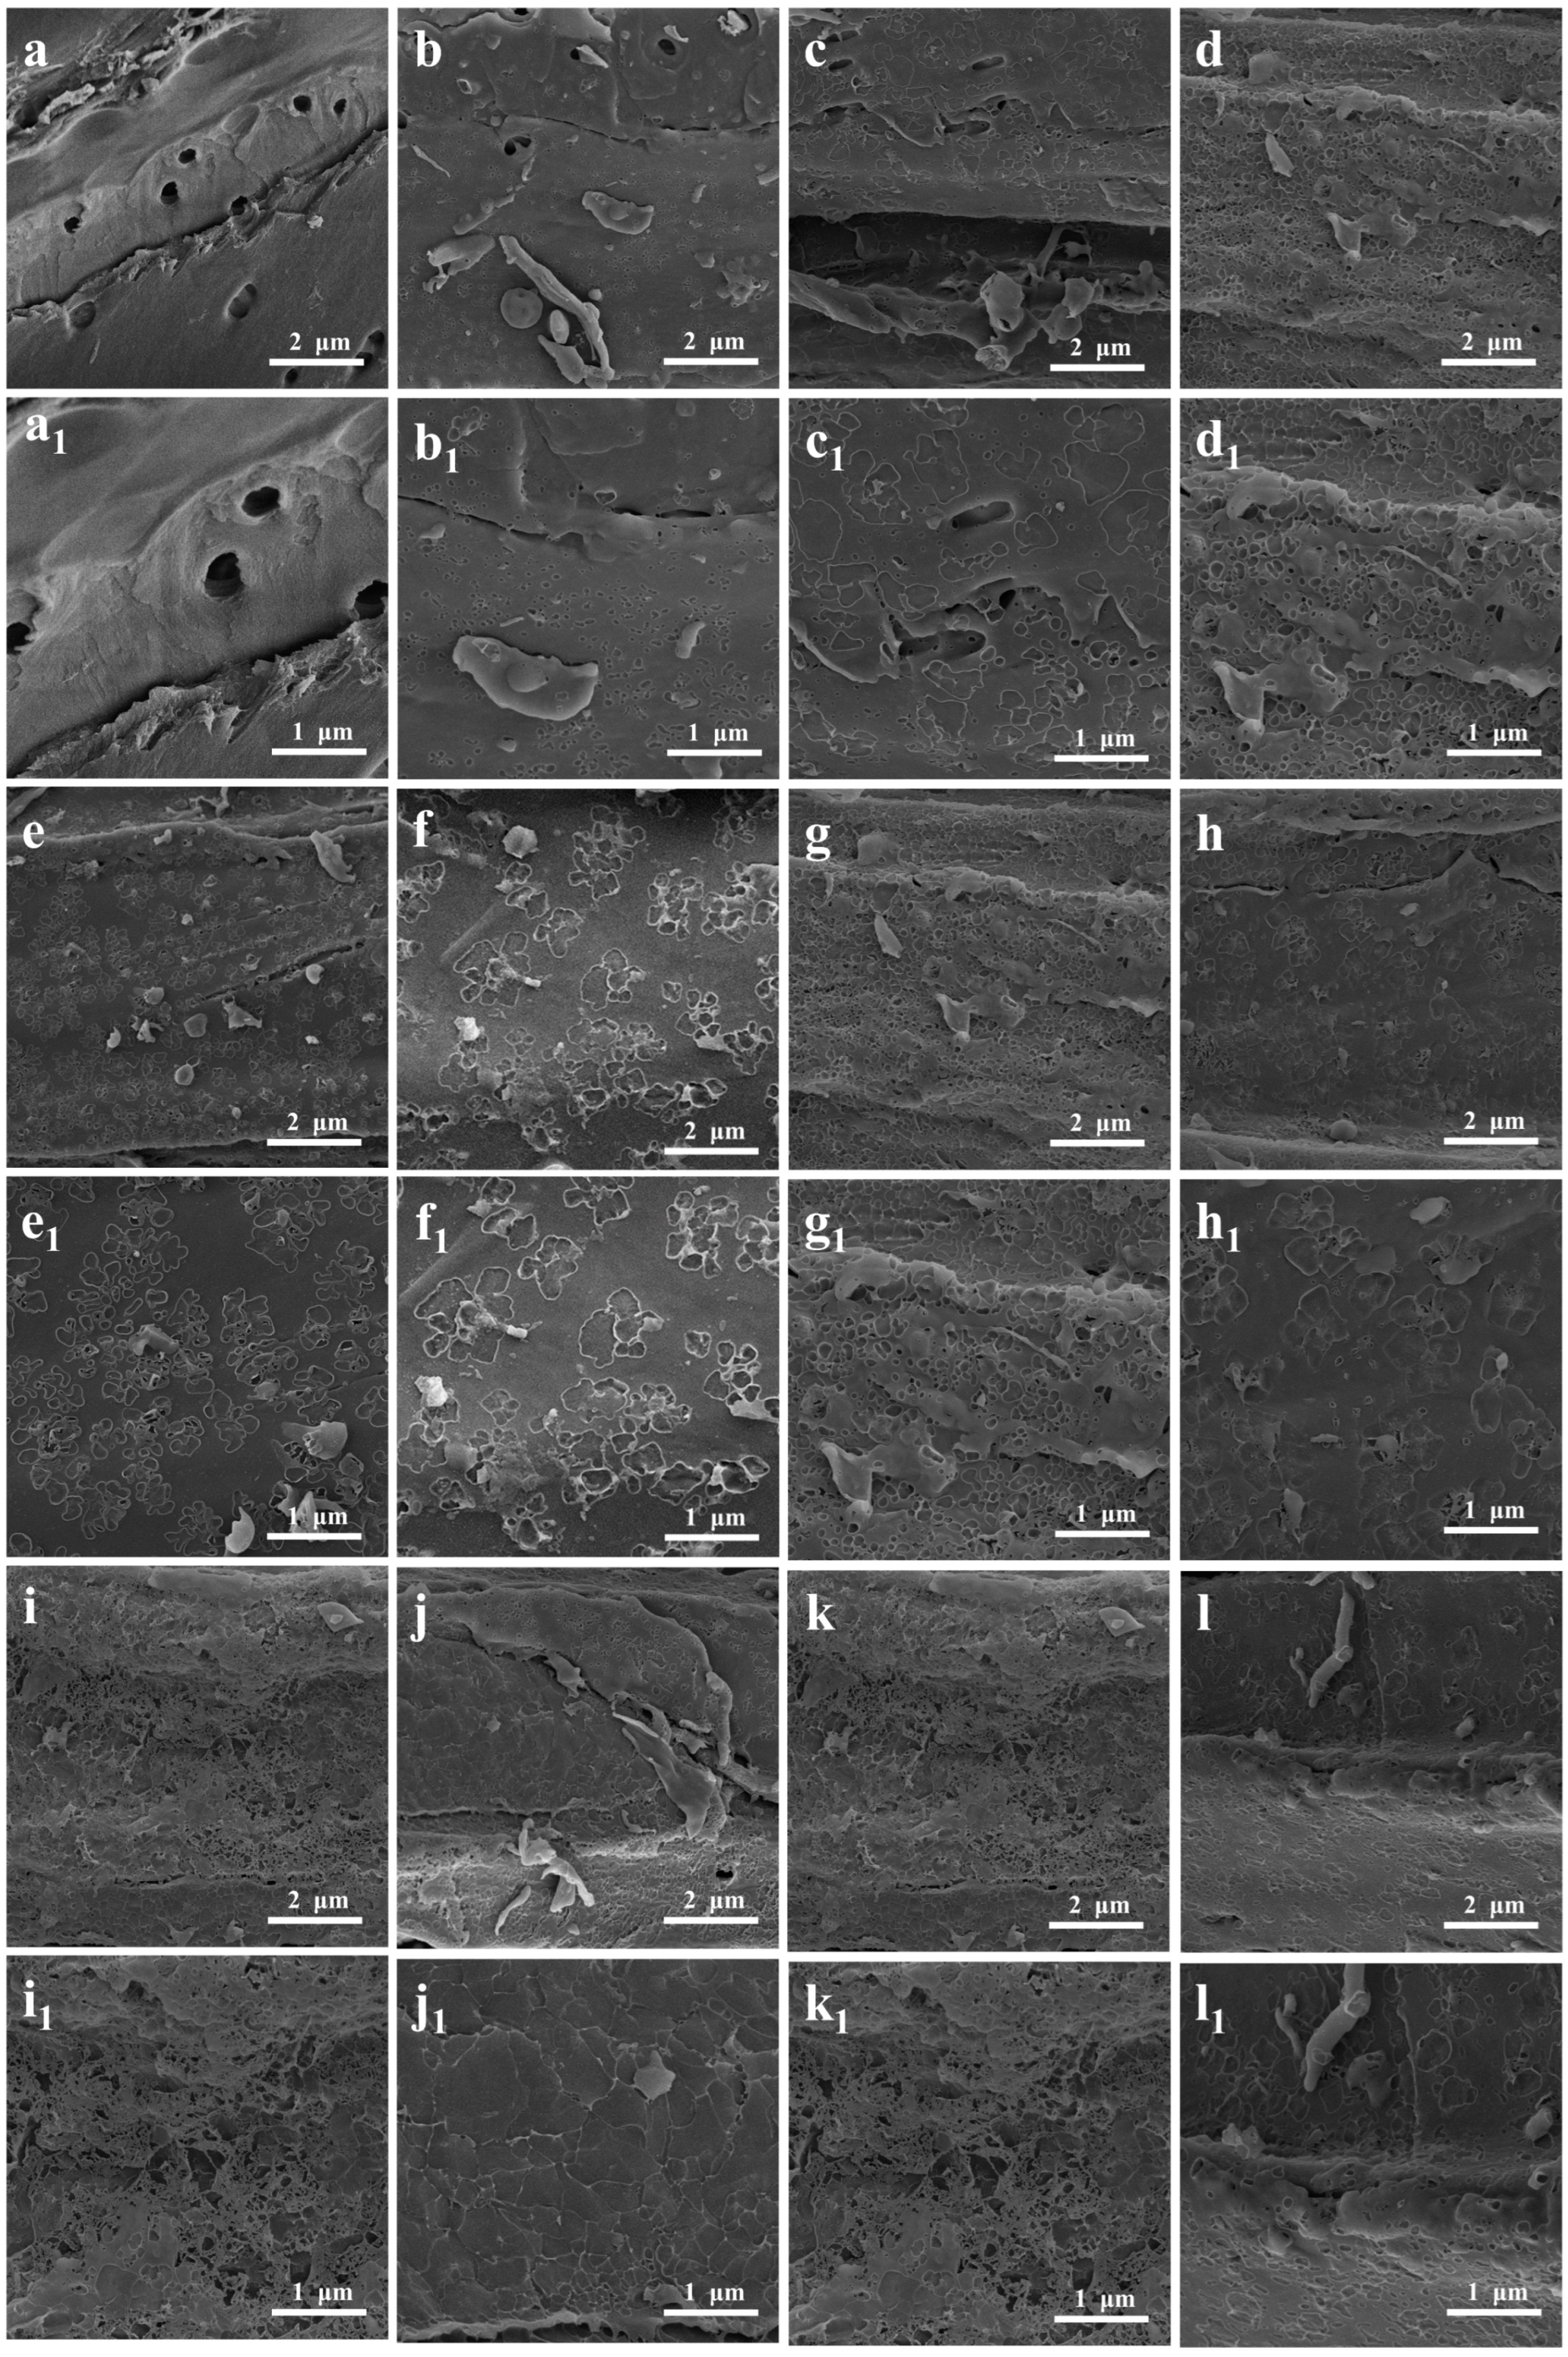
2.4.1. Micromorphology
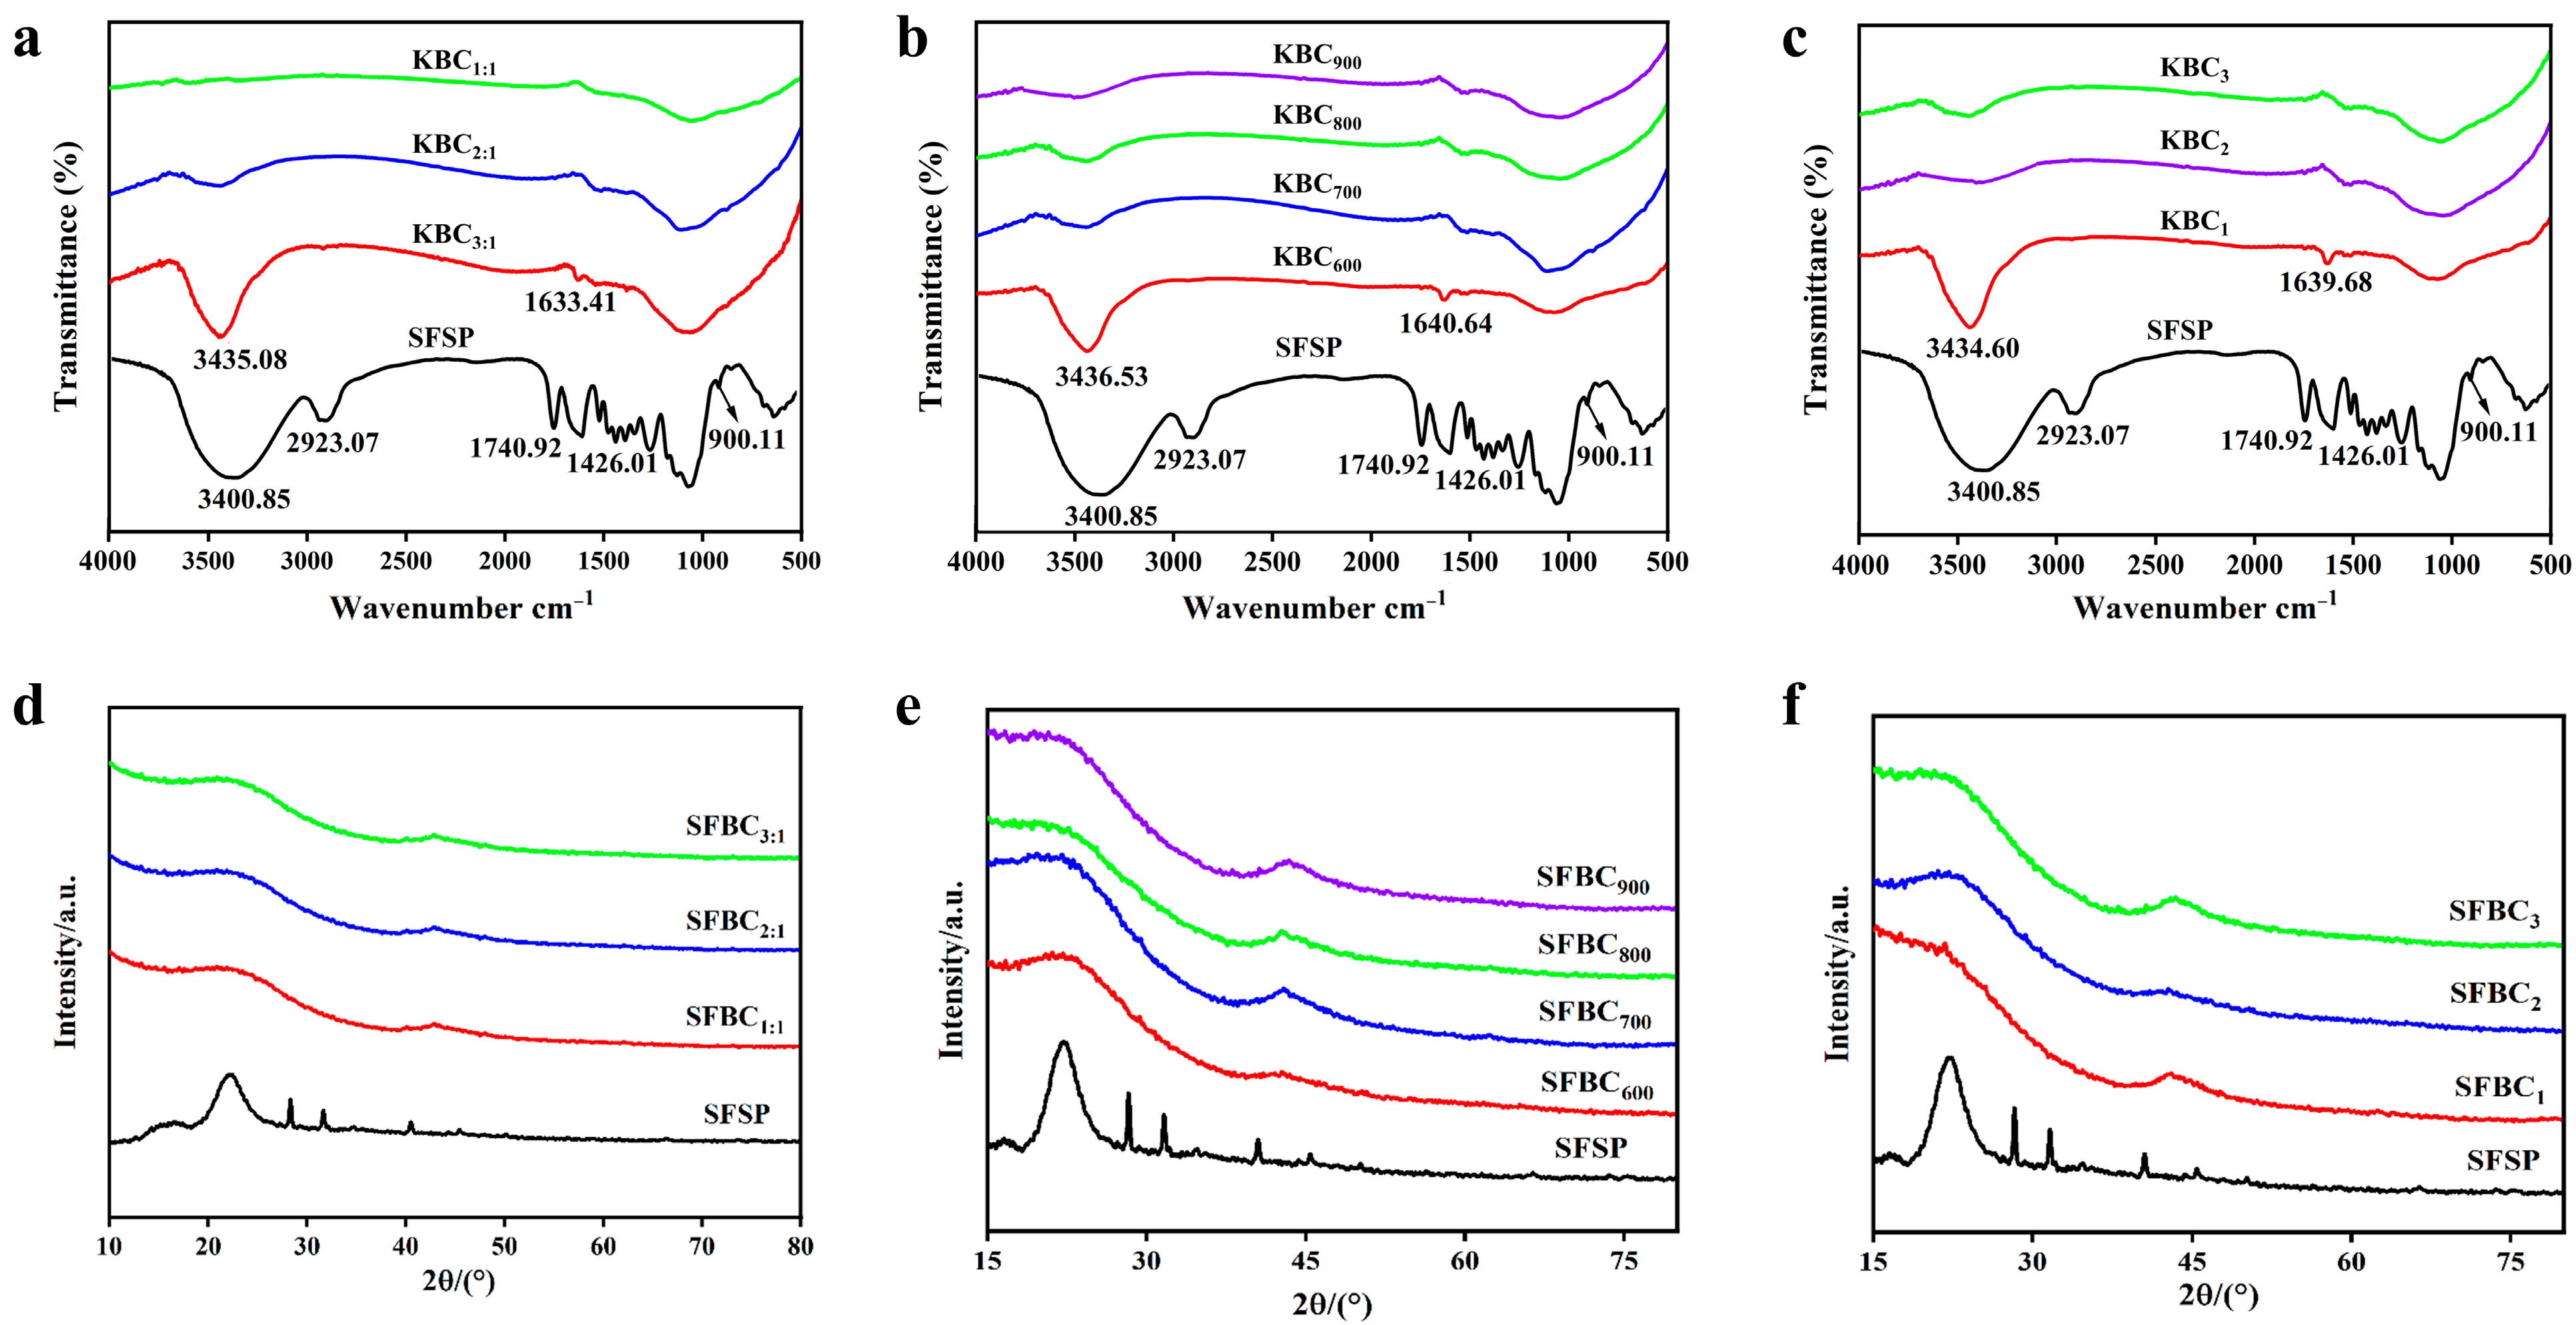
2.4.2. FTIR Results
2.4.3. XRD Results
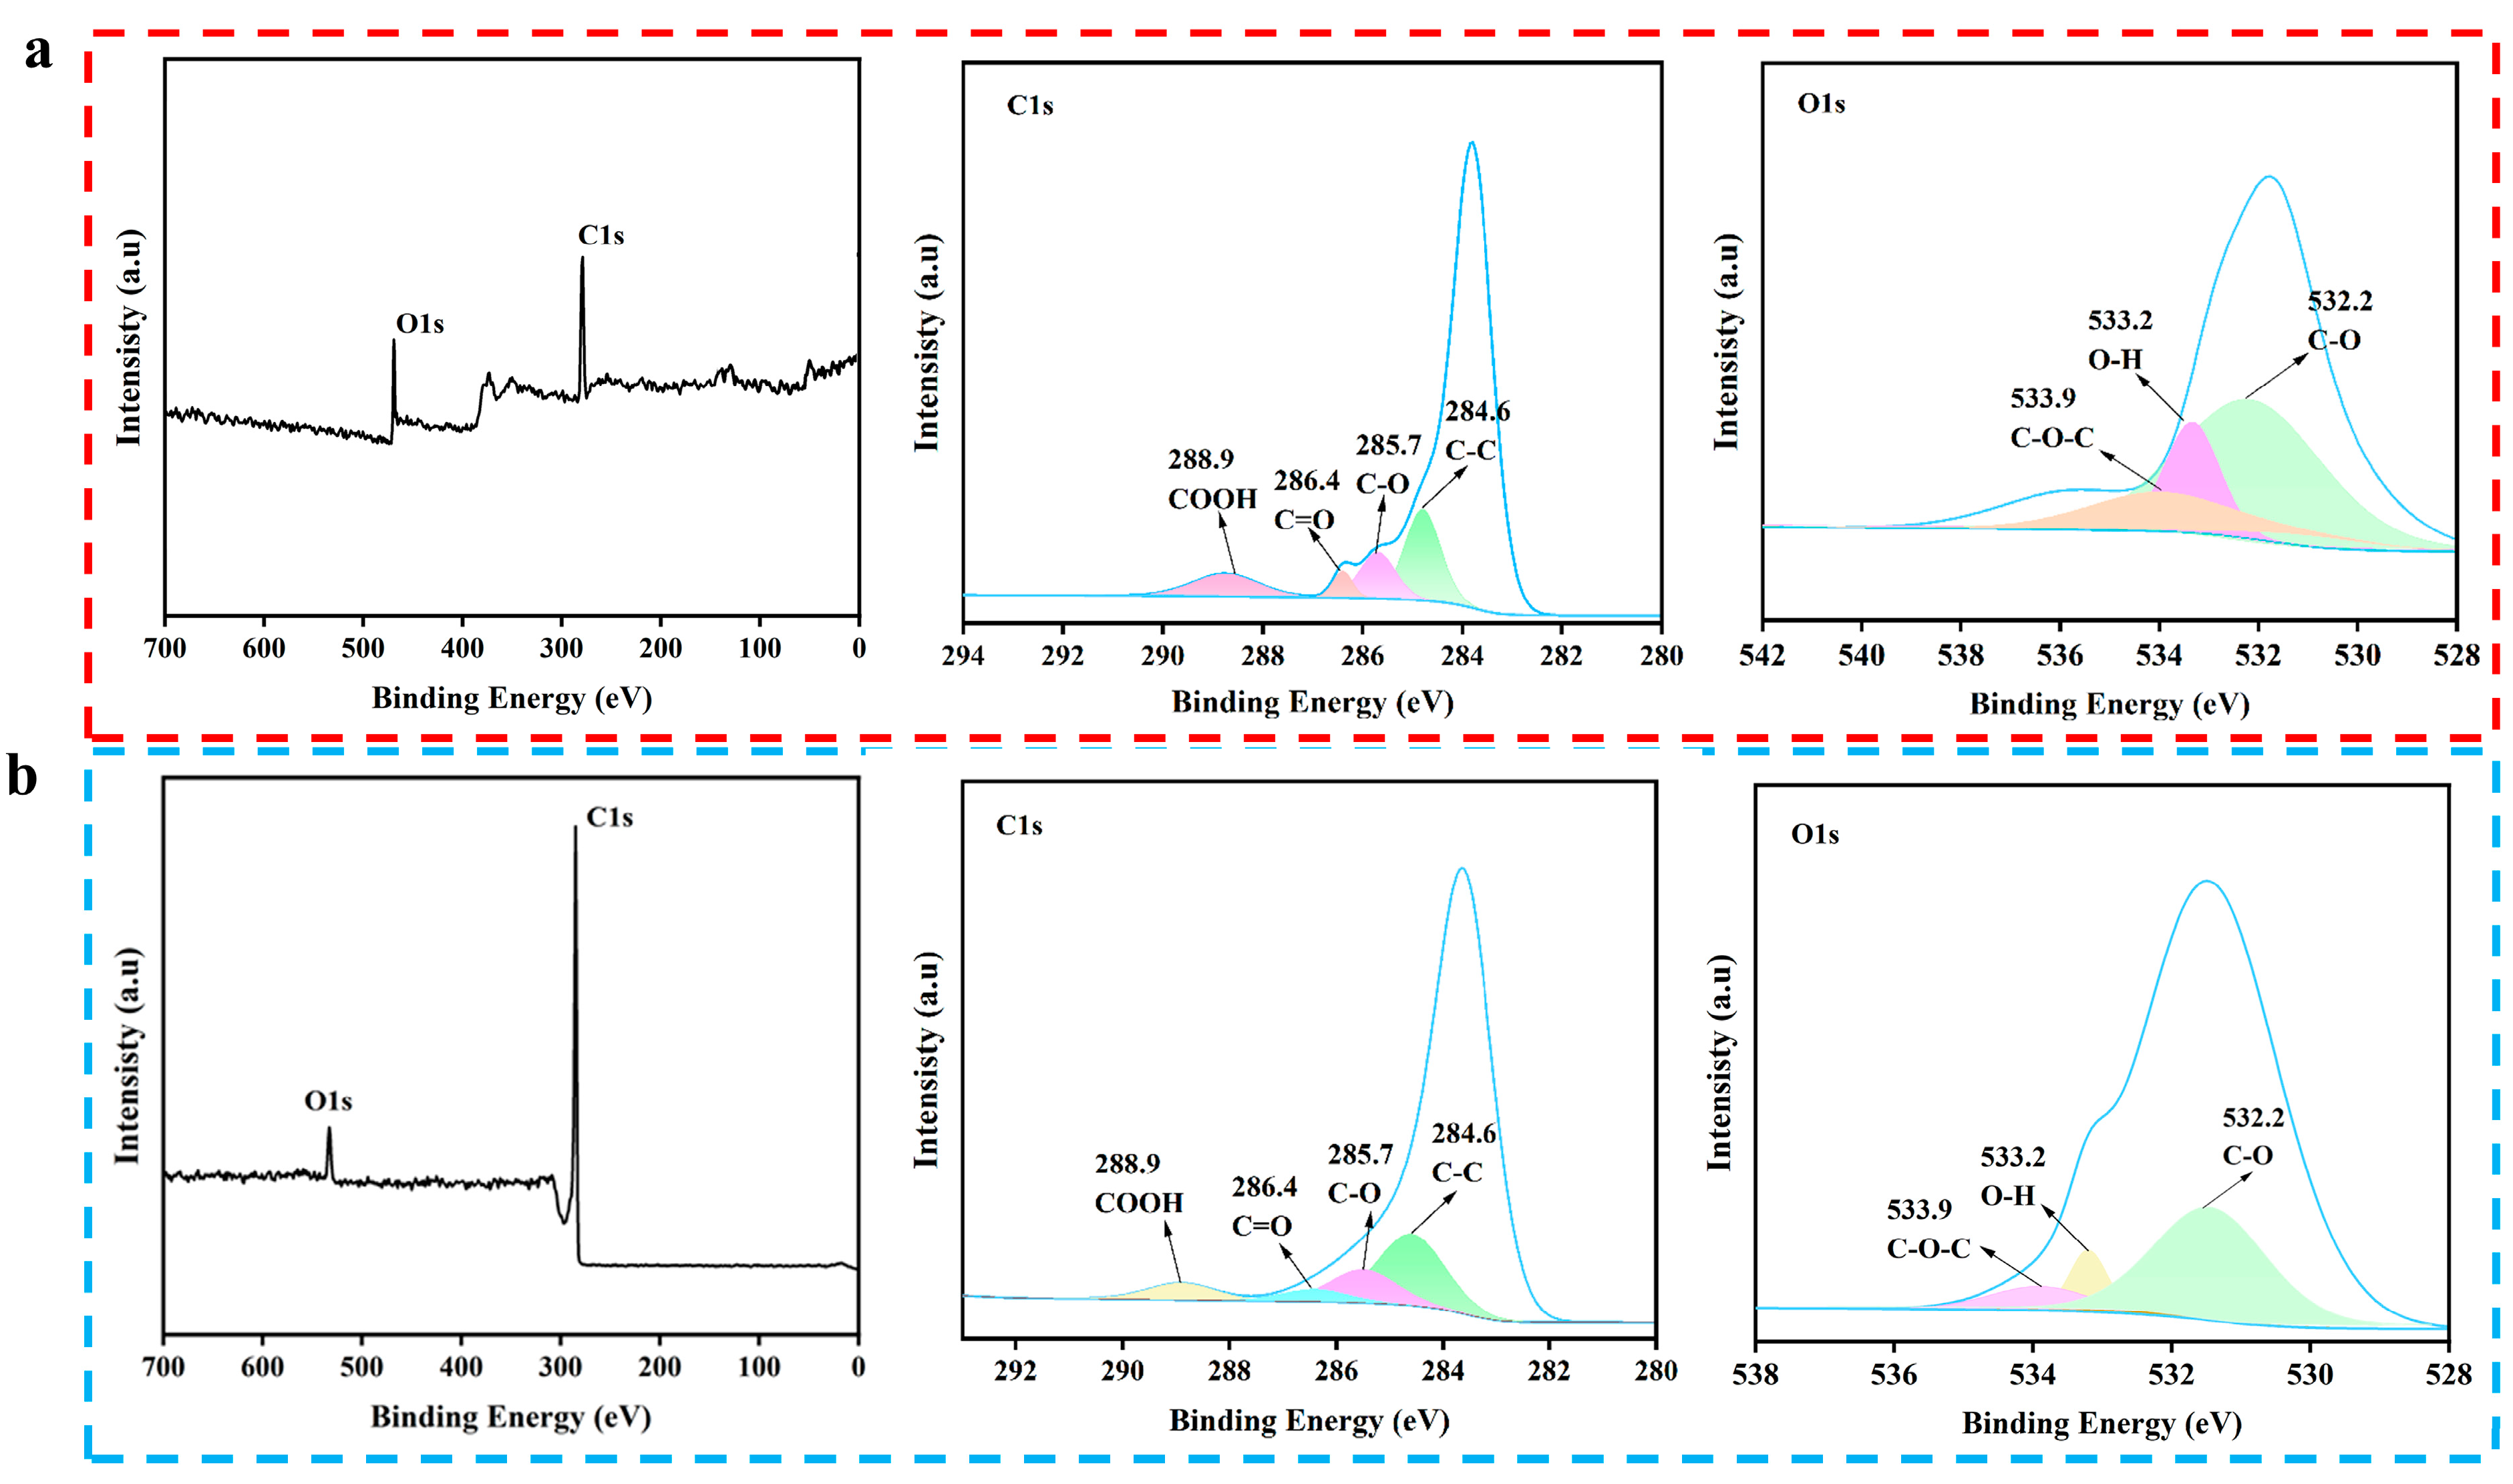
2.4.4. XPS Results
2.4.5. Raman Analysis
3. Material and Methods
3.1. Materials
3.2. Instrumental Analysis
3.3. Preprocessing
3.4. Preparation of KBC
3.5. Yield
3.6. Water Absorption Rate
3.7. Specific Surface Area
4. Conclusions
Author Contributions
Funding
Institutional Review Board Statement
Informed Consent Statement
Data Availability Statement
Conflicts of Interest
References
- Pointner, T.; Rauh, K.; Auñon-Lopez, A.; Kostadinović Veličkovska, S.; Mitrev, S.; Arsov, E.; Pignitter, M. Comprehensive analysis of oxidative stability and nutritional values of germinated linseed and sunflower seed oil. Food Chem. 2024, 454, 139790. [Google Scholar] [CrossRef]
- Jing, B.; Xiong, L.; Fu, W.; Shah, F.; Zheng, X.; Wu, W. Ridge–furrow with plastic film mulching in combination with reduced nitrogen application rate improves water productivity and yield of sunflower in dry semi–humid regions. Agr. Water Manag. 2024, 303, 109050. [Google Scholar] [CrossRef]
- Yue, Y.; Lin, Q.; Irfan, M.; Chen, Q.; Zhao, X.; Li, G. Slow pyrolysis as a promising approach for producing biochar from sunflower straw. BioResources 2018, 13, 7455–7469. [Google Scholar] [CrossRef]
- Santos, B.L.P.; Jesus, M.S.; Mata, F.; Prado, A.A.O.S.; Vieira, I.M.M.; Ramos, L.C.; López, J.A.; Vaz-Velho, M.; Ruzene, D.S.; Silva, D.P. Use of Agro-Industrial Waste for Biosurfactant Production: A Comparative Study of Hemicellulosic Liquors from Corncobs and Sunflower Stalks. Sustainability 2023, 15, 6341. [Google Scholar] [CrossRef]
- de Souza, J.B.; Michelin, M.; Amâncio, F.L.R.; Vital Brazil, O.A.; Polizeli, M.d.L.T.M.; Ruzene, D.S.; Silva, D.P.; Mendonça, M.D.C.; López, J.A. Sunflower stalk as a carbon source inductive for fungal xylanase production. Ind. Crops Prod. 2020, 153, 112368. [Google Scholar] [CrossRef]
- Yang, Z.; Wang, K.; Wang, X.; Huan, S.; Yang, H.; Wang, C. Low-cost, superhydrophobic, flame-retardant sunflower straw-based xerogel as thermal insulation materials for energy-efficient buildings. Sustain. Mater. Technol. 2023, 38, e00748. [Google Scholar] [CrossRef]
- Wang, Y.; Wang, H.; Ji, J.; You, T.; Lu, C.; Liu, C.; Song, Y.; Chen, Z.; Zhu, S. Hydrothermal synthesis and electrochemical properties of Sn-based peanut shell biochar electrode materials. RSC Adv. 2024, 14, 6298–6309. [Google Scholar] [CrossRef] [PubMed]
- Feng, P.; Li, J.; Wang, H.; Xu, Z. Biomass-Based Activated Carbon and Activators: Preparation of Activated Carbon from Corncob by Chemical Activation with Biomass Pyrolysis Liquids. Acs Omega 2020, 5, 24064–24072. [Google Scholar] [CrossRef]
- Suman, S.; Gautam, S. Pyrolysis of coconut husk biomass: Analysis of its biochar properties. Energy Sources Part A 2017, 39, 761–767. [Google Scholar] [CrossRef]
- Cao, W.; Ahmad, F.; Zhao, W.; Mostafa, E.; Zhang, Y. Porous biochar production from microwave pyrolysis of sugarcane bagasse biomass with KOH addition. Energy Sources Part A 2024, 46, 14894–14908. [Google Scholar] [CrossRef]
- Wang, C.; Li, X.; Wu, W.; Chen, G.; Tao, J. Removal of cadmium in water by potassium hydroxide activated biochar produced from Enteromorpha prolifera. J. Water Process Eng. 2021, 42, 102201. [Google Scholar] [CrossRef]
- Wu, Y.; Cheng, H.; Pan, D.; Zhang, L.; Li, W.; Song, Y.; Bian, Y.; Jiang, X.; Han, J. Potassium hydroxide-modified algae-based biochar for the removal of sulfamethoxazole: Sorption performance and mechanisms. J. Environ. Manag. 2021, 293, 112912. [Google Scholar] [CrossRef]
- Andas, J.; Rahman, M.L.A.; Yahya, M.S.M. Preparation and Characterization of Activated Carbon from Palm Kernel Shell. IOP Conf. Ser. Mater. Sci. Eng. 2017, 226, 12156. [Google Scholar] [CrossRef]
- Feng, H.; Hu, H.; Dong, H.; Xiao, Y.; Cai, Y.; Lei, B.; Liu, Y.; Zheng, M. Hierarchical structured carbon derived from bagasse wastes: A simple and efficient synthesis route and its improved electrochemical properties for high-performance supercapacitors. J. Power Sources 2016, 302, 164–173. [Google Scholar] [CrossRef]
- Doczekalska, B.; Bartkowiak, M.; Waliszewska, B.; Orszulak, G.; Cerazy-Waliszewska, J.; Pniewski, T. Characterization of Chemically Activated Carbons Prepared from Miscanthus and Switchgrass Biomass. Materials 2020, 13, 1654. [Google Scholar] [CrossRef] [PubMed]
- Tian, X.; Chen, Z.; Hou, J.; Li, Z. Electrochemical properties of porous carbon derived from coal gasification fine ash via low-temperature alkaline fusion and KOH activation. J. Energy Storage 2024, 75, 109557. [Google Scholar] [CrossRef]
- Chatterjee, S.; Doshi, P.; Kumaraswamy, G. Capillary uptake in macroporous compressible sponges. Soft Matter 2017, 13, 5731–5740. [Google Scholar] [CrossRef]
- Sango, T.; Cheumani Yona, A.M.; Duchatel, L.; Marin, A.; Kor Ndikontar, M.; Joly, N.; Lefebvre, J.-M. Step–wise multi–scale deconstruction of banana pseudo–stem (Musa acuminata) biomass and morpho–mechanical characterization of extracted long fibres for sustainable applications. Ind. Crops Prod. 2018, 122, 657–668. [Google Scholar] [CrossRef]
- Deng, J.; Xiong, T.; Wang, H.; Zheng, A.; Wang, Y. Effects of Cellulose, Hemicellulose, and Lignin on the Structure and Morphology of Porous Carbons. ACS Sustain. Chem. Eng. 2016, 4, 3750–3756. [Google Scholar] [CrossRef]
- Tseng, R.-L.; Tseng, S.-K.; Wu, F.-C.; Hu, C.-C.; Wang, C.-C. Effects of micropore development on the physicochemical properties of KOH-activated carbons. J. Chin. Inst. Eng. 2008, 39, 37–47. [Google Scholar] [CrossRef]
- Wang, L.; Wang, T.; Hao, R.; Wang, Y. Synthesis and applications of biomass-derived porous carbon materials in energy utilization and environmental remediation. Chemosphere 2023, 339, 139635. [Google Scholar] [CrossRef] [PubMed]
- Aksu, Z.; Tezer, S. Equilibrium and kinetic modelling of biosorption of Remazol Black B by Rhizopus arrhizus in a batch system: Effect of temperature. Process Biochem. 2000, 36, 431–439. [Google Scholar] [CrossRef]
- Hu, M.; Ye, Z.; Zhang, Q.; Xue, Q.; Li, Z.; Wang, J.; Pan, Z. Towards understanding the chemical reactions between KOH and oxygen-containing groups during KOH-catalyzed pyrolysis of biomass. Energy 2022, 245, 123286. [Google Scholar] [CrossRef]
- Wang, K.; Xu, S. Preparation of high specific surface area activated carbon from petroleum coke by KOH activation in a rotary kiln. Processes 2024, 12, 241. [Google Scholar] [CrossRef]
- Chen, W.; Gong, M.; Li, K.; Xia, M.; Chen, Z.; Xiao, H.; Fang, Y.; Chen, Y.; Yang, H.; Chen, H. Insight into KOH activation mechanism during biomass pyrolysis: Chemical reactions between O-containing groups and KOH. Appl. Energy 2020, 278, 115730. [Google Scholar] [CrossRef]
- Bag, O.; Tekin, K.; Karagoz, S. Microporous activated carbons from lignocellulosic biomass by KOH activation. Fuller. Nanotub. Carbon Nanostructures 2020, 28, 1030–1037. [Google Scholar] [CrossRef]
- Chen, B.; Johnson, E.J.; Chefetz, B.; Zhu, L.; Xing, B. Sorption of Polar and Nonpolar Aromatic Organic Contaminants by Plant Cuticular Materials: Role of Polarity and Accessibility. Environ. Sci. Technol. 2005, 39, 6138–6146. [Google Scholar] [CrossRef]
- Wang, F.; Sun, H.; Ren, X.; Liu, Y.; Zhu, H.; Zhang, P.; Ren, C. Effects of humic acid and heavy metals on the sorption of polar and apolar organic pollutants onto biochars. Environ. Pollut. 2017, 231, 229–236. [Google Scholar] [CrossRef]
- Uchimiya, M.; Klasson, K.T.; Wartelle, L.H.; Lima, I.M. Influence of soil properties on heavy metal sequestration by biochar amendment: 1. Copper sorption isotherms and the release of cations. Chemosphere 2011, 82, 1431–1437. [Google Scholar] [CrossRef]
- Lu, L.; Chen, B. Biochar-amendment-reduced cotransport of graphene oxide nanoparticles and dimethyl phthalate in saturated porous media. Sci. Total Environ. 2020, 705, 135094. [Google Scholar] [CrossRef]
- Chu, K.H. Fitting the Gompertz equation to asymmetric breakthrough curves. J. Environ. Chem. Eng. 2020, 8, 103713. [Google Scholar] [CrossRef]
- Chen, R.; Li, L.; Liu, Z.; Lu, M.; Wang, C.; Li, H.; Ma, W.; Wang, S. Preparation and characterization of activated carbons from tobacco stem by chemical activation. J. Air. Waste Manag. Assoc. 2017, 67, 713–724. [Google Scholar] [CrossRef]
- Alcañiz-Monge, J.; Illán-Gómez, M.J. Insight into hydroxides-activated coals: Chemical or physical activation? J. Colloid Interface Sci. 2008, 318, 35–41. [Google Scholar] [CrossRef]
- Raymundo-Piñero, E.; Azaïs, P.; Cacciaguerra, T.; Cazorla-Amorós, D.; Linares-Solano, A.; Béguin, F. KOH and NaOH activation mechanisms of multiwalled carbon nanotubes with different structural organisation. Carbon 2005, 43, 786–795. [Google Scholar] [CrossRef]
- Lozano-Castelló, D.; Calo, J.M.; Cazorla-Amorós, D.; Linares-Solano, A. Carbon activation with KOH as explored by temperature programmed techniques, and the effects of hydrogen. Carbon 2007, 45, 2529–2536. [Google Scholar] [CrossRef]
- Wang, S.; Lin, H.; Zhang, L.; Dai, G.; Zhao, Y.; Wang, X.; Ru, B. Structural Characterization and Pyrolysis Behavior of Cellulose and Hemicellulose Isolated from Softwood Pinus armandii Franch. Energy Fuels 2016, 30, 5721–5728. [Google Scholar] [CrossRef]
- Wang, J.; Chen, M.; Wang, C.; Wang, J.; Zheng, J. Preparation of mesoporous carbons from amphiphilic carbonaceous material for high-performance electric double-layer capacitors. J. Power Sources 2011, 196, 550–558. [Google Scholar] [CrossRef]
- Daud, W.M.A.W.; Ali, W.S.W.; Sulaiman, M.Z. The effects of carbonization temperature on pore development in palm-shell-based activated carbon. Carbon 2000, 38, 1925–1932. [Google Scholar] [CrossRef]
- Li, M.; Wang, Y.; Liu, Y.; Wang, H.; Song, H. Preparation of active carbon through one-step NaOH activation of coconut shell biomass for phenolic wastewater treatment. Res. Chem. Intermed. 2022, 48, 1665–1684. [Google Scholar] [CrossRef]
- Manna, S.; Singh, N.; Purakayastha, T.J.; Berns, A.E. Effect of deashing on physico-chemical properties of wheat and rice straw biochars and potential sorption of pyrazosulfuron-ethyl. Arab. J. Chem. 2020, 13, 1247–1258. [Google Scholar] [CrossRef]
- Zhao, S.-X.; Ta, N.; Wang, X.-D. Effect of Temperature on the Structural and Physicochemical Properties of Biochar with Apple Tree Branches as Feedstock Material. Energies 2017, 10, 1293. [Google Scholar] [CrossRef]
- Bruun, E.W.; Ambus, P.; Egsgaard, H.; Hauggaard-Nielsen, H. Effects of slow and fast pyrolysis biochar on soil C and N turnover dynamics. Soil Biol. Biochem. 2012, 46, 73–79. [Google Scholar] [CrossRef]
- Deng, L.; Zhao, Y.; Sun, S.; Feng, D.; Zhang, W. Preparation of corn straw-based carbon by “carbonization-KOH activation” two-step method: Gas–solid product characteristics, activation mechanism and hydrogen storage potential. Fuel 2024, 358, 130134. [Google Scholar] [CrossRef]
- Conte, P.; Bertani, R.; Sgarbossa, P.; Bambina, P.; Schmidt, H.-P.; Raga, R.; Lo Papa, G.; Chillura Martino, D.F.; Lo Meo, P. Recent Developments in Understanding Biochar’s Physical–Chemistry. Agronomy 2021, 11, 615. [Google Scholar] [CrossRef]
- Chu, G.; Zhao, J.; Huang, Y.; Zhou, D.; Liu, Y.; Wu, M.; Peng, H.; Zhao, Q.; Pan, B.; Steinberg, C.E.W. Phosphoric acid pretreatment enhances the specific surface areas of biochars by generation of micropores. Environ. Pollut. 2018, 240, 1–9. [Google Scholar] [CrossRef]
- Gao, X.; Wu, L.; Xu, Q.; Tian, W.; Li, Z.; Kobayashi, N. Adsorption kinetics and mechanisms of copper ions on activated carbons derived from pinewood sawdust by fast H3PO4 activation. Environ. Sci. Pollut. Res. 2018, 25, 7907–7915. [Google Scholar] [CrossRef]
- Vali, I.P.; Anusha, B.S.; Pruthvija, M.; Savitha, S.; Ravindra, S.; Nagaveni, M.; Poojitha, P.S.; Swathi, N. Bamboo and coconut shell based activated carbon: A Raman spectroscopic study. Mater. Chem. Phys. 2024, 318, 129240. [Google Scholar] [CrossRef]
- Ouyang, H.; Ma, Y.; Gong, Q.; Li, C.; Huang, J.; Xu, Z.; Wei, B. Tailoring porous structure and graphitic degree of seaweed-derived carbons for high-rate performance lithium-ion batteries. J. Alloys Compd. 2020, 823, 153862. [Google Scholar] [CrossRef]
- Keiluweit, M.; Nico, P.S.; Johnson, M.G.; Kleber, M. Dynamic molecular structure of plant biomass-derived black carbon (biochar). Environ. Sci. Technol. 2010, 44, 1247–1253. [Google Scholar] [CrossRef]


| Y/% | R/% | ABET (m2/g) | Vmic (cm3/g) | V (cm3/g) | D (nm) | |
|---|---|---|---|---|---|---|
| SFBC | 0 | 337.83 | 4.034 | 0 | 0.026 | 25.806 ± 1.0 |
| KBC0.5:1 | 56.23 | 198.10 | 506.812 | 0.139 | 0.227 | 2.109 ± 0.3 |
| KBC1:1 | 50.40 | 165.27 | 404.555 | 0.191 | 0.258 | 2.239 ± 0.4 |
| KBC2:1 | 48.43 | 139.70 | 594.655 | 0.213 | 0.267 | 1.676 ± 0.2 |
| KBC3:1 | 47.63 | 156.13 | 284.456 | 0.0480 | 0.206 | 2.891 ± 0.5 |
| C (%) | O (%) | H (%) | N (%) | H/C | O/C | |
|---|---|---|---|---|---|---|
| SFBC | 63.39 | 30.57 | 2.50 | 3.54 | 0.47 | 0.36 |
| KBC1:1 | 80.51 | 16.49 | 1.36 | 1.64 | 0.20 | 0.15 |
| KBC2:1 | 85.28 | 12.14 | 1.10 | 1.48 | 0.15 | 0.11 |
| KBC3:1 | 90.23 | 7.77 | 0.84 | 1.16 | 0.11 | 0.06 |
| Y/% | R/% | ABET (m2/g) | Vmic (cm3/g) | V (cm3/g) | D (nm) | |
|---|---|---|---|---|---|---|
| SFBC | 0 | 337.83 | 4.034 | 0 | 0.026 | 25.806 ± 1.0 |
| KBC600 | 62.03 | 183.47 | 622.292 | 0.188 | 0.272 | 1.748 ± 0.1 |
| KBC700 | 48.43 | 139.70 | 594.655 | 0.213 | 0.267 | 1.676 ± 0.2 |
| KBC800 | 45.60 | 126.30 | 885.065 | 0.250 | 0.411 | 1.857 ± 0.4 |
| KBC900 | 39.53 | 117.57 | 1032.361 | 0.310 | 0.481 | 1.863 ± 0.2 |
| C (%) | O (%) | H (%) | N (%) | H/C | O/C | |
|---|---|---|---|---|---|---|
| SFBC | 63.39 | 30.57 | 2.50 | 3.54 | 0.47 | 0.36 |
| KBC600 | 82.21 | 14.30 | 1.68 | 1.81 | 0.24 | 0.13 |
| KBC700 | 85.28 | 12.14 | 1.10 | 1.48 | 0.15 | 0.11 |
| KBC800 | 87.24 | 10.76 | 0.92 | 1.08 | 0.13 | 0.09 |
| KBC900 | 92.48 | 5.62 | 0.77 | 1.13 | 0.10 | 0.05 |
| Y/% | R/% | ABET (m2/g) | Vmic (cm3/g) | V (cm3/g) | D (nm) | |
|---|---|---|---|---|---|---|
| SFBC | 0 | 337.83 | 4.034 | 0 | 0.026 | 25.806 ± 1.0 |
| KBC1 | 44.4 | 154.87 | 961.719 | 0.312 | 0.404 | 1.640 ± 0.1 |
| KBC2 | 39.53 | 117.57 | 1032.361 | 0.310 | 0.481 | 1.863 ± 0.2 |
| KBC3 | 35.80 | 119.23 | 1052.600 | 0.331 | 0.470 | 1.787 ± 0.1 |
| C (%) | O (%) | H (%) | N (%) | H/C | O/C | |
|---|---|---|---|---|---|---|
| SFBC | 63.39 | 30.57 | 2.50 | 3.54 | 0.47 | 0.36 |
| KBC1 | 90.40 | 6.90 | 1.27 | 1.43 | 0.17 | 0.06 |
| KBC2 | 92.68 | 5.62 | 0.77 | 0.93 | 0.10 | 0.05 |
| KBC3 | 92.69 | 5.61 | 0.74 | 0.96 | 0.09 | 0.05 |
| Impregnation Ratio | Activation Temperature (°C) | Activation Time (h) | |
|---|---|---|---|
| 1 | 0.5:1 | 600 | 1 |
| 2 | 1:1 | 700 | 2 |
| 3 | 2:1 | 800 | 3 |
| 4 | 3:1 | 900 | — |
Disclaimer/Publisher’s Note: The statements, opinions and data contained in all publications are solely those of the individual author(s) and contributor(s) and not of MDPI and/or the editor(s). MDPI and/or the editor(s) disclaim responsibility for any injury to people or property resulting from any ideas, methods, instructions or products referred to in the content. |
© 2025 by the authors. Licensee MDPI, Basel, Switzerland. This article is an open access article distributed under the terms and conditions of the Creative Commons Attribution (CC BY) license (https://creativecommons.org/licenses/by/4.0/).
Share and Cite
Chang, S.; Wang, L.; Yao, L. Properties of Sunflower Straw Biochar Activated Using Potassium Hydroxide. Molecules 2025, 30, 1332. https://doi.org/10.3390/molecules30061332
Chang S, Wang L, Yao L. Properties of Sunflower Straw Biochar Activated Using Potassium Hydroxide. Molecules. 2025; 30(6):1332. https://doi.org/10.3390/molecules30061332
Chicago/Turabian StyleChang, Siyu, Lei Wang, and Lihong Yao. 2025. "Properties of Sunflower Straw Biochar Activated Using Potassium Hydroxide" Molecules 30, no. 6: 1332. https://doi.org/10.3390/molecules30061332
APA StyleChang, S., Wang, L., & Yao, L. (2025). Properties of Sunflower Straw Biochar Activated Using Potassium Hydroxide. Molecules, 30(6), 1332. https://doi.org/10.3390/molecules30061332