Cannabidiol-Based Thiosemicarbazones: A Preliminary Study Evaluating Their Anti-Tyrosinase Properties


Abstract
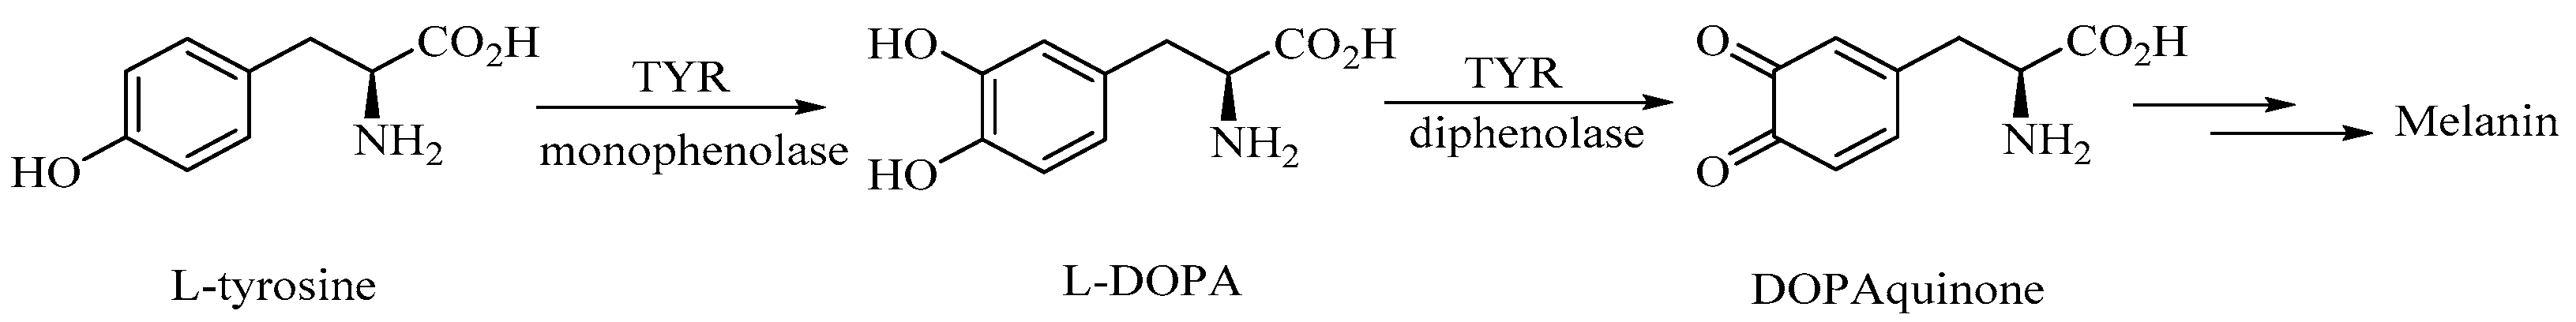
1. Introduction
2. Results
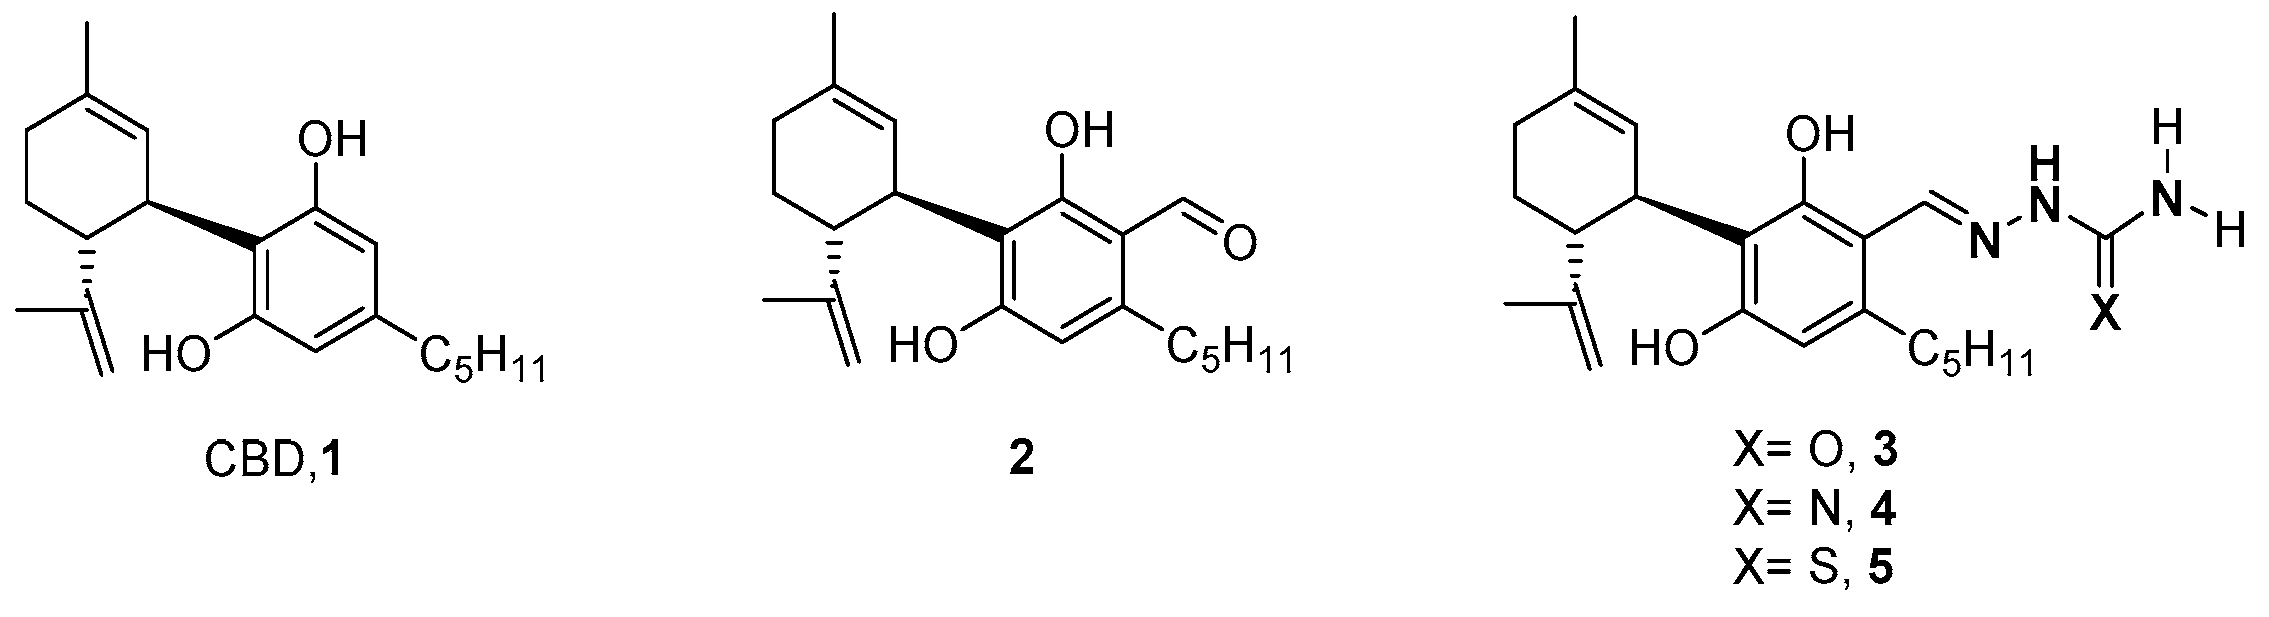
2.1. Synthesis
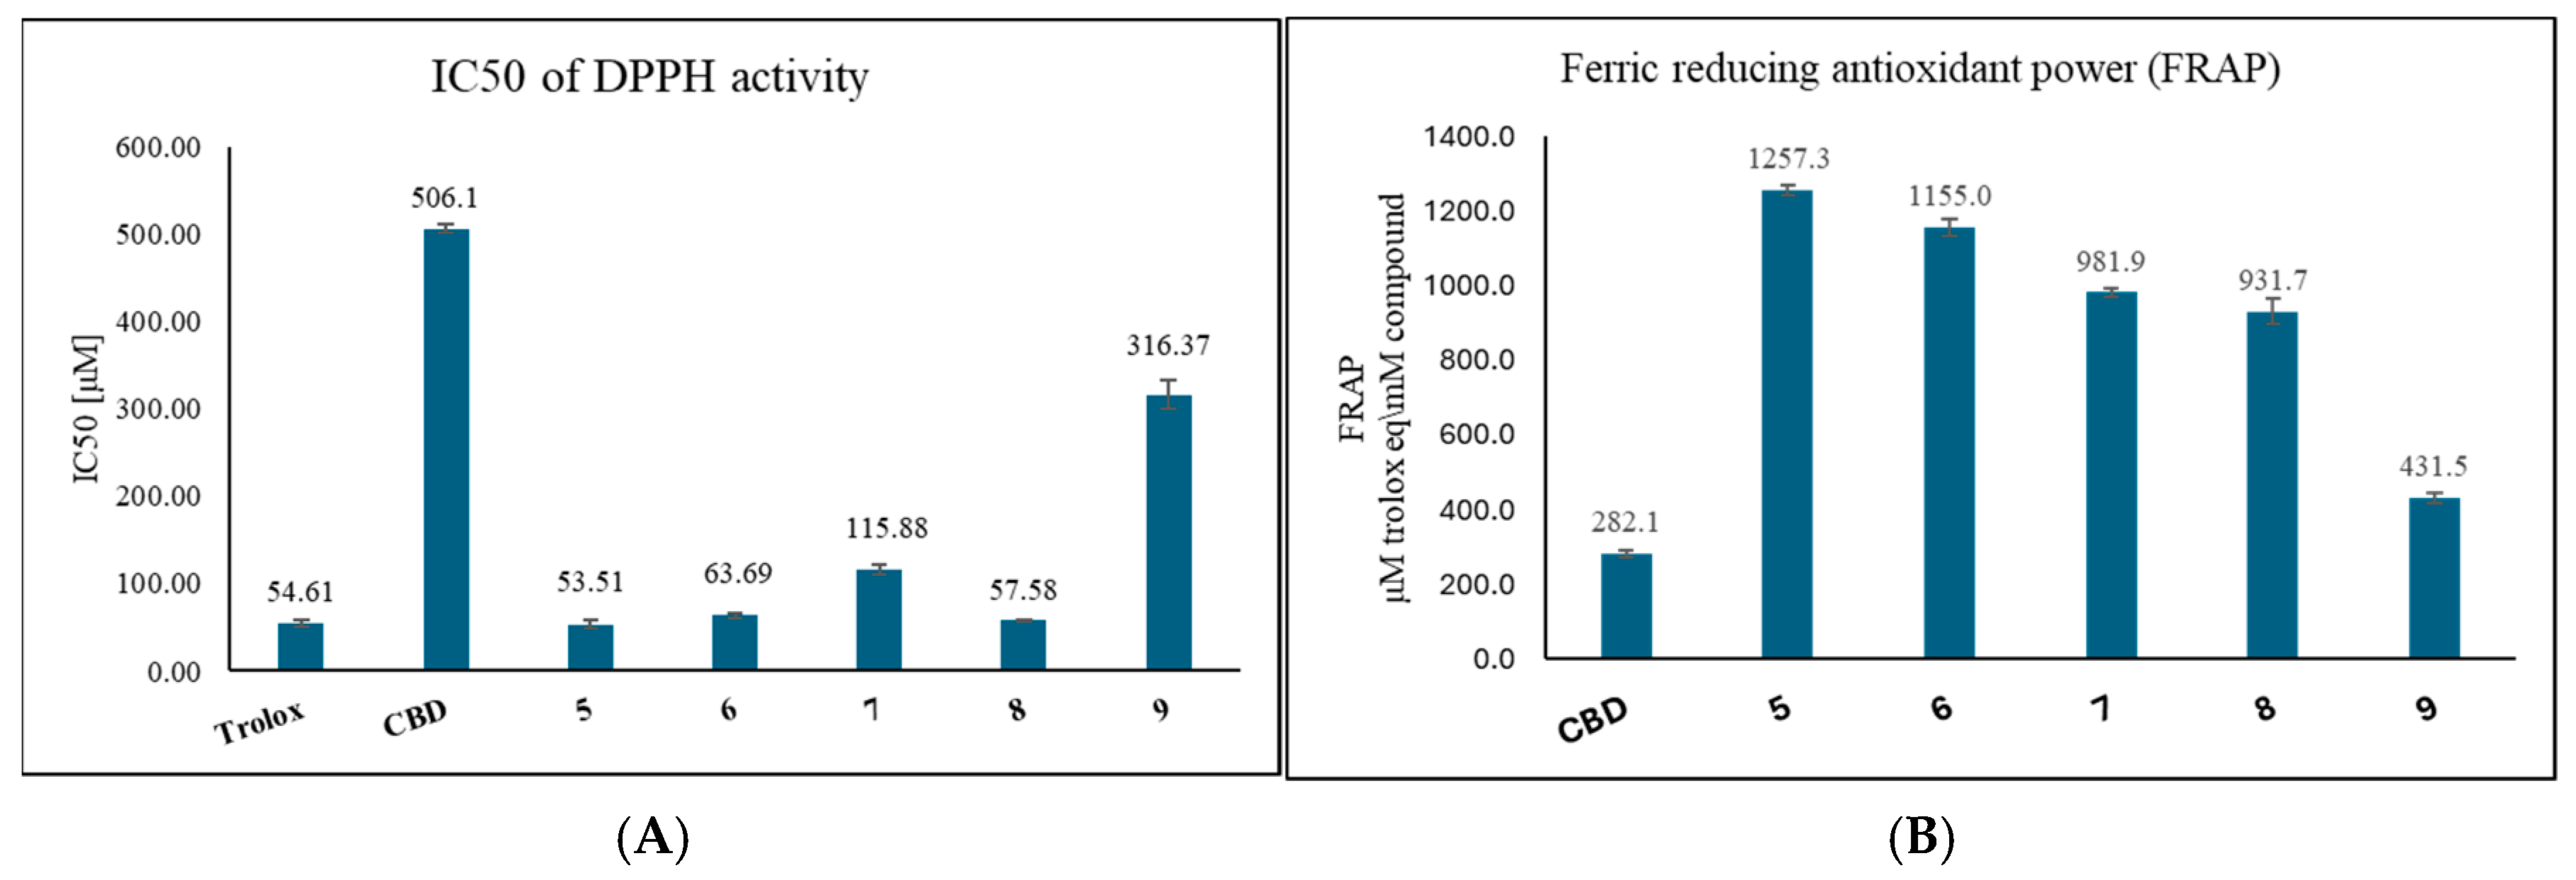
2.2. Antioxidant Activity by FRAP and DPPH Assays
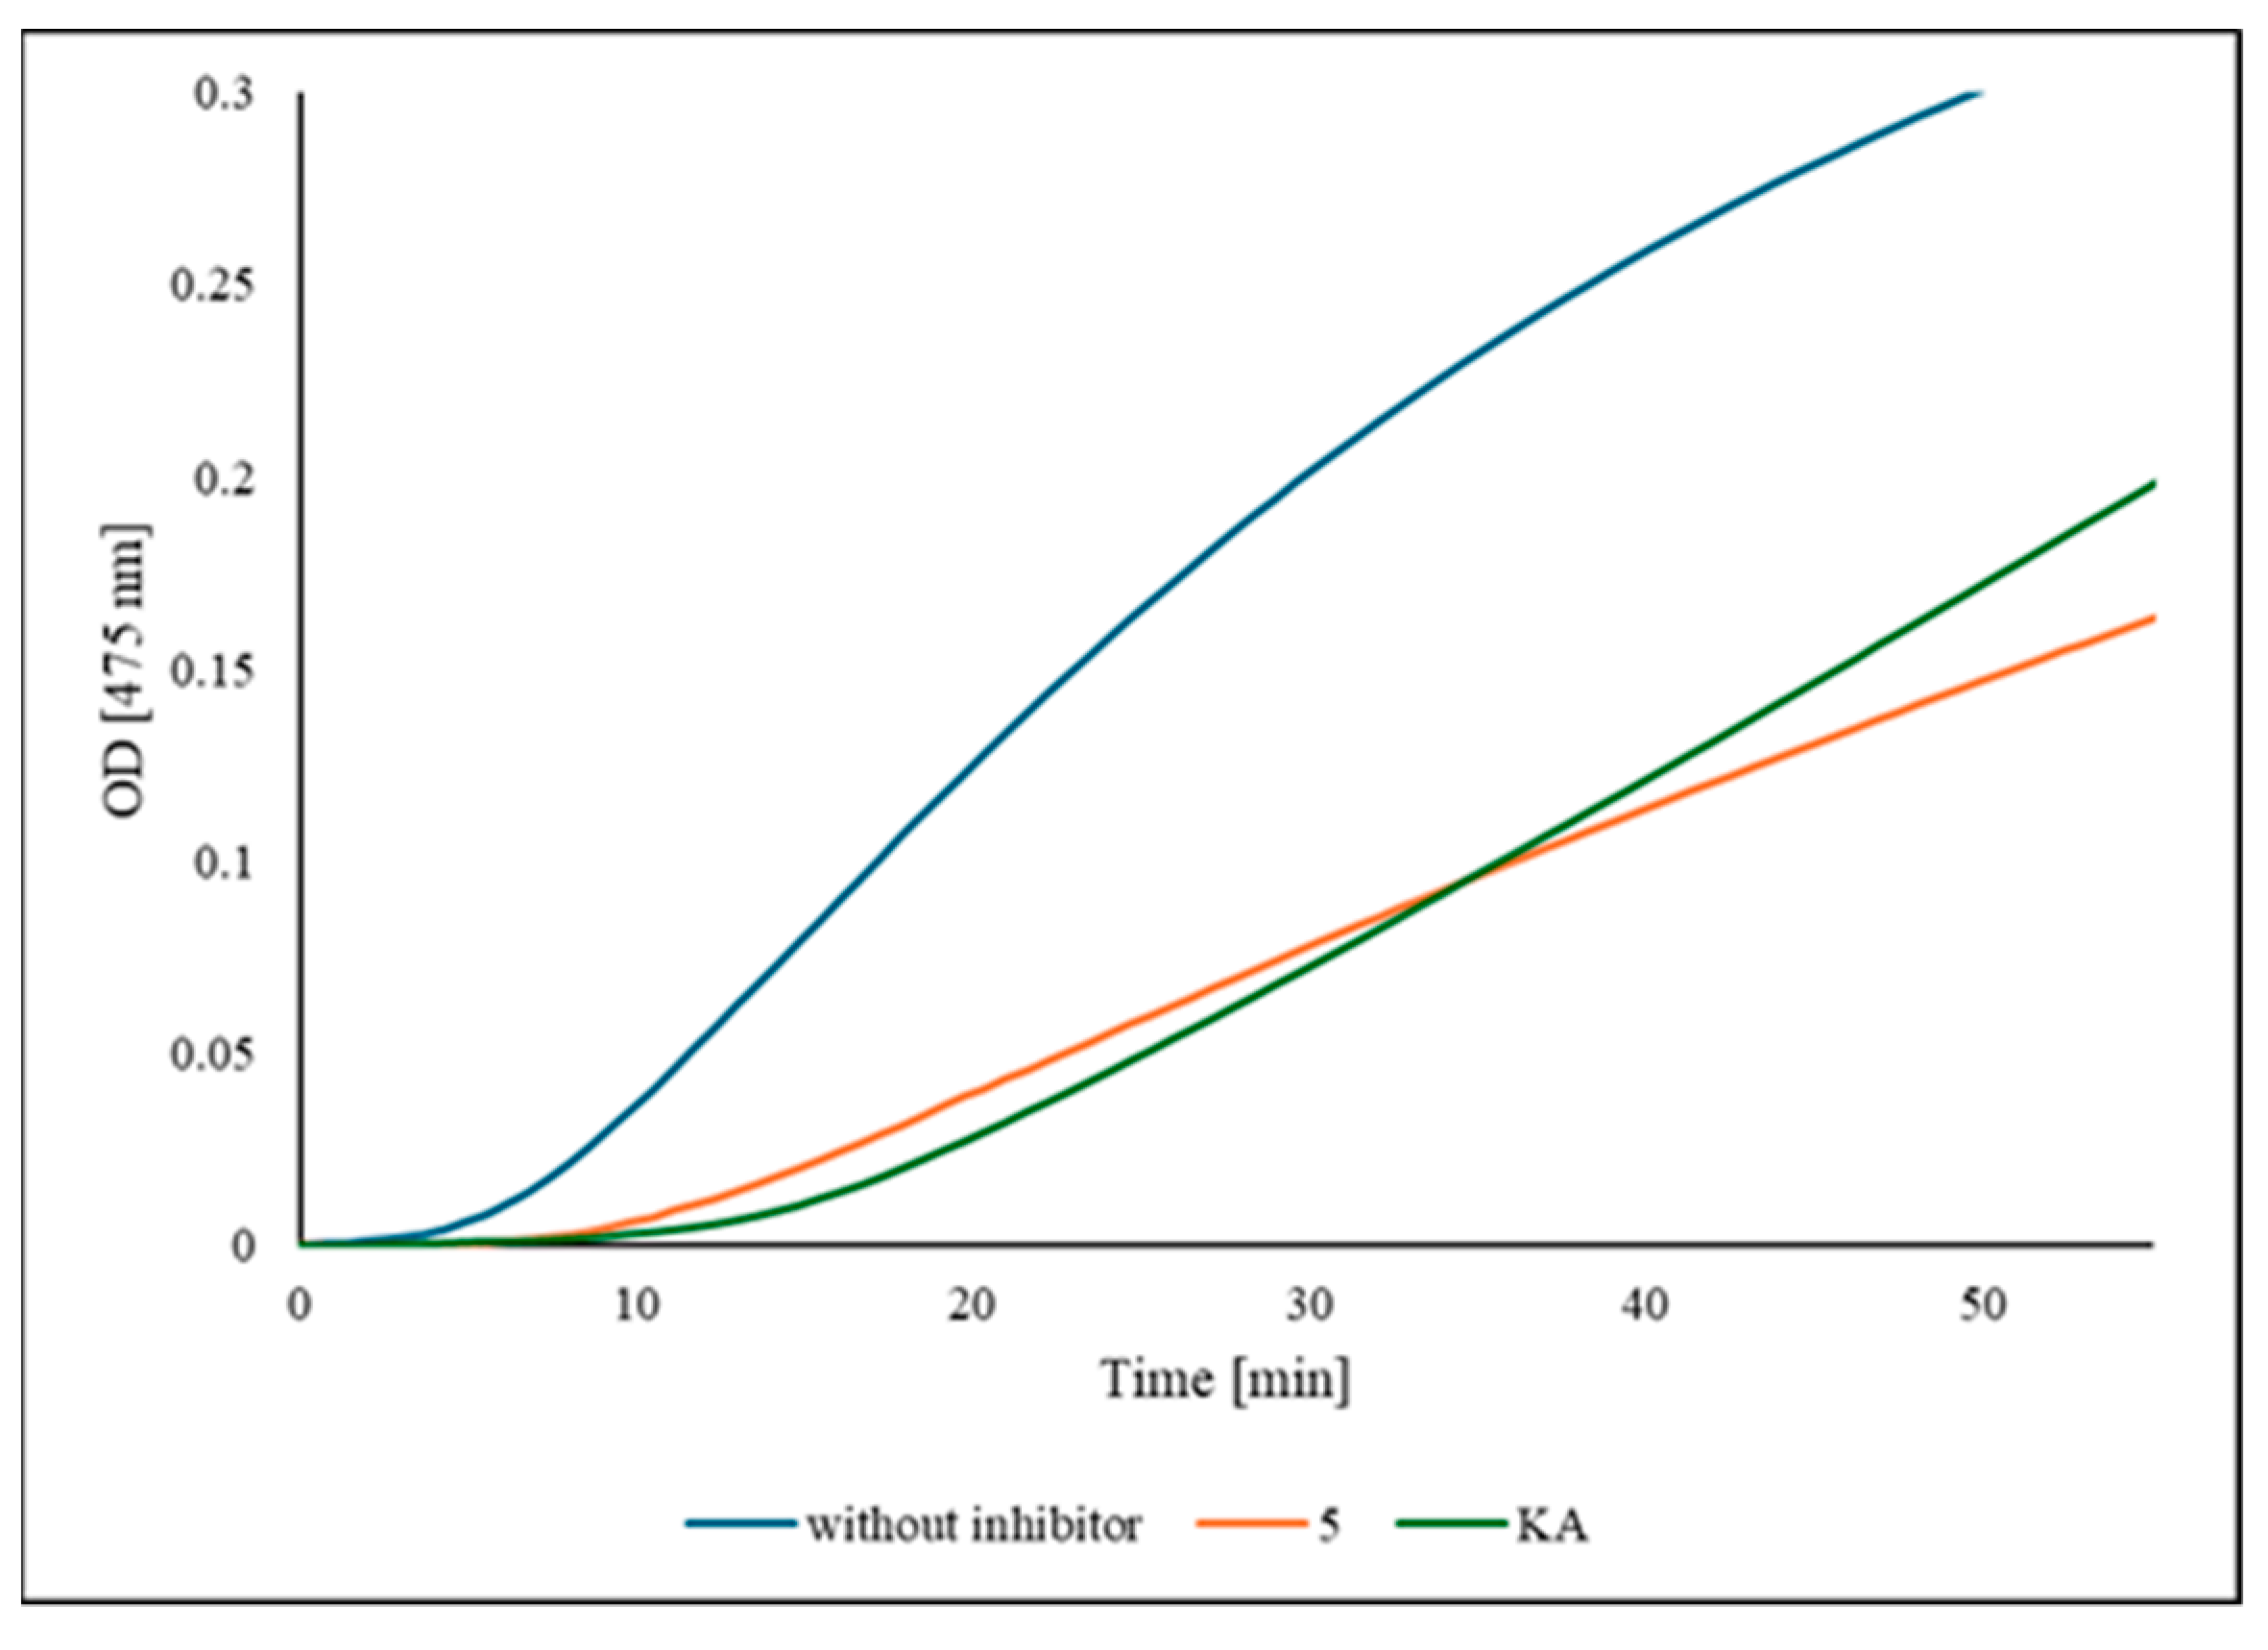
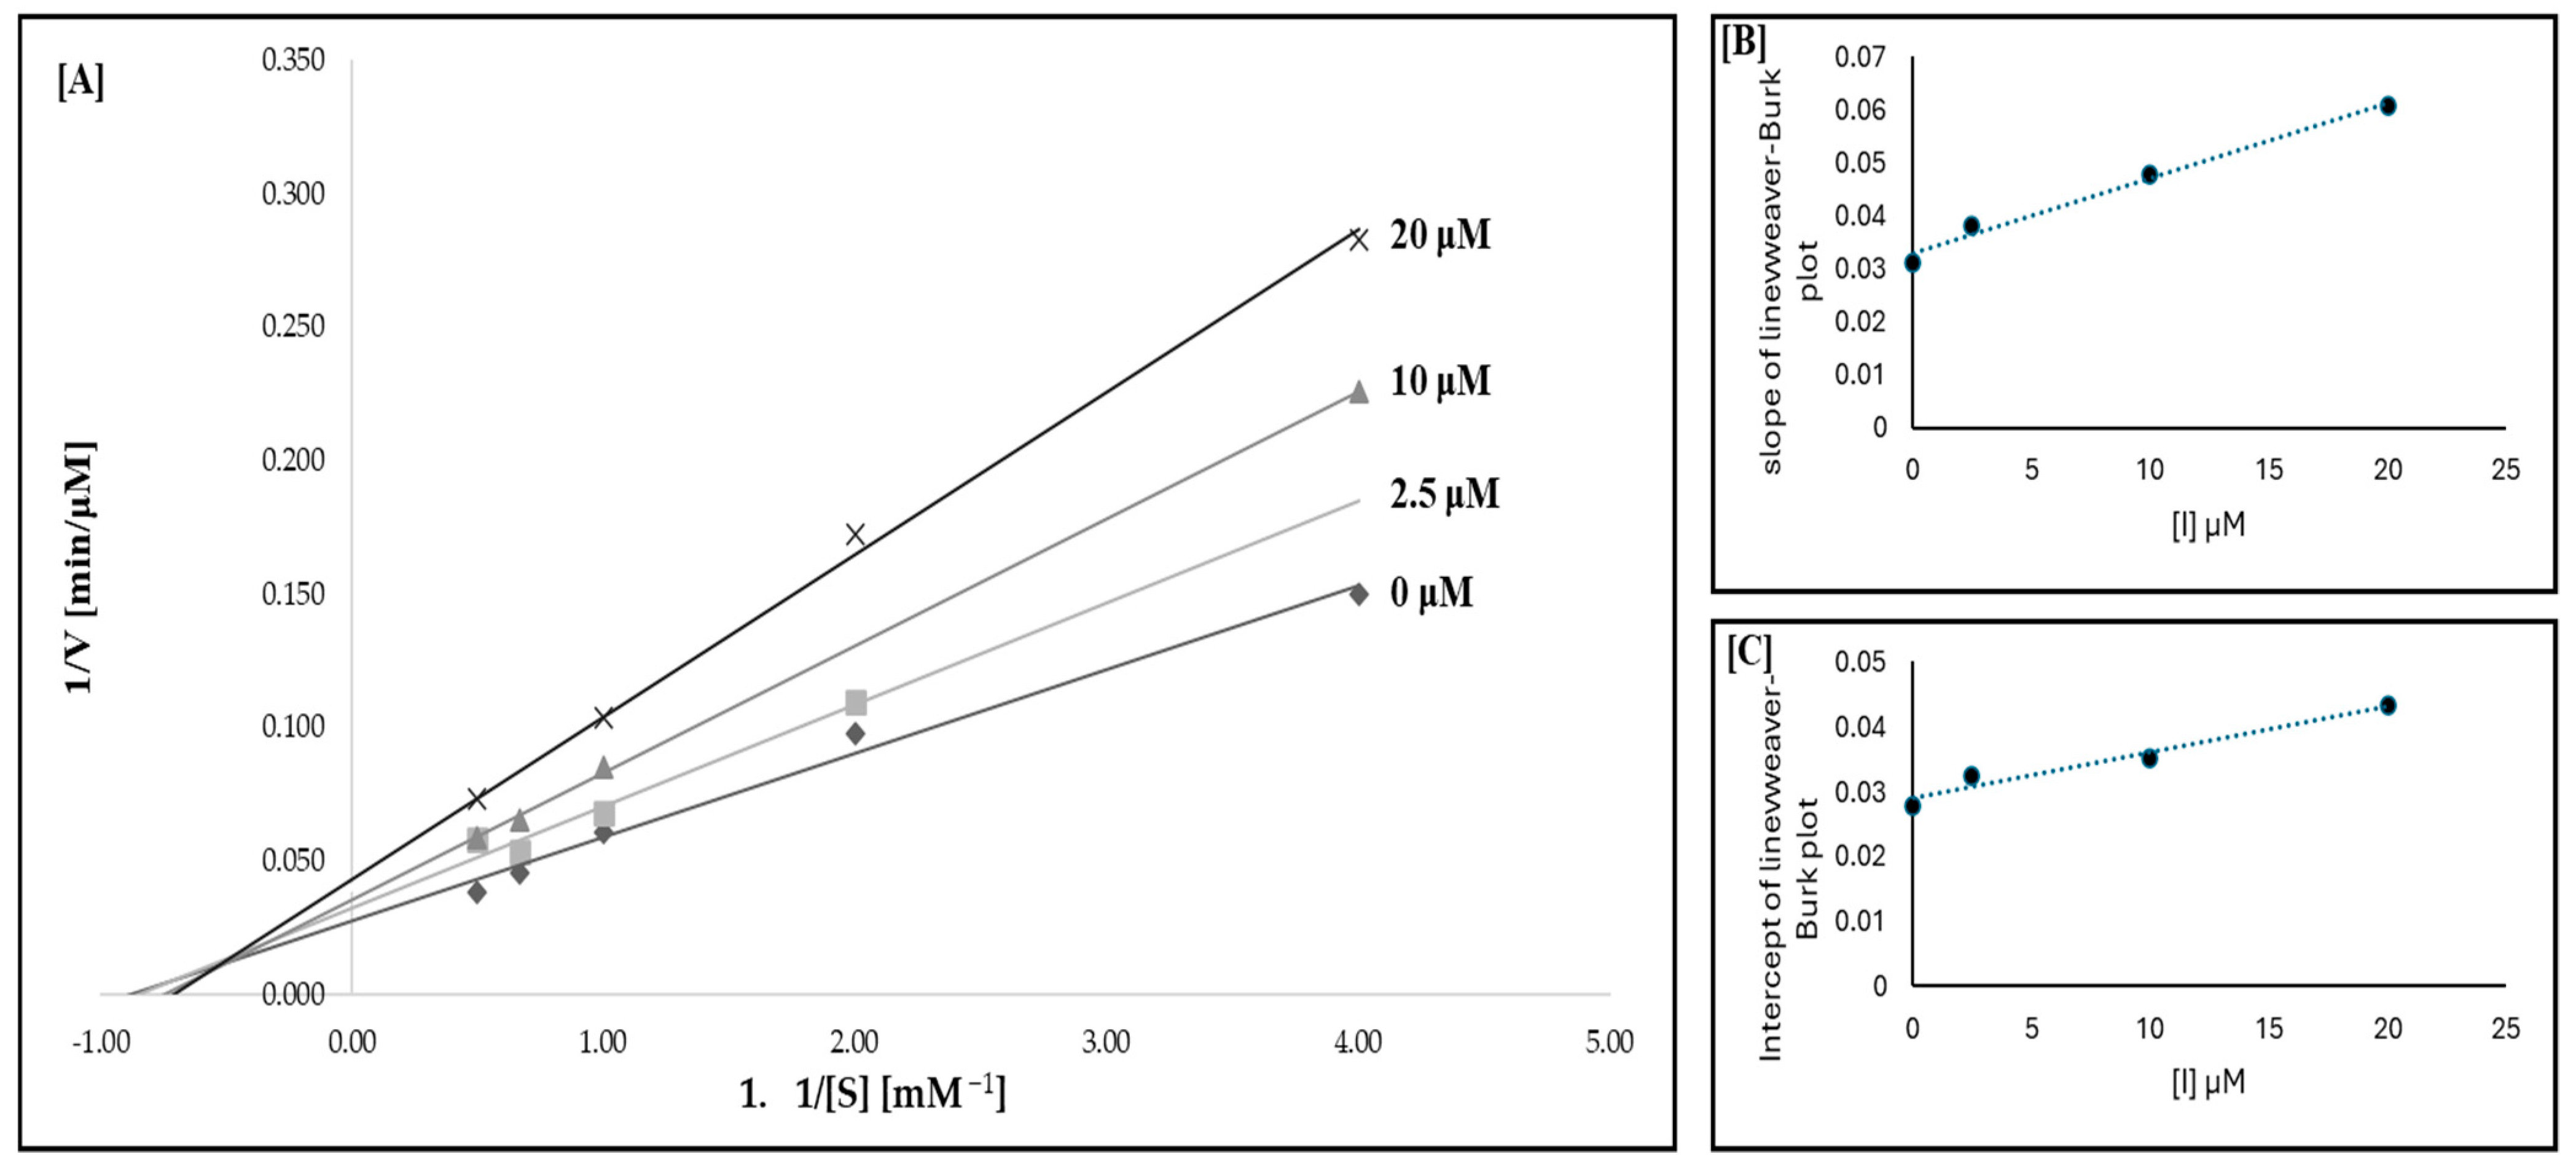
2.3. Inhibition of TYR Activity
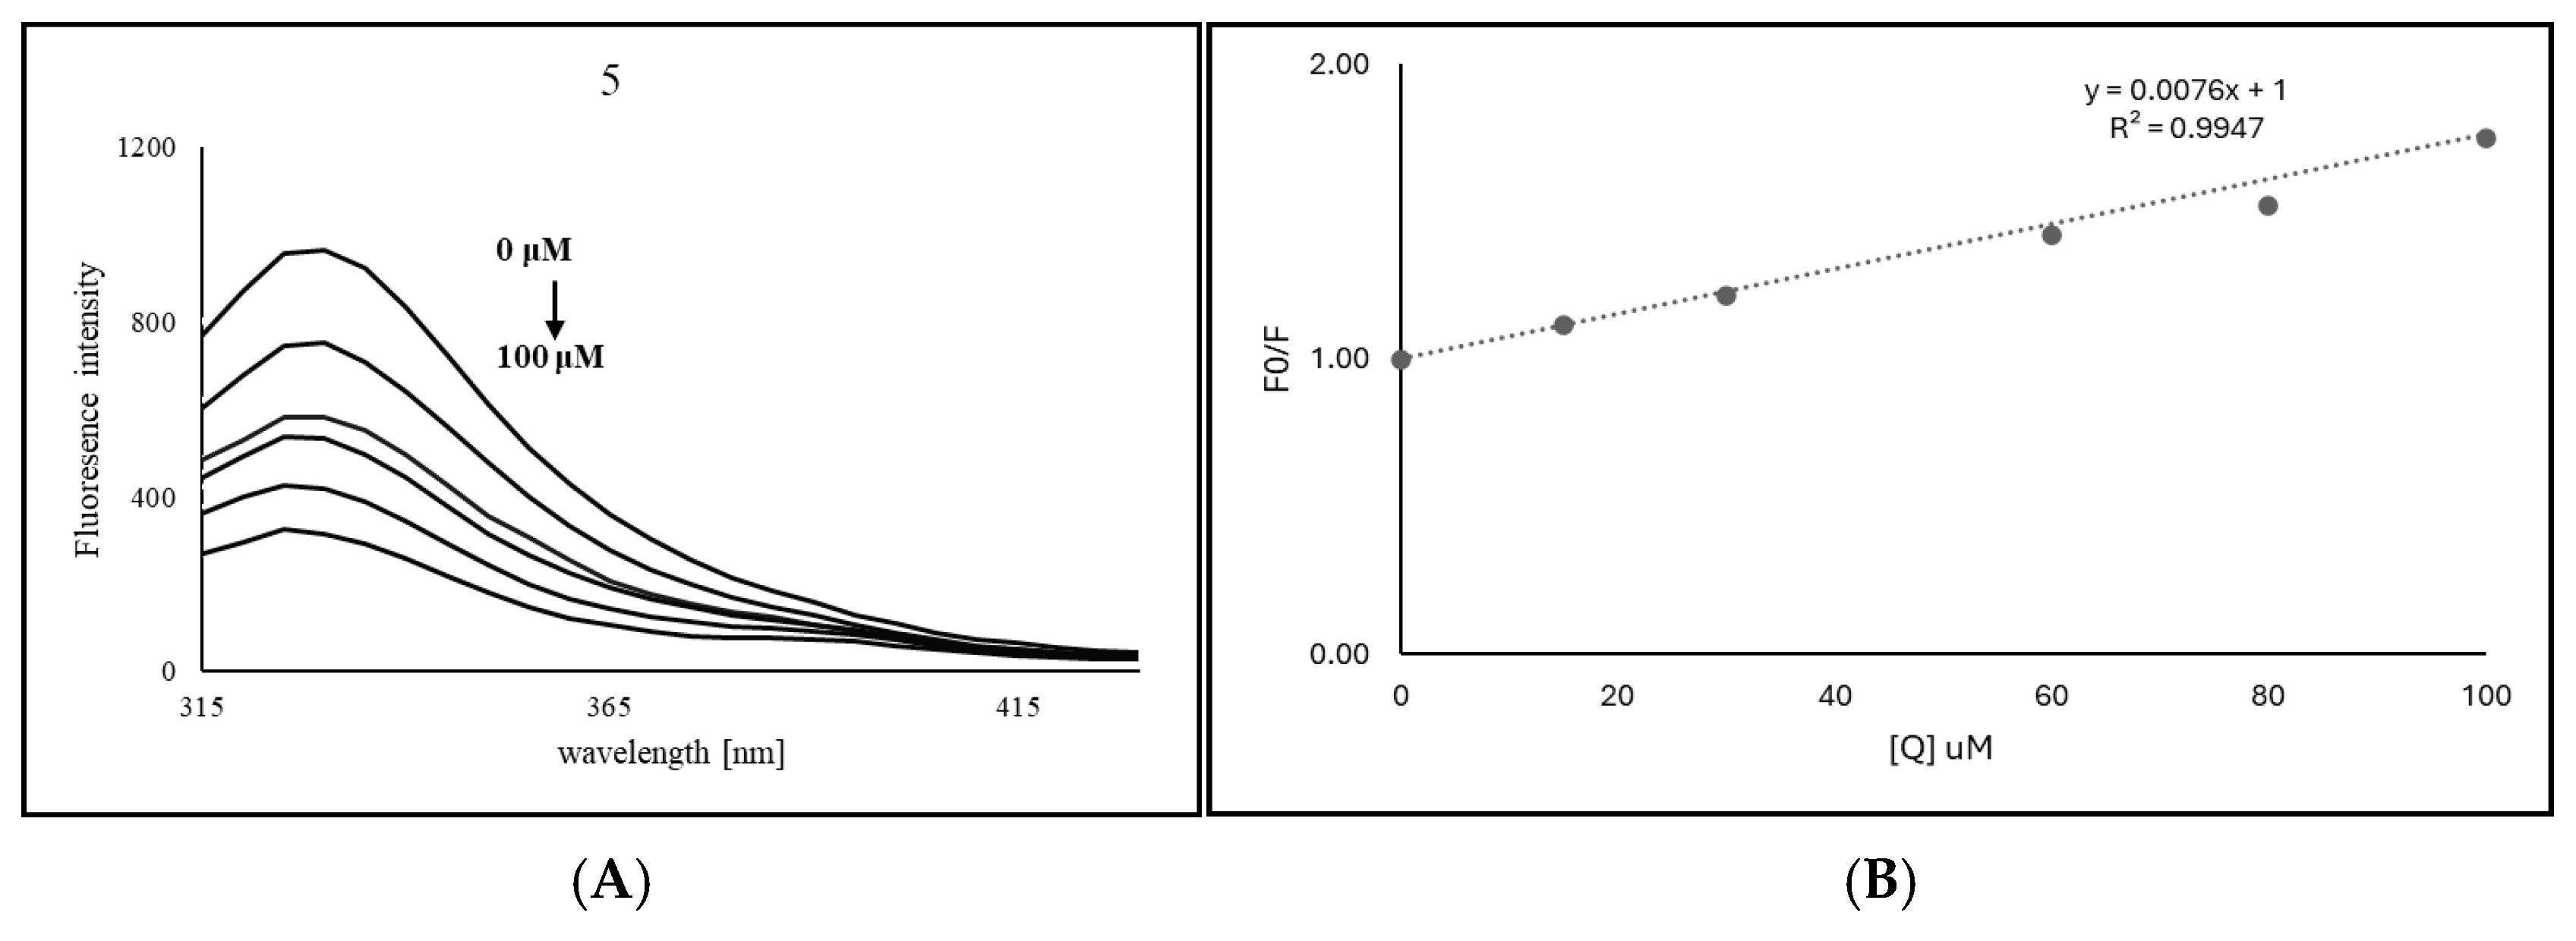
2.4. Spectrofluorometric Analysis for the Interactions Between Compound 5 and TYR
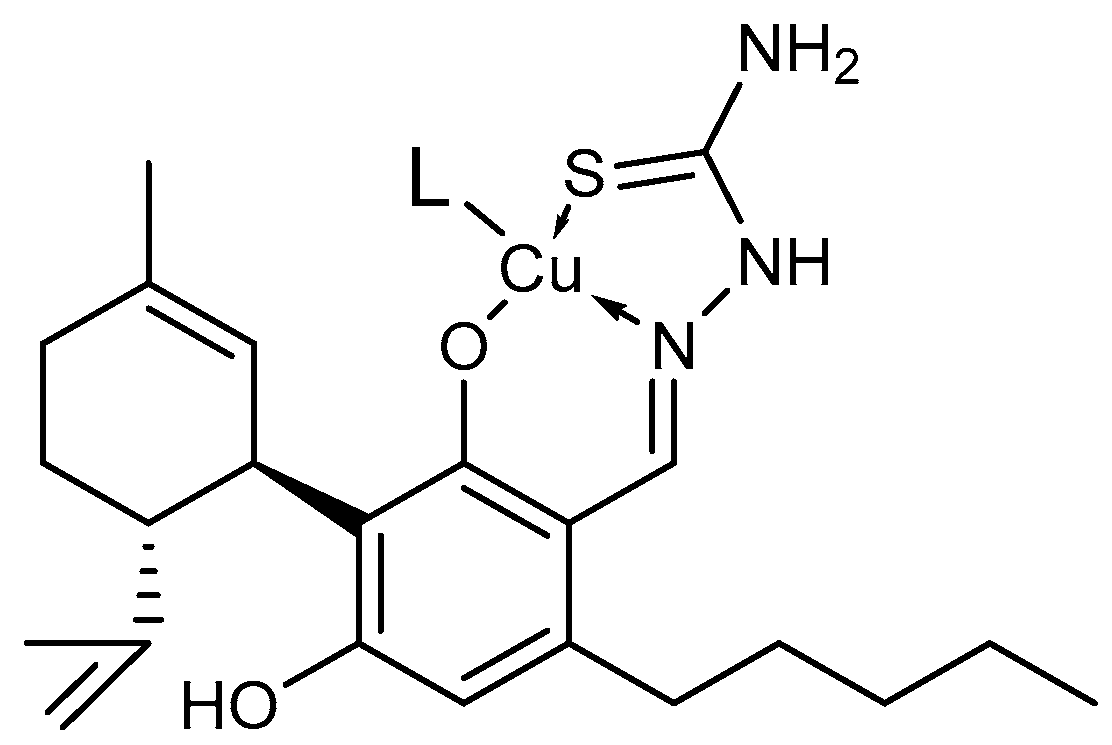
2.5. Copper Ion Chelation
3. Discussion
4. Materials and Methods
4.1. General
4.2. Preparation of 3-Formyl Cannabidiol Dimethyl Ether
4.3. General Procedure for the Synthesis of Thiosemicarbazone–Cannabidiol–Aldehyde Derivatives
4.4. Free Radical 1,1-Diphenyl-2-picryl-hydrazyl (DPPH)-Scavenging Assay
4.5. Ferric-Reducing Antioxidant Power (FRAP) Assay
4.6. Inhibition Effects of Compounds 1–9 on Mushroom TYR Assay
4.7. Inhibition Kinetics of Compound 5
4.8. Fluorescence Quenching Assay
4.9. Interaction with Copper Ions
4.10. Statistical Analysis
5. Conclusions
Supplementary Materials
Author Contributions
Funding
Institutional Review Board Statement
Informed Consent Statement
Data Availability Statement
Acknowledgments
Conflicts of Interest
References
- Curto, E.V.; Kwong, C.; Hermersdörfer, H.; Glatt, H.; Santis, C.; Virador, V.; Hearing, V.J.; Dooley, T.P. Inhibitors of mammalian melanocyte tyrosinase: In vitro comparisons of alkyl esters of gentisic acid with other putative inhibitors. Biochem. Pharmacol. 1999, 57, 663–672. [Google Scholar] [CrossRef] [PubMed]
- Rong, C.; Lee, Y.; Carmona, N.E.; Cha, D.S.; Ragguett, R.-M.; Rosenblat, J.D.; Mansur, R.B.; Ho, R.C.; McIntyre, R.S. Cannabidiol in medical marijuana: Research vistas and potential opportunities. Pharmacol. Res. 2017, 121, 213. [Google Scholar] [CrossRef] [PubMed]
- Nelson, K.M.; Bisson, J.; Singh, G.; Graham, J.G.; Chen, S.-N.; Friesen, J.B.; Dahlin, J.L.; Niemitz, M.; Walters, M.A.; Pauli, G.F. The Essential Medicinal Chemistry of Cannabidiol (CBD). J. Med. Chem. 2020, 63, 12137. [Google Scholar] [CrossRef]
- Atalay, S.; Jarocka-Karpowicz, I.; Skrzydlewska, E. Antioxidative and Anti-Inflammatory Properties of Cannabidiol. Antioxidants 2020, 9, 21. [Google Scholar] [CrossRef]
- Burstein, S. Cannabidiol (CBD) and its analogs: A review of their effects on inflammation. Bioorganic Med. Chem. 2015, 23, 1377. [Google Scholar] [CrossRef] [PubMed]
- Boggs, D.L.; Nguyen, J.D.; Morgenson, D.; Taffe, M.A.; Ranganathan, M. Clinical and Preclinical Evidence for Functional Interactions of Cannabidiol and Δ9-Tetrahydrocannabinol. Neuropsychopharmacology 2018, 43, 142–154. [Google Scholar] [CrossRef]
- Río, C.d.; Millán, E.; García, V.; Appendino, G.; DeMesa, J.; Muñoz, E. The endocannabinoid system of the skin. A potential approach for the treatment of skin disorders. Biochem. Pharmacol. 2018, 157, 122–133. [Google Scholar] [CrossRef] [PubMed]
- Di Meo, C.; Tortolani, D.; Standoli, S.; Ciaramellano, F.; Angelucci, B.C.; Tisi, A.; Kadhim, S.; Hsu, E.; Rapino, C.; Maccarrone, M. Cannabinol modulates the endocannabinoid system and shows TRPV1-mediated anti-inflammatory properties in human keratinocytes. BioFactors 2025, 51, e2122. [Google Scholar] [CrossRef]
- Kuzumi, A.; Yoshizaki-Ogawa, A.; Fukasawa, T.; Sato, S.; Yoshizaki, A. The Potential Role of Cannabidiol in Cosmetic Dermatology: A Literature Review. Am. J. Clin. Dermatol. 2024, 25, 951–966. [Google Scholar] [CrossRef]
- Shao, K.; Stewart, C.; Grant-Kels, J.M. Cannabis and the skin. Clin. Dermatol. 2021, 39, 784. [Google Scholar] [CrossRef]
- Sánchez-Ferrer, Á.; Neptuno Rodríguez-López, J.; García-Cánovas, F.; García-Carmona, F. Tyrosinase: A comprehensive review of its mechanism. Biochim. Biophys. Acta (BBA)-Protein Struct. Mol. Enzymol. 1995, 1247, 1–11. [Google Scholar] [CrossRef]
- Hearing, V.J.; Ekel, T.M.; Montague, P.M.; Nicholson, J.M. Mammalin tyrosinase. Stoichiometry and measurement of reaction products. Biochim. Biophys. Acta (BBA)-Enzymol. 1980, 611, 251–268. [Google Scholar] [CrossRef]
- Ghasemiyeh, P.; Fazlinejad, R.; Kiafar, M.R.; Rasekh, S.; Mokhtarzadegan, M.; Mohammadi-Samani, S. Different therapeutic approaches in melasma: Advances and limitations. Front. Pharmacol. 2024, 15, 1337282. [Google Scholar] [CrossRef] [PubMed]
- Yang, Y.; Wu, Y.; Xiang, L.; Picardo, M.; Zhang, C. Deciphering the role of skin aging in pigmentary disorders. Free Radic. Biol. Med. 2025, 227, 638–655. [Google Scholar] [CrossRef]
- Chaowattanapanit, S.; Silpa-archa, N.; Kohli, I.; Lim, H.W.; Hamzavi, I. Postinflammatory hyperpigmentation: A comprehensive overview: Treatment options and prevention. J. Am. Acad. Dermatol. 2017, 77, 607–621. [Google Scholar] [CrossRef]
- Nagatsu, T.; Nakashima, A.; Watanabe, H.; Ito, S.; Wakamatsu, K. Neuromelanin in Parkinson’s Disease: Tyrosine Hydroxylase and Tyrosinase. Int. J. Mol. Sci. 2022, 23, 4176. [Google Scholar] [CrossRef]
- Jin, W.; Stehbens, S.J.; Barnard, R.T.; Blaskovich, M.A.T.; Ziora, Z.M. Dysregulation of tyrosinase activity: A potential link between skin disorders and neurodegeneration. J. Pharm. Pharmacol. 2024, 76, 13–22. [Google Scholar] [CrossRef]
- Phasha, V.; Senabe, J.; Ndzotoyi, P.; Okole, B.; Fouche, G.; Chuturgoon, A. Review on the Use of Kojic Acid—A Skin-Lightening Ingredient. Cosmetics 2022, 9, 64. [Google Scholar] [CrossRef]
- Masse, M.-O.; Duvallet, V.; Borremans, M.; Goeyens, L. Identification and quantitative analysis of kojic acid and arbutine in skin-whitening cosmetics. Int. J. Cosmet. Sci. 2001, 23, 219–232. [Google Scholar]
- Fabian, I.M.; Sinnathamby, E.S.; Flanagan, C.J.; Lindberg, A.; Tynes, B.; Kelkar, R.A.; Varrassi, G.; Ahmadzadeh, S.; Shekoohi, S.; Kaye, A.D. Topical Hydroquinone for Hyperpigmentation: A Narrative Review. Cureus 2023, 15, e48840. [Google Scholar]
- Abramowitz, J.; Chavin, W. Acute effects of two melanocytolytic agents, hydroquinone and β-mercaptoethanolamine, upon tyrosinase activity and cyclic nucleotide levels in murine melanomas. Chem.-Biol. Interact. 1980, 32, 195–208. [Google Scholar] [CrossRef] [PubMed]
- Westerhof, W.; Kooyers, T.J. Hydroquinone and its analogues in dermatology—A potential health risk. J. Cosmet. Dermatol. 2005, 4, 55–59. [Google Scholar] [CrossRef] [PubMed]
- Nohynek, G.J.; Kirkland, D.; Marzin, D.; Toutain, H.; Leclerc-Ribaud, C.; Jinnai, H. An assessment of the genotoxicity and human health risk of topical use of kojic acid [5-hydroxy-2-(hydroxymethyl)-4H-pyran-4-one]. Food Chem. Toxicol. 2004, 42, 93–105. [Google Scholar] [CrossRef]
- Luz-Veiga, M.; Mendes, A.; Tavares-Valente, D.; Amorim, M.; Conde, A.; Pintado, M.E.; Moreira, H.R.; Azevedo-Silva, J.; Fernandes, J. Exploring Cannabidiol (CBD) and Cannabigerol (CBG) Safety Profile and Skincare Potential. Int. J. Mol. Sci. 2024, 25, 12224. [Google Scholar] [CrossRef] [PubMed]
- Gaweł-Bęben, K.; Czech, K.; Luca, S.V. Cannabidiol and Minor Phytocannabinoids: A Preliminary Study to Assess Their Anti-Melanoma, Anti-Melanogenic, and Anti-Tyrosinase Properties. Pharmaceuticals 2023, 16, 648. [Google Scholar] [CrossRef]
- Goenka, S. Comparative Study of Δ9-Tetrahydrocannabinol and Cannabidiol on Melanogenesis in Human Epidermal Melanocytes from Different Pigmentation Phototypes: A Pilot Study. J. Xenobiotics 2022, 12, 131–144. [Google Scholar] [CrossRef]
- Lavi, Y.; Kogan, N.M.; Topping, L.M.; Liu, C.; McCann, F.E.; Williams, R.O.; Breuer, A.; Yekhtin, Z.; Ezra, A.F.; Gallily, R.; et al. Novel Synthesis of C-Methylated Phytocannabinoids Bearing Anti-inflammatory Properties. J. Med. Chem. 2023, 66, 5536. [Google Scholar] [CrossRef]
- Shete, S.S.; Iqbal, F.; Bhardwaj, M.; Nandi, U.; Kumar, A.; Reddy, D.S. Sila-CBD Derivatives as Inhibitors of Heme-Induced NLRP3 Inflammasome: Application in Hemolytic Diseases. ACS Med. Chem. Lett. 2023, 14, 1716. [Google Scholar] [CrossRef]
- Li, H.; Liu, Y.; Tian, D.; Tian, L.; Ju, X.; Qi, L.; Wang, Y.; Liang, C. Overview of cannabidiol (CBD) and its analogues: Structures, biological activities, and neuroprotective mechanisms in epilepsy and Alzheimer’s disease. Eur. J. Med. Chem. 2020, 192, 112163. [Google Scholar] [CrossRef]
- Siawash, A.; Jung Yun, K.; Ping Shan, L.; Jeffrey, A.; Quang, H.; Peter, M. Cannabinoid Derivatives. WO2021062559A, 25 November 2020. [Google Scholar]
- Prandi, C.; Blangetti, M.; Namdar, D.; Koltai, H. Structure-Activity Relationship of Cannabis Derived Compounds for the Treatment of Neuronal Activity-Related Diseases. Molecules 2018, 23, 1526. [Google Scholar] [CrossRef]
- Wang, X.; Zhang, H.; Liu, Y.; Xu, Y.; Yang, B.; Li, H.; Chen, L. An overview on synthetic and biological activities of cannabidiol (CBD) and its derivatives. Bioorganic Chem. 2023, 140, 106810. [Google Scholar] [CrossRef] [PubMed]
- Kinney, W.A.; McDonnell, M.E.; Zhong, H.M.; Liu, C.; Yang, L.; Ling, W.; Qian, T.; Chen, Y.; Cai, Z.; Petkanas, D.; et al. Discovery of KLS-13019, a Cannabidiol-Derived Neuroprotective Agent, with Improved Potency, Safety, and Permeability. ACS Med. Chem. Lett. 2016, 7, 424. [Google Scholar] [CrossRef] [PubMed]
- Kogan, N.M.; Peters, M.; Mechoulam, R. Cannabinoid Quinones—A Review and Novel Observations. Molecules 2021, 26, 1761. [Google Scholar] [CrossRef]
- Yang, W.; Gong, X.; Sun, H.; Wu, C.; Suo, J.; Ji, J.; Jiang, X.; Shen, J.; He, Y.; Aisa, H.A. Discovery of a CB2 and 5-HT1A receptor dual agonist for the treatment of depression and anxiety. Eur. J. Med. Chem. 2024, 265, 116048. [Google Scholar] [CrossRef]
- Lőrincz, E.B.; Tóth, G.; Spolárics, J.; Herczeg, M.; Hodek, J.; Zupkó, I.; Minorics, R.; Ádám, D.; Oláh, A.; Zouboulis, C.C.; et al. Mannich-type modifications of (−)-cannabidiol and (−)-cannabigerol leading to new, bioactive derivatives. Sci. Rep. 2023, 13, 19618. [Google Scholar] [CrossRef] [PubMed]
- Peretz, E.; Musa, S. Design, Synthesis, and Characterization of Novel Cannabidiol-Based Derivatives with Potent Antioxidant Activities. Int. J. Mol. Sci. 2024, 25, 9579. [Google Scholar] [CrossRef]
- Hałdys, K.; Latajka, R. Thiosemicarbazones with tyrosinase inhibitory activity. MedChemComm 2019, 10, 378–389. [Google Scholar] [CrossRef]
- Soares, M.A.; Almeida, M.A.; Marins-Goulart, C.; Chaves, O.A.; Echevarria, A.; de Oliveira, M.C.C. Thiosemicarbazones as inhibitors of tyrosinase enzyme. Bioorganic Med. Chem. Lett. 2017, 27, 3546–3550. [Google Scholar] [CrossRef]
- Cabezudo, I.; Ayelen Ramallo, I.; Alonso, V.L.; Furlan, R.L.E. Effect directed synthesis of a new tyrosinase inhibitor with anti-browning activity. Food Chem. 2021, 341, 128232. [Google Scholar] [CrossRef]
- Masuri, S.; Era, B.; Pintus, F.; Cadoni, E.; Cabiddu, M.G.; Fais, A.; Pivetta, T. Hydroxylated Coumarin-Based Thiosemicarbazones as Dual Antityrosinase and Antioxidant Agents. Int. J. Mol. Sci. 2023, 24, 1678. [Google Scholar] [CrossRef]
- Zhu, T.-H.; Cao, S.-W.; Yu, Y.-Y. Synthesis, characterization and biological evaluation of paeonol thiosemicarbazone analogues as mushroom tyrosinase inhibitors. Int. J. Biol. Macromol. 2013, 62, 589–595. [Google Scholar] [CrossRef] [PubMed]
- Chen, L.-H.; Hu, Y.-H.; Song, W.; Song, K.-K.; Liu, X.; Jia, Y.-L.; Zhuang, J.-X.; Chen, Q.-X. Synthesis and Antityrosinase Mechanism of Benzaldehyde Thiosemicarbazones: Novel Tyrosinase Inhibitors. J. Agric. Food Chem. 2012, 60, 1542–1547. [Google Scholar] [CrossRef] [PubMed]
- El-Sadek, M.M.; Hassan, S.Y.; Abdelwahab, H.E.; Yacout, G.A. Synthesis of New 1,3,4-Thiadiazole and 1,2,3,4-Oxathiadiazole Derivatives from Carbohydrate Precursors and Study of Their Effect on Tyrosinase Enzyme. Molecules 2012, 17, 8378–8396. [Google Scholar] [CrossRef] [PubMed]
- Ledwoń, P.; Goldeman, W.; Hałdys, K.; Jewgiński, M.; Calamai, G.; Rossowska, J.; Papini, A.M.; Rovero, P.; Latajka, R. Tripeptides conjugated with thiosemicarbazones: New inhibitors of tyrosinase for cosmeceutical use. J. Enzym. Inhib. Med. Chem. 2023, 38, 2193676. [Google Scholar] [CrossRef]
- Wiles, D.M.; Gingras, B.A.; Suprunchuk, T. The C=S stretching vibration in the infrared spectra of some thiosemicarbazones. Can. J. Chem. 1967, 45, 469–473. [Google Scholar] [CrossRef]
- Moorthy, N.; Prabakar, P.C.J.; Ramalingam, S.; Pandian, G.V.; Anbusrinivasan, P. Vibrational, NMR and UV–visible spectroscopic investigation and NLO studies on benzaldehyde thiosemicarbazone using computational calculations. J. Phys. Chem. Solids 2016, 91, 55–68. [Google Scholar] [CrossRef]
- Brand-Williams, W.; Cuvelier, M.E.; Berset, C. Use of a free radical method to evaluate antioxidant activity. Food Sci. Technol. 1995, 28, 25. [Google Scholar] [CrossRef]
- Benzie, I.F.F.; Strain, J.J. The Ferric Reducing Ability of Plasma (FRAP) as a Measure of “Antioxidant Power”: The FRAP Assay. Anal. Biochem. 1996, 239, 70. [Google Scholar] [CrossRef]
- Wang, W.; Gao, Y.; Wang, W.; Zhang, J.; Yin, J.; Le, T.; Xue, J.; Engelhardt, U.H.; Jiang, H. Kojic Acid Showed Consistent Inhibitory Activity on Tyrosinase from Mushroom and in Cultured B16F10 Cells Compared with Arbutins. Antioxidants 2022, 11, 502. [Google Scholar] [CrossRef]
- Carcelli, M.; Rogolino, D.; Bartoli, J.; Pala, N.; Compari, C.; Ronda, N.; Bacciottini, F.; Incerti, M.; Fisicaro, E. Hydroxyphenyl thiosemicarbazones as inhibitors of mushroom tyrosinase and antibrowning agents. Food Chem. 2020, 303, 125310. [Google Scholar] [CrossRef]
- Chang, T.-S. An Updated Review of Tyrosinase Inhibitors. Int. J. Mol. Sci. 2009, 10, 2440–2475. [Google Scholar] [CrossRef]
- Choi, J.; Park, S.-J.; Jee, J.-G. Analogues of ethionamide, a drug used for multidrug-resistant tuberculosis, exhibit potent inhibition of tyrosinase. Eur. J. Med. Chem. 2015, 106, 157–166. [Google Scholar] [CrossRef] [PubMed]
- Zhang, S.; Ma, Z.; Li, Y.; Su, Y.; Ma, N.; Guo, X.; Li, L.; Liu, Q.; Wang, Z. Enhancing enantioselectivity of manganese catalyst for asymmetric transfer hydrogenation of ketones through P,N,N-chelation of a cyclooctyl pyridine. J. Catal. 2024, 437, 115682. [Google Scholar] [CrossRef]
- Masum, M.N.; Yamauchi, K.; Mitsunaga, T. Tyrosinase Inhibitors from Natural and Synthetic Sources as Skin-lightening Agents. Rev. Agric. Sci. 2019, 7, 41–58. [Google Scholar] [CrossRef]
- Baber, M.A.; Crist, C.M.; Devolve, N.L.; Patrone, J.D. Tyrosinase Inhibitors: A Perspective. Molecules 2023, 28, 5762. [Google Scholar] [CrossRef]
- Rana, M.S.; Rayhan, N.M.A.; Emon, M.S.H.; Islam, M.T.; Rathry, K.; Hasan, M.M.; Islam Mansur, M.M.; Srijon, B.C.; Islam, M.S.; Ray, A.; et al. Antioxidant activity of Schiff base ligands using the DPPH scavenging assay: An updated review. RSC Adv. 2024, 14, 33094–33123. [Google Scholar] [CrossRef] [PubMed]
- Nguyen, D.T.; Le, T.H.; Bui, T.T.T. Antioxidant activities of thiosemicarbazones from substituted benzaldehydes and N-(tetra-O-acetyl-β-d-galactopyranosyl)thiosemicarbazide. Eur. J. Med. Chem. 2013, 60, 199–207. [Google Scholar] [CrossRef]
- Oyama, T.; Yoshimori, A.; Ogawa, H.; Shirai, Y.; Abe, H.; Kamiya, T.; Tanuma, S.-i. The structural differences between mushroom and human tyrosinase cleared by investigating the inhibitory activities of stilbenes. J. Mol. Struct. 2023, 1272, 134180. [Google Scholar] [CrossRef]
- Okajima, S.; Hamamoto, A.; Asano, M.; Isogawa, K.; Ito, H.; Kato, S.; Hirata, Y.; Furuta, K.; Takemori, H. Azepine derivative T4FAT, a new copper chelator, inhibits tyrosinase. Biochem. Biophys. Res. Commun. 2019, 509, 209–215. [Google Scholar] [CrossRef]
- Yan, Q.; Cao, R.; Yi, W.; Yu, L.; Chen, Z.; Ma, L.; Song, H. Synthesis and evaluation of 5-benzylidene(thio)barbiturate-β-d-glycosides as mushroom tyrosinase inhibitors. Bioorganic Med. Chem. Lett. 2009, 19, 4055–4058. [Google Scholar] [CrossRef]
- Masters, B. Principles of Fluorescence Spectroscopy, Third Edition. J. Biomed. Opt. 2008, 13, 029901. [Google Scholar]
- Loganathan, V.; Mani, A.; Akbar, I.; Ahamed, A.; Alodaini, H.A.; Gerbu, D.G.; Manilal, A. Synthesis, antimicrobial, antioxidant, tyrosinase inhibitory activities, and computational studies of novel chromen [2,3-c]pyrazole derivatives. Mol. Divers. 2024. [Google Scholar] [CrossRef]
- Durai, P.; Ko, Y.-J.; Kim, J.-C.; Pan, C.-H.; Park, K. Identification of Tyrosinase Inhibitors and Their Structure-Activity Relationships via Evolutionary Chemical Binding Similarity and Structure-Based Methods. Molecules 2021, 26, 566. [Google Scholar] [CrossRef]
- Chang, S.-T.; Wu, J.-H.; Wang, S.-Y.; Kang, P.-L.; Yang, N.-S.; Shyur, L.-F. Antioxidant Activity of Extracts from Acacia confusa Bark and Heartwood. J. Agric. Food Chem. 2001, 49, 3420. [Google Scholar] [CrossRef]
- Johnson, K.A.; Goody, R.S. The Original Michaelis Constant: Translation of the 1913 Michaelis–Menten Paper. Biochemistry 2011, 50, 8264–8269. [Google Scholar] [CrossRef] [PubMed]
- Michaelis, L.; Menten, M.L. Die kinetik der invertinwirkung. Biochem. Z. 1913, 49, 333–369. [Google Scholar]
- Lineweaver, H.; Burk, D. The Determination of Enzyme Dissociation Constants. J. Am. Chem. Soc. 1934, 56, 658–666. [Google Scholar] [CrossRef]
- Ma, D.; Tu, Z.-C.; Wang, H.; Zhang, L.; He, N.; McClements, D.J. Mechanism and kinetics of tyrosinase inhibition by glycolic acid: A study using conventional spectroscopy methods and hydrogen/deuterium exchange coupling with mass spectrometry. Food Funct. 2017, 8, 122–131. [Google Scholar] [CrossRef] [PubMed]
- Xie, M.-X.; Xu, X.-Y.; Wang, Y.-D. Interaction between hesperetin and human serum albumin revealed by spectroscopic methods. Biochim. Biophys. Acta (BBA)-Gen. Subj. 2005, 1724, 215–224. [Google Scholar] [CrossRef] [PubMed]
- Liu, H.-J.; Ji, S.; Fan, Y.-Q.; Yan, L.; Yang, J.-M.; Zhou, H.-M.; Lee, J.; Wang, Y.-L. The Effect of D-(−)-arabinose on Tyrosinase: An Integrated Study Using Computational Simulation and Inhibition Kinetics. Enzym. Res. 2012, 2012, 731427. [Google Scholar] [CrossRef]
- Yan, J.; Zhang, G.; Pan, J.; Wang, Y. α-Glucosidase inhibition by luteolin: Kinetics, interaction and molecular docking. Int. J. Biol. Macromol. 2014, 64, 213–223. [Google Scholar] [CrossRef]


| Compound | IC50 [μM] |
|---|---|
| 1 | >100 |
| 2 | >100 |
| 3 | >100 |
| 4 | >100 |
| 5 | 27.72 ± 1.84 |
| 6 | 29.38 ± 2.22 |
| 7 | 28.07 ± 1.82 |
| 8 | 42.16 ± 3.52 |
| 9 | 22.41 ± 2.90 |
| KA | 35.33 ± 1.54 |
| Compound | Lag Time [min] |
|---|---|
| without inhibitor | 4.40 ± 0.04 |
| 5 | 9.89 ± 0.66 |
| 6 | 6.06 ± 0.11 |
| 7 | 6.19 ± 0.27 |
| 8 | 4.58 ± 0.04 |
| 9 | 6.67 ± 0.17 |
| KA | 11.31 ± 0.05 |
| Compound | Ksv (M−1) | kq (M−1·s−1) | ka (M−1) | n |
|---|---|---|---|---|
| 5 | 7.61 × 10³ | 7.61 × 10¹¹ | 1.21 × 10⁴ | 1.05 |
| 6 | 9.98 × 10³ | 9.98 × 10¹¹ | 0.87 × 10⁴ | 1.08 |
| 7 | 1.38 × 10⁴ | 1.38 × 10¹² | 0.52 × 10⁴ | 0.92 |
| 8 | 4.68 × 10⁴ | 4.68 × 10¹² | 2.55 × 10⁴ | 1.19 |
| 9 | 1.30 × 10⁴ | 1.30 × 10¹² | 1.31 × 10⁴ | 1.01 |
Disclaimer/Publisher’s Note: The statements, opinions and data contained in all publications are solely those of the individual author(s) and contributor(s) and not of MDPI and/or the editor(s). MDPI and/or the editor(s) disclaim responsibility for any injury to people or property resulting from any ideas, methods, instructions or products referred to in the content. |
© 2025 by the authors. Licensee MDPI, Basel, Switzerland. This article is an open access article distributed under the terms and conditions of the Creative Commons Attribution (CC BY) license (https://creativecommons.org/licenses/by/4.0/).
Share and Cite
Peretz, E.; Ashkenazi, N.; Musa, S. Cannabidiol-Based Thiosemicarbazones: A Preliminary Study Evaluating Their Anti-Tyrosinase Properties. Molecules 2025, 30, 1291. https://doi.org/10.3390/molecules30061291
Peretz E, Ashkenazi N, Musa S. Cannabidiol-Based Thiosemicarbazones: A Preliminary Study Evaluating Their Anti-Tyrosinase Properties. Molecules. 2025; 30(6):1291. https://doi.org/10.3390/molecules30061291
Chicago/Turabian StylePeretz, Eliav, Noa Ashkenazi, and Sanaa Musa. 2025. "Cannabidiol-Based Thiosemicarbazones: A Preliminary Study Evaluating Their Anti-Tyrosinase Properties" Molecules 30, no. 6: 1291. https://doi.org/10.3390/molecules30061291
APA StylePeretz, E., Ashkenazi, N., & Musa, S. (2025). Cannabidiol-Based Thiosemicarbazones: A Preliminary Study Evaluating Their Anti-Tyrosinase Properties. Molecules, 30(6), 1291. https://doi.org/10.3390/molecules30061291