
Evaluation and Characterization of High-Uniformity SiNx Thin Film with Controllable Refractive Index by Home-Made Cat-CVD Based on Orthogonal Experiments


Abstract
1. Introduction

| Method | Preparation Parameters | SiNx Thin Film Parameter | Advantages (√) and Disadvantages (×) |
|---|---|---|---|
| RF-MS [19] | 100 W, 1 Pa, Ar 80 sccm, N2 5 sccm, Si target, 30 min | Refractive index: 1.4–2.1; Extinction coefficient: 0.01–0.5; Deposition rate: 0.06 nm/s | √ Low temperature; √ Without H pollution; × Low deposition rate; × Poor uniformity; × Low rate of utilization of target material. |
| ALD [33] | 400 °C, 10 Torr, Bis(tertbutylamino)silane, N2 plasma 100 sccm, Ar 25 sccm, | N/Si: ~1.4, containing O and H; Refractive index: ~1.96; Density: ~2.9 g/cm3 | √ High step coverage rate; √ Low deposition temperature; √ Atomic-scale thickness control; × Low deposition rate; × High cost. |
| LPCVD [21] | 20 Pa, 830 °C, SiH2Cl2 45 sccm, NH3 180 sccm, 1620 s | N/Si: ~1.1; Density: 2.76 g/cm3; Deposition rate: 0.06 nm/s | √ SiNx film has wide spectral range; √ Close to stoichiometric Si3N4; √ Without H pollution; × Low deposition rate; × High temperature (800–1200 °C). |
| PECVD [21] | RF-power of 100 W for 2.2s, 113 Pa, 300 °C, SiH4 30 sccm, NH3 30 sccm, N2 1470 sccm, 120 s | N/Si: ~1.1; containing O and H; Density: 2.20 g/cm3; Deposition rate: 0.83 nm/s | √ Fast deposition rate; √ Low temperature; × High H content; × Irreversible plasma damage; × High cost. |
| Cat-CVD (This work) | 3 Pa, 60 °C, SiH4:NH3 = 1:20, SiH4:H2 = 1:5, 480 s | N/Si: ~0.75, containing O and H; Refractive index: 2.026; Extinction coefficient: 0.056; Uniformity: 2.97%; Deposition rate: 0.3 nm/s | √ Fast deposition rate; √ Good uniformity; √ Low temperature; √ Low cost; × Hot wire life requires frequent maintenance and replacement. |
2. Experimental Section
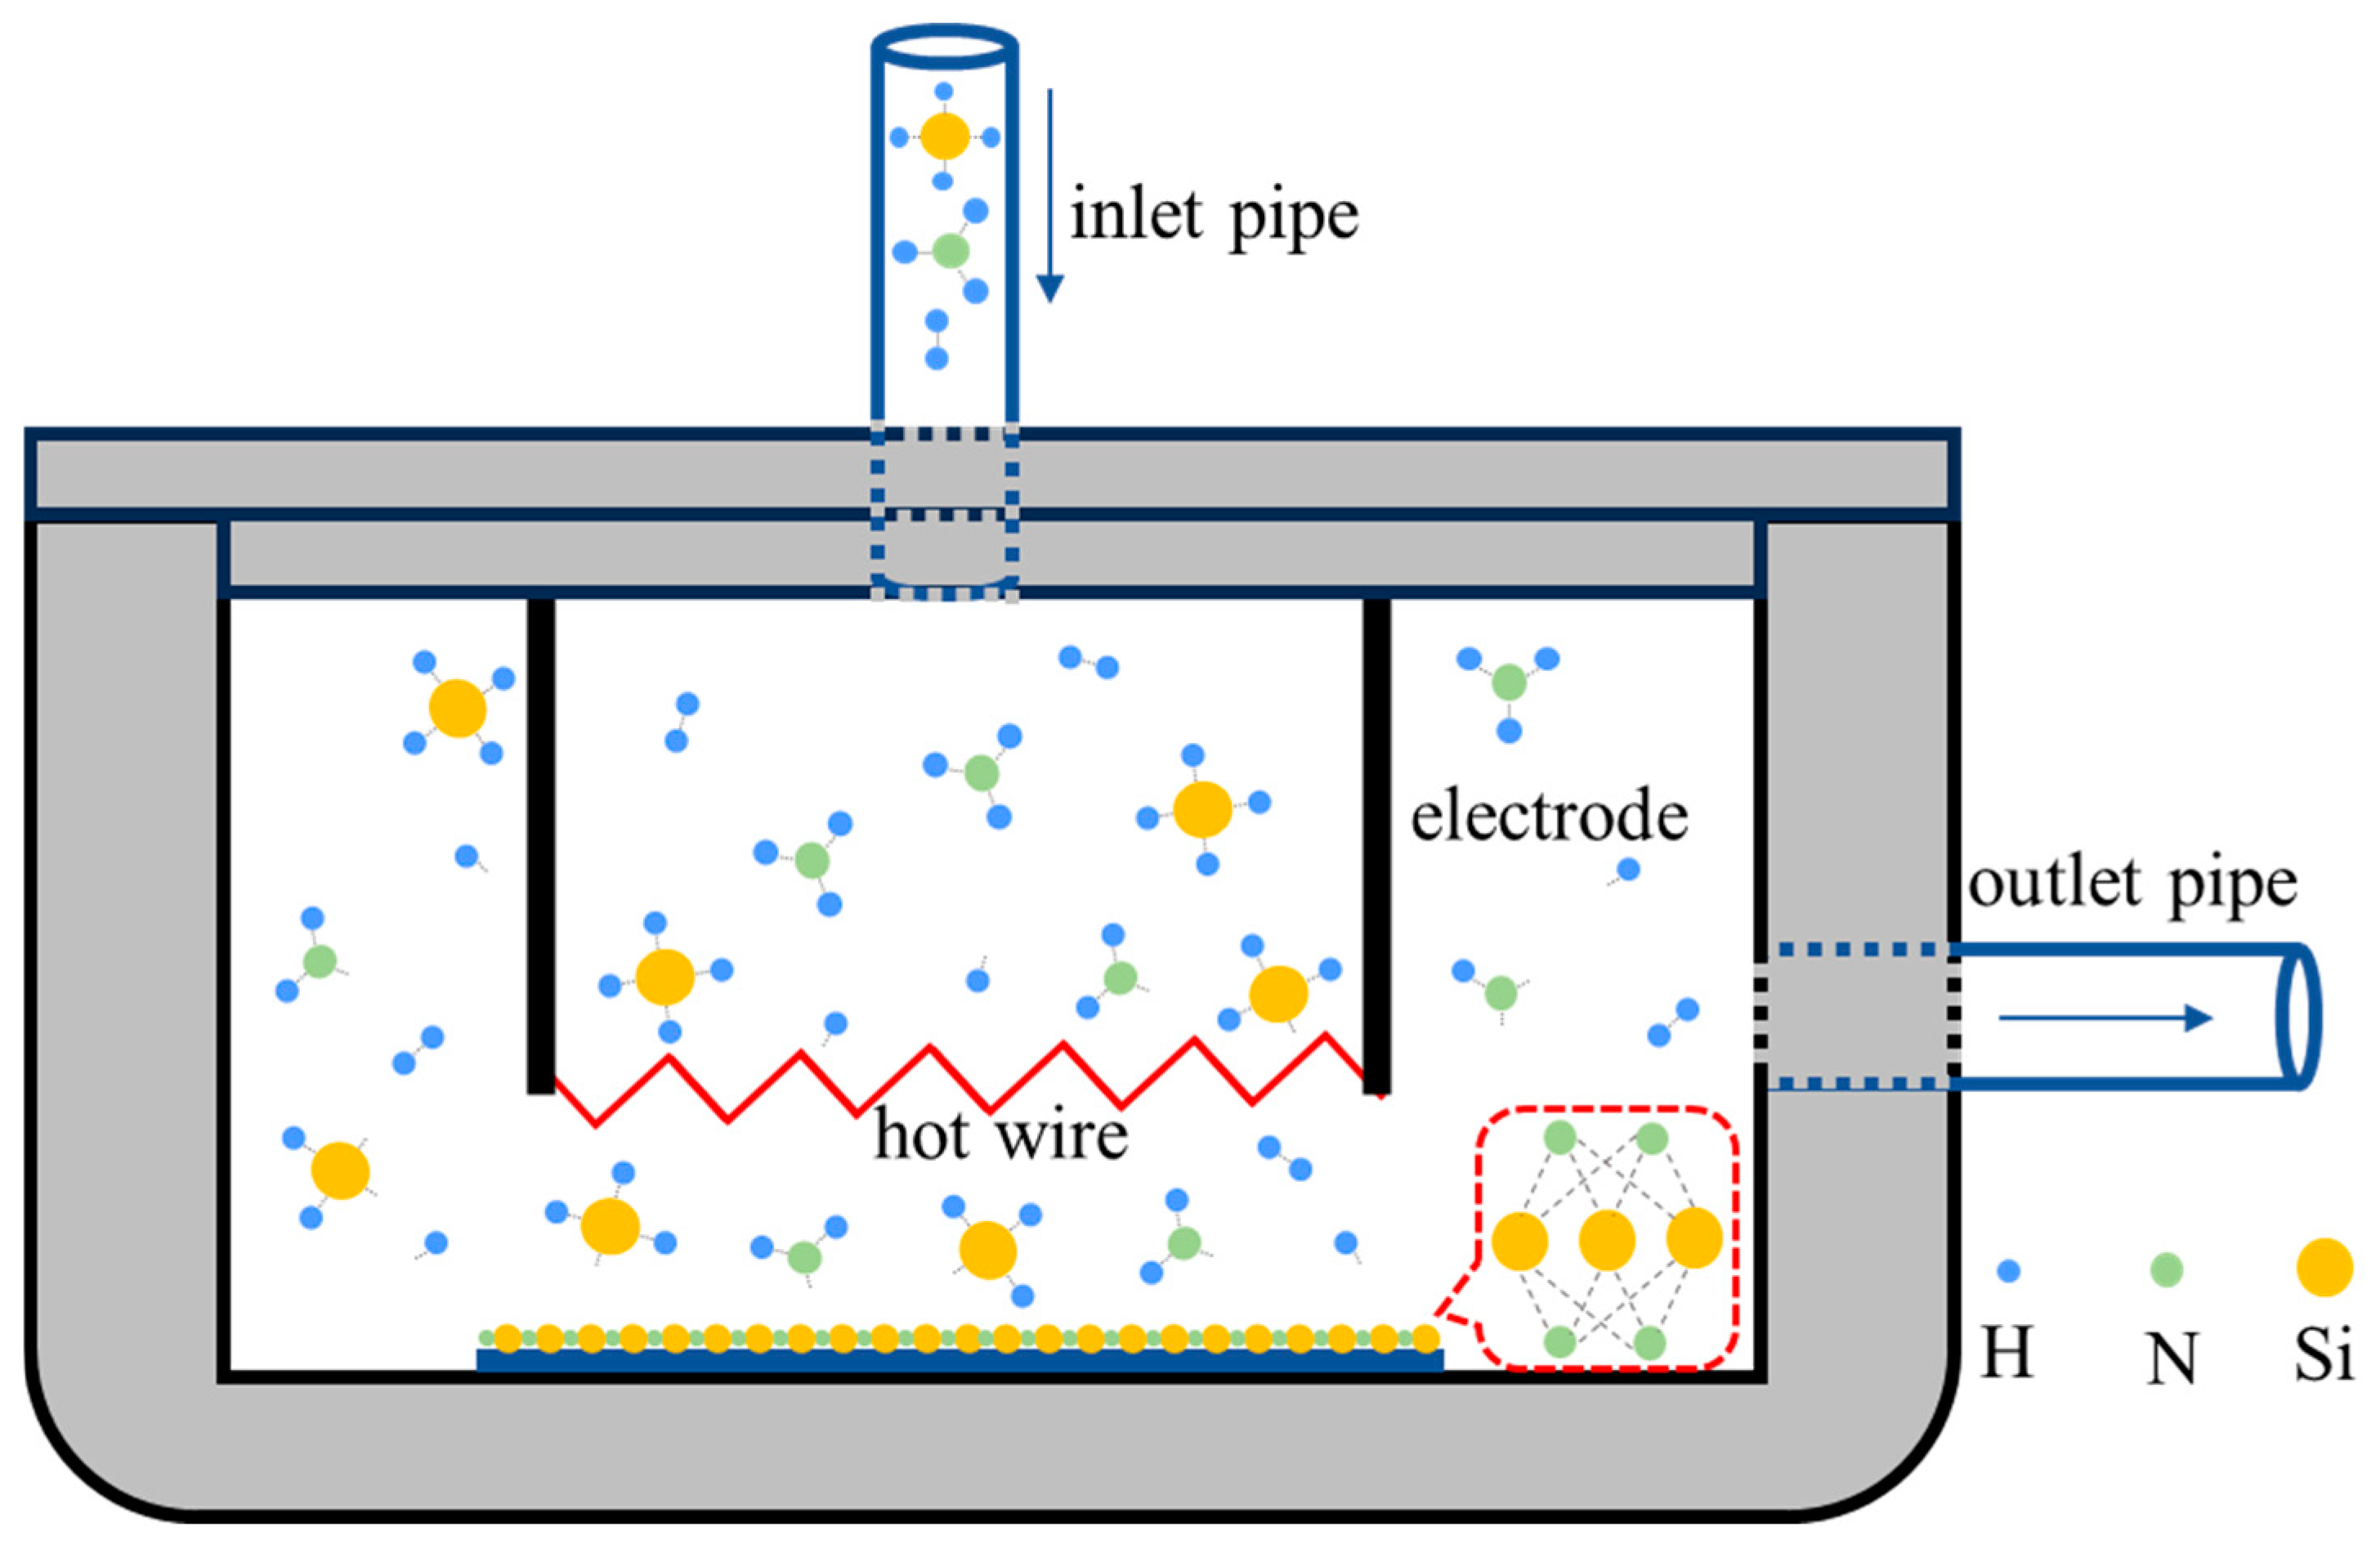
2.1. The Home-Made Cat-CVD Equipment
2.2. Orthogonal Experiment Design for Preparing SiNx Thin Film
2.3. Characterizations
2.4. Refractive Index, Extinction Coefficient, Uniformity, and Deposition Rate Tests
3. Results and Discussion
3.1. Statistical Analysis and Optimal Parameters
3.2. Characterization Analysis
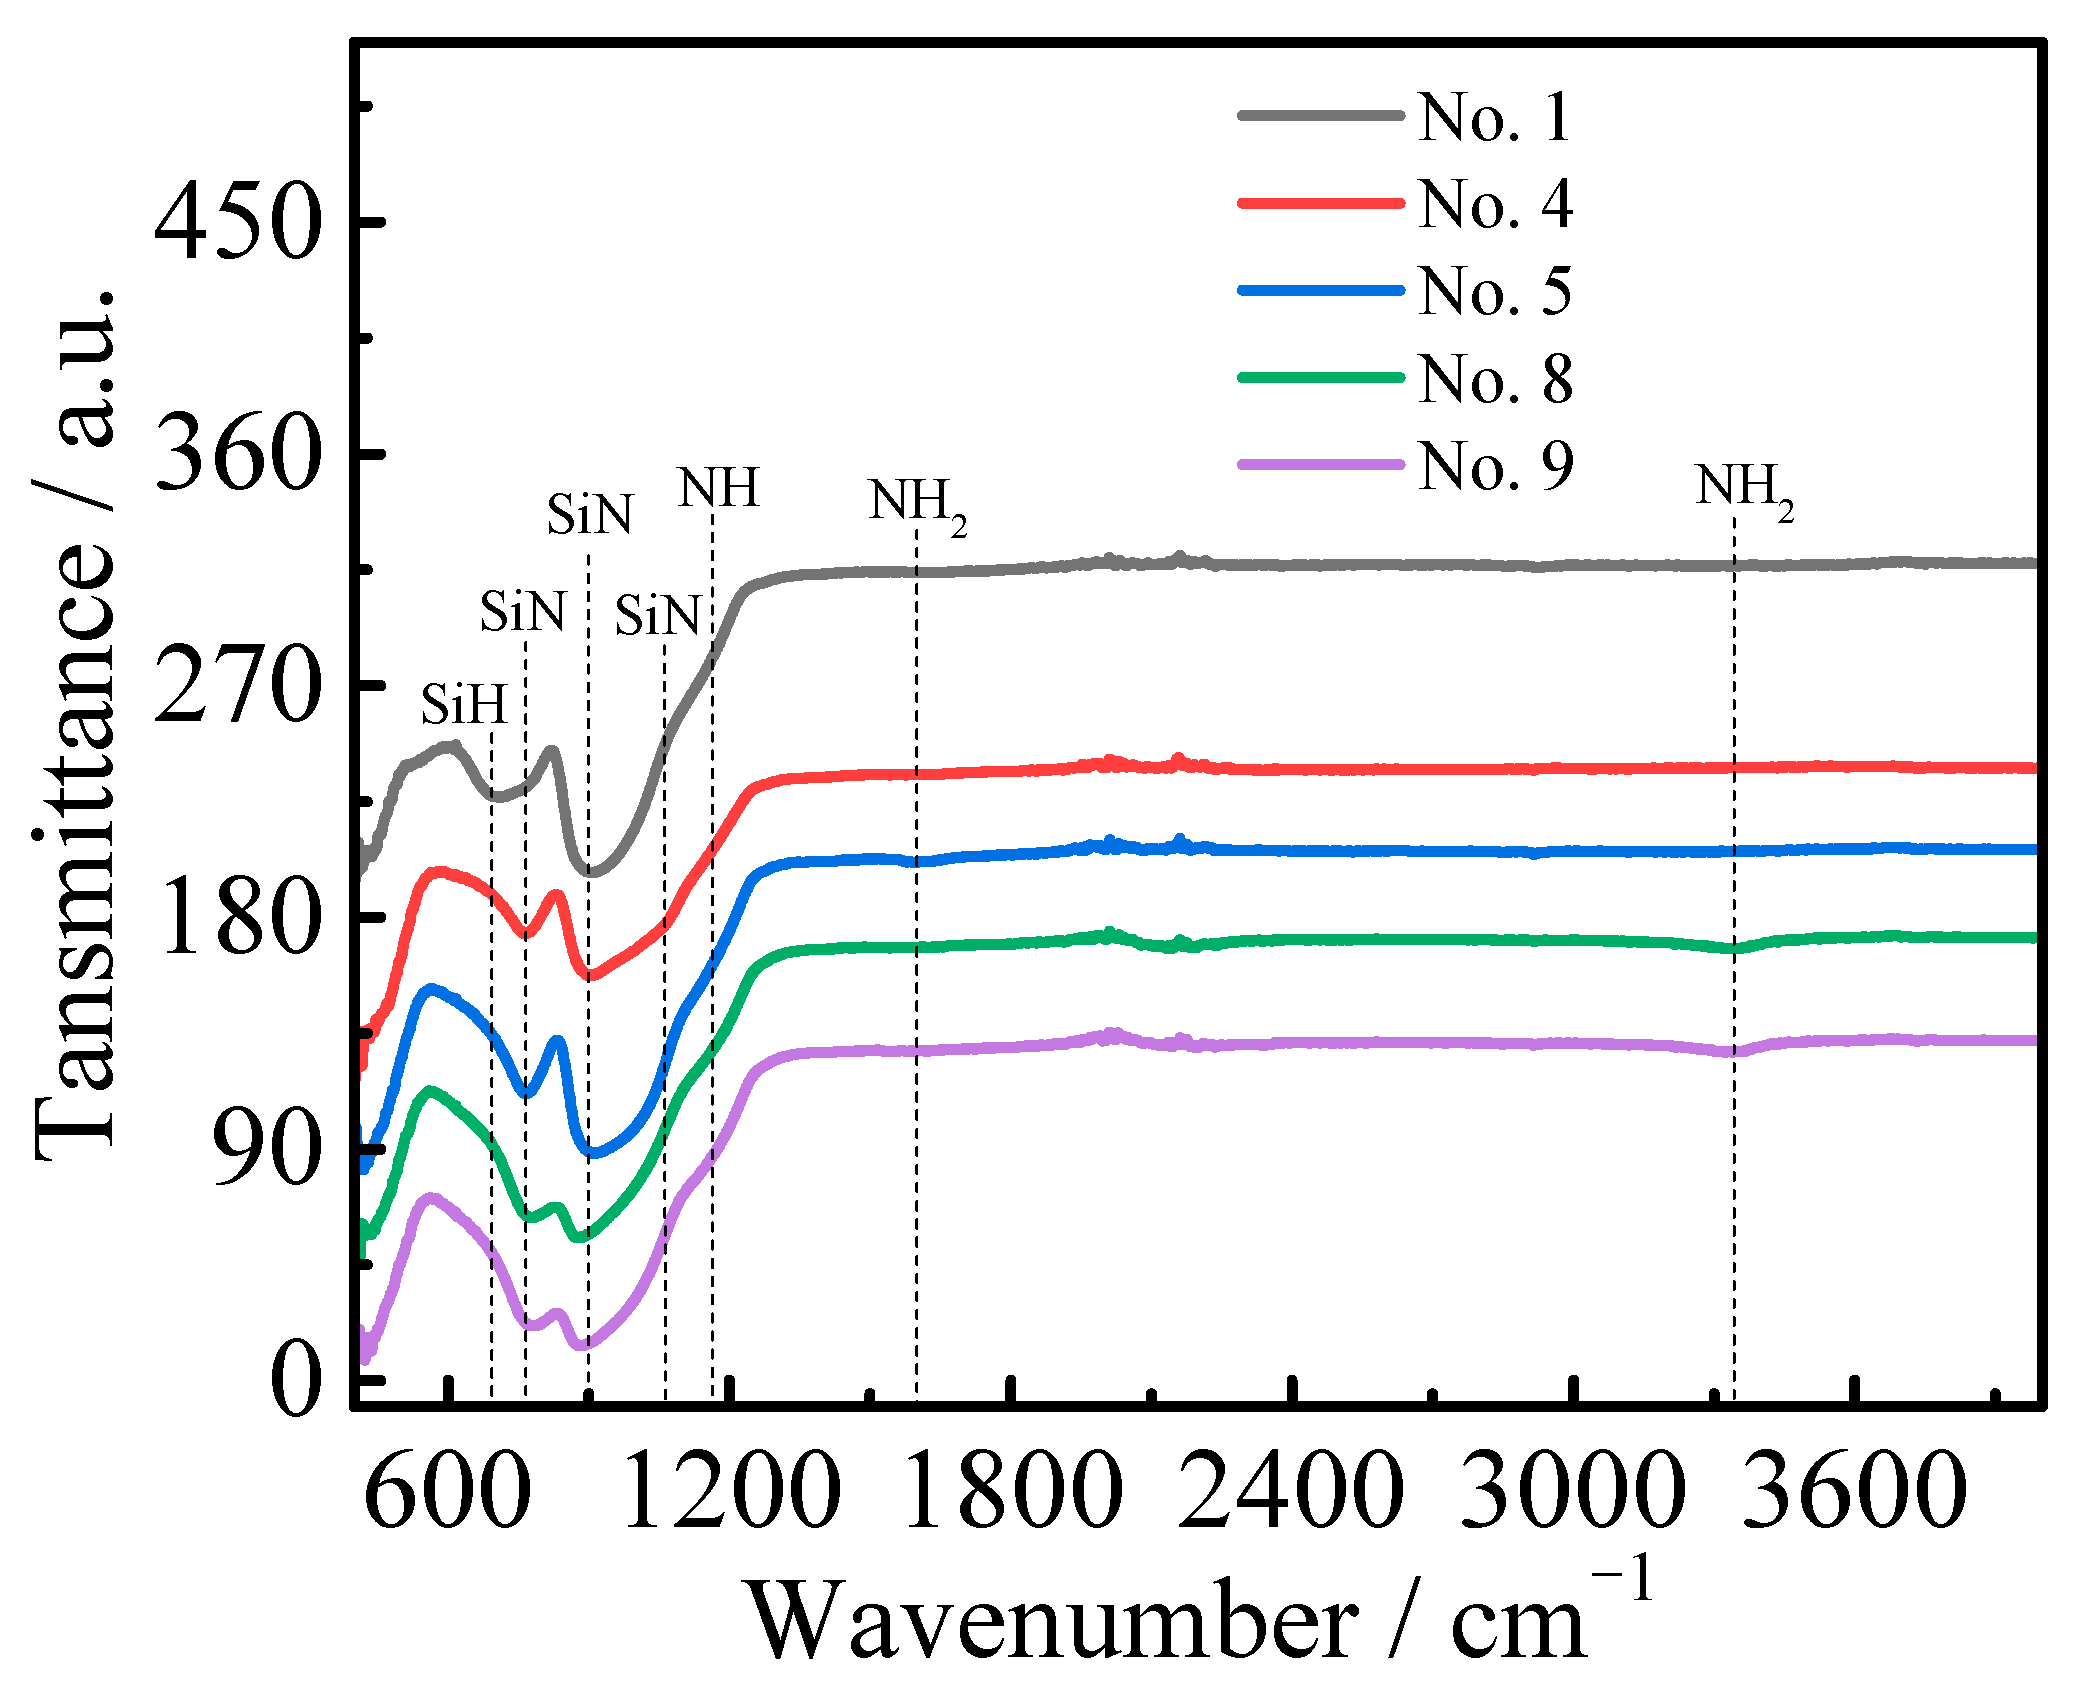
3.2.1. FTIR
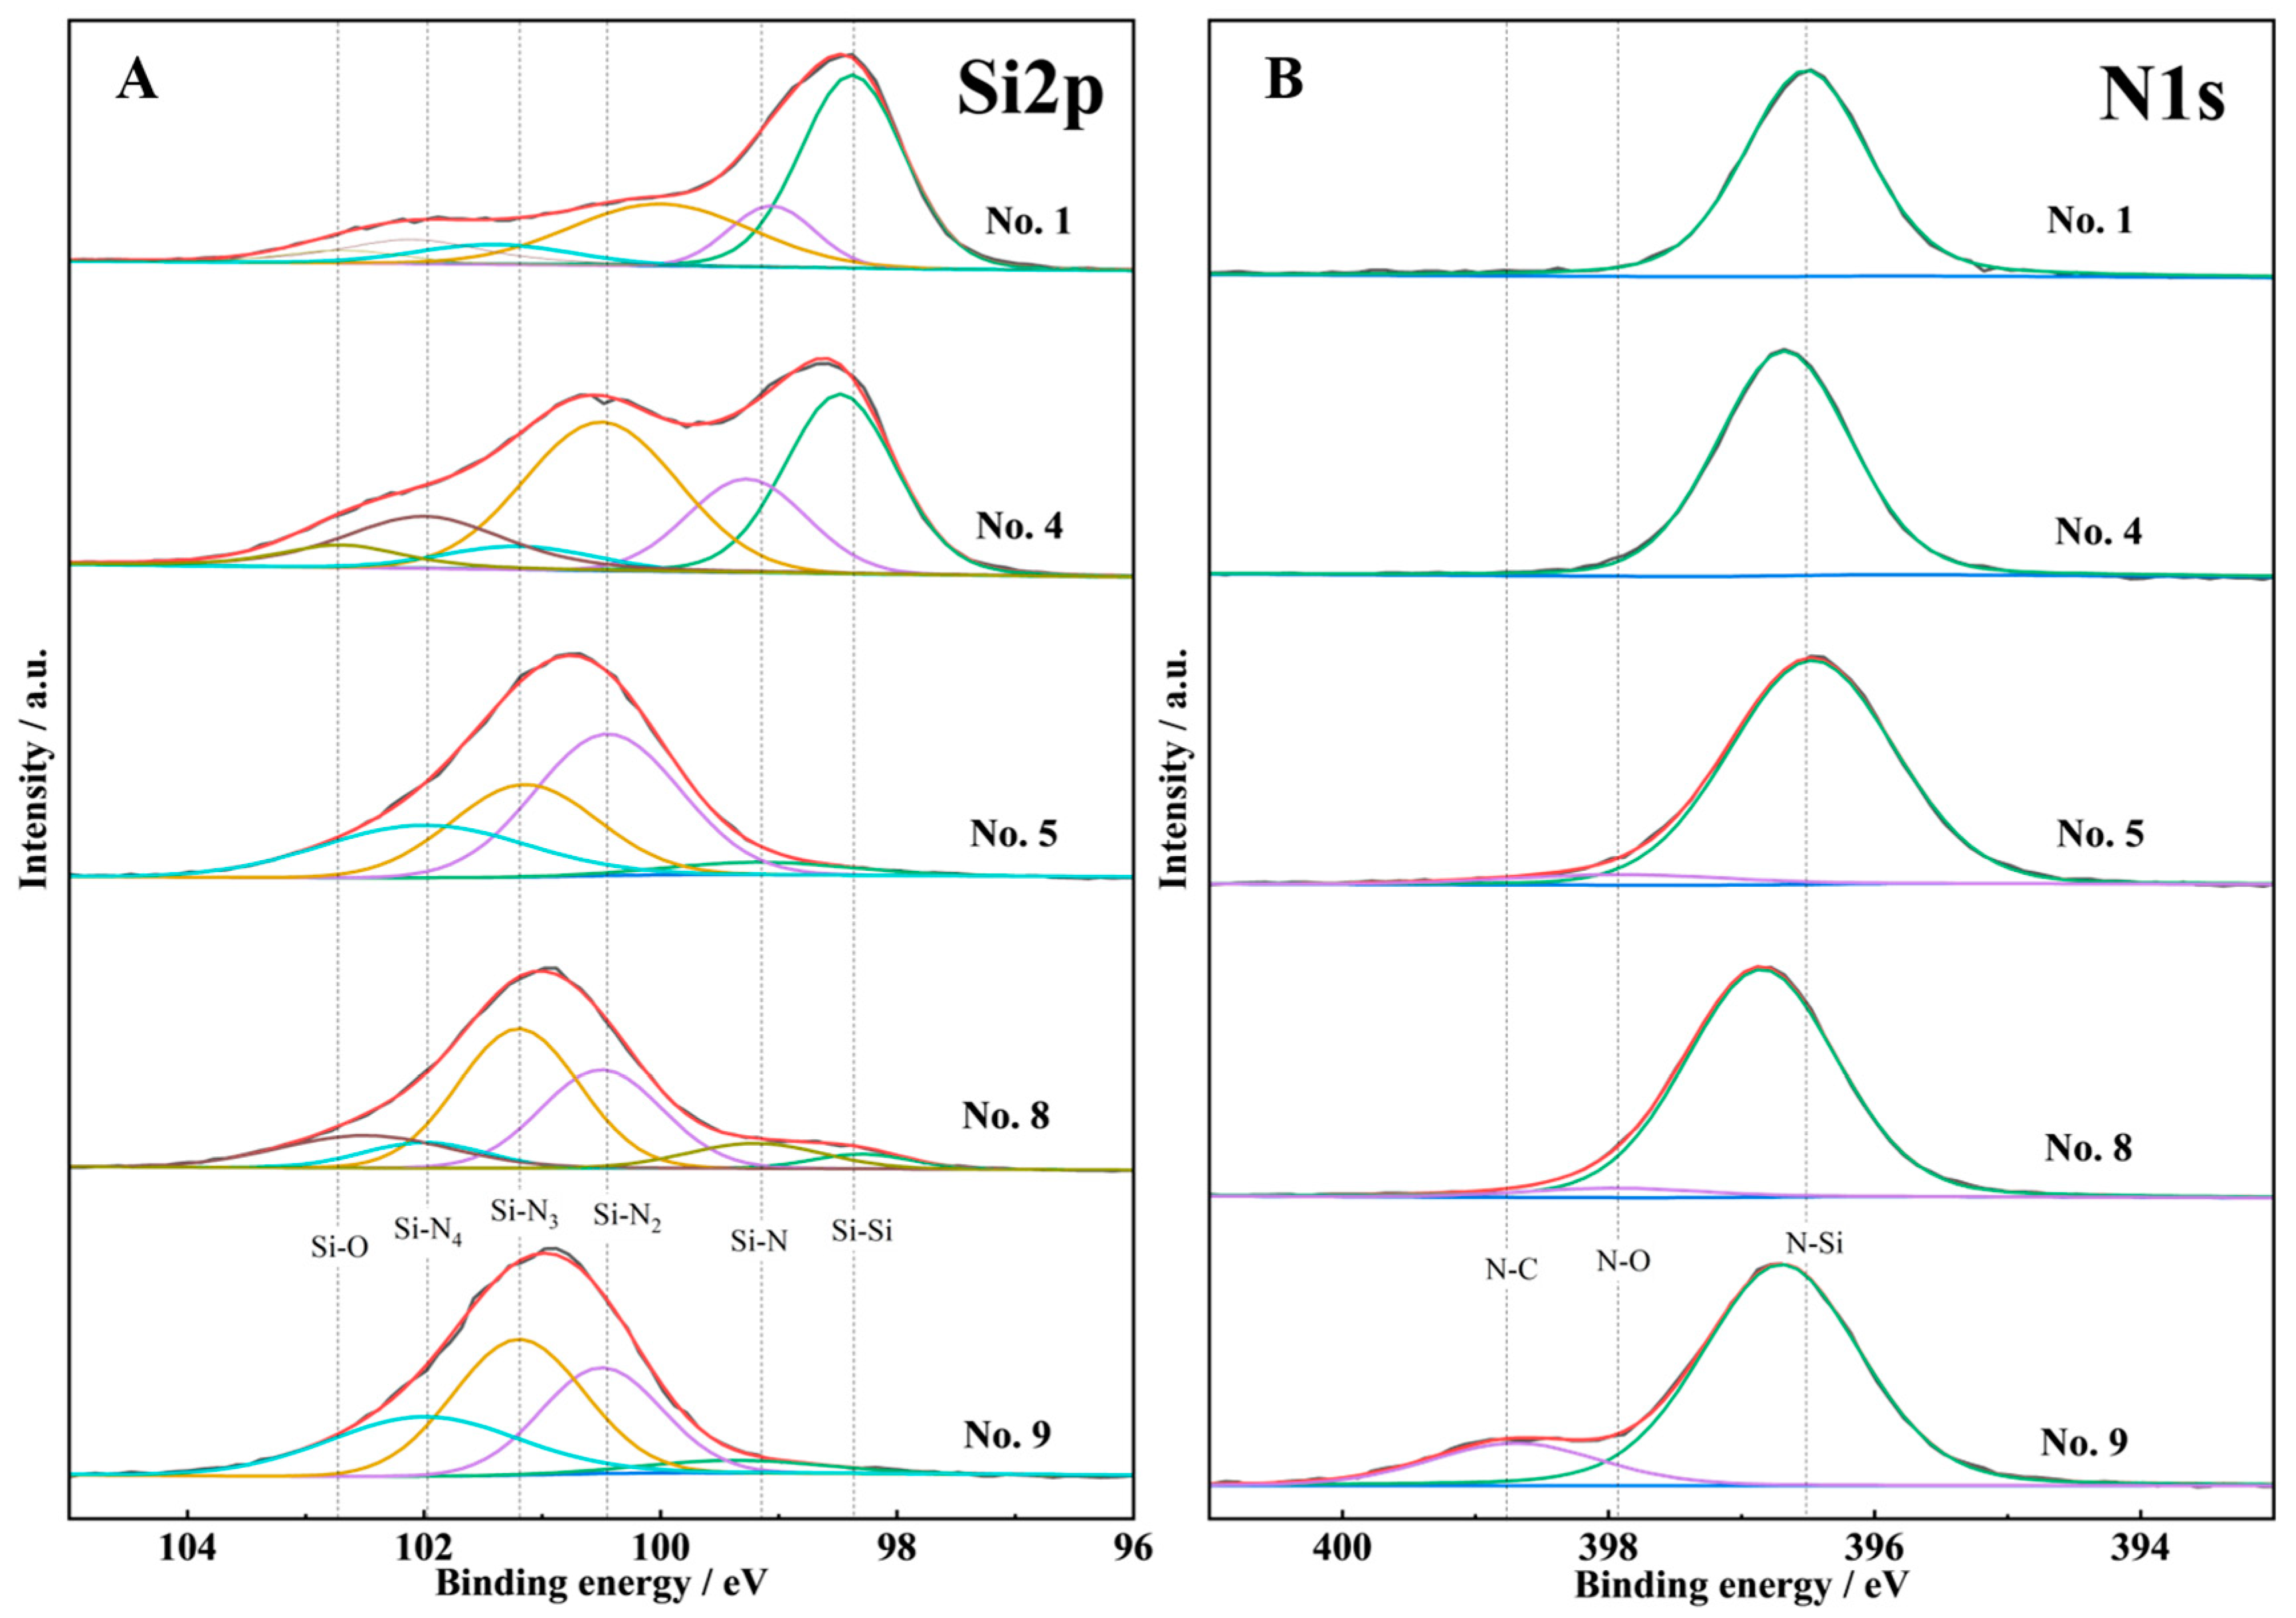
3.2.2. XPS
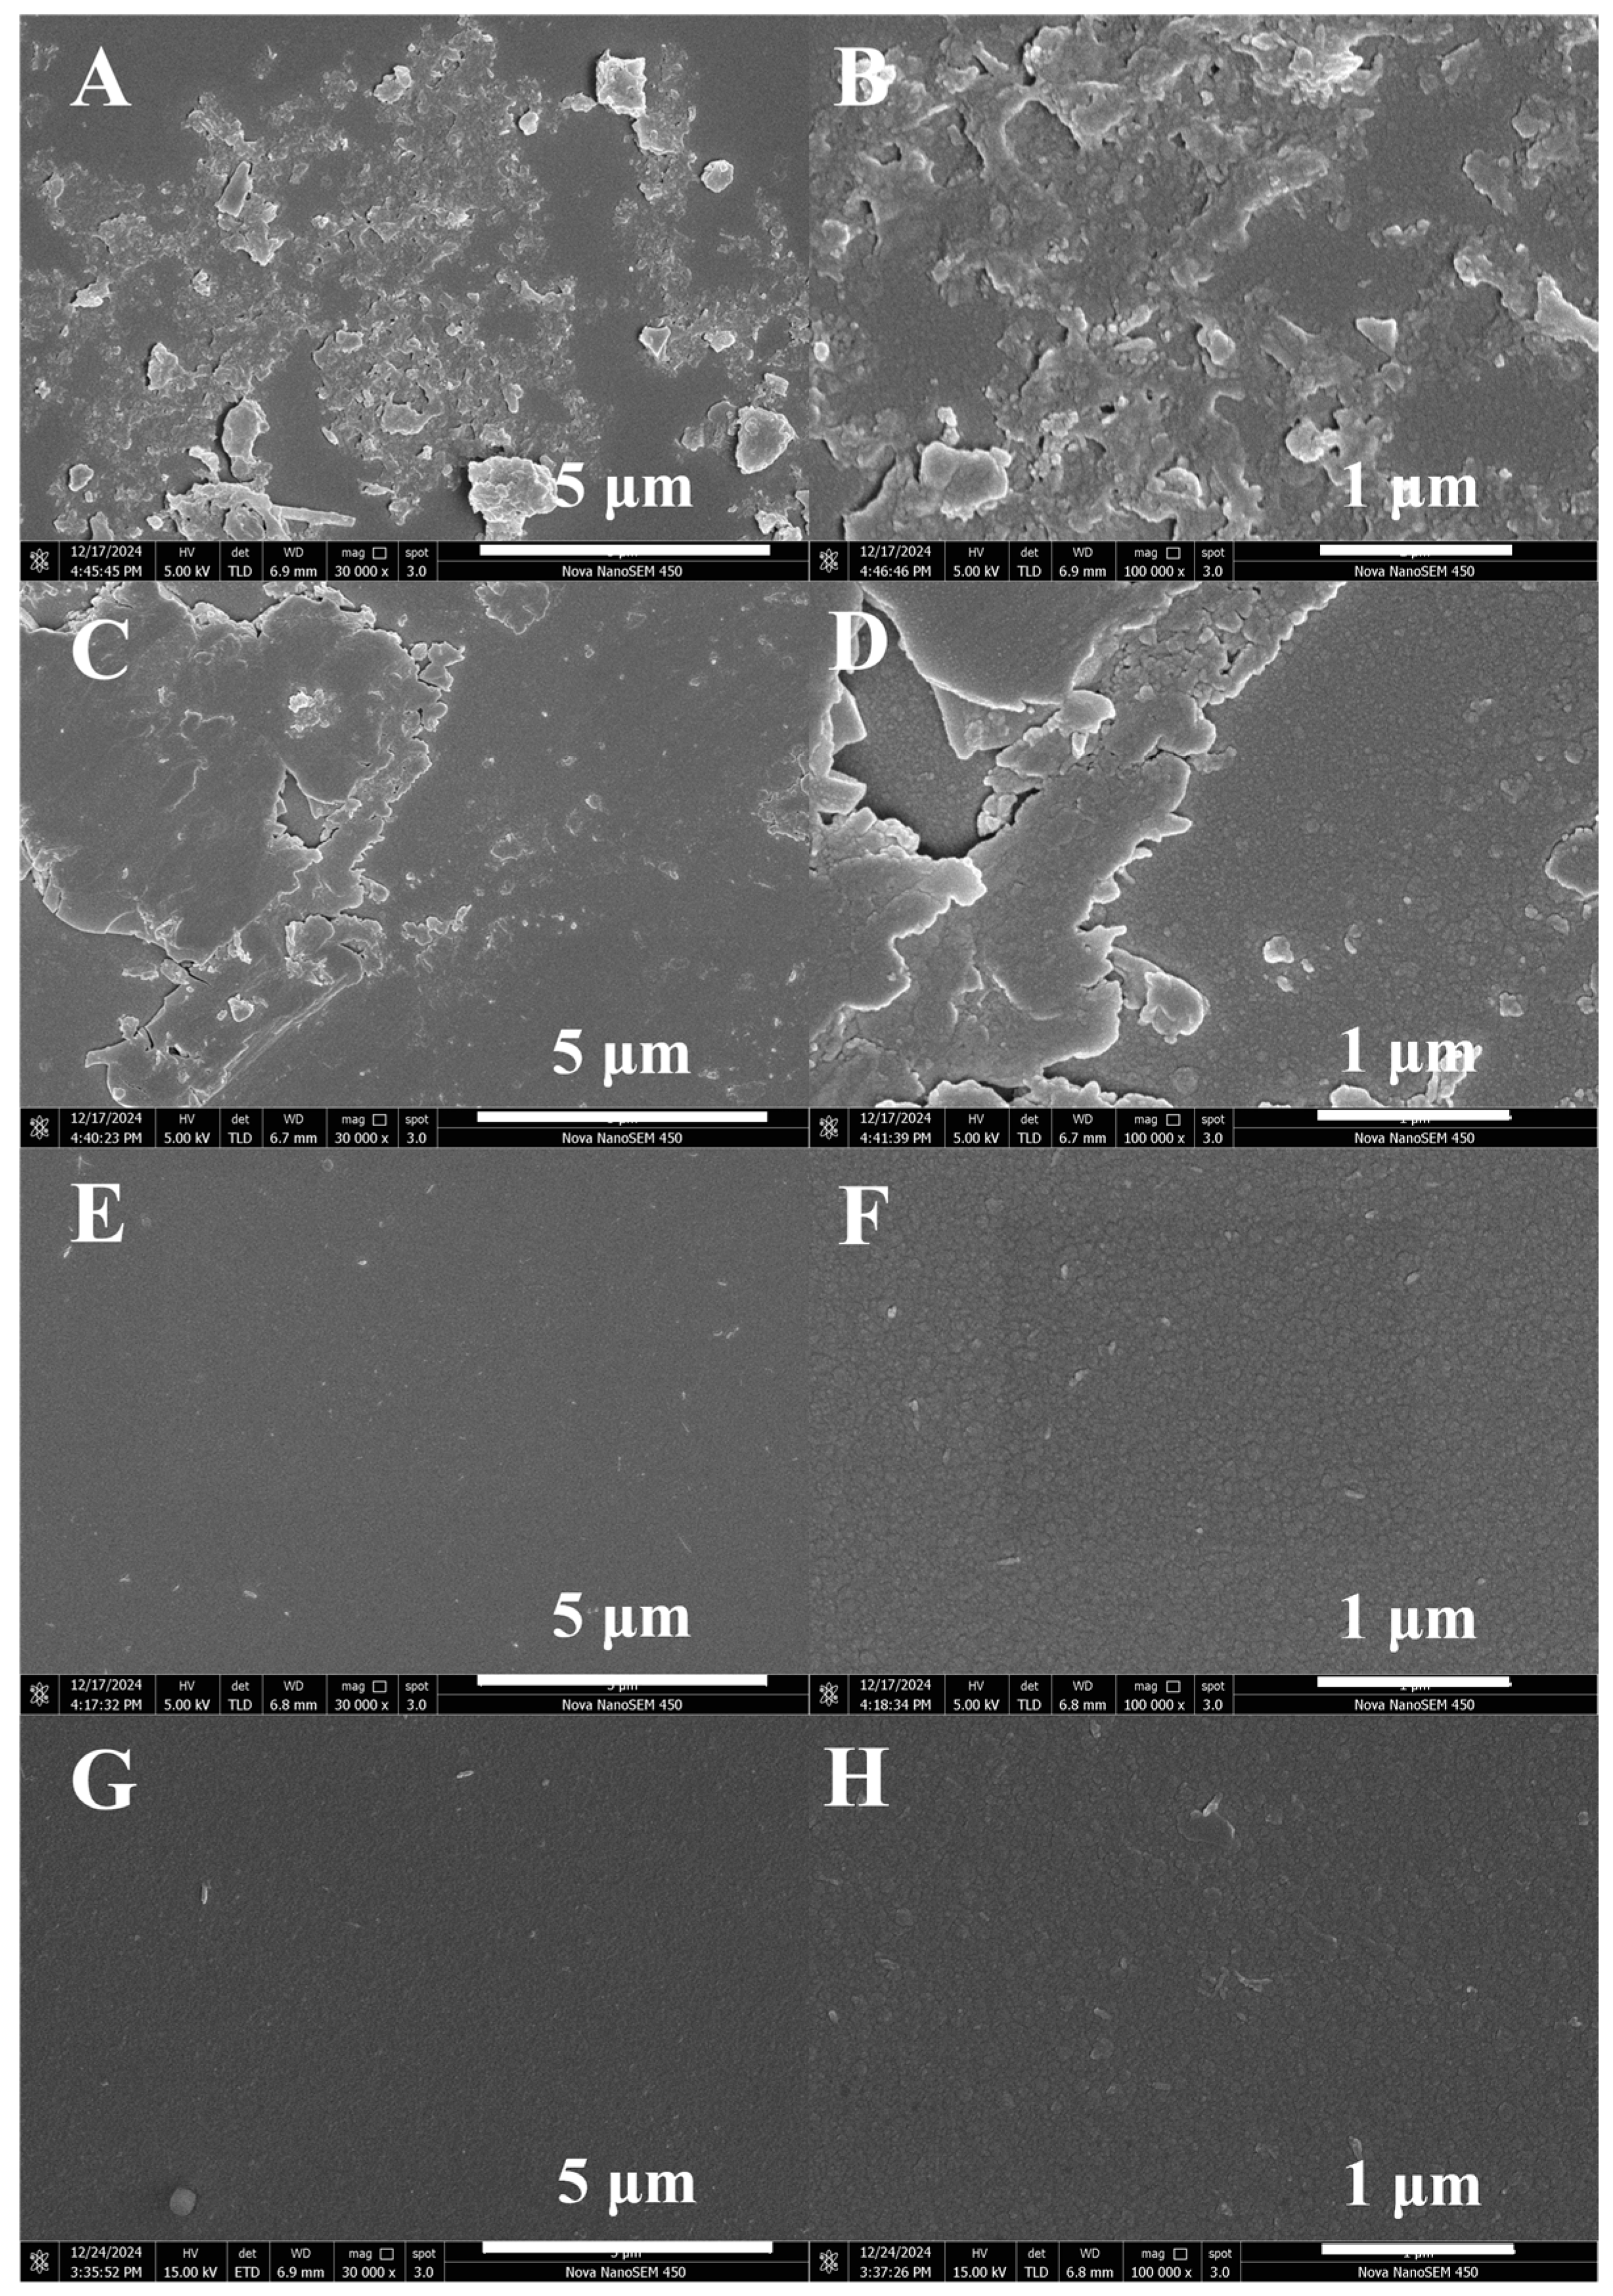
3.2.3. SEM
4. Conclusions
Author Contributions
Funding
Institutional Review Board Statement
Informed Consent Statement
Data Availability Statement
Acknowledgments
Conflicts of Interest
References
- Zhou, H.; Persson, C.; Xia, W.; Engqvist, H. SiNx Coating Deposition on CoCr by Plasma-Enhanced Chemical Vapor Deposition. Biomed. Mater. Devices 2024, 2, 376–383. [Google Scholar] [CrossRef]
- Luo, C.; Long, S.; Liu, G.; Cooper; Zhang, M.; Ai, F. Optimized Optical Design of Thin-Film Transistor Arrays for High Transmittance and Excellent Chromaticity. Front. Mater. Sci. 2020, 14, 89–95. [Google Scholar] [CrossRef]
- Skjöldebrand, C.; Schmidt, S.; Vuong, V.; Pettersson, M.; Grandfield, K.; Högberg, H.; Engqvist, H.; Persson, C. Influence of Substrate Heating and Nitrogen Flow on the Composition, Morphological and Mechanical Properties of SiNx Coatings Aimed for Joint Replacements. Materials 2017, 10, 173. [Google Scholar] [CrossRef] [PubMed]
- Pavesi, L.; Dal Negro, L.; Mazzoleni, C.; FranzoÁ, G.; Priolo, F. Optical Gain in Silicon Nanocrystals. Nature 2000, 408, 440. [Google Scholar] [CrossRef] [PubMed]
- You, D.; Jiang, Y.; Zhao, Y.; Guo, W.; Tan, M. Widely Tunable Refractive Index Silicon Nitride Films Deposited by Ion-Assisted Pulsed DC Reactive Magnetron Sputtering. Opt. Mater. 2023, 136, 113354. [Google Scholar] [CrossRef]
- Hegedus, N.; Balazsi, K.; Balazsi, C. Silicon Nitride and Hydrogenated Silicon Nitride Thin Films: A Review of Fabrication Methods and Applications. Materials 2021, 14, 5658. [Google Scholar] [CrossRef] [PubMed]
- Kaloyeros, A.E.; Pan, Y.; Goff, J.; Arkles, B. Review-Silicon Nitride and Silicon Nitride-Rich Thin Film Technologies: State-of-the-Art Processing Technologies, Properties, and Applications. ECS J. Solid. State Sci. Technol. 2020, 9, 63006. [Google Scholar] [CrossRef]
- Sharma, T.; Wang, J.; Kaushik, B.K.; Cheng, Z.; Kumar, R.; Zhao, W.; Li, X. Review of Recent Progress on Silicon Nitride-based Photonic Integrated Circuits. IEEE Access 2020, 8, 195436. [Google Scholar] [CrossRef]
- Doaa, E.; Aref, E.; Mohamed, Z.; Allam, M.A.; Ahmed, G.E.; Ibrahim, E.A. Effect of PECVD SiNx Deposition Parameters on Efficiency of Monocrystalline Silicon Solar Cells. In Proceedings of the First International Conference of Remote Sensing and Space Sciences Applications, Hurghada, Egypt, 8–11 December 2022; Volume 435. [Google Scholar] [CrossRef]
- Wang, S.; Cui, H.; Jin, S.; Pi, X.; He, H.; Shou, C.; Yang, D.; Wang, L. Anti-Reflection Effect of High Refractive Index Polyurethane with Different Light Trapping Structures on Solar Cells. Heliyon 2023, 9, e20264. [Google Scholar] [CrossRef]
- Shanmugam, N.; Pugazhendhi, R.; Elavarasan, R.M.; Kasiviswanathan, P.; Das, N. Anti-Reflective Coating Materials: A Holistic Review from PV Perspective. Energies 2020, 13, 2631. [Google Scholar] [CrossRef]
- Soman, A.; Antony, A. Broad Range Refractive Index Engineering of SixNy and SiOxNy Thin Films and Exploring Their Potential Applications in Crystalline Silicon Solar Cells. Mater. Chem. Phys. 2017, 197, 181–191. [Google Scholar] [CrossRef]
- Miyaura, J.; Ohdaira, K. Improvement in The Passivation Quality of Catalytic-Chemical-Vapor-Deposited Silicon Nitride Films on Crystalline Si at Room Temperature. Thin Solid. Film. 2019, 674, 103–106. [Google Scholar] [CrossRef]
- Cho, T.; Lee, W.; Lee, S.; Lee, J.; Ryu, J.; Cho, S.; Choa, S. Moisture Barrier and Bending Properties of Silicon Nitride Films Prepared by Roll-to-Roll Plasma Enhanced Chemical Vapor Deposition. Thin Solid. Film. 2018, 660, 101–107. [Google Scholar] [CrossRef]
- Engelhardt, J.; Hahn, G.; Terheiden, B. Multifunctional ICP-PECVD Silicon Nitride Layers for High-Efficiency Silicon Solar Cell Applications. Energy Procedia 2015, 77, 786–790. [Google Scholar] [CrossRef]
- Tian, Y.; Gao, A.; Zhou, B. Effect of SiH4 Flow Rates on the Structures and Properties of Si-Rich Silicon Nitride Films Prepared by Hot Wire Chemical Vapor Deposition. Solid. State Phenom. 2019, 288, 135–139. [Google Scholar] [CrossRef]
- Guler, I. Optical and Structural Characterization of Silicon Nitride Thin Films Deposited by PECVD. Mater. Sci. Eng. B 2019, 246, 21–26. [Google Scholar] [CrossRef]
- Canar, H.H.; Bektaş, G.; Turan, R. On The Passivation Performance of SiNx, SiOxNy and Their Stack on c-Si Wafers for Solar Cell Applications: Correlation with Optical, Chemical and Interface Properties. Sol. Energy Mater. Sol. Cells 2023, 256, 112356. [Google Scholar] [CrossRef]
- Vohánka, J.; Ohlídal, I.; Ohlídal, M.; Šustek, Š.; Čermák, M.; Šulc, V.; Vašina, P.; Ženíšek, J.; Franta, D. Optical Characterization of Non-Stoichiometric Silicon Nitride Films Exhibiting Combined Defects. Coatings 2019, 9, 416. [Google Scholar] [CrossRef]
- Meng, X.; Byun, Y.C.; Kim, H.; Lee, J.; Lucero, A.; Cheng, L.; Kim, J. Atomic Layer Deposition of Silicon Nitride Thin Films: A Review of Recent Progress, Challenges, and Outlooks. Materials 2016, 9, 1007. [Google Scholar] [CrossRef]
- Beliaev, L.; Shkondin, E.; Lavrinenko, A.; Takayama, O. Optical, Structural and Composition Properties of Silicon Nitride Films Deposited by Reactive Radio-Frequency Sputtering, Low Pressure and Plasma-Enhanced Chemical Vapor Deposition. Thin Solid. Film. 2022, 763, 139568. [Google Scholar] [CrossRef]
- Matsumura, H. Formation of Silicon-Based Thin Films Prepared by Catalytic Chemical Vapor Deposition (Cat-CVD) Method. Jpn. J. Appl. Phys. 1998, 37, 3175. [Google Scholar] [CrossRef]
- Matsumura, H.; Hasegawa, T.; Nishizaki, S.; Ohdaira, K. Advantage of Plasma-Less Deposition in Cat-CVD to The Performance of Electronic Devices. Thin Solid. Film. 2011, 519, 4568–4570. [Google Scholar] [CrossRef]
- Rai, D.K.; Solanki, C.S.; Kavaipatti, B.R. Growth of Silicon Nitride by Nitridation of Amorphous Silicon at Low Temperature in Hot-Wire CVD. Mater. Sci. Semicond. Process. 2017, 67, 46–54. [Google Scholar] [CrossRef]
- Koyama, K.; Ohdaira, K.; Matsumura, H. Excellent Passivation Effect of Cat-CVD SiNx/i-a-Si Stack Films on Si Substrates. Thin Solid Film. 2011, 519, 4473–4475. [Google Scholar] [CrossRef]
- Umemoto, H.; Morimoto, T.; Yamawaki, M.; Masuda, Y.; Masuda, A.; Matsumura, H. Deposition Chemistry in The Cat-CVD Processes of The SiH4/NH3 System. Thin Solid. Film. 2003, 430, 24–27. [Google Scholar] [CrossRef]
- Matsumura, H. Silicon Nitride Produced by Catalytic Chemical Vapor Deposition Method. J. Appl. Phys. 1989, 66, 3612–3617. [Google Scholar] [CrossRef]
- Fujinaga, T.; Takagi, M.; Hashimoto, M.; Asari, S.; Saito, K. Effect of Hydrogen on SiNx Films Deposited by Cat-CVD Method. Thin Solid. Film. 2008, 516, 615–617. [Google Scholar] [CrossRef]
- Matsumura, H.; Umemoto, H.; Masuda, A. Cat-CVD (Hot-Wire CVD): How Different from PECVD in Preparing Amorphous Silicon. J. Non-Cryst. Solids 2004, 338–340, 19–26. [Google Scholar] [CrossRef]
- Ghalme, S.; Mankar, A.; Bhalerao, Y. Integrated Taguchi-Simulated Annealing (SA) Approach for Analyzing Wear Behaviour of Silicon Nitride. J. Appl. Res. Technol. 2017, 15, 624–632. [Google Scholar] [CrossRef]
- Yang, L.; Zhang, C.; Li, W.; Liu, G.; Wu, M.; Liu, J.; Zhang, J. Global Optimization of Process Parameters for Low-Temperature SiNx Based on Orthogonal Experiments. Adv. Manuf. 2023, 11, 181–190. [Google Scholar] [CrossRef]
- Yu, J.; Wang, H.; Zeng, H.; Lin, D.; Jin, Z. Investigation on Gel Casting Preparation of Porous Si3N4 Ceramics through Orthogonal Experimental Design. Mater. Sci. Forum 2008, 569, 49–52. [Google Scholar] [CrossRef]
- Knoops, H.; Braeken, E.; de Peuter, K.; Potts, S.; Haukka, S.; Pore, V.; Kessels, W. Atomic Layer Deposition of Silicon Nitride from Bis(tert-butylamino)silane and N2 Plasma. ACS Appl. Mater. Interfaces 2015, 7, 19857–19862. [Google Scholar] [CrossRef] [PubMed]
- Xia, X.; Yang, C.; Wang, Z.; Sun, T.; Zhang, H.; Wu, J. Multi-Objective Optimization of The Dual-Pressure Organic Rankine Cycle System Based on The Orthogonal Design Method under Different External Conditions. Energy 2024, 296, 131109. [Google Scholar] [CrossRef]
- Giri, A.; Mosher, J.; Adler, A.; Pantazis, D. An F-Ratio-Based Method for Estimating The Number of Active Sources in MEG. Front. Hum. Neurosci. 2023, 17, 1235192. [Google Scholar] [CrossRef]
- Available online: https://tidystat.com/f-distribution-critical-value-table/ (accessed on 5 January 2025).
- Afanasyev-Charkin, I.V.; Nastasi, M. Hard Si–N–C Coatings Produced by Pulsed Glow Discharge Deposition. Surf. Coat. Technol. 2004, 186, 108–111. [Google Scholar] [CrossRef]
- Yousuf, H.; Khan, A.; Khokhar, M.Q.; Rahman, R.; Madara, P.C.; Jony, J.A.; Zahid, M.A.; Kim, Y.; Yi, J. Investigating The Impact of Hydrogen Bonding on Silicon Nitride (SiNx) Film. Energy Technol. 2024, 13, 2400761. [Google Scholar] [CrossRef]
- Rai, D.K.; Panchal, A.K.; Sutar, D.S.; Solanki, C.S.; Balasubramaniam, K.R. Mechanism for Formation of Ultra Thin SiNx on a-Si—XPS and FTIR Studies. In Proceedings of the 2015 IEEE 42nd Photovoltaic Specialist Conference (PVSC), New Orleans, LA, USA, 14–19 June 2015. [Google Scholar]
- Giorgis, F.; Giuliani, F.; Pirri, C.F.; Tresso, E.; Summonte, C.; Rizzoli, R.; Galloni, R.; Desalvo, A.; Rava, P. Optical, Structural and Electrical Properties of Device-Quality Hydrogenated Amorphous Silicon-Nitrogen Films Deposited by Plasma-Enhanced Chemical Vapour Deposition. Philos. Mag. B 1998, 77, 925–944. [Google Scholar] [CrossRef]
- Maarouf, M.; Haider, M.B.; Drmosh, Q.A.; Mekki, M.B. X-Ray Photoelectron Spectroscopy Depth Profiling of As-Grown and Annealed Titanium Nitride Thin Films. Crystals 2021, 11, 239. [Google Scholar] [CrossRef]
- Liu, Y.; Liu, L.; Kang, L.; Ran, F. Vanadium Nitride with Surface Single Specie Oxide via Vanadium-Organic Frameworks Precursor. J. Power Sources 2020, 450, 227687. [Google Scholar] [CrossRef]
- Zhang, T.; Xiao, J.; Li, L.; Zhao, J.; Gao, H. A High-Performance Supercapacitor Electrode Based on Freestanding N-doped Ti3C2Tx Film. Ceram. Int. 2020, 46, 21482–21488. [Google Scholar] [CrossRef]
- Jung, M.; Han, M. Chemical and Structural Stabilities of SiNx Nano-Scale Islands Formed by Ionized N2 Gas at Room Temperature. Jpn. J. Appl. Phys. 2004, 43, 1127–1130. Available online: http://iopscience.iop.org/1347-4065/43/3R/1127 (accessed on 27 December 2024). [CrossRef]
- Awad, Y.; El Khakani, M.A.; Mouine, J.; Camiré, N.; Lessard, M.; Scarlete, M.; Al-Abadleh, H.A.; Smirani, R. Structural and Mechanical Properties of Amorphous Silicon Carbonitride Films Prepared by Vapor-Transport Chemical Vapor Deposition. Surf. Coat. Technol. 2009, 204, 539–545. [Google Scholar] [CrossRef]
- Tiour, F.; Benyahia, B.; Brihi, N.; Sari, A.; Mahmoudi, B.; Manseri, A.; Guenda, A. Opto-Structural Properties of Si-rich SiNx with Different Stoichiometry. Appl. Phys. A 2020, 126, 59. [Google Scholar] [CrossRef]
- Lipiński, M.; Zięba, P.; Jonas, S.; Kluska, S.; Sokolowski, M.; Czternastek, H. Optimisation of SiNx:H Layer for Multicrystalline Silicon Solar Cells. Opto-Electron. Rev. 2004, 1, 41–44. [Google Scholar]


| Level | Experimental Factor | |||
|---|---|---|---|---|
| P/Pa | SiH4:NH3 | SiH4:H2 | Ts/°C | |
| 1 | 1 | 1:10 | 1:0 | 60 |
| 2 | 2 | 1:15 | 1:5 | 150 |
| 3 | 3 | 1:20 | 1:10 | 250 |
| No. | Experimental Factor | |||
|---|---|---|---|---|
| P/Pa | SiH4:NH3 | SiH4:H2 | Ts/°C | |
| 1 | 1 | 1:10 | 1:0 | 60 |
| 2 | 1 | 1:15 | 1:5 | 150 |
| 3 | 1 | 1:20 | 1:10 | 250 |
| 4 | 2 | 1:10 | 1:5 | 250 |
| 5 | 2 | 1:15 | 1:10 | 60 |
| 6 | 2 | 1:20 | 1:0 | 150 |
| 7 | 3 | 1:10 | 1:10 | 150 |
| 8 | 3 | 1:15 | 1:0 | 250 |
| 9 | 3 | 1:20 | 1:5 | 60 |
| No. | Response Parameter | ||||
|---|---|---|---|---|---|
| Refractive Index | Extinction Coefficient | /nm | Uniformity/% | Deposition Rate/nm·s−1 | |
| 1 | 3.306 | 0.157 | 149.440 (±5.081) | 3.40 | 0.31 |
| 2 | 2.079 | 0.212 | 105.177 (±2.514) | 2.39 | 0.22 |
| 3 | 2.157 | 0.189 | 177.222 (±5.051) | 2.85 | 0.24 |
| 4 | 2.857 | 0.129 | 125.333 (±4.224) | 3.37 | 0.26 |
| 5 | 1.999 | 0.097 | 127.888 (±5.179) | 4.05 | 0.27 |
| 6 | 1.980 | 0.215 | 103.270 (±4.534) | 4.39 | 0.22 |
| 7 | 2.330 | 0.126 | 151.030 (±3.111) | 2.06 | 0.31 |
| 8 | 2.259 | 0.271 | 138.220 (±5.004) | 3.62 | 0.29 |
| 9 | 2.026 | 0.056 | 144.000 (±4.277) | 2.97 | 0.30 |
| Response Parameter | Factor | Mean Value | Range Value | ||
|---|---|---|---|---|---|
| k1 | k2 | k3 | |||
| Refractive index | P | 2.514 | 2.279 | 2.205 | 0.309 |
| SiH4:NH3 | 2.831 | 2.112 | 2.054 | 0.777 | |
| SiH4:H2 | 2.515 | 2.321 | 2.162 | 0.353 | |
| Ts | 2.444 | 2.130 | 2.424 | 0.314 | |
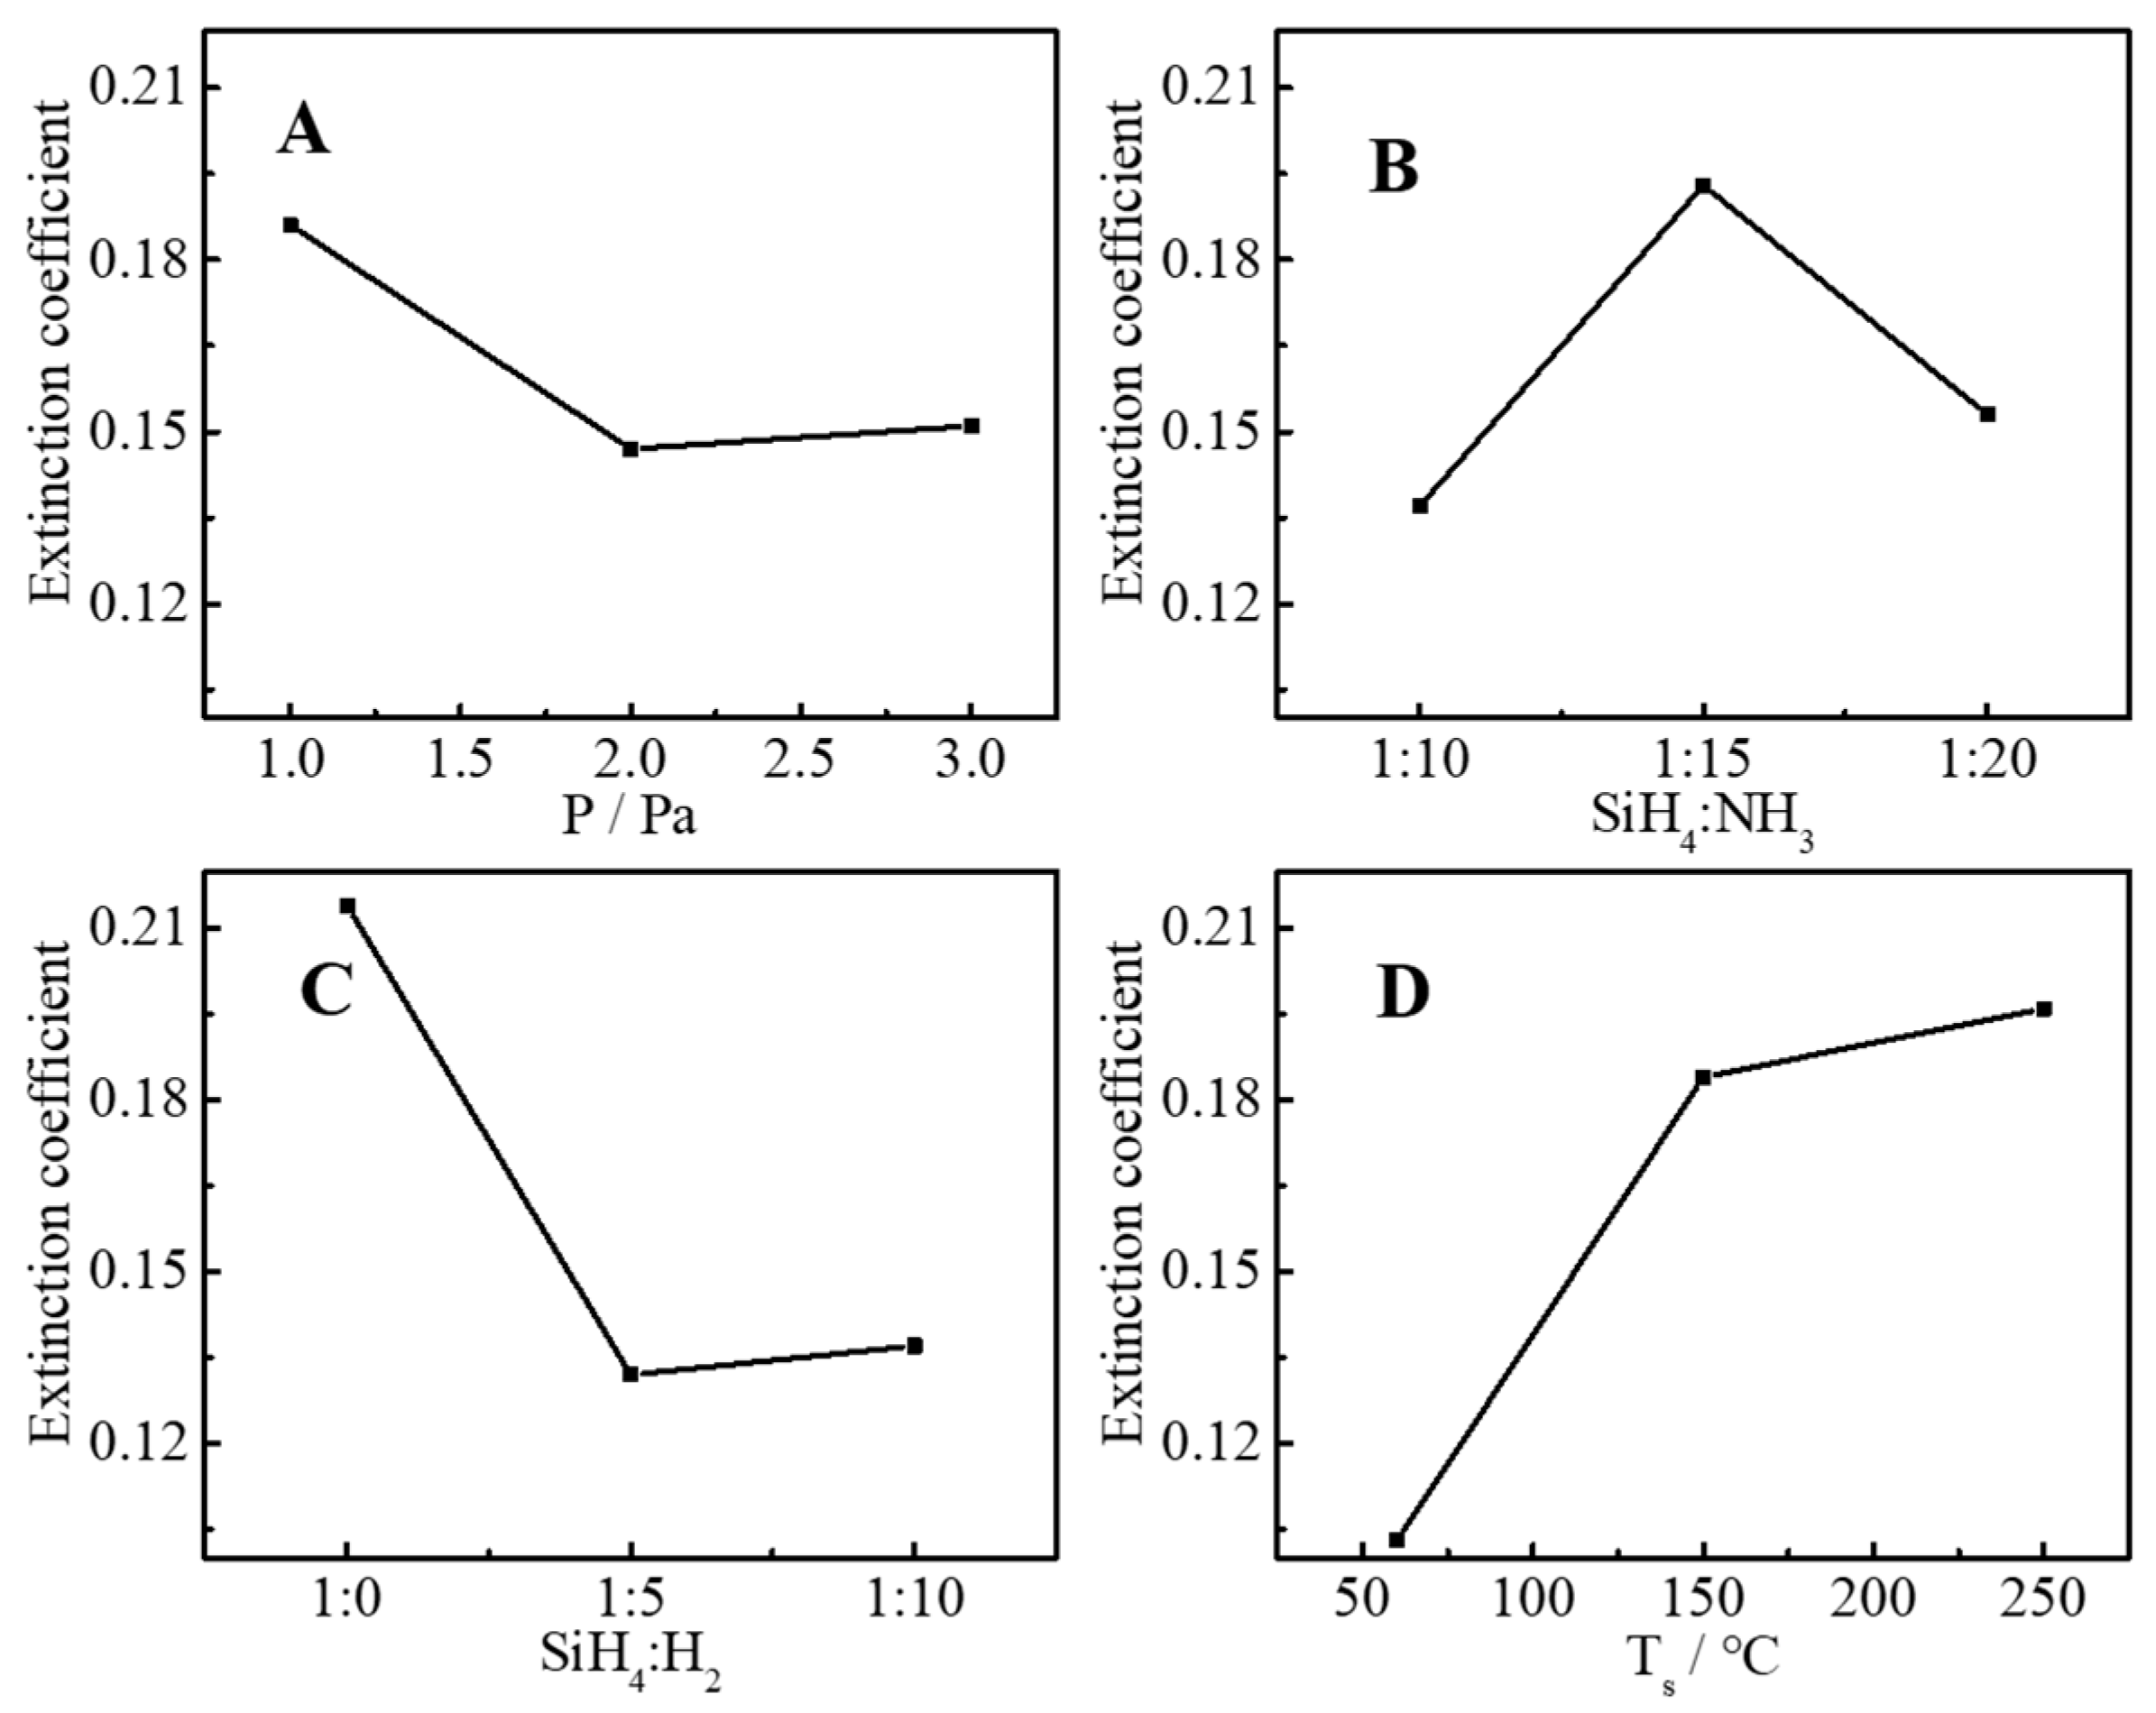
| Extinction coefficient | P | 0.186 | 0.147 | 0.151 | 0.039 |
| SiH4:NH3 | 0.137 | 0.193 | 0.153 | 0.056 | |
| SiH4:H2 | 0.214 | 0.132 | 0.137 | 0.082 | |
| Ts | 0.103 | 0.184 | 0.196 | 0.093 | |
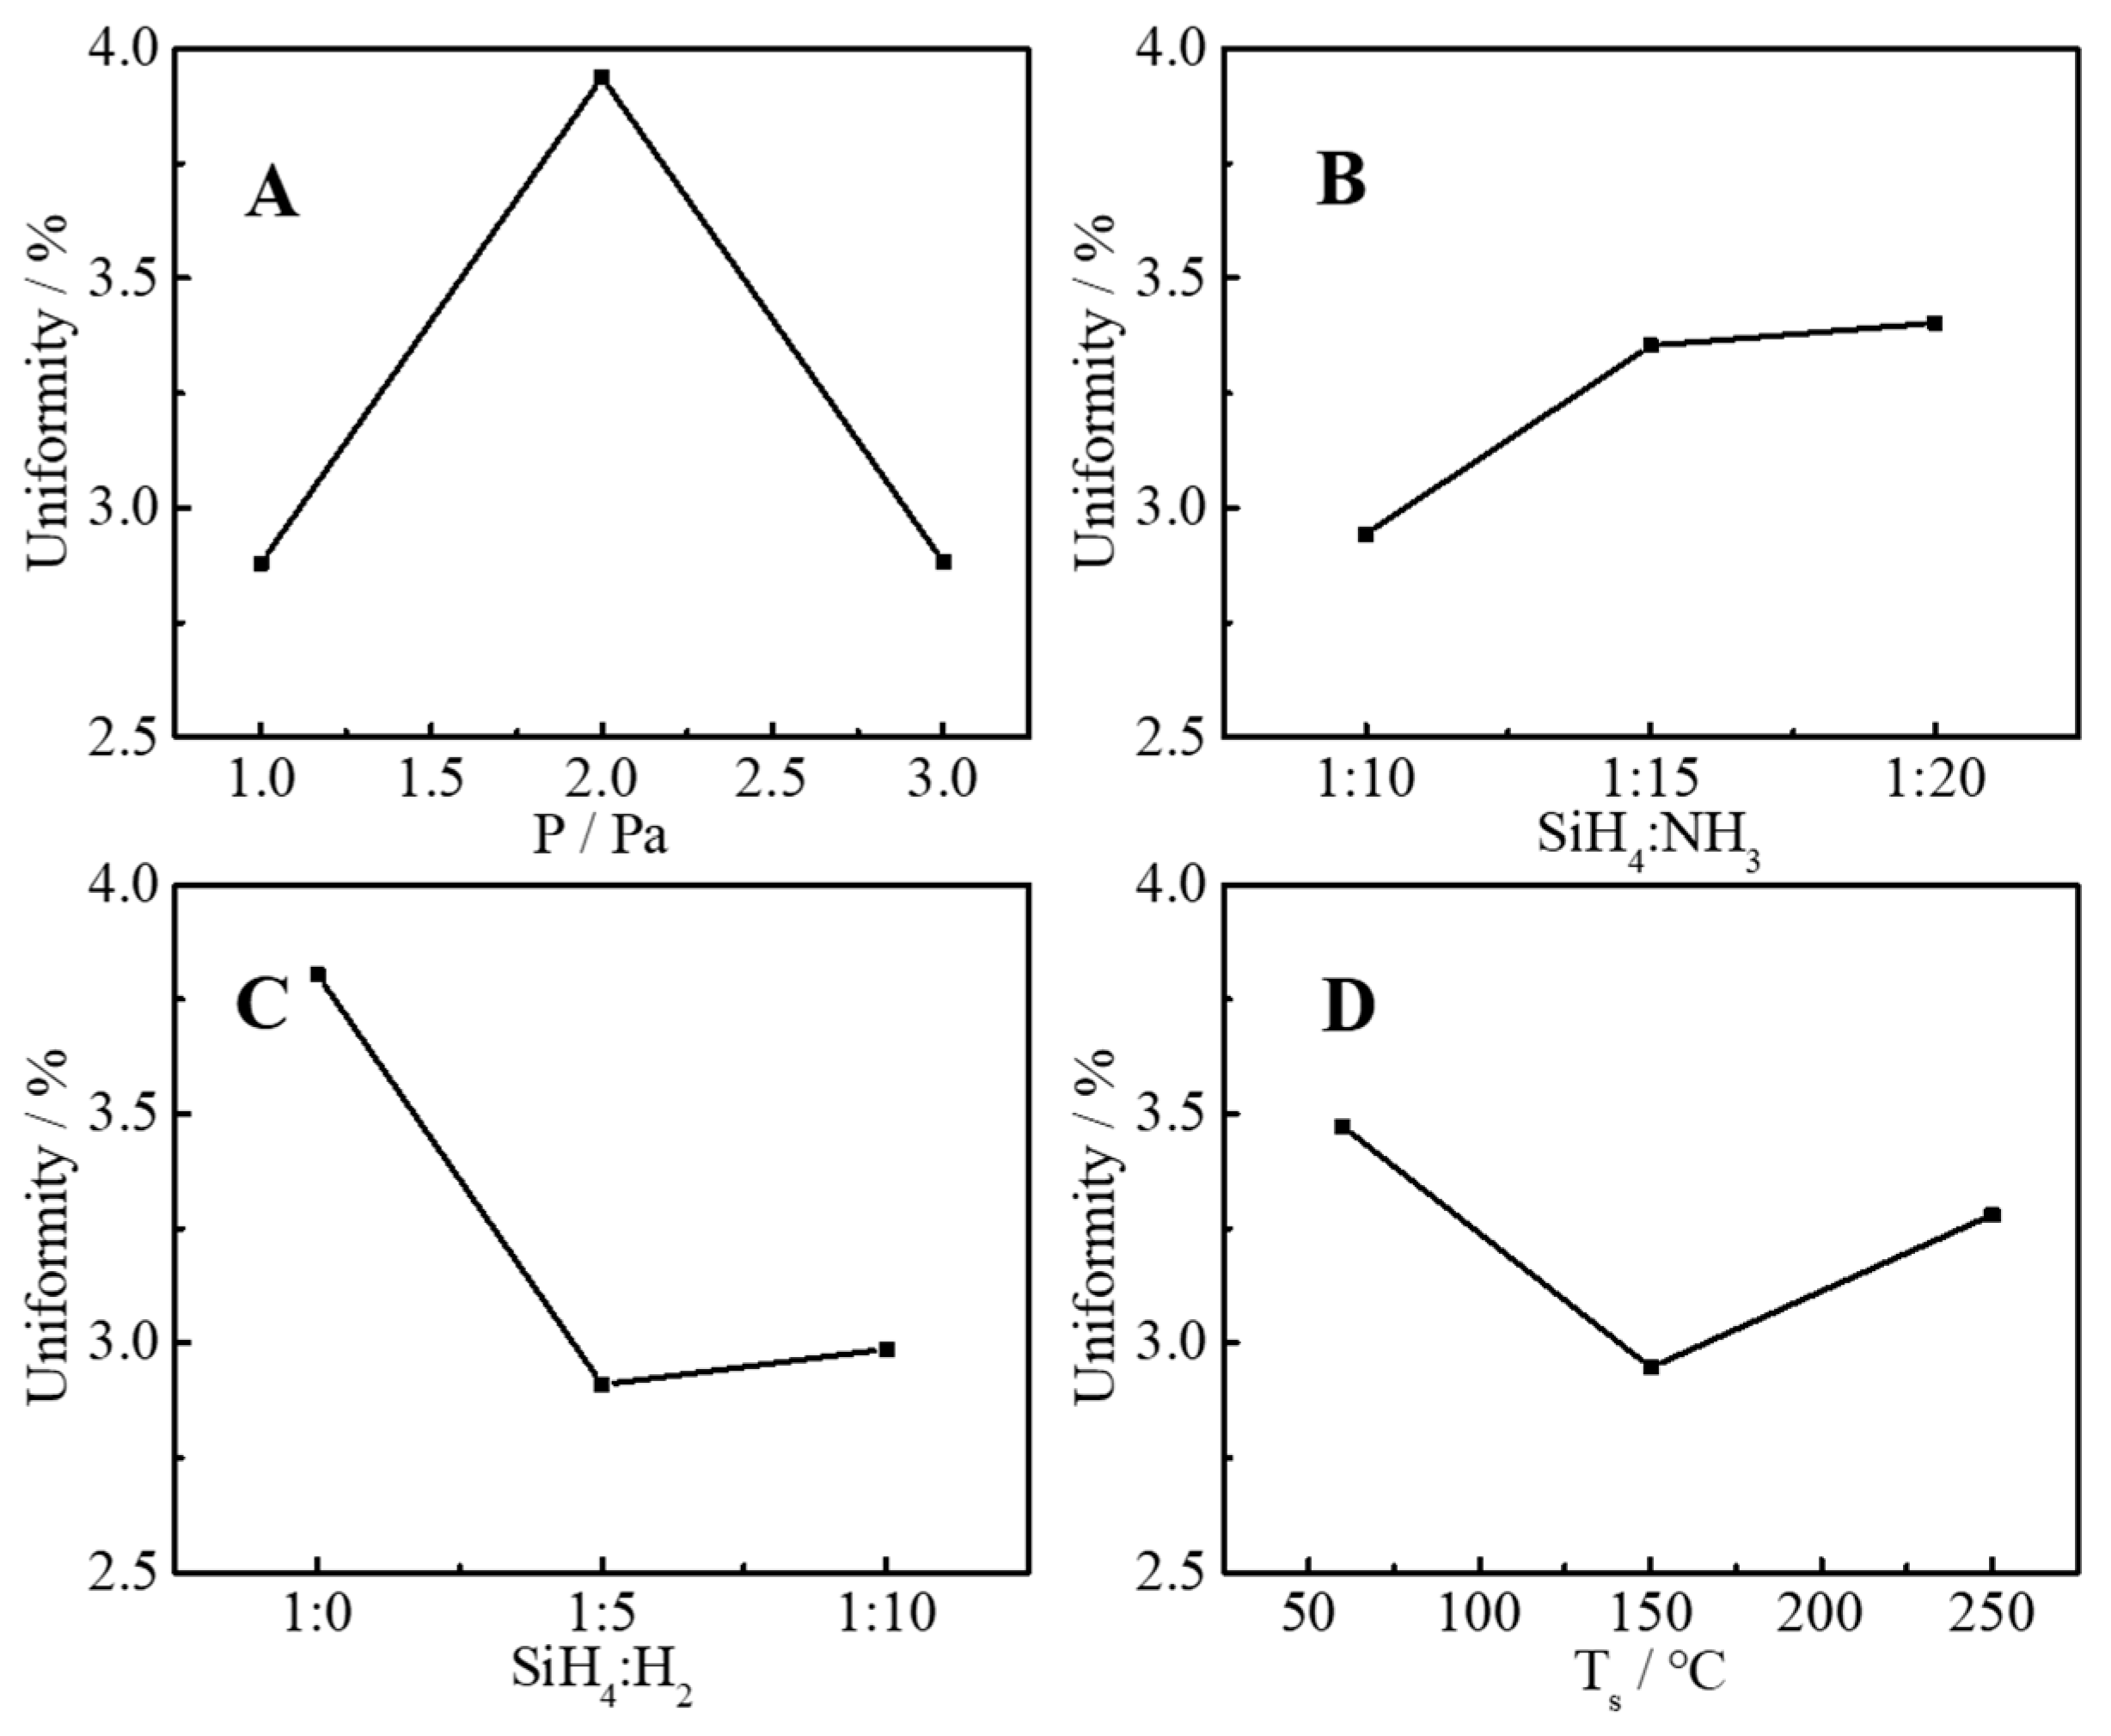
| Uniformity/% | P | 2.880 | 3.937 | 2.883 | 1.057 |
| SiH4:NH3 | 2.943 | 3.353 | 3.403 | 0.460 | |
| SiH4:H2 | 3.803 | 2.910 | 2.987 | 0.893 | |
| Ts | 3.473 | 2.947 | 3.280 | 0.526 | |
| Deposition rate/nm·s−1 | P | 0.257 | 0.250 | 0.300 | 0.050 |
| SiH4:NH3 | 0.293 | 0.260 | 0.253 | 0.040 | |
| SiH4:H2 | 0.273 | 0.260 | 0.273 | 0.013 | |
| Ts | 0.293 | 0.250 | 0.263 | 0.043 | |
| Response Parameter | Factors | SSD | PK/% | F |
|---|---|---|---|---|
| Refractive index | P | 0.156 | 9.43 | 0.377 |
| SiH4:NH3 | 1.123 | 67.94 | 2.717 | |
| SiH4:H2 | 0.188 | 11.38 | 0.455 | |
| Ts | 0.186 | 11.25 | 0.450 | |
| Extinction coefficient | P | 0.003 | 8.33 | 0.333 |
| SiH4:NH3 | 0.005 | 13.89 | 0.556 | |
| SiH4:H2 | 0.013 | 36.11 | 1.444 | |
| Ts | 0.015 | 41.67 | 1.667 | |
| Uniformity/% | P | 2.226 | 49.41 | 1.976 |
| SiH4:NH3 | 0.382 | 8.48 | 0.339 | |
| SiH4:H2 | 1.471 | 32.65 | 1.306 | |
| Ts | 0.426 | 9.46 | 0.378 | |
| Deposition rate/nm·s−1 | P | 0.004 | 40.00 | 1.600 |
| SiH4:NH3 | 0.003 | 30.00 | 1.200 | |
| SiH4:H2 | 0.000 | 0.00 | 0.000 | |
| Ts | 0.003 | 30.00 | 1.200 |
| No. | Element Content % | N/Si | |
|---|---|---|---|
| Si | N | ||
| 1 | 85.67 | 14.33 | 0.17 |
| 4 | 74.98 | 25.02 | 0.33 |
| 5 | 61.73 | 38.27 | 0.62 |
| 8 | 57.38 | 42.62 | 0.74 |
| 9 | 57.07 | 42.93 | 0.75 |
Disclaimer/Publisher’s Note: The statements, opinions and data contained in all publications are solely those of the individual author(s) and contributor(s) and not of MDPI and/or the editor(s). MDPI and/or the editor(s) disclaim responsibility for any injury to people or property resulting from any ideas, methods, instructions or products referred to in the content. |
© 2025 by the authors. Licensee MDPI, Basel, Switzerland. This article is an open access article distributed under the terms and conditions of the Creative Commons Attribution (CC BY) license (https://creativecommons.org/licenses/by/4.0/).
Share and Cite
Li, C.; Li, M.; Shi, J.; Huang, H.; Li, Z. Evaluation and Characterization of High-Uniformity SiNx Thin Film with Controllable Refractive Index by Home-Made Cat-CVD Based on Orthogonal Experiments. Molecules 2025, 30, 1091. https://doi.org/10.3390/molecules30051091
Li C, Li M, Shi J, Huang H, Li Z. Evaluation and Characterization of High-Uniformity SiNx Thin Film with Controllable Refractive Index by Home-Made Cat-CVD Based on Orthogonal Experiments. Molecules. 2025; 30(5):1091. https://doi.org/10.3390/molecules30051091
Chicago/Turabian StyleLi, Caifang, Minghui Li, Jinsong Shi, Haibin Huang, and Zhimei Li. 2025. "Evaluation and Characterization of High-Uniformity SiNx Thin Film with Controllable Refractive Index by Home-Made Cat-CVD Based on Orthogonal Experiments" Molecules 30, no. 5: 1091. https://doi.org/10.3390/molecules30051091
APA StyleLi, C., Li, M., Shi, J., Huang, H., & Li, Z. (2025). Evaluation and Characterization of High-Uniformity SiNx Thin Film with Controllable Refractive Index by Home-Made Cat-CVD Based on Orthogonal Experiments. Molecules, 30(5), 1091. https://doi.org/10.3390/molecules30051091