Article

Understanding the Role of Active Lattice Oxygen in CO Oxidation Catalyzed by Copper-Doped Mn2O3@MnO2

1
School of Mechanical Engineering, Tianjin Renai College, Tianjin 301636, China
2
State Key Joint Laboratory of Environment Simulation and Pollution Control, School of Environment, Tsinghua University, Beijing 100084, China
3
School of Environmental Science and Engineering, Tianjin University, Tianjin 300072, China
*
Authors to whom correspondence should be addressed.
These authors contributed equally to this work.
Molecules 2025, 30(4), 865; https://doi.org/10.3390/molecules30040865
Submission received: 16 January 2025 / Revised: 8 February 2025 / Accepted: 9 February 2025 / Published: 13 February 2025

Abstract

:
Although the hopcalite catalyst, primarily composed of manganese oxide and copper oxide, has been extensively studied for carbon monoxide (CO) elimination, there remains significant potential to optimize its structure and activity. Herein, Cu-doped Mn3O2@MnO2 catalysts featuring highly exposed interfacial regions were prepared. The correlation between interfacial exposure and catalytic activity indicates that the interfacial region serves as the active site for CO catalytic oxidation. The characteristic adsorption of CO by Cu species significantly enhances the catalytic activity of the catalyst. And XPS and ICP-OES analyses reveal that Cu ions coexist in both the interlayer and lattice of δ-MnO2. Furthermore, XPS analysis was employed to quantify the average oxidation state (AOS) of Mn and the molar ratios of oxygen species, demonstrating that both surface-adsorbed oxygen and surface lattice oxygen act as reactive oxygen species in the catalytic reaction, playing a crucial role in CO oxidation. Notably, the surface reactive oxygen species influence the adsorption of CO onto Cu species, and the replenishment of these reactive species is identified as the rate-limiting step in the CO catalytic oxidation process.

Graphical Abstract

1. Introduction

Carbon monoxide (CO), which has a strong affinity for hemoglobin, is one kind of toxic gas for humans [1]. The Air Quality Guidelines (AQGs) issued by the WHO in 2021 state that the indoor AQG level for CO should not exceed 4 mg/m3. Prolonged exposure to CO can lead to severe health issues, including neurological damage and cardiovascular diseases. Effectively removing CO is crucial for mitigating these risks, ensuring a safer environment, and improving public health. There are various technologies available for the removal of CO, and among them, the low-temperature catalytic removal of CO stands out as a particularly simple and efficient method. This approach not only effectively reduces CO levels, but also operates under milder temperature conditions, making it a practical choice for various applications.
In the past few decades, significant efforts have been dedicated to the development of high-performance catalytic materials. Noble metal catalysts, such as gold, platinum, silver, and palladium, have garnered extensive attention due to their exceptional catalytic properties and moisture resistance [2,3,4,5,6]. Researchers have made considerable strides in understanding single atom and nanoparticle catalysis, leading to advancements in various applications. However, the high cost of these noble metals, coupled with the stringent conditions required for their preparation, pose substantial challenges for their practical use in everyday applications. As a result, the design and development of non-noble metal catalysts with excellent performance have become a central focus for researchers in the field. Among various non-noble metal catalysts, hopcalite catalyst (manganese oxide and copper oxide as the main components) has been widely explored to eliminate CO and show remarkable catalytic performance [7,8,9,10]. Hopcalite catalysts are currently widely used as commercial catalysts for catalytic CO removal. However, they also have some limitations, including poor catalytic activity and deactivation upon exposure to moisture. Despite their effectiveness in CO oxidation under certain conditions, their performance can degrade significantly when exposed to water or under less-than-ideal operating environments [8]. This has led to ongoing research aimed at improving the stability and efficiency of hopcalite catalysts, focusing on enhancing their resistance to moisture and increasing their overall catalytic activity for their broader application in environmental and industrial processes.
Although the hopcalite catalyst demonstrates potential for CO oxidation, its performance remains constrained by an unclear structure–activity relationship. Research indicates that several factors, such as crystal phase, the ratio of cations with different valence states, and the exposed surface facets, can have a substantial impact on the performance of catalysts [11,12,13]. However, the structure–activity relationship of these catalysts remains inadequately understood, highlighting a crucial area for further investigation. Moreover, it has been observed that the reactive oxygen species generated by different catalysts can vary significantly depending on the target pollutants being addressed [14]. Therefore, synthesizing catalysts with high active regions and abundant reactive oxygen species is not only a promising avenue for improving catalytic efficiency, but also represents a meaningful contribution to the advancement of environmental remediation technologies.
The mismatch in lattice constants between different materials often leads to the formation of numerous defects at the interface of the heterojunction. These defects, such as dislocations, vacancies, and interstitials, can play a significant role in modulating the electronic properties of the materials involved [15,16,17,18,19,20]. In catalytic applications, the presence of these defects can provide additional active sites that enhance the reactivity of the catalyst, improving its overall performance. In addition, these defects can also enrich active oxygen species and increase the material’s surface area, all of which are critical factors in enhancing catalytic activity. In recent years, researchers have synthesized catalysts with heterojunction structures and investigated the catalytic activity of the heterojunction interface [21,22]. Moreover, recent studies have shown that CO oxidation activity is closely linked to the presence of Cu+ carbonyl species [23,24,25,26,27], and that the characteristic adsorption of CO by Cu+ enhances the catalytic activity of the catalyst. Additionally, the synthesis of highly dispersed Cu species has been recognized as an effective approach to improving catalyst performance [28,29].
In this study, heterogeneous catalysts with highly exposed interfacial regions were synthesized through a redox reaction between KMnO4 and Mn2O3, and catalysts with different Cu content were obtained by adding Cu(NO3)2 into the reaction system. Scanning electron microscopy (SEM) was employed to analyze the morphology and interfacial exposure of the catalysts, allowing us to establish a relationship between interfacial exposure and catalytic activity. Based on the correlation between the content of surface-adsorbed oxygen (as determined by X-ray photoelectron spectroscopy, XPS) and catalytic activity, along with the interactions of surface-adsorbed oxygen and surface lattice oxygen with CO (assessed through temperature-programmed desorption, CO-TPD), this study provides a detailed discussion of the reactive oxygen species involved in the CO oxidation process.

2. Results and Discussion

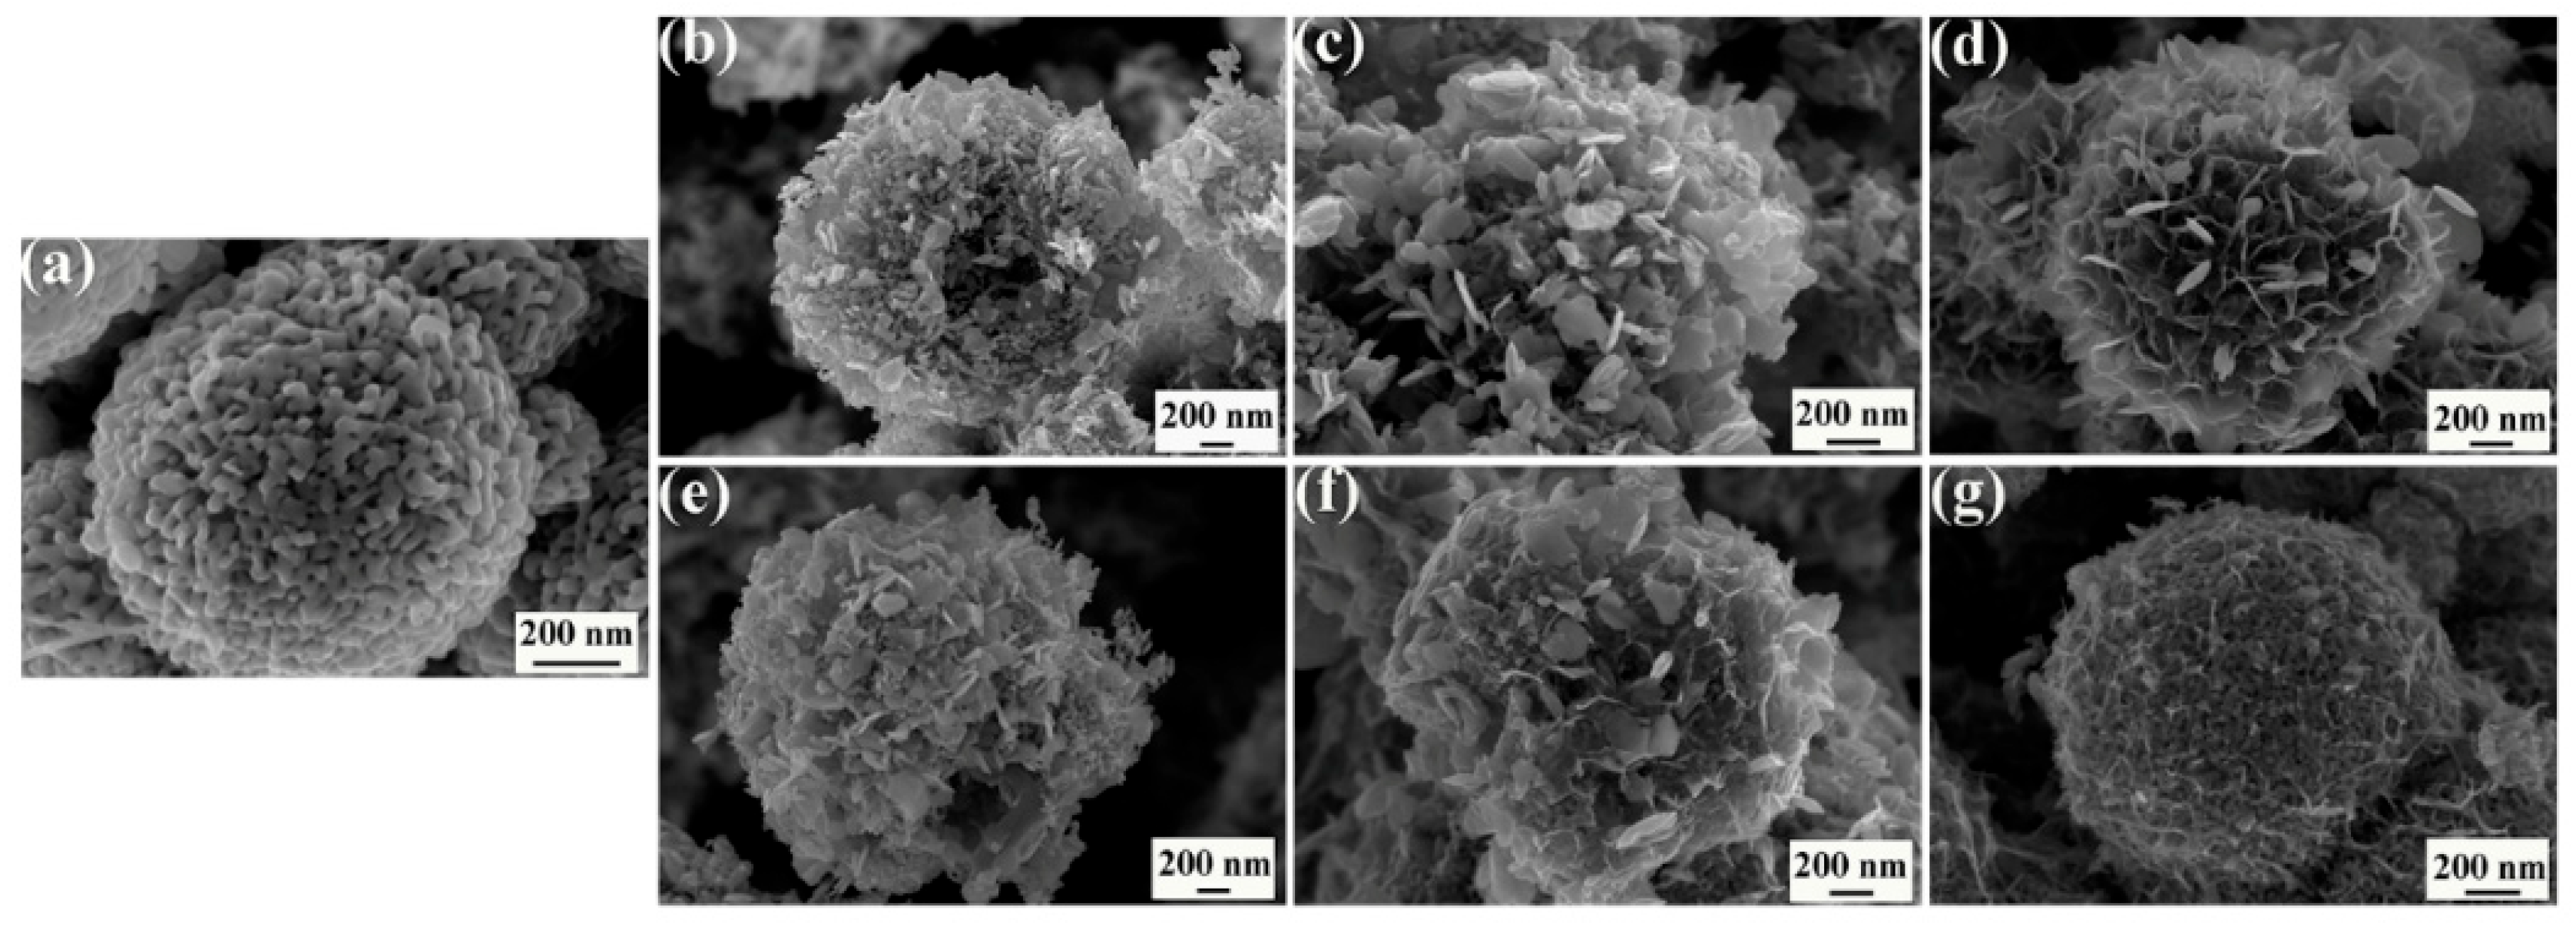
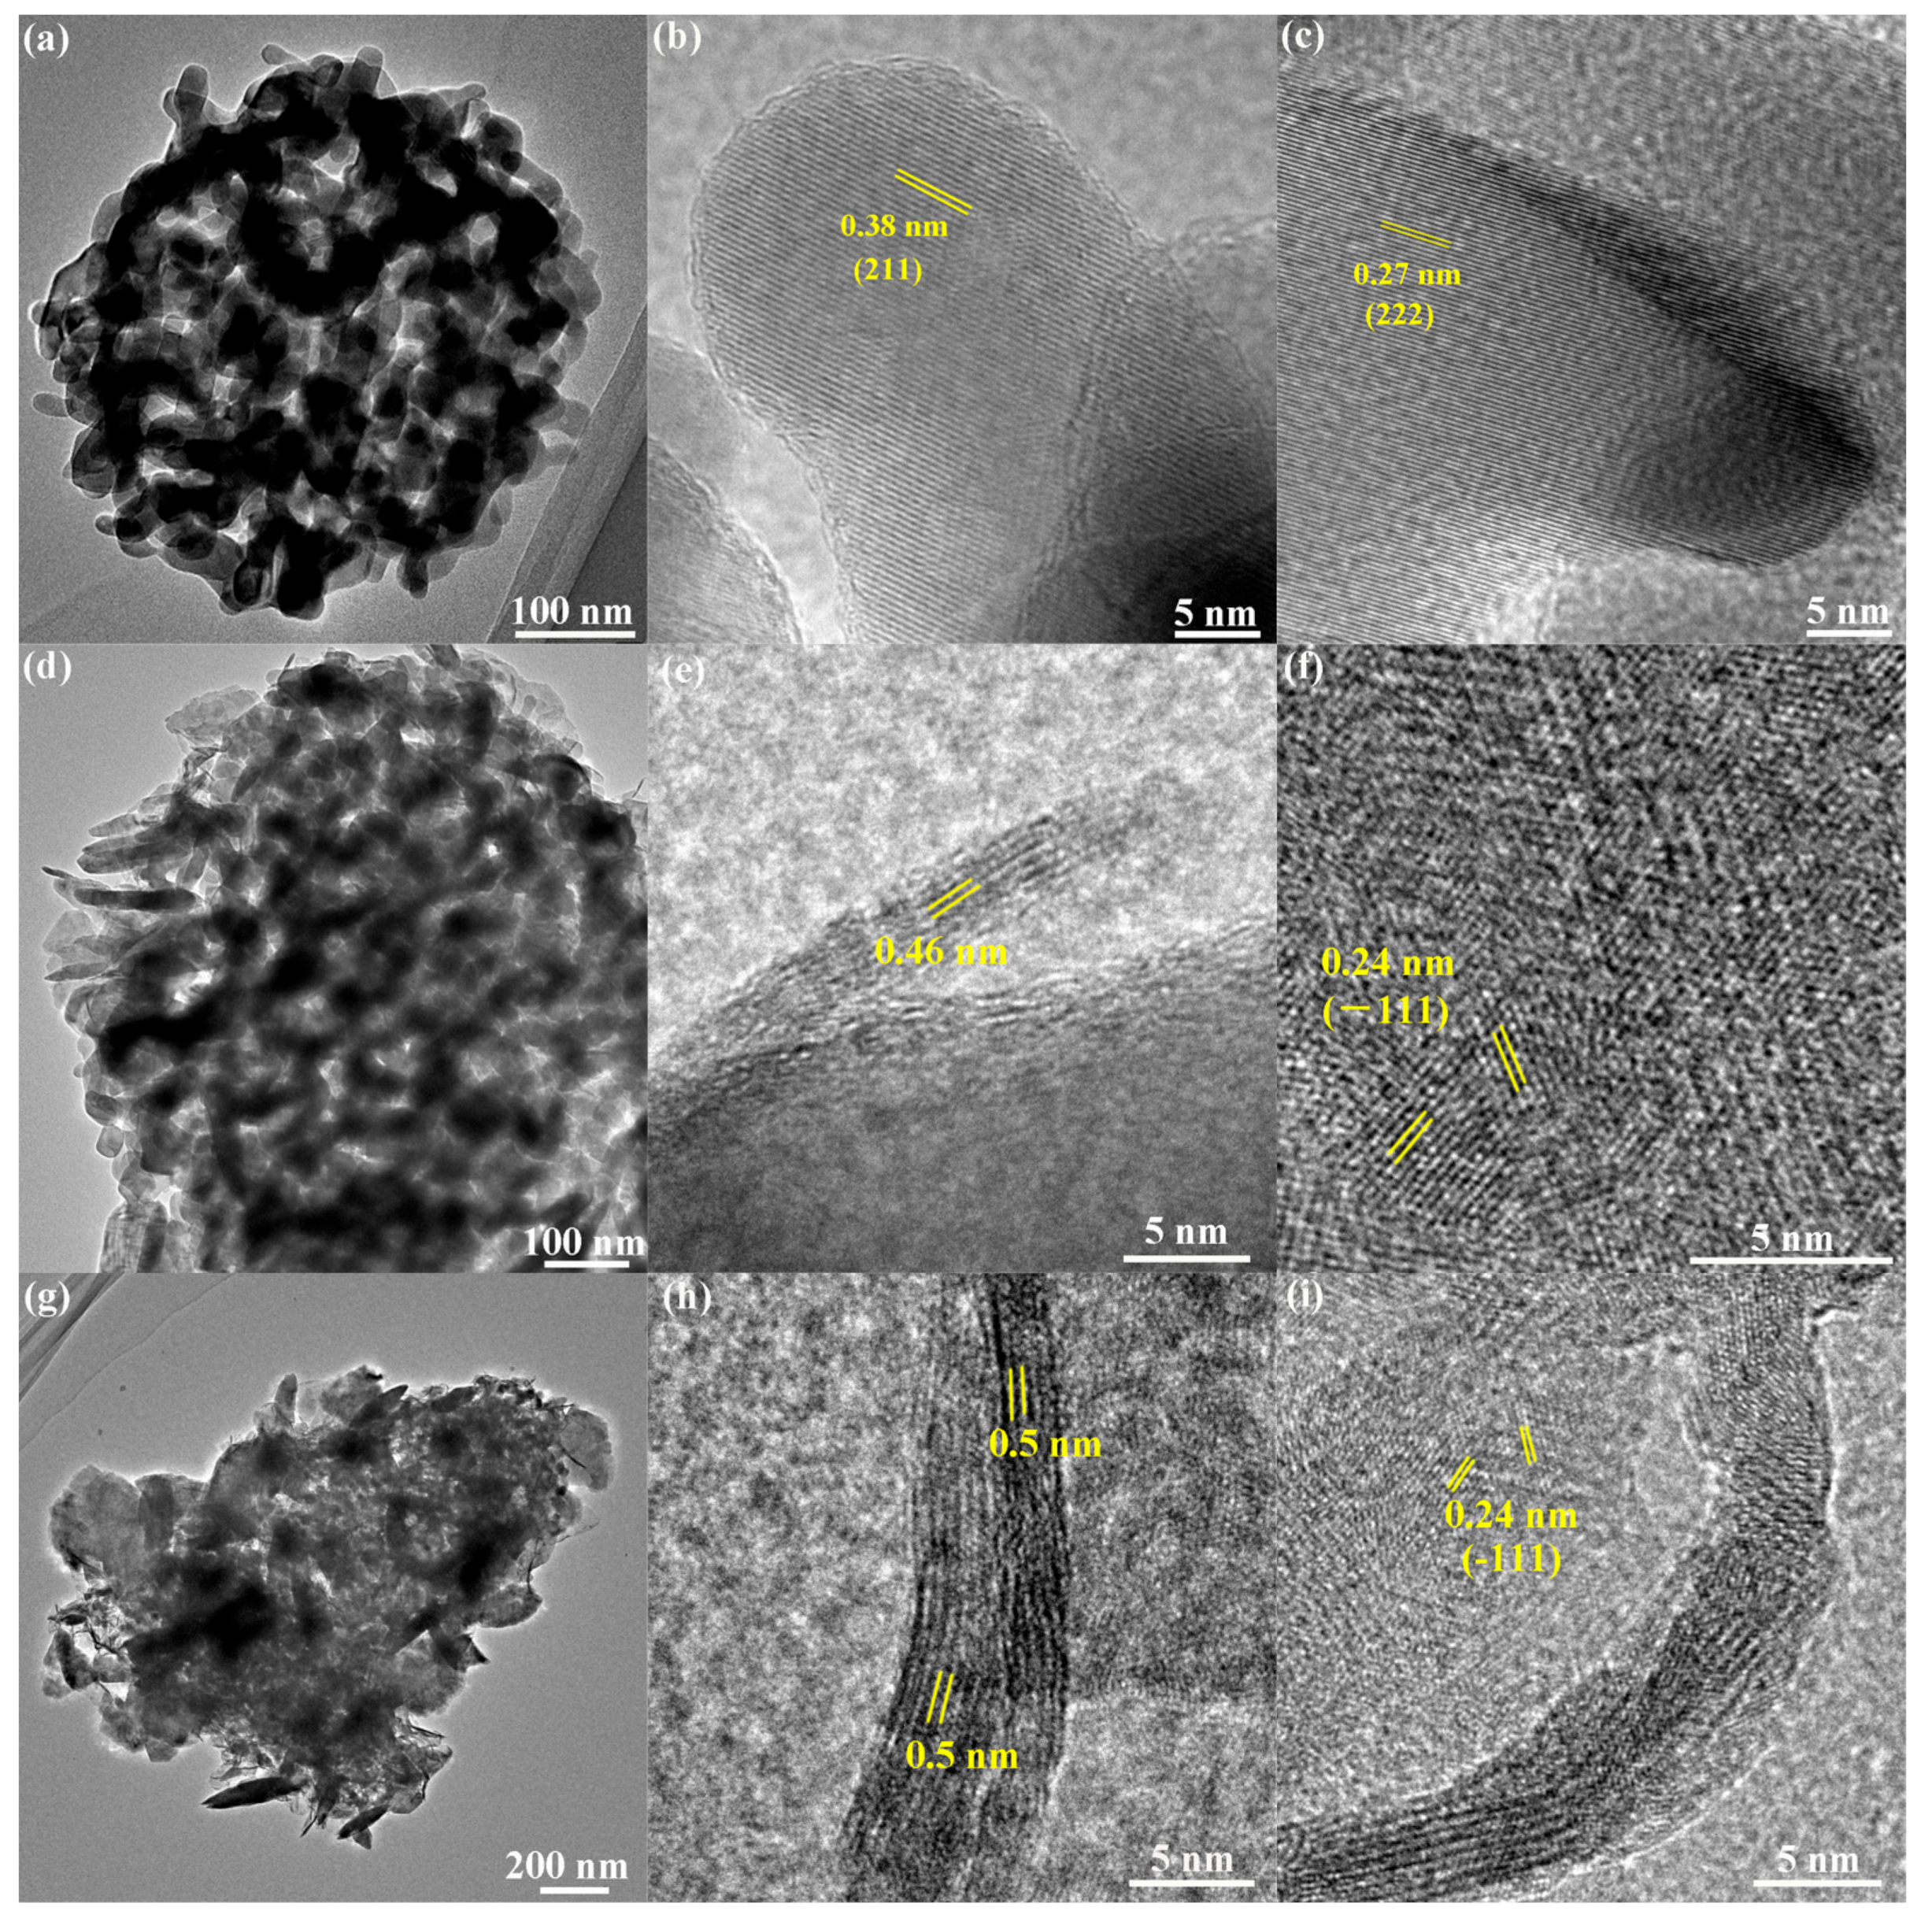
2.1. Crystal Structure and Morphology

Upon heating to high temperatures in the presence of air, MnCO3 reacts with O2 to produce Mn2O3, releasing CO2 (Equation (1)). Then, MnO2 is grown over Mn2O3 through a redox reaction between Mn2O3 and KMnO4 under acidic conditions (Equation (2)). When copper nitrate is added to the reaction solution, Cu ions are doped into the MnO2 as the redox reaction goes on.
M n C O 3 + O 2 M n O 2 + C O 2
M n 2 O 3 + H + + M n O 4 M n O 2 + H 2 O
The catalysts are labeled numerically (e.g., 0.04, 0.2, 0.7, 1Cu, 10Cu, and 50Cu) based on the molar ratios of key precursors used in their synthesis. A detailed description of the naming convention is provided in Section 3.2.2 and Section 3.2.3.
To investigate the phase structures of the synthesized Mn2O3 and MnO2, XRD patterns of the catalysts are tested and shown in Figure 1. The diffraction peaks marked with circles match well with JCPDS 41-1442 (bixbyite). The diffraction peak marked with star (2θ = 37.3°) is well indexed to (−111) of δ-MnO2 according to the standard card PDF# 80-1098. Characteristic peaks of Mn2O3 are presented in all XRD patterns of the samples, indicating an excess of Mn2O3 in the redox reaction between Mn2O3 and KMnO4. Notably, the (−111) characteristic peak for Mn2O3@MnO2-0.7 is weaker than that for Mn2O3@MnO2-0.2 (Figure 1a), suggesting a significant decrease in the crystallization quality of δ-MnO2 with increasing amounts of KMnO4 in the reaction system. Furthermore, the (−111) characteristic peak of the samples decreases when increasing the mass of Cu(NO3)2·3H2O in the reaction system, indicating that Cu doping adversely affects the crystallinity of δ-MnO2.
Figure 2 shows the SEM images of the prepared samples. As shown in Figure 2a, Mn2O3 exhibits a porous spherical morphology, which serves as an important structural foundation for the subsequent growth of δ-MnO2. In Figure 2b,c, it can be observed that the δ-MnO2 nanosheets are oriented almost perpendicular to the surface of Mn2O3, with their morphology varying significantly depending on the extent of the redox reaction, while the mesoporous spherical structure of Mn2O3 remains distinctly observable. When the KMnO4 increases to a certain extent in the reaction solution, the δ-MnO2 nanosheets adopt a flower-like morphology (Figure 2d). This alteration in morphology severely affects the exposure of Mn2O3, and markedly reduces the accessibility of the interface between Mn2O3 and δ-MnO2. In addition, the incorporation of Cu ions has a significant impact on the morphology of δ-MnO2. As shown in Figure 2e,f, the δ-MnO2 nanosheets become thinner with the incorporation of Cu ions. And when the Cu(NO3)2·3H2O increases to a certain extent in the reaction solution, most of the δ-MnO2 nanosheets fall down (Figure 2g), and it also seriously influences the exposure of the interface between Mn2O3 and δ-MnO2.
HRTEM images were taken to further investigate the lattice parameters of δ-MnO2, as depicted in Figure 3. The regularly arranged lattice fringes of 0.38 nm and 0.27 nm in Figure 3b,c correspond to the interplanar distances of the (211) and (222) facets of Mn2O3, respectively. The crystalline quality of δ-MnO2 is poor, while the lattice fringes of 0.24 nm corresponding to the interplanar distances of (−111) can be vaguely observed. This observation is consistent with the findings from XRD analysis. Moreover, δ-MnO2 has a lamellar structure formed by [MnO6] octahedral, and the interbedded cations and water molecules maintain the stability of the layered structure. As shown in Figure 3e,h, the interplanar distances of (001) facet of δ-MnO2 are 0.46 nm and 0.5 nm, which are smaller than previous reports [30,31,32,33]. Figure S1 displays the TEM images of the Mn2O3@MnO2-10Cu sample before and after 350 °C treatment, and it proves that the smaller interplanar distance of (001) facet of δ-MnO2 is caused by heat treatment. The following factor may be responsible for the above phenomenon: a large amount of interlayer water was removed (as illustrated in Figure S2), and the collapse of the interlayer structure occurred in the roasting process, resulting in the reduction in layer spacing.

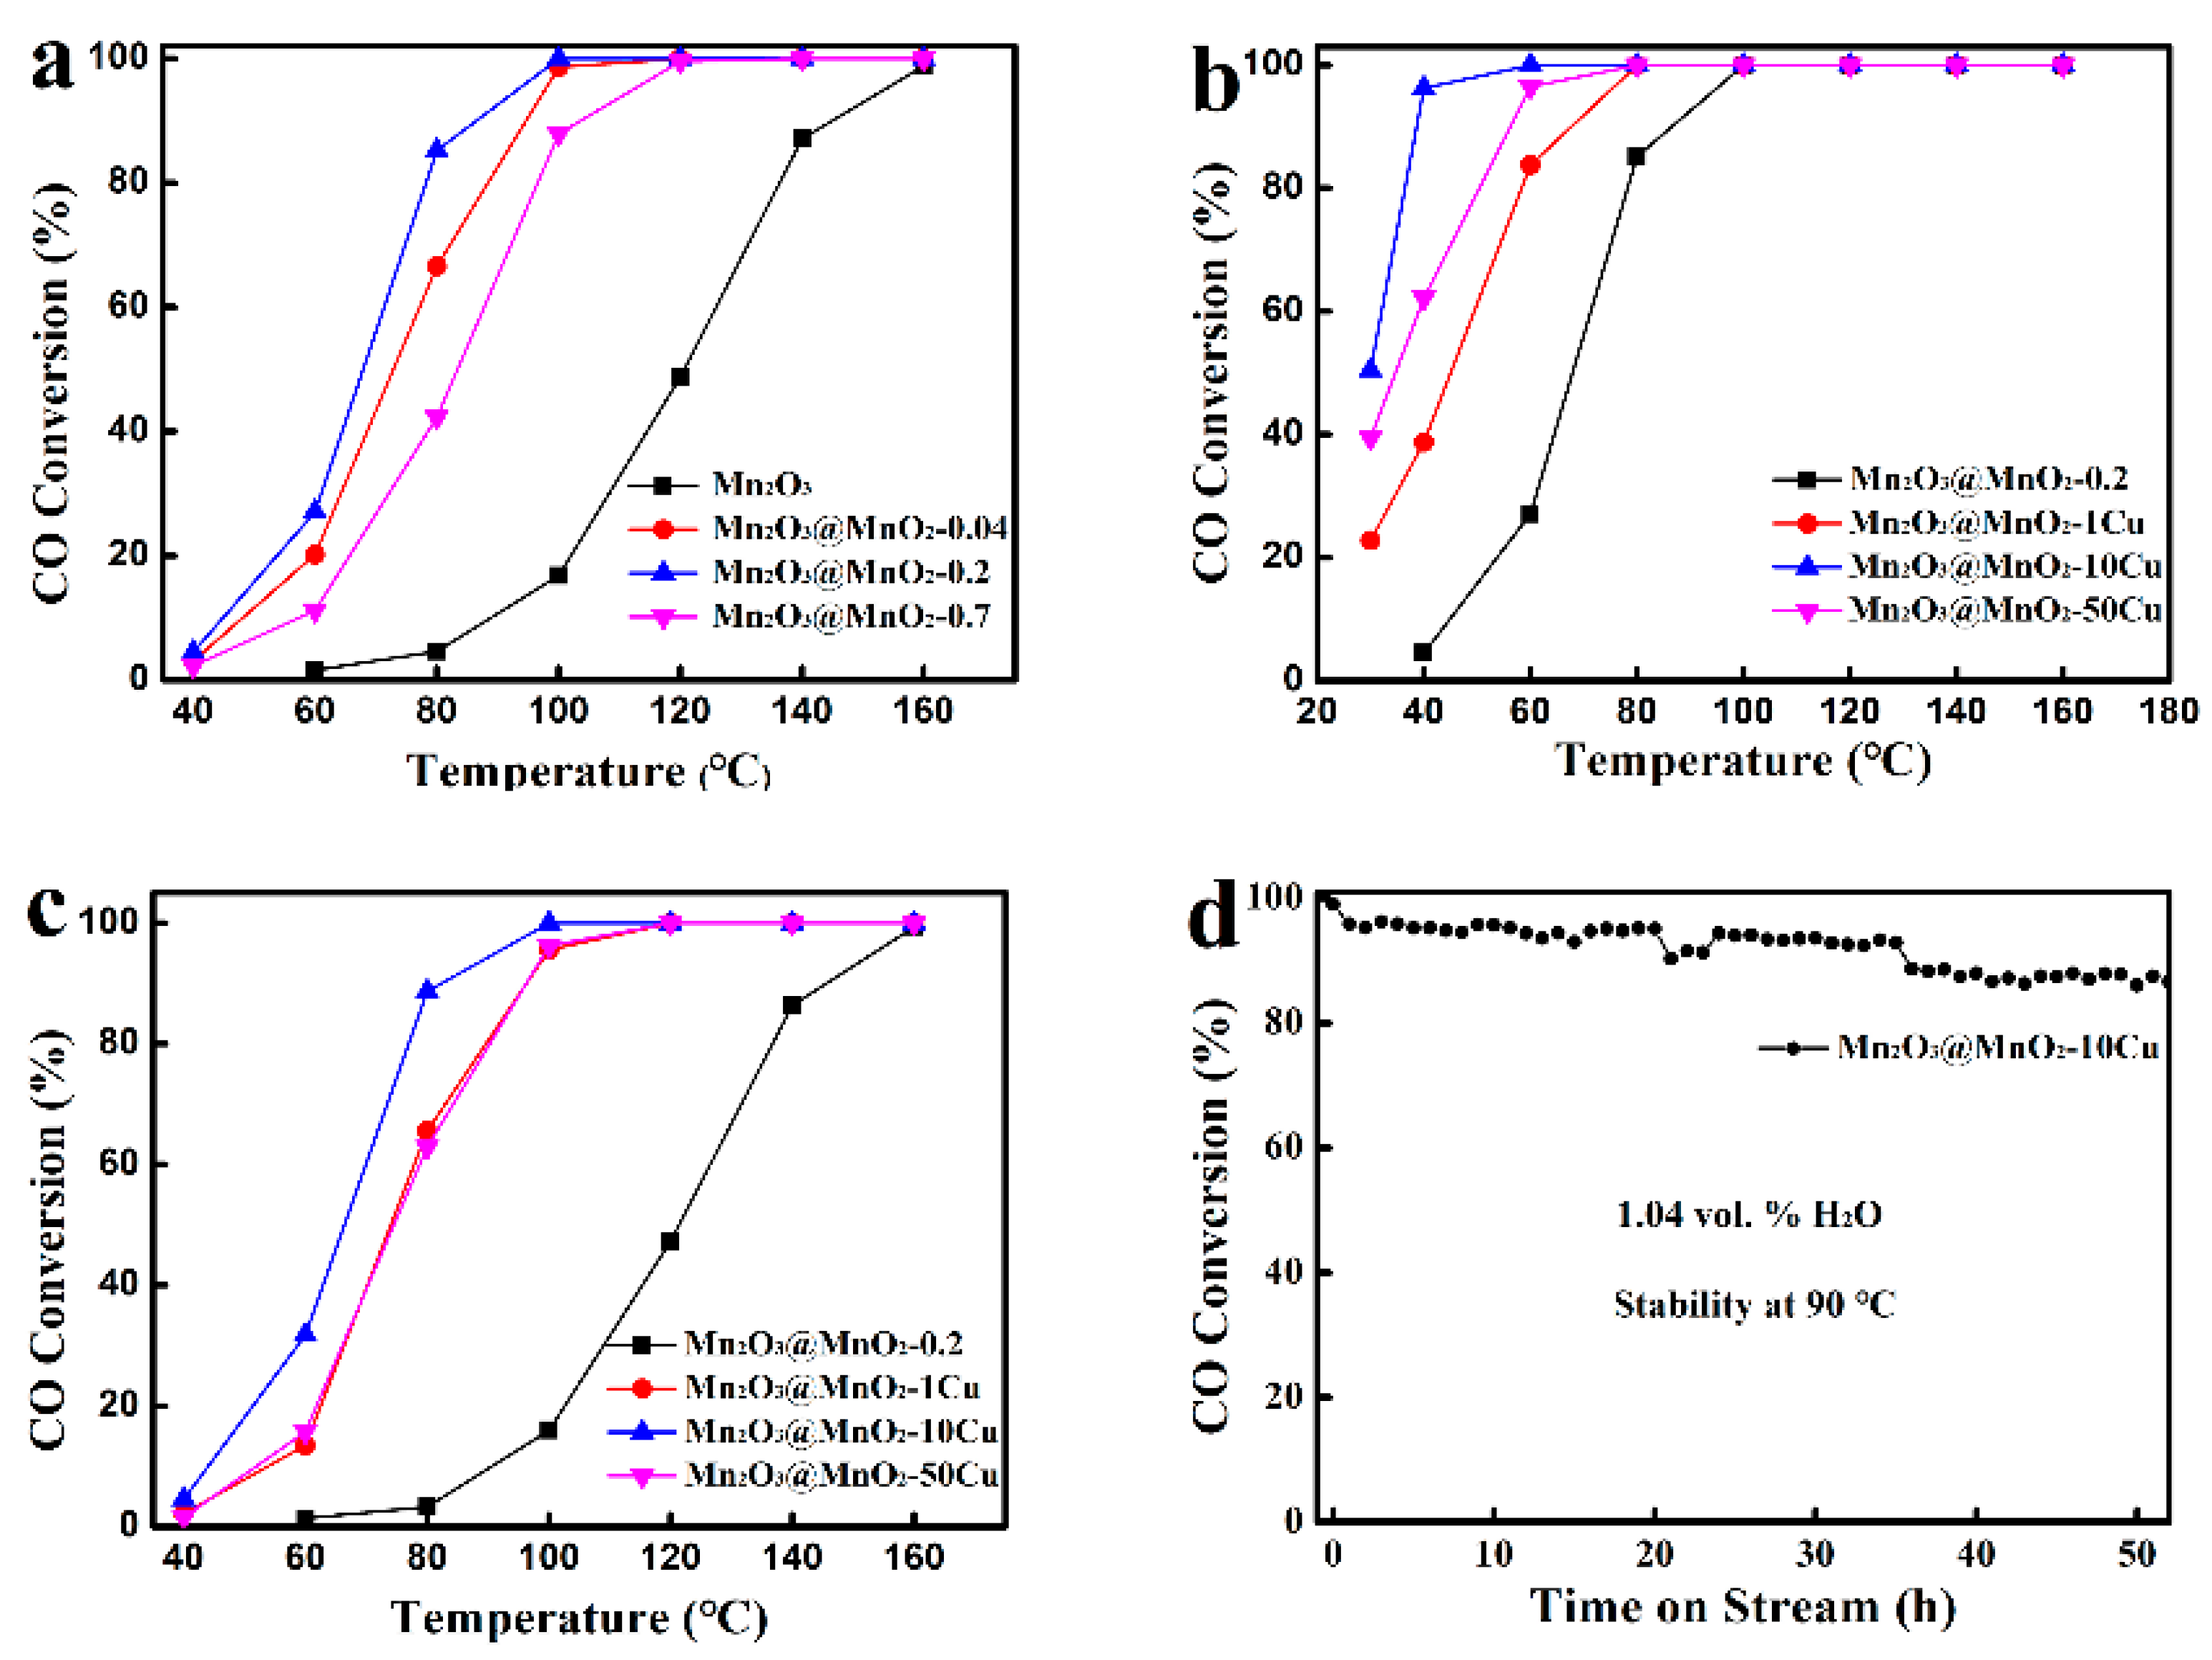
2.2. Catalytic Activity for CO Oxidation

The catalytic performance of prepared samples for CO catalytic oxidation was investigated, as shown in Figure 4. By increasing the amount of δ-MnO2 formation over Mn2O3, the Mn2O3@MnO2 catalysts exhibit “volcanic” characteristics (Figure 4a). Notably, Mn2O3@MnO2-0.2 exhibits better catalytic performance than Mn2O3 and Mn2O3@MnO2-0.7, which is fully covered with δ-MnO2. This suggests that neither δ-MnO2 nor Mn2O3 serves as the primary active species in CO catalytic oxidation. The correlation between the exposure of the interface region and the catalytic activity should be noted, and the interface region is considered to be the active region for CO catalytic oxidation. Additionally, the influence of Cu doping on the performance of Mn2O3@MnO2 was studied. As the Cu content in the Mn2O3@MnO2 catalyst increased, the performance of the catalyst also exhibited “volcanic” characteristics (Figure 4b). Specifically, the introduction of a small amount of Cu2+ into the catalyst resulted in a decrease in the complete conversion temperature of CO, indicating that Cu2+ enhances the catalytic oxidation of CO. However, excessive Cu doping adversely affected the morphology of δ-MnO2 (as shown in Figure 2g) and the exposure of the interface region, leading to a decline in catalytic performance. This further corroborates the notion that the interface region is the active site for CO catalytic oxidation.
Up to now, it has always been a challenge to enhance the moisture resistance and durability of the catalyst. Based on this, we investigated the moisture resistance of the catalyst in the presence of 1.04 vol.% H2O. Although the catalysts exhibited reduced catalytic activity compared to dry conditions, they still maintained catalytic performance (Figure 4c). As illustrated in Figure S3, ΔT100 of Mn2O3@MnO2-10Cu is 40 °C, and that of Mn2O3@MnO2-0.2 is about 60 °C (T100 denotes the temperature at which the CO conversion reached 100%, and the difference between T100 under dry and wet conditions is expressed as ΔT100). This indicates that the incorporation of Cu2+ improves the moisture resistance of the catalyst to a certain extent. As shown in Figure 4d, there is a decrease in the CO conversion rate over 50 h of testing, but it can still reach 88% at the end of our testing, indicating that the Mn2O3@MnO2-10Cu catalyst has excellent water resistance under this moisture level.

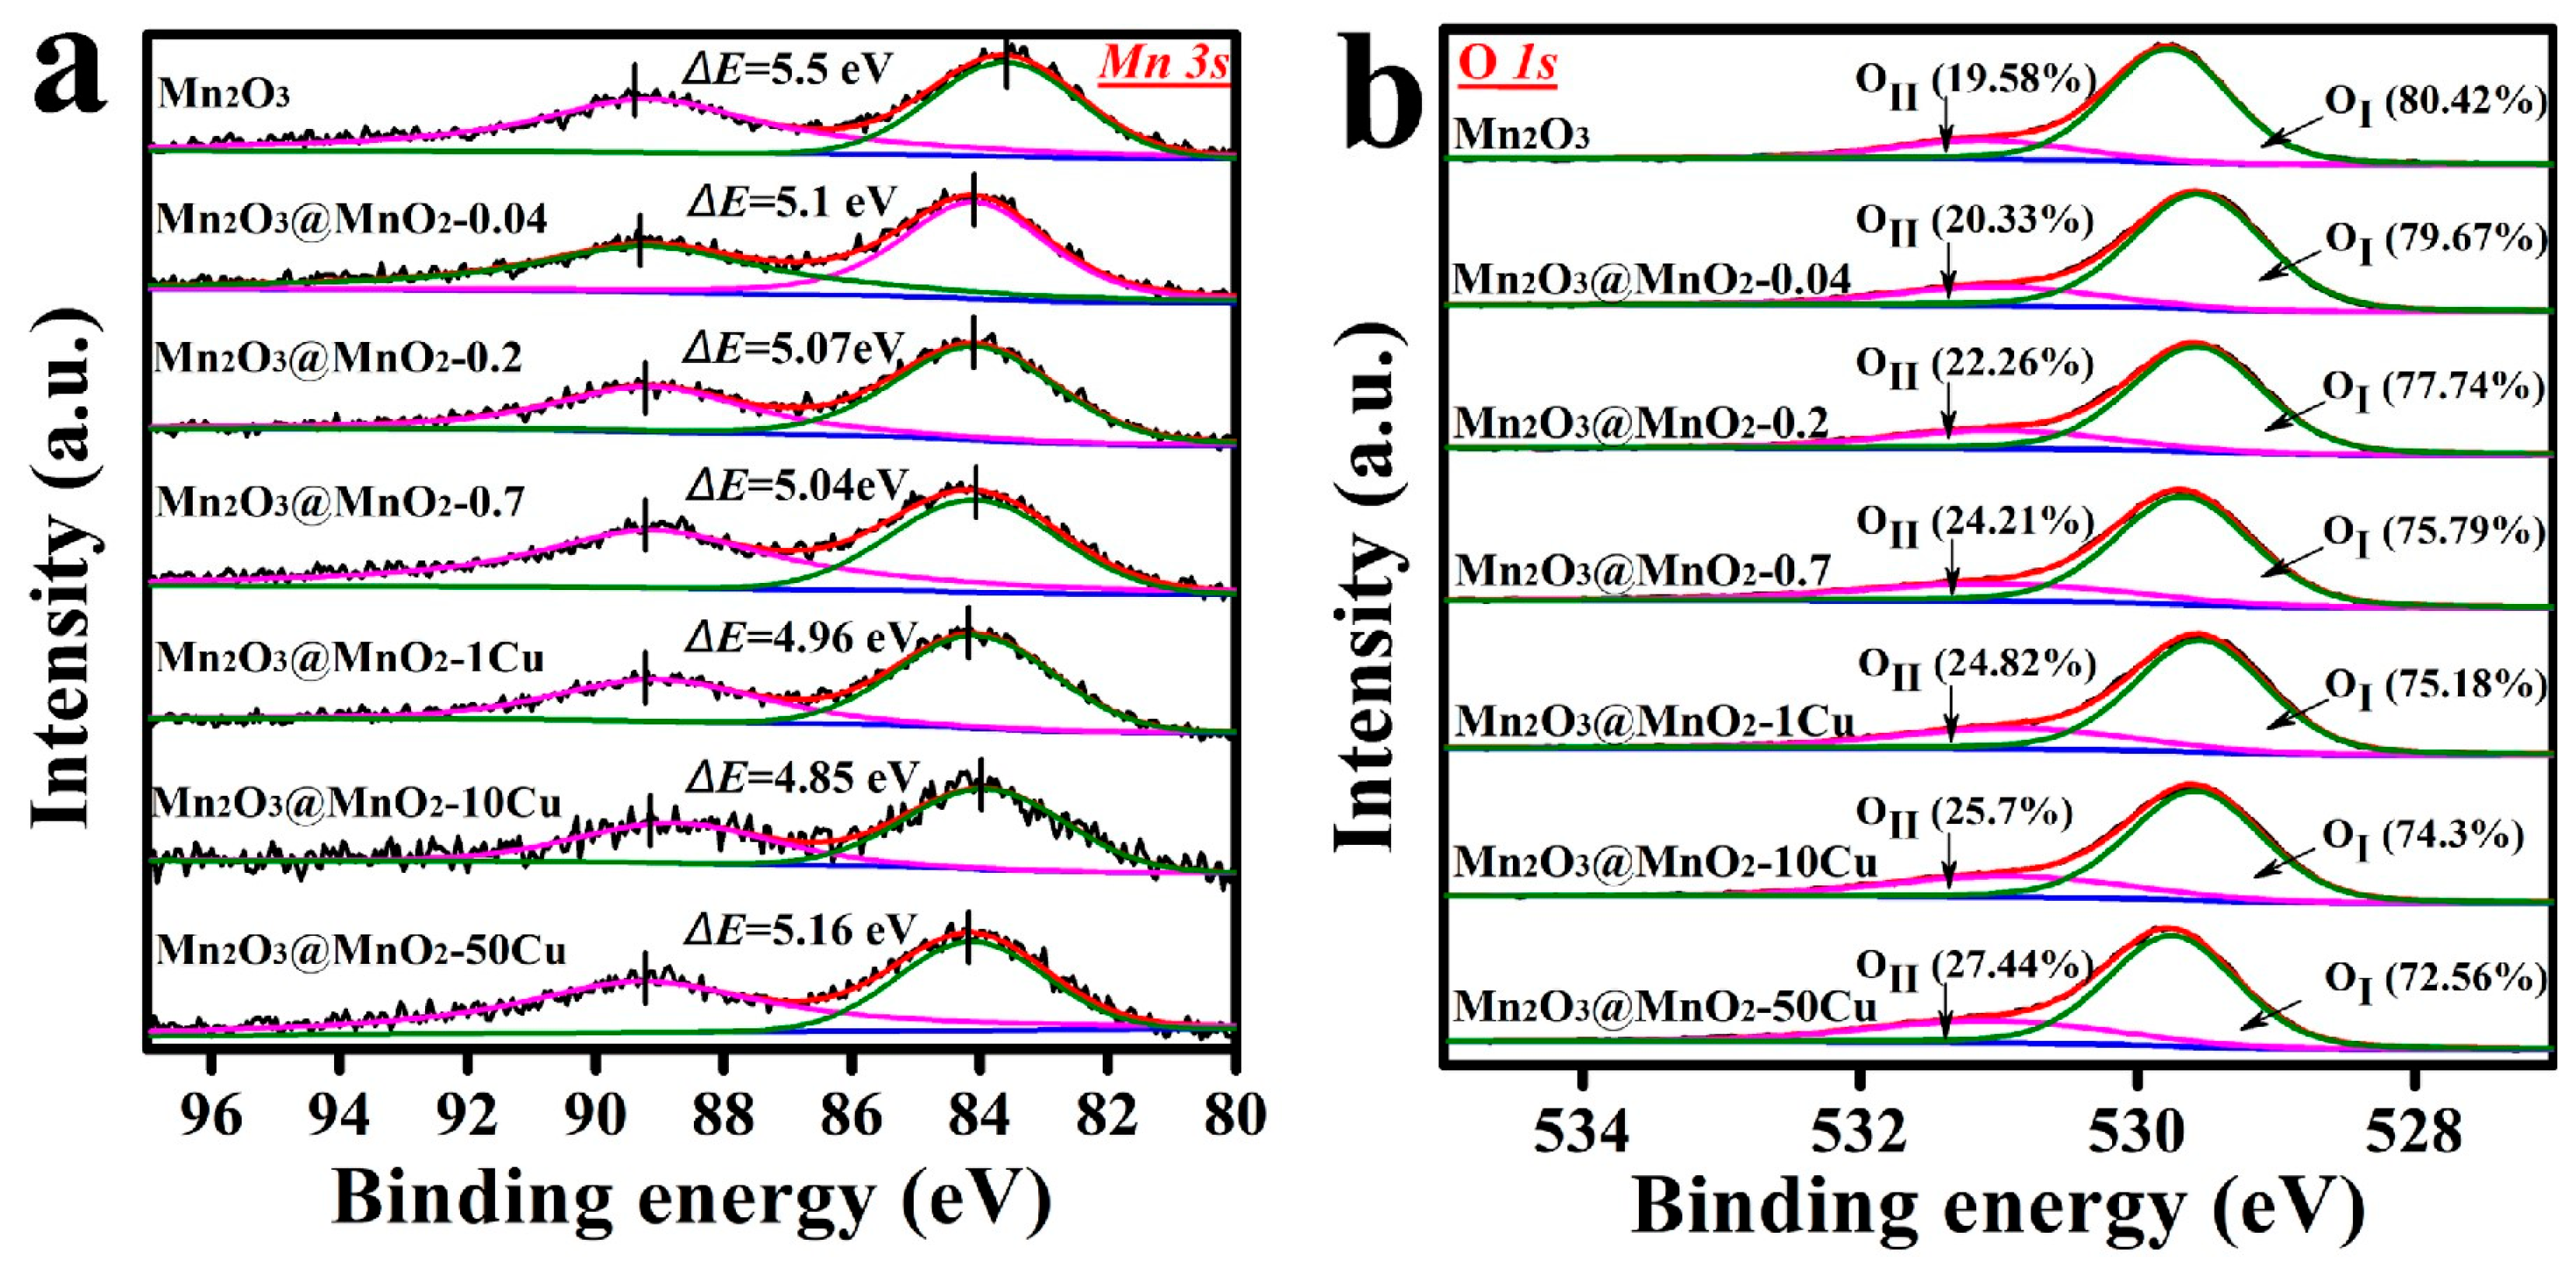
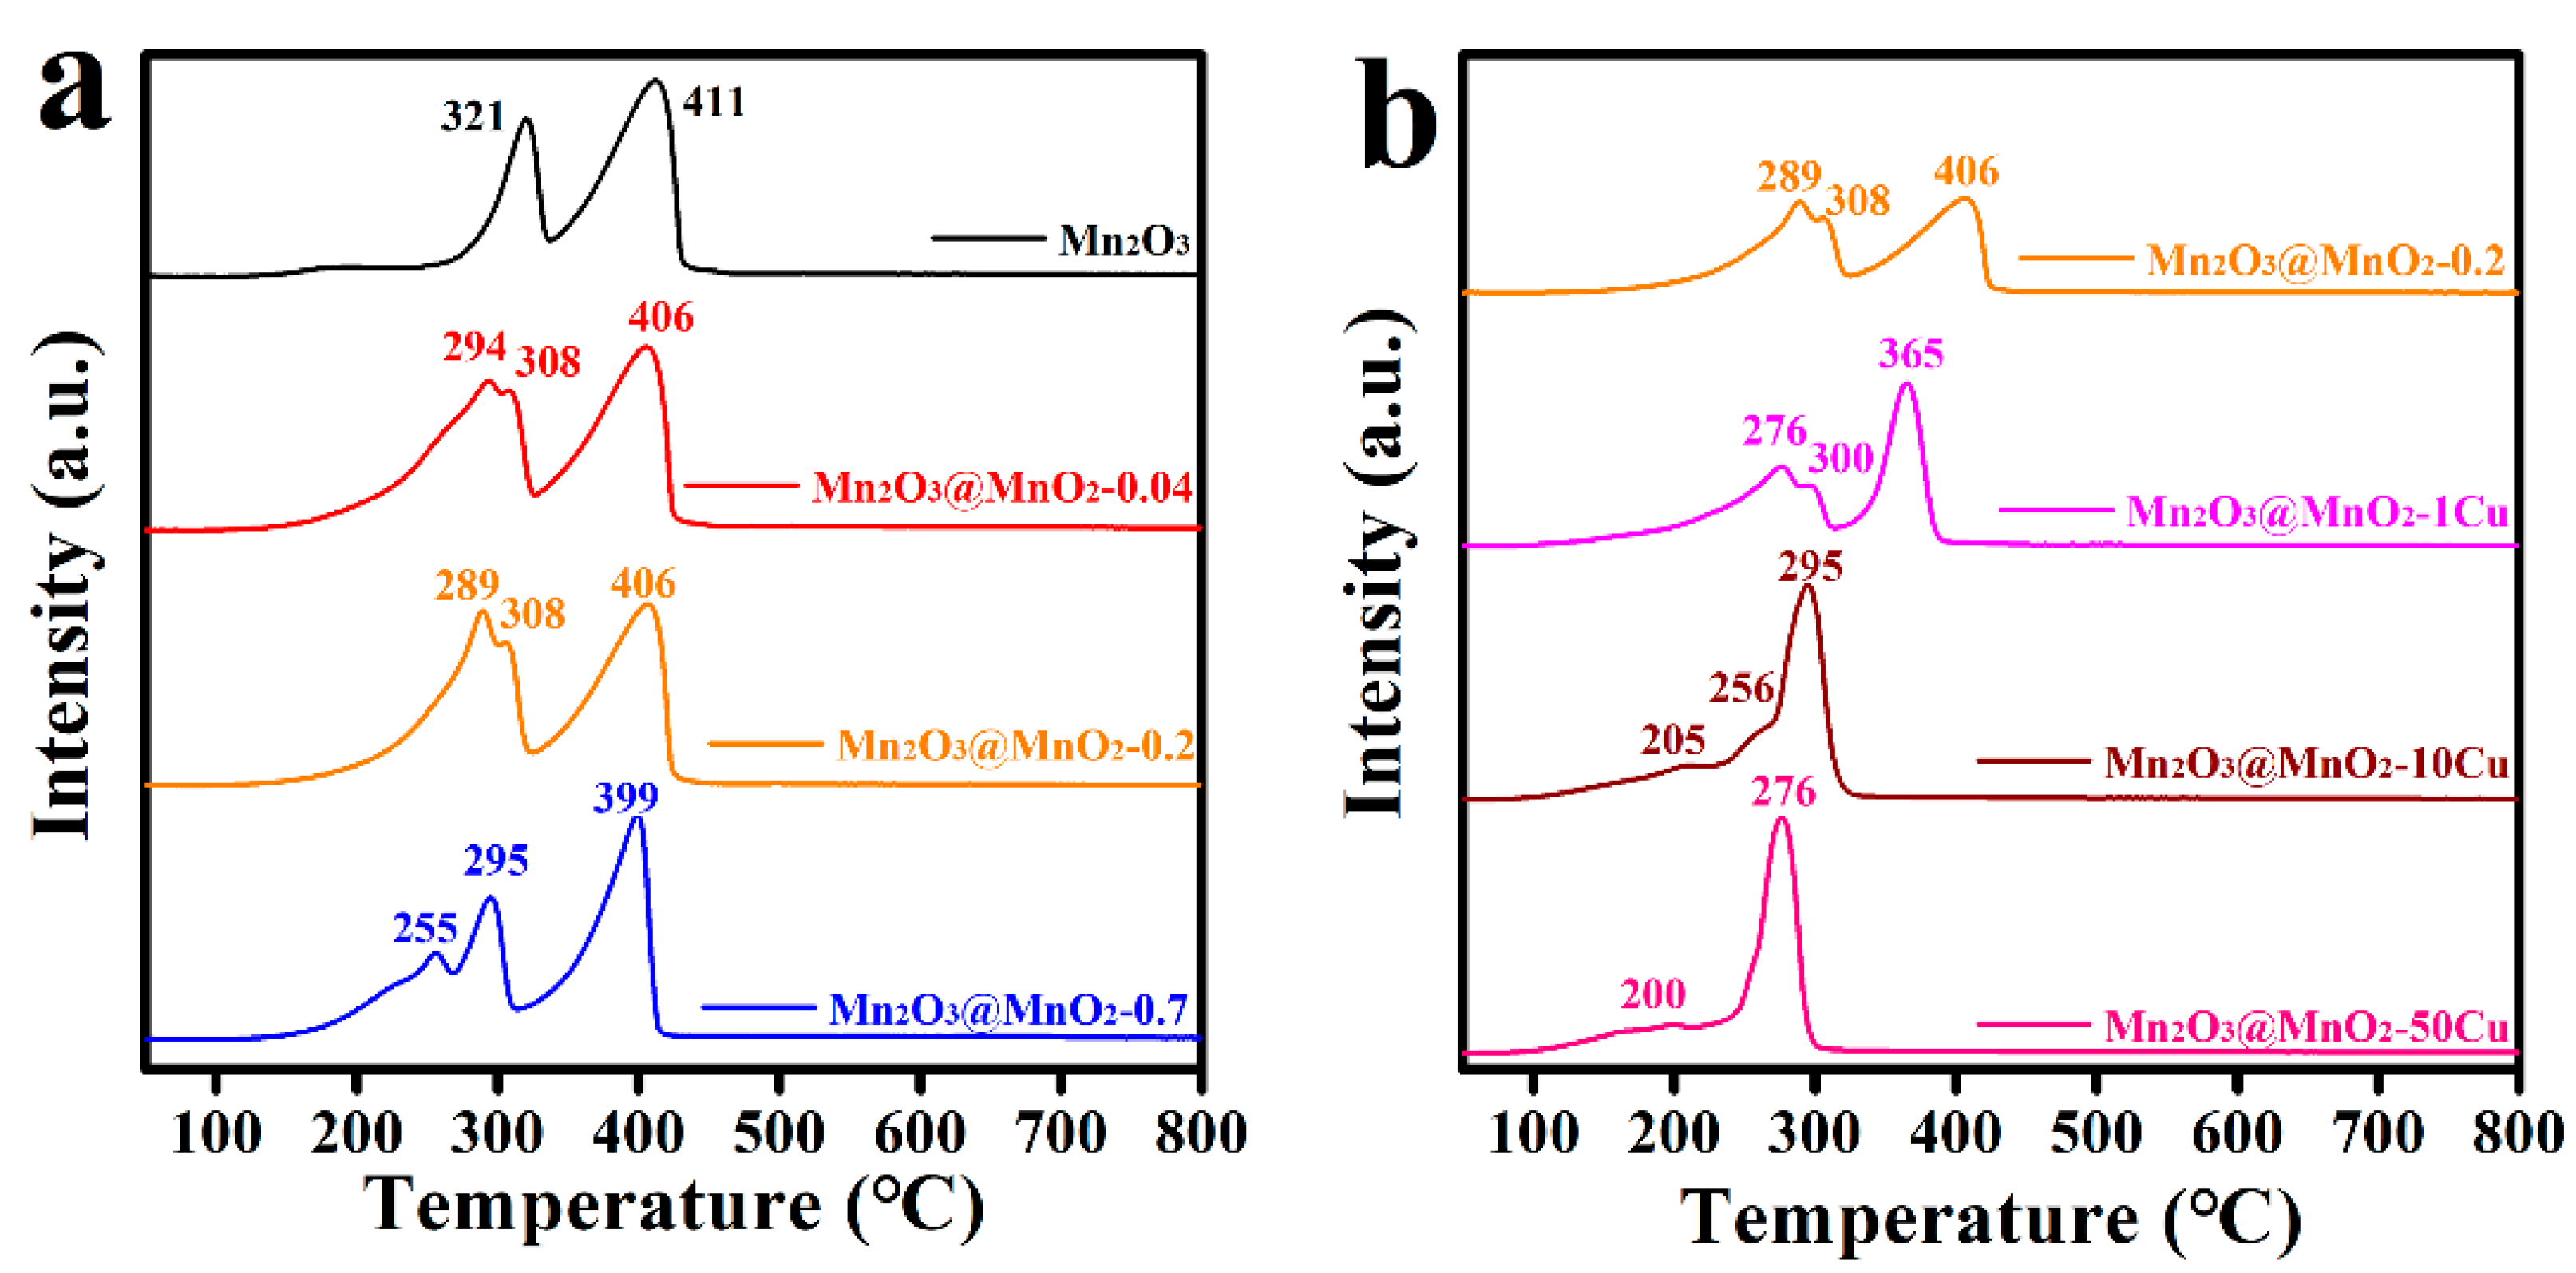
2.3. Physicochemical Properties of As-Prepared Catalysts

The nitrogen adsorption–desorption curves and BJH pore distributions are depicted in Figure 5. As illustrated in Figure 5a, the N2 adsorption—desorption isotherms for all catalysts exhibit a type IV classification, characterized by hysteresis loops indicative of capillary condensation occurring in the mesopores present on the catalyst surfaces. Furthermore, the presence of a type H3 hysteresis loop suggests the existence of slit-shaped pores within the catalysts. In addition, the content and morphology of δ-MnO2 are critical factors affecting the SBET, and the growth of δ-MnO2 nanosheets over Mn2O3 increased the SBET of the catalysts (Table 1). According to Figure 5b, the pore size distribution of Mn2O3 is primarily mesoporous (2–50 nm), with predominant pore sizes of approximately 4.9 nm to 26.4 nm. The formation of δ-MnO2 significantly reduced the size of the larger mesopores (approximately 26.4 nm), resulting in a decrease to 13.9 nm, while still remaining within the mesoporous range. Furthermore, the incorporation of Cu adversely affected the crystallinity and structural integrity of the δ-MnO2 nanosheets, resulting in the collapse of the nanosheets and the blockage of the mesopores (e.g., approximately 26.4 nm).
XPS analysis was conducted to explore the average oxidation state (AOS) of Mn and the molar ratios of oxygen species. The Mn 3s spectra and the AOS of Mn, calculated using Equation (3), are shown in Figure 6a and Table 1. As anticipated, the AOS of Mn increased with the formation of MnO2, following the trend: Mn2O3 (2.763) < Mn2O3@MnO2-0.04 (3.219) < Mn2O3@MnO2-0.2 (3.247) < Mn2O3@MnO2-0.7 (3.281). Notably, the AOS of Mn displayed “volcanic” characteristics with increasing Cu content in the MnO2@Mn2O3 catalyst, and this may be related to the doping location of Cu ions. One possibility is that Cu ions could incorporate into the octahedra of δ-MnO2 by substituting Mn. According to the principle of electric neutrality, the replacement of high valence Mn4+ by low valence Cu2+ would lead to an increase in the AOS of Mn. It can be seen from Table 1 that the AOS of Mn in Mn2O3@MnO2-1Cu and Mn2O3@MnO2-10Cu are higher than that in Mn2O3@MnO2-0.2, implying that Cu has incorporated into the octahedra of δ-MnO2 by substituting Mn. In addition, it is widely reported that K+ exists in the interlayer of δ-MnO2 for charge balance [34,35]. Based on the ICP-OES results, an increase in Cu content corresponds with a decrease in K content in the Cu-doped catalysts, indicating that Cu likely substitutes for the original K+ ions in the interlayer of δ-MnO2. To further verify the presence of Cu ions in the mezzanine of δ−MnO2, Cu-doped catalysts were dispersed in 100 mL KNO3 solution and stirred at 60 °C for 6 h. After treatment with KNO3 solution, Cu content decreased and K content increased in the catalysts (Table S1), indicating a distinct ion replacement procedure between Cu ions and K ions. The substitutability of Cu ions also confirms that Cu ions exist in the interlayer of δ−MnO2. The replacement of low valence K+ by high valence Cu2+ in the mezzanine of δ-MnO2 provides more positive charges. According to the principle of electric neutrality, the replacement of low valence K+ by high valence Cu2+ will decrease the AOS of Mn, and this has also been verified experimentally. As shown in Figure S4, the replacement of high valence Cu2+ by low valence K+ increases the AOS of Mn. The Mn2O3@MnO2-50Cu possesses a lower AOS than other Cu-doped samples, and this may be attributed to the high concentration of Cu2+ in the interlayer of the δ−MnO2. Based on the above results and discussion, we can conclude that Cu is doped into the interlayer and lattice of δ-MnO2 simultaneously.
A O S = 8.956 1.126 × Δ E
where ΔE represents the binding energy difference between characteristic peaks of Mn 3s spectra.
Figure 6b shows the O 1s spectra of different samples. All the O 1s spectra were deconvoluted into two distinct peaks, with binding energies located at ~529.6 eV and ~531.0 eV, corresponding to lattice oxygen (OI) and surface adsorbed oxygen (OII), respectively. As the formation of δ-MnO2 over Mn2O3 increased, the ratio of OII/OI increased from 0.24 to 0.32. In addition, the ratio of OII/OI increased from 0.29 to 0.38 with an increase in the Cu content in Mn2O3@MnO2 catalysts. These results indicated that the formation of δ-MnO2 and Cu doping were favorable to the adsorption of oxygen species on the surface of the catalyst. Oxygen vacancies, which serve as critical active sites for many oxidation reactions, are the primary sites for oxygen species adsorption on the catalyst surface [36]. A higher ratio of OII/OI indicates an increased formation of oxygen vacancies. The adsorbed oxygen species are widely recognized as reactive oxygen species in the catalytic oxidation process [37,38,39]. Notably, our study indicates that there is no direct linear correlation between the amount of adsorbed oxygen species and the catalytic activity of the synthesized catalysts. This suggests that adsorbed oxygen may not be the sole species influencing catalytic performance. Consequently, further investigation into the reducibility of surface lattice oxygen and the lattice oxygen storage capacity of the prepared catalysts is warranted.
To understand the reducibility of the prepared catalysts, the H2-TPR profiles were measured and collected. As shown in Figure 7, Mn2O3 exhibited two distinct reduction peaks at 321 °C and 411 °C, corresponding to the conversion processes of Mn2O3 → Mn3O4 → MnO. With the formation of δ-MnO2, pre-peaks (294 °C, 289 °C, 255 °C) emerged, which were attributed to the reduction of MnO2 to Mn2O3. It is well known that a lower initial reduction temperature indicates a stronger migration ability of lattice oxygen [40,41]. Notably, the initial reduction temperature of the catalysts decreased from 294 °C to 255 °C with the increase in δ-MnO2 formation. Furthermore, the initial reduction temperature of the catalysts was further reduced by Cu doping. Intriguingly, there was also no correlation between the catalytic activity and mobility of lattice oxygen. Consequently, the oxygen storage capacity of the prepared catalysts was investigated, and the O2-TPD profiles are shown in Figure S5. The O2 desorption signals were identified as physically and chemically adsorbed oxygen species (desorption temperature below 300 °C), surface lattice oxygen (desorption temperature 300–600 °C), and bulk lattice oxygen (desorption temperature above 600 °C) [41,42]. With the increase in δ-MnO2 formation and Cu doping content, the amount of surface lattice oxygen decreased. It is an interesting phenomenon that the increase in reducibility is accompanied by the decrease in oxygen storage capacity for the Cu-doped catalysts. Based on these observations, we speculate that the optimal balance between oxygen storage capacity and the mobility of lattice oxygen occurs in Mn2O3@MnO2-10Cu, which possesses the maximum amount of reactive oxygen species available for the oxidation of CO.
To verify the above conjecture, CO-TPD-MS was employed to detect CO2 (Figure 8), which is the sole product formed during CO oxidation, with the peak areas summarized in Table S2. The CO2 desorption between 60 °C and 300 °C was derived from the reaction between CO and the adsorbed oxygen on the catalyst surface. The amount of CO2 desorption follows the following sequence: Mn2O3@MnO2-0.04 < Mn2O3@MnO2-0.2 < Mn2O3@MnO2-0.7 < Mn2O3@MnO2-1Cu < Mn2O3@MnO2-10Cu < Mn2O3@MnO2-50Cu. This is consistent with the amount of adsorbed oxygen species on the catalyst surface in the XPS results. Meanwhile, we should note that Mn2O3@MnO2-0.2 and Mn2O3@MnO2-10Cu, which exhibit relatively good catalytic performance, released more CO2 than the other samples around 500 °C. The CO2 desorption around 500 °C resulted from the reaction between CO and the surface lattice oxygen, which indicates that surface lattice oxygen is an important oxygen species affecting catalyst activity. In summary, both surface-adsorbed oxygen and surface lattice oxygen are essential contributors to the oxidation of CO.

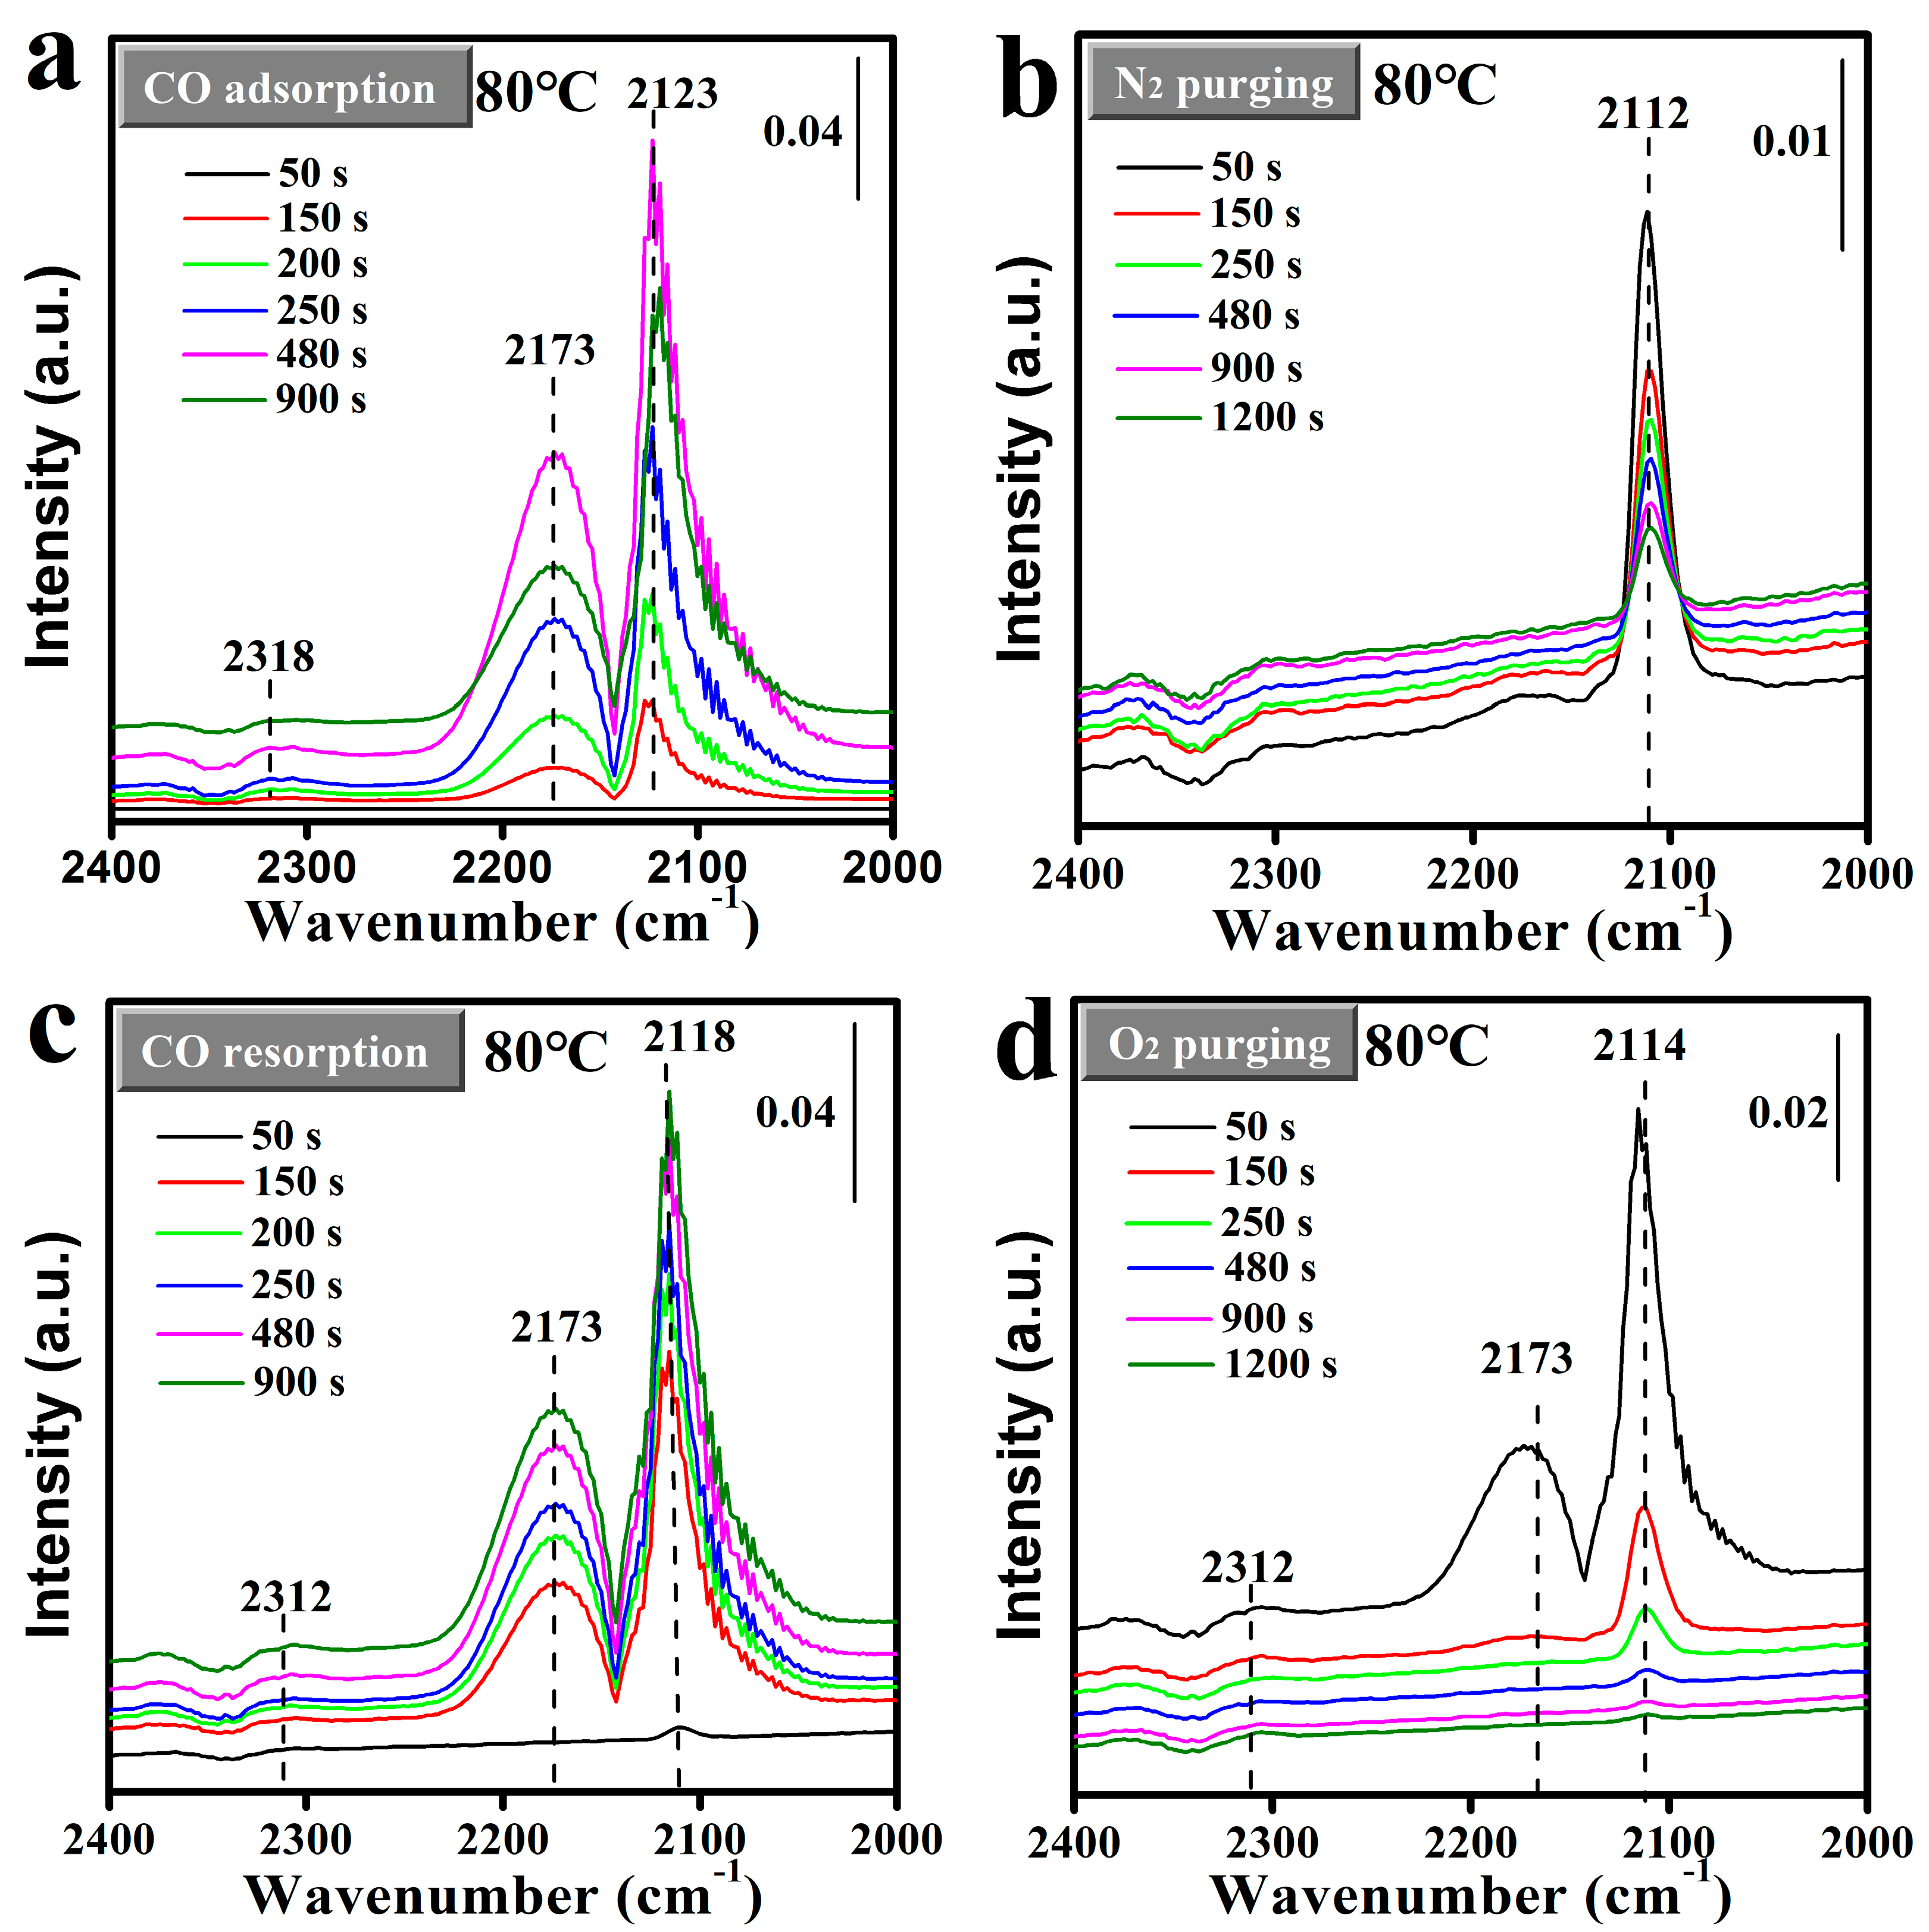
2.4. Analysis of Surface Reaction Process

To gain further insight into the CO adsorption behavior on the surface of the Mn2O3@MnO2-10Cu catalyst, in situ DRIFTS was employed to study the adsorption dynamics of CO in a “CO-N2-CO-O2” mode at a temperature of 80 °C (as depicted in Figure 9). The first and second adsorption processes of CO on the catalyst surface were marked as CO-adsorption-I and CO-adsorption-II, respectively. Bands in the range of 2105~2120 cm−1 were attributed to the CO adsorption on Cu+ species [23,43], while the peaks at ~2170 cm−1 were attributed to gaseous CO accompanied by CO-Cu+ species [43]. Additionally, bands around 2312 cm−1 were linked to the presence of gaseous CO2 [44]. As illustrated in Figure 9, CO adsorption on Cu+ species (Cu+-CO) was detected around 2120 cm−1, accompanied by the gaseous CO peak at 2173 cm−1. However, there is a significant difference in the CO adsorption behaviors in the CO-adsorption-I and CO-adsorption-II processes: in the CO-adsorption-I process, the Cu+-CO peak increases first and then decreases as the adsorption time is extended; while the Cu+-CO peak in the CO-adsorption-II process shows a trend of continuous increscent with the extending adsorption time. It should be pointed out that the Cu+-CO peak intensity reached its maximum at 480 s (~0.19) in the CO-adsorption-I process, and it was higher than that at 900 s (~0.18) in the CO-adsorption-II process. Furthermore, the behavior of CO adsorption on Cu+ species at 30 °C was found to be similar to that at 80 °C (shown in Figure S6). Based on the above results, we hypothesize that the adsorbed CO can react with the reactive oxygen species, resulting in the reduction in reactive oxygen species on the surface of the catalyst. And the reactive oxygen species were beneficial to the adsorption of CO on Cu species. Firstly, with the decrease in reactive oxygen species on the surface of the catalyst, the adsorption capacity of Cu+ to CO was weakened, and the CO adsorption peak decreased after 480s in the CO-adsorption-I process. Subsequently, the reactive oxygen species on the surface of the catalyst were not replenished during the scavenging process of N2, resulting in the adsorption capacity of Cu+ to CO in the CO-adsorption-II process being weaker than that in the CO-adsorption-I process. In order to verify the above conjecture, an in situ DRIFTS study of CO adsorption on Mn2O3@MnO2-10Cu at 120 °C was conducted, and is shown in Figure S7. The gaseous CO2 appears at 200 s, and the peak intensity increases first and then decreases with the extending adsorption time. Furthermore, the Cu+-CO peak also increases first and then decreases with the extending adsorption time. This proves that the adsorbed CO does react with the reactive oxygen species to generate CO2, resulting in the reduction in reactive oxygen species on the surface of the catalyst, and the surface reactive oxygen species of the catalyst related to the adsorption of CO on Cu species.
To elucidate the rate-limiting step of CO catalytic oxidation, in situ DRIFTS spectra were recorded under steady-state conditions using a reactant mixture for 60 min. Figure S8 displays the in situ DRIFTs spectra of Mn2O3@MnO2-10Cu exposed to the flow of 120 ppm CO at 110 °C. The band at 2324 cm−1 for gaseous CO2 was detected, indicating the CO adsorbed on Cu+ had been oxidized, while the peak at ~2120 cm−1, which was attributed to the CO adsorption on the Cu+ sites, was not detected. This demonstrates that the CO adsorbed on Cu+ can be rapidly transferred and oxidized by reactive oxygen species on the surface of the catalyst, and that the transfer of CO on Cu+ is not the rate-limiting step of CO catalytic oxidation. In addition, in situ DRIFTs spectra of Mn2O3@MnO2-10Cu under the reaction condition (2% CO/O2 flow) at 30 °C and 120 °C were recorded and are shown in Figure 10a and Figure 10c, respectively. Figure 10b,d are partial enlargements of Figure 10a and Figure 10c, respectively. The peak intensity for gaseous CO2 gradually decreased and eventually almost disappeared at 30 °C, while the peak intensity for gaseous CO2 remained basically stable with the reaction time extending at 120 °C. As discussed above, the adsorbed CO can be oxidized by reactive oxygen species on the surface of the catalyst. In Figure 10a,c, the band at ~2124 cm−1 for Cu+-CO is detected, indicating that CO is sufficient in the catalytic oxidation process. The reaction between CO and reactive oxygen species disappeared gradually at 30 °C, indicating that incoming CO reduces the reactive oxygen species, and that the replenishment of reactive oxygen species is very slow under the current conditions. While CO2 is continuously generated at 120 °C, indicating that the reactive oxygen species of the catalyst can be supplemented to a certain extent at 120 °C, from the above, we can conclude that the replenishment of reactive oxygen species is the rate-limiting step of CO catalytic oxidation. There is another important phenomenon necessary to point out. At 30 °C, when the replenishment of reactive oxygen species is slow, the Cu+-CO peak increases first and then decreases with the extending reaction time, while at 120 °C, when the reactive oxygen species can be quickly replenished, the Cu+-CO peak does not decrease with the extending reaction time. And it once again proves our previous speculation: the surface reactive oxygen species of the catalyst is beneficial to the adsorption of CO on Cu species.
In the presence of water, the catalytic activity of Mn2O3@MnO2-10Cu decreased remarkably. To further investigate this phenomenon, we examined the effect of water on the adsorption of CO on Cu+. Figure S9 presents the in situ DRIFTS spectra of Mn2O3@MnO2-10Cu exposed to a flow of 2% CO under conditions of RH = 100% at 25 °C. The Cu+-CO peak nearly vanished compared to the spectra obtained in the absence of moisture, indicating that the adsorption capacity of Cu+ for CO is significantly diminished due to the presence of water. This attenuation of CO adsorption is a critical factor contributing to the observed reduction in catalyst activity in the presence of water.

3. Materials and Methods

3.1. Chemicals and Reagents

The information on chemical reagents and manufacturers can be found in the Supporting Materials (Text S1).

3.2. Catalyst Preparation

3.2.1. Mn2O3 Nanosphere

The Mn2O3 nanosphere was obtained through MnCO3 thermal decomposition at 600 °C for 4 h under air.

3.2.2. Mn2O3@MnO2

A series of Mn2O3@MnO2 catalysts was synthesized through a redox reaction between Mn2O3 and KMnO4 under acidic conditions. Initially, 1 g of Mn2O3 nanospheres was dispersed in 150 mL of deionized water using ultrasonic and magnetic agitation treatment (solution I). A specific amount of KMnO4 and 600 μL of HCl were then dissolved in another 150 mL of deionized water (solution II). Solution II was added to solution I, and the resulting mixture was stirred at 90 °C for 30 min. The solid product was then filtered, washed (the catalysts were washed by deionized water until the filtrate was neutral), dried, and calcinated at 350 °C for 5 h in the air. The amounts of KMnO4 in solution II were varied, with 0.04 g, 0.2 g, and 0.7 g selected for the synthesis. The resulting catalysts were labeled as Mn2O3@MnO2-0.04, Mn2O3@MnO2-0.2, and Mn2O3@MnO2-0.7, respectively.

3.2.3. Cu-Doped Mn2O3@MnO2

Furthermore, 1 g of Mn2O3 nanospheres was dispersed in 150 mL of deionized water using ultrasonic and magnetic agitation (solution I). In a separate container, 0.2 g of KMnO4, 600 μL of HCl and a specific amount of Cu(NO3)2·3H2O were dissolved in 150 mL of deionized water (solution III). Solution III was then added to solution I, and the resulting mixture was stirred at 90 °C for 30 min. The solid product was filtered, washed, dried, and calcinated at 350 °C for 5 h in the air. The amounts of Cu(NO3)2·3H2O in solution III were varied, with 0.012 g, 0.122 g, and 0.611 g selected for use. The corresponding molar ratios of Cu2+ to the generated MnO2 were designed to be 1:100, 10:100, and 50:100. And the catalysts were denoted as Mn2O3@MnO2-1Cu, Mn2O3@MnO2-10Cu, and Mn2O3@MnO2-50Cu, respectively.

3.3. Materials Characterization and Catalytic Activity Tests

The details of the material characterization equipment and performance testing are provided in the Supporting Materials (Texts S2 and S3).

4. Conclusions

In this study, Cu-doped Mn2O3@MnO2 heterojunction catalysts were prepared through a redox reaction between Mn2O3 and KMnO4 for CO elimination. The interfacial region of Mn2O3 and MnO2 demonstrated higher catalytic activity compared to either component alone. The Mn2O3@MnO2-10Cu catalyst achieved remarkable 100% CO conversion at 60 °C, highlighting its potential for practical applications. XPS and ICP-OES analysis indicated that Cu1+/2+ ions exist both in the lattice and interlayer of δ-MnO2. Furthermore, surface lattice oxygen, alongside surface-adsorbed oxygen, acts as a reactive oxygen species crucial for the catalytic process. Importantly, the replenishment of these reactive species was the rate-limiting step in CO catalytic oxidation. These insights not only deepen our understanding of the catalytic mechanisms in Cu-doped Mn2O3@MnO2 systems, but also underscore their potential for developing efficient catalysts in environmental remediation, particularly for air pollution control.

Supplementary Materials

The following supporting information can be downloaded at https://www.mdpi.com/article/10.3390/molecules30040865/s1. Text S1: Chemicals and reagents. Text S2: Materials characterization. Text S3: Catalytic activity tests. Table S1: ICP-OES results of samples. Table S2: The peak area of CO2 desorption signal. Figure S1: TEM images of samples. Figure S2: TG curve of Mn2O3@MnO2-10Cu. Figure S3: T100 of different catalysts under dry and wet gas conditions. Figure S4: XPS spectra. Figure S5: O2-TPD profiles of different samples. Figures S6–S9: In situ DRIFTS study of different samples.

Author Contributions

Synthetic experiments, investigation, methodology, and manuscript draft, H.Z., T.M., P.S., M.Z. and H.L.; conceptualization, supervision, and manuscript review, P.Z. and Y.Y.; funding acquisition, P.Z. and H.Z.: writing—review and editing, writing—original draft. T.M.: writing—review and editing, writing—original draft. P.Z.: writing—review and editing, supervision, and funding acquisition. P.S.: writing—review and editing. M.Z.: writing—review and editing. H.L.: writing—review and editing. Y.Y.: writing—review and editing and supervision. All authors have read and agreed to the published version of the manuscript.

Funding

This work was financially supported by the National Natural Science Foundation of China (No. 22076094), Science & Technology Innovation Program of Shunde of Foshan City (No. 2130218002526) and Tsinghua-Foshan Innovation Special Fund (No. 2021THFS0503).

Institutional Review Board Statement

Not applicable.

Informed Consent Statement

Not applicable.

Data Availability Statement

The experimental data used to support the results of this study are available in the article and in the Supplementary Materials.

Conflicts of Interest

The authors declare that they have no known competing financial interests or personal relationships that could appear to influence the work reported in this paper.

References

  1. Pope, D.P.; Mishra, V.; Thompson, L.; Siddiqui, A.R.; Rehfuess, E.A.; Weber, M.; Bruce, N.G. Risk of low birth weight and stillbirth associated with indoor air pollution from solid fuel use in developing countries. Epidemiol. Rev. 2010, 32, 70–81. [Google Scholar] [CrossRef] [PubMed]
  2. Saavedra, J.; Doan, H.; Pursell, C.; Grabow, L.; Chandler, B. The critical role of water at the gold-titania interface in catalytic CO oxidation. Science 2014, 345, 6204. [Google Scholar] [CrossRef] [PubMed]
  3. Wang, S.; Li, X.M.; Lai, C.Y.; Zhang, Y.P.; Lin, X.; Ding, S.P. Recent advances in noble metal-based catalysts for CO oxidation. RSC Adv. 2024, 14, 30566. [Google Scholar] [CrossRef] [PubMed]
  4. Soubaihi, R.M.A.; Saoud, K.M.; Dutta, J. Low-temperature CO oxidation by silver nanoparticles in silica aerogel mesoreactors. Chem. Eng. J. 2023, 455, 140576. [Google Scholar] [CrossRef]
  5. Wu, C.H.; Liu, C.; Su, D.; Xin, H.L.; Fang, H.T.; Eren, B.; Zhang, S.; Murray, C.B.; Salmeron, M.B. Bimetallic synergy in cobalt–palladium nanocatalysts for CO oxidation. Nat. Catal. 2018, 2, 78–85. [Google Scholar] [CrossRef]
  6. Zhang, J.Y.; Shu, M.; Niu, Y.X.; Yi, L.; Yi, H.H.; Zhou, Y.S.; Zhao, S.Z.; Tang, X.L.; Gao, F.Y. Advances in CO catalytic oxidation on typical noble metal catalysts: Mechanism, performance and optimization. Chem. Eng. J. 2024, 495, 153523. [Google Scholar] [CrossRef]
  7. Zhang, Y.N.; Qin, G.Z.; Zheng, J.F.; Li, Y.F.; Huang, Z.G.; Han, X.J. Promotion effect of CO oxidation via activation of surface lattice oxygen by single atom Cu/MnO2 catalyst. Mol. Catal. 2023, 540, 113057. [Google Scholar] [CrossRef]
  8. Dasireddy, V.D.; Likozar, B. Cu-Mn-O nano-particle/nano-sheet spinel-type materials as catalysts in methanol steam reforming (MSR) and preferential oxidation (PROX) reaction for purified hydrogen production. Renew. Energy 2022, 182, 713–724. [Google Scholar] [CrossRef]
  9. Ma, Y.M.; Li, Y.H.; Liang, P.Y.; Min, X.B.; Sun, T.J. SnO2-modiffed CuMnOx catalysts for humid CO oxidation at low temperature. J. Ind. Eng. Chem. 2024, 138, 300–310. [Google Scholar] [CrossRef]
  10. He, Z.Y.; Zheng, B. Microscopic investigation of CO oxidation reaction by copper–manganese oxide catalysts. Catal. Lett. 2025, 155, 4. [Google Scholar] [CrossRef]
  11. Hu, Z.; Liu, X.; Meng, D.; Guo, Y.; Guo, Y.; Lu, G. Effect of ceria crystal plane on the physicochemical and catalytic properties of Pd/ceria for CO and propane oxidation. ACS Catal. 2016, 6, 2265–2279. [Google Scholar] [CrossRef]
  12. Xie, X.; Li, Y.; Liu, Z.Q.; Haruta, M.; Shen, W. Low-temperature oxidation of CO catalysed by Co3O4 nanorods. Nature 2009, 458, 746–749. [Google Scholar] [CrossRef] [PubMed]
  13. Liang, S.; Teng, F.; Bulgan, G.; Zong, R.; Zhu, Y. Effect of phase structure of MnO2 nanorod catalyst on the activity for CO oxidation. J. Phys. Chem. C 2008, 112, 5307–5315. [Google Scholar] [CrossRef]
  14. Chen, B.; Wu, B.; Yu, L.; Crocker, M.; Shi, C. Investigation into the catalytic roles of various oxygen species over different crystal phases of MnO2 for C6H6 and HCHO Oxidation. ACS Catal. 2020, 10, 6176–6187. [Google Scholar] [CrossRef]
  15. Song, W.; Chen, J.; Li, Z.; Fang, X. Self-powered MXene/GaN van der waals heterojunction ultraviolet photodiodes with superhigh efficiency and stable current outputs. Adv. Mater. 2021, 33, e2101059. [Google Scholar] [CrossRef]
  16. Khan, A.; Wang, H.; Liu, Y.; Jawad, A.; Ifthikar, J.; Liao, Z.; Wang, T.; Chen, Z. Highly efficient α-Mn2O3@α-MnO2-500 nanocomposite for peroxymonosulfate activation: Comprehensive investigation of manganese oxides. J. Mater. Chem. A 2018, 6, 1590–1600. [Google Scholar] [CrossRef]
  17. Zeng, Y.; Meng, Y.; Lai, Z.; Zhang, X.; Yu, M.; Fang, P.; Wu, M.; Tong, Y.; Lu, X. An ultrastable and high-performance flexible fiber-shaped Ni–Zn battery based on a Ni–NiO heterostructured nanosheet cathode. Adv. Mater. 2017, 29, 1702698. [Google Scholar] [CrossRef]
  18. Chen, J.; Ouyang, W.; Yang, W.; He, J.H.; Fang, X. Recent progress of heterojunction ultraviolet photodetectors: Materials, integrations, and applications. Adv. Funct. Mater. 2020, 30, 1909909. [Google Scholar] [CrossRef]
  19. Yang, W.; Peng, Y.; Wang, Y.; Wang, Y.; Liu, H.; Su, Z.A.; Yang, W.; Chen, J.; Si, W.; Li, J. Controllable redox-induced in-situ growth of MnO2 over Mn2O3 for toluene oxidation: Active heterostructure interfaces. Appl. Catal. B Environ. 2020, 278, 119279. [Google Scholar] [CrossRef]
  20. Yang, R.; Fan, Y.; Ye, R.; Tang, Y.; Cao, X.; Yin, Z.; Zeng, Z. MnO2-based materials for environmental applications. Adv. Mater. 2021, 33, e2004862. [Google Scholar] [CrossRef]
  21. An, K.; Alayoglu, S.; Musselwhite, N.; Plamthottam, S.; Melaet, G.; Lindeman, A.E.; Somorjai, G.A. Enhanced CO oxidation rates at the interface of mesoporous oxides and Pt nanoparticles. J. Am. Chem. Soc. 2013, 135, 16689–16696. [Google Scholar] [CrossRef] [PubMed]
  22. Chen, A.; Yu, X.; Zhou, Y.; Miao, S.; Li, Y.; Kuld, S.; Sehested, J.; Liu, J.; Aoki, T.; Hong, S.; et al. Structure of the catalytically active copper–ceria interfacial perimeter. Nat. Catal. 2019, 2, 334–341. [Google Scholar] [CrossRef]
  23. May, Y.A.; Wei, S.; Yu, W.Z.; Wang, W.W.; Jia, C.J. Highly efficient CuO/α-MnO2 catalyst for low-temperature CO oxidation. Langmuir 2020, 36, 11196–11206. [Google Scholar] [CrossRef]
  24. Elmhamdi, A.; Pascual, L.; Retuerto, M.; Martínez-Arias, A. Catalysts of ceria supported on copper-chromium oxide: Ceria promotion of the CO-PROX activity. Int. J. Hydrog. Energ. 2021, 46, 38712–38723. [Google Scholar] [CrossRef]
  25. Chen, C.S.; You, J.H.; Lin, J.H.; Chen, Y.Y. Effect of highly dispersed active sites of Cu/TiO2 catalyst on CO oxidation. Catal. Commun. 2008, 9, 2381–2385. [Google Scholar] [CrossRef]
  26. Chen, C.S.; Chen, T.C.; Chen, C.C.; Lai, Y.T.; You, J.H.; Chou, T.M.; Chen, C.H.; Lee, J.F. Effect of Ti3+ on TiO2-supported Cu catalysts used for CO oxidation. Langmuir 2012, 28, 9996–10006. [Google Scholar] [CrossRef]
  27. Polster, C.S.; Nair, H.; Baertsch, C.D. Study of active sites and mechanism responsible for highly selective CO oxidation in H2 rich atmospheres on a mixed Cu and Ce oxide catalyst. J. Catal. 2009, 266, 308–319. [Google Scholar] [CrossRef]
  28. Pakharukova, V.P.; Moroz, E.M.; Zyuzin, D.A.; Ishchenko, A.V.; Dolgikh, L.Y.; Strizhak, P.E. Structure of copper oxide species supported on monoclinic zirconia. J. Phys. Chem. C 2015, 119, 28828–28835. [Google Scholar] [CrossRef]
  29. Wang, W.W.; Du, P.P.; Zou, S.H.; He, H.Y.; Wang, R.X.; Jin, Z.; Shi, S.; Huang, Y.Y.; Si, R.; Song, Q.S.; et al. Highly dispersed copper oxide clusters as active species in copper-ceria catalyst for preferential oxidation of carbon monoxide. ACS Catal. 2015, 5, 2088–2099. [Google Scholar] [CrossRef]
  30. Rong, S.; He, T.; Zhang, P. Self-assembly of MnO2 nanostructures into high purity three-dimensional framework for high efficiency formaldehyde mineralization. Appl. Catal. B Environ. 2020, 267, 118375. [Google Scholar] [CrossRef]
  31. Liu, Y.; Zhou, H.; Cao, R.; Liu, X.; Zhang, P.; Zhan, J.; Liu, L. Facile and green synthetic strategy of birnessite-type MnO2 with high efficiency for airborne benzene removal at low temperatures. Appl. Catal. B Environ. 2019, 245, 569–582. [Google Scholar] [CrossRef]
  32. Zhu, L.; Wang, J.; Rong, S.; Wang, H.; Zhang, P. Cerium modified birnessite-type MnO2 for gaseous formaldehyde oxidation at low temperature. Appl. Catal. B Environ. 2017, 211, 212–221. [Google Scholar] [CrossRef]
  33. Cao, R.; Zhang, P.; Liu, Y.; Zheng, X. Ammonium-treated birnessite-type MnO2 to increase oxygen vacancies and surface acidity for stably decomposing ozone in humid condition. Appl. Surf. Sci. 2019, 495, 143607. [Google Scholar] [CrossRef]
  34. Rong, S.; Li, K.; Zhang, P.; Liu, F.; Zhang, J. Potassium associated manganese vacancy in birnessite-type manganese dioxide for airborne formaldehyde oxidation. Catal. Sci. Technol. 2018, 8, 1799–1812. [Google Scholar] [CrossRef]
  35. Wang, J.; Li, J.; Zhang, P.; Zhang, G. Understanding the “seesaw effect” of interlayered K+ with different structure in manganese oxides for the enhanced formaldehyde oxidation. Appl. Catal. B Environ. 2018, 224, 863–870. [Google Scholar] [CrossRef]
  36. Aschauer, U.; Chen, J.; Selloni, A. Peroxide and superoxide states of adsorbed O2 on anatase TiO2 (101) with subsurface defects. Phys. Chem. Chem. Phys. 2010, 12, 12956–12960. [Google Scholar] [CrossRef]
  37. Feng, N.; Zhu, Z.; Zhao, P.; Wang, L.; Wan, H.; Guan, G. Facile fabrication of trepang-like CeO2@MnO2 nanocomposite with high catalytic activity for soot removal. Appl. Surf. Sci. 2020, 515, 146013. [Google Scholar] [CrossRef]
  38. Mo, S.; Zhang, Q.; Li, J.; Sun, Y.; Ren, Q.; Zou, S.; Zhang, Q.; Lu, J.; Fu, M.; Mo, D.; et al. Highly efficient mesoporous MnO2 catalysts for the total toluene oxidation: Oxygen-vacancy defect engineering and involved intermediates using in situ DRIFTS. Appl. Catal. B Environ. 2020, 264, 118464. [Google Scholar] [CrossRef]
  39. Wang, Z.; Chen, B.; Crocker, M.; Yu, L.; Shi, C. New insights into alkaline metal modified CoMn-oxide catalysts for formaldehyde oxidation at low temperatures. Appl. Catal. A Gen. 2020, 596, 117512. [Google Scholar] [CrossRef]
  40. Yang, Y.J.; Zhang, P.Y.; Jia, J.B. Vanadium-doped MnO2 for efficient room-temperature catalytic decomposition of ozone in air. Appl. Surf. Sci. 2019, 484, 45–53. [Google Scholar] [CrossRef]
  41. Zhang, H.; Li, H.N.; Zhang, P.Y.; Hu, T.X.; Wang, X.J. Highly active copper-intercalated weakly crystallized δ-MnO2 for low-temperature oxidation of CO in dry and humid air. Front. Environ. Sci. Eng. 2024, 18, 62. [Google Scholar] [CrossRef]
  42. Yang, W.H.; Wang, Y.; Yang, W.N.; Liu, H.; Li, Z.G.; Peng, Y.; Li, J.H. Surface In situ doping modification over Mn2O3 for toluene and propene catalytic oxidation: The effect of isolated Cuδ+ insertion into the mezzanine of surface MnO2 cladding. ACS Appl. Mater. Interfaces 2021, 13, 2753–2764. [Google Scholar] [CrossRef] [PubMed]
  43. Wang, W.W.; Yu, W.Z.; Du, P.P.; Xu, H.; Jin, Z.; Si, R.; Ma, C.; Shi, S.; Jia, C.J.; Yan, C.H. Crystal plane effect of ceria on supported copper oxide cluster catalyst for CO oxidation: Importance of metal–support interaction. ACS Catal. 2017, 7, 1313–1329. [Google Scholar] [CrossRef]
  44. Zhang, H.; Sui, S.; Zheng, X.; Cao, R.; Zhang, P. One-pot synthesis of atomically dispersed Pt on MnO2 for efficient catalytic decomposition of toluene at low temperatures. Appl. Catal. B Environ. 2019, 257, 117878. [Google Scholar] [CrossRef]
Figure 1. (a) XRD patterns of Mn2O3 and series of Mn2O3@MnO2 catalysts. (b) XRD patterns of Mn2O3@MnO2-0.2 and series of Cu-doped Mn2O3@MnO2 catalysts.
Molecules 30 00865 g001
Figure 2. SEM images of prepared samples: (a) Mn2O3, (b) Mn2O3@MnO2-0.04, (c) Mn2O3@MnO2-0.2, (d) Mn2O3@MnO2-0.7, (e) Mn2O3@MnO2-1Cu, (f) Mn2O3@MnO2-10Cu, and (g) Mn2O3@MnO2-50Cu.
Molecules 30 00865 g002
Figure 3. TEM and HRTEM images of Mn2O3 (ac); Mn2O3@MnO2-0.2 (df); and Mn2O3@MnO2-10Cu (gi).
Molecules 30 00865 g003
Figure 4. (a,b) CO conversion as functions of reaction temperature over different catalysts (test condition: dry gas), (c) CO conversion as functions of reaction temperature over different catalysts (test condition: in the presence of 1.04 vol.% H2O), and (d) stability test for Mn2O3@MnO2-10Cu (test condition: in the presence of 1.04 vol.% H2O).
Molecules 30 00865 g004
Figure 5. (a) Nitrogen adsorption–desorption curves and (b) BJH pore distributions of catalysts.
Molecules 30 00865 g005
Figure 6. XPS spectra of (a) Mn 3s and (b) O 1s in prepared samples: Mn2O3, Mn2O3@MnO2-0.04, Mn2O3@MnO2-0.2, Mn2O3@MnO2-0.7, Mn2O3@MnO2-1Cu, Mn2O3@MnO2-10Cu, and Mn2O3@MnO2-50Cu.
Molecules 30 00865 g006
Figure 7. (a) H2-TPR profiles of prepared Mn2O3@MnO2 samples with different amount of MnO2, (b) H2-TPR profiles of prepared Mn2O3@MnO2-0.2 with varying levels of Cu doping.
Molecules 30 00865 g007
Figure 8. (a) CO-TPD-MS profiles of prepared Mn2O3@MnO2 samples with different amount of MnO2, (b) CO-TPD-MS profiles of prepared Mn2O3@MnO2-0.2 with varying levels of Cu doping.
Molecules 30 00865 g008
Figure 9. In situ DRIFTS study of (a) CO adsorption, (b) N2 purging, (c) CO resorption, and (d) O2 removal on Mn2O3@MnO2-10Cu. The catalysts were pretreated in situ at 200 °C under mixture gas (50% O2 and 50% N2) flow in the DRIFTS reaction cell before data collection (5% CO flow rate; 10 mL·min−1; N2 flow rate; 20 mL·min−1; O2 flow rate; 20 mL·min−1; and temperature, 80 °C).
Molecules 30 00865 g009
Figure 10. In situ DRIFTS taken for 60 min under the reaction conditions (2% CO/O2 flow) at (a) 30 °C and (c) 120 °C for Mn2O3@MnO2-10Cu. (b) and (d) are partially enlarged images of (a) and (c), respectively.
Molecules 30 00865 g010
Table 1. Several physicochemical parameters of catalysts.
SampleMn
(ICP, wt%)
Cu
(ICP, wt%)
K (ICP, wt%)BET (m2·g−1)Pore Diameter (nm)AOS of MnXPSO
II/OI
Mn2O373.7__51.54.9/26.42.7630.24
Mn2O3@MnO2-0.0469.2_0.01059.74.9/26.43.2190.26
Mn2O3@MnO2-0.269.45_0.05780.24.9/26.43.2470.29
Mn2O3@MnO2-0.771.51_0.34110.94.9/13.93.2810.32
Mn2O3@MnO2-1Cu70.930.290.07167.04.9/26.43.3710.33
Mn2O3@MnO2-10Cu68.031.330.06693.04.9/17.33.4950.35
Mn2O3@MnO2-50Cu68.252.170.025107.84.9/13.93.1460.38
Disclaimer/Publisher’s Note: The statements, opinions and data contained in all publications are solely those of the individual author(s) and contributor(s) and not of MDPI and/or the editor(s). MDPI and/or the editor(s) disclaim responsibility for any injury to people or property resulting from any ideas, methods, instructions or products referred to in the content.

