Article

Tailored Carbon Nanocomposites for Efficient CO2 Capture

Institute of General and Inorganic Chemistry, Bulgarian Academy of Sciences, 1113 Sofia, Bulgaria
*
Author to whom correspondence should be addressed.
Molecules 2025, 30(11), 2408; https://doi.org/10.3390/molecules30112408
Submission received: 28 April 2025 / Revised: 27 May 2025 / Accepted: 27 May 2025 / Published: 30 May 2025

Abstract

CO2 capture by adsorption on proper solid materials appears to be a promising approach, due to its low energy requirements and ease of implementation. This study aimed to prepare efficient materials for CO2 capture based on composites of nanocarbon and reduced graphene oxide, using graphite, L-ascorbic acid, and glycine as precursors. The materials were characterized by XRD, low-temperature N2 adsorption, FTIR, Raman, and XPS spectroscopies, along with SEM and TEM. The CO2 adsorption capacities, heats of adsorption, and selectivity were determined. A hierarchical porous structure was found for NC-LAA, NC/RGO-LAA, and NC/RGO-Gly. At 273 K and 100 kPa, the adsorption capacities for NC-LAA and NC-Gly reached 2.6 mmol/g and 2.5 mmol/g, respectively, while for the composites, the capacities were 1.7 mmol/g for NC/RGO-Gly and 3.5 mmol/g for NC/RGO-LAA. The adsorption ability of the glycine-derived materials is related to the presence of nitrogen-containing functional groups. The heats of adsorption for NC-LAA, NC-Gly, and NC/RGO-Gly reveal chemisorption with CO2. Except for chemisorption, the NC/RGO-LAA material shows a sustained physical adsorption up to higher CO2 coverage. The best adsorption of CO2, observed for NC/RGO-LAA, is connected with the synergy between carbon dots and RGO. This composition ensures both sufficient oxygen surface functionalization and a proper hierarchical porous structure.

Graphical Abstract

1. Introduction

Non-renewable fossil fuels remain the primary energy source, but their combustion releases significant amounts of carbon dioxide. Since the 1950s, this has been recognized as the leading human-induced factor contributing to atmospheric harm [1,2]. As a result, developing economically viable and efficient technologies for capturing, removing, or converting CO2 is increasingly crucial.
The main techniques proposed for the capture and utilization of CO2 are liquid absorption, adsorption, cryogenic fractionation, membrane separation, etc. Among them, the process of adsorption of CO2 on proper solid materials appears to be a promising approach, due to its low energy requirements and ease of implementation at low temperatures [3,4].
Various high-surface-area materials have been explored for CO2 capture, with recent studies focusing on different types of solid adsorbents [5,6,7,8,9,10,11,12]. These include mesoporous silica, natural and synthetic zeolites, MOFs [13,14], various carbon-based materials [15], etc. CO2 sorption in solid materials involves both physisorption and chemisorption, with the dominant process determined by the material’s characteristics and operating conditions (e.g., temperature, pressure, and gas composition). Physisorption relies on weak van der Waals forces and is favored at low temperatures and high pressures, while chemisorption involves stronger covalent or ionic bonds at specific surface sites. Most solids exhibit physisorption due to their high surface area and porosity, whereas chemisorption is often enhanced via functionalization to boost CO2 selectivity and uptake, especially at low partial pressures. The balance between these mechanisms governs overall sorption performance.
Some data on various sorbents, along with their respective CO2 adsorption capacities, are presented in Table 1 [12,15,16,17,18,19,20,21,22,23,24,25,26,27,28,29,30,31,32,33,34,35].
However, many of these materials suffer from drawbacks such as low adsorption capacity, poor selectivity, and slow saturation. Additionally, their practical use is often hindered by insufficient chemical, mechanical, or thermal stability. For some, their effectiveness decreases in humid conditions, further limiting their applicability [36,37].
Carbon nanomaterials (nanocarbons; NCs) are a class of carbon-based materials characterized by their nanoscale dimensions, typically ranging from a few nanometers to hundreds of nanometers in size. This category encompasses various forms of carbon, including carbon nanotubes, graphene, graphene oxide, fullerenes, carbon black, and activated carbon. These are promising adsorbents due to their low cost, eco-friendliness, and excellent physicochemical properties, including high surface area, tunable porosity, and stability [38,39,40,41]. They can be derived from various sources, including industrial and agricultural waste [42], and their surface functionality can be tailored via chemical modifications [42,43,44,45]. Recently, biopolymer-based carbon materials [46], lignin-based adsorbents [47], and solid sorbents like activated carbon, zeolites, metal–organic frameworks (MOFs), and porous organic polymers (POPs) have been evaluated for CO2 adsorption.
Traditional carbon materials like graphite and activated carbon have long been used, while newer forms such as fullerenes, carbon nanotubes, graphene, and carbon dots offer unique properties, enabling diverse applications [48,49]. Their versatility arises from carbon’s ability to form bonds in multiple structural configurations.
The 2D sp2-hybridized carbon framework comprises a group of new materials (carbon nanotubes, carbon nanorods, fullerenes, porous carbons, graphene, and reduced graphene oxide (RGO)). Their implementation in practice demands large-scale production, which is a technological challenge. This is why the development of new synthesis methods, especially top–down approaches, is the focus of researchers. These newly discovered carbon-based materials have been found to be applicable for the adsorption of many gaseous compounds, namely, for low-temperature adsorption, and especially for CO2 uptake [50]. Graphene-based materials have been successfully applied for CO2 capture. It has been found that the performance of such materials in CO2 sorption depends on the morphology and specific chemical functionalization ensuring high porosity and the presence of oxygen-containing surface groups [51,52,53,54].
Functional groups like hydroxyl, carboxyl, and epoxy on graphene oxide/reduced graphene oxide enhance their ability to interact with CO2 molecules, increasing their adsorption efficiency. Research suggests that CO2 adsorption on graphene-based materials occurs mainly through physisorption, which is influenced by their surface composition and structural defects in the graphene sheets [55]. Creating vacancies or defects in the graphene lattice can greatly enhance CO2 adsorption by generating localized states that strengthen interactions with gas molecules [56]. Computational studies have confirmed that defect sites on graphene surfaces enhance CO2 adsorption by increasing the adsorption energies, thereby improving the overall performance [56]. To improve the adsorption capacity of graphene-based materials, additional functionalization of the surface has been carried out with heteroatoms such as nitrogen and sulfur, functional groups, or the production of composites with polymers, silicas, or metal–organic frameworks [57,58,59,60,61].
Combining reduced graphene oxide with other types of carbon material can lead to synergistic effects that can significantly enhance the CO2 adsorption performance in several ways. The incorporation of other nanocarbons (carbon nanofibers, nanotubes, carbon dots, or metal-oxide-supported structures) could improve the textural properties and pore structure of RGO and provide functional groups that serve as active adsorption sites [62]. The combination of RGO with other nanocarbon structures, such as activated carbon nanofibers (ACNFs), has been shown to enhance the specific surface area and micropore volume of the adsorbents, which are directly correlated with enhanced CO2 adsorption capacity [63].
The production of carbon nanomaterials using green precursors presents notable advantages, including eco-friendliness and cost efficiency [64]. Moreover, it aligns with modern trends for sustainability by reducing dependence on hazardous chemicals and energy-intensive processes. The functionalization of nanocarbons by COOH- and NH2- groups allows for the enhancement of their CO2 affinity [65].
The modification of carbon materials with polar functional groups further boosts CO2 uptake from low-concentration streams, as reported in studies on acid-functionalized porous carbon [66,67]. Additionally, graphene nanocomposites offer tailored porosity and faster adsorption kinetics, making them viable for post-combustion CO2 capture [15,68]. Although promising, the application of carbon dots in CO2 capture is still in its early stages of investigation [69].
This study aimed to create efficient material for CO2 capture in a one-step synthesis of NC-RGO nanocomposites, using synthetic graphite and nitrogen (glycine) and oxygen-containing (L-ascorbic acid, L-AA) reducing agents as the initial materials. The latter two precursors were intended to simultaneously reduce the produced graphene oxide in situ and form additional nanocarbon material. The possible synergy between graphene’s surface area and tunable porosity and the functional adaptability of nanocarbons will be beneficial for optimizing these materials for environmental applications. The impact of the reducing agent type on the material’s surface chemistry and texture, related to the CO2 adsorption ability, will be investigated.

2. Results and Discussion

The nanocarbons and composites under study are noted as bare reduced graphene oxide (RGO), nanocarbons prepared by L-AA (NC-L-AA) or glycine (NC-Gly), a composite prepared with the reducing agent L-AA (NC/RGO-LAA), and a composite prepared with the reducing agent glycine (NC/RGO-Gly).

2.1. XRD

The XRD patterns of the initial graphite, LAA, and glycine are presented in Figure S1. A coincidence with the reference standard patterns PDF2-#00-008-1415, PDF2-#00-022-1560, and PDF2-#00-006-0230, respectively, was registered. The powder X-ray diffraction (PXRD) patterns of pure RGO, nanocarbon (NC) materials, and the respective composites (NC/RGO) can be seen in Figure 1. These patterns reflect the amorphous nature of the prepared NCs (blue and red) [70], exhibiting only very broad humps centered at around 20°2θ and 42°2θ, corresponding to interplanar distances of 4.43 Å and 2.15 Å, respectively.
The pattern of RGO (dark yellow) contains a well-defined broad peak at 25.2°2θ (d = 3.52 Å), corresponding to (002) reflection of graphite, reflecting the slight widening of the spacing between graphene sheets. The (100) peak inside the graphene sheet is well visible at 42.7°2θ.
The pattern of NC/RGO-LAA (magenta) shows more pronounced peaks at 25°2θ and 43.9°2θ (d = 3.55 Å and 2.06 Å), while the pattern of NC/RGO-Gly (dark green) consists of three well-defined peaks at 23.8°2θ, 42.7°2θ, and 77.7°2θ (d = 3.7 Å, 2.11 Å, and 1.23 Å). The well-pronounced peaks in the latter two patterns may be related to the presence of reduced graphene oxide, and these peaks can be attributed to the (002), (100), and (110) planes in the graphite-2H lattice. These two patterns combine the features of NC and RGO.

2.2. Nitrogen Adsorption

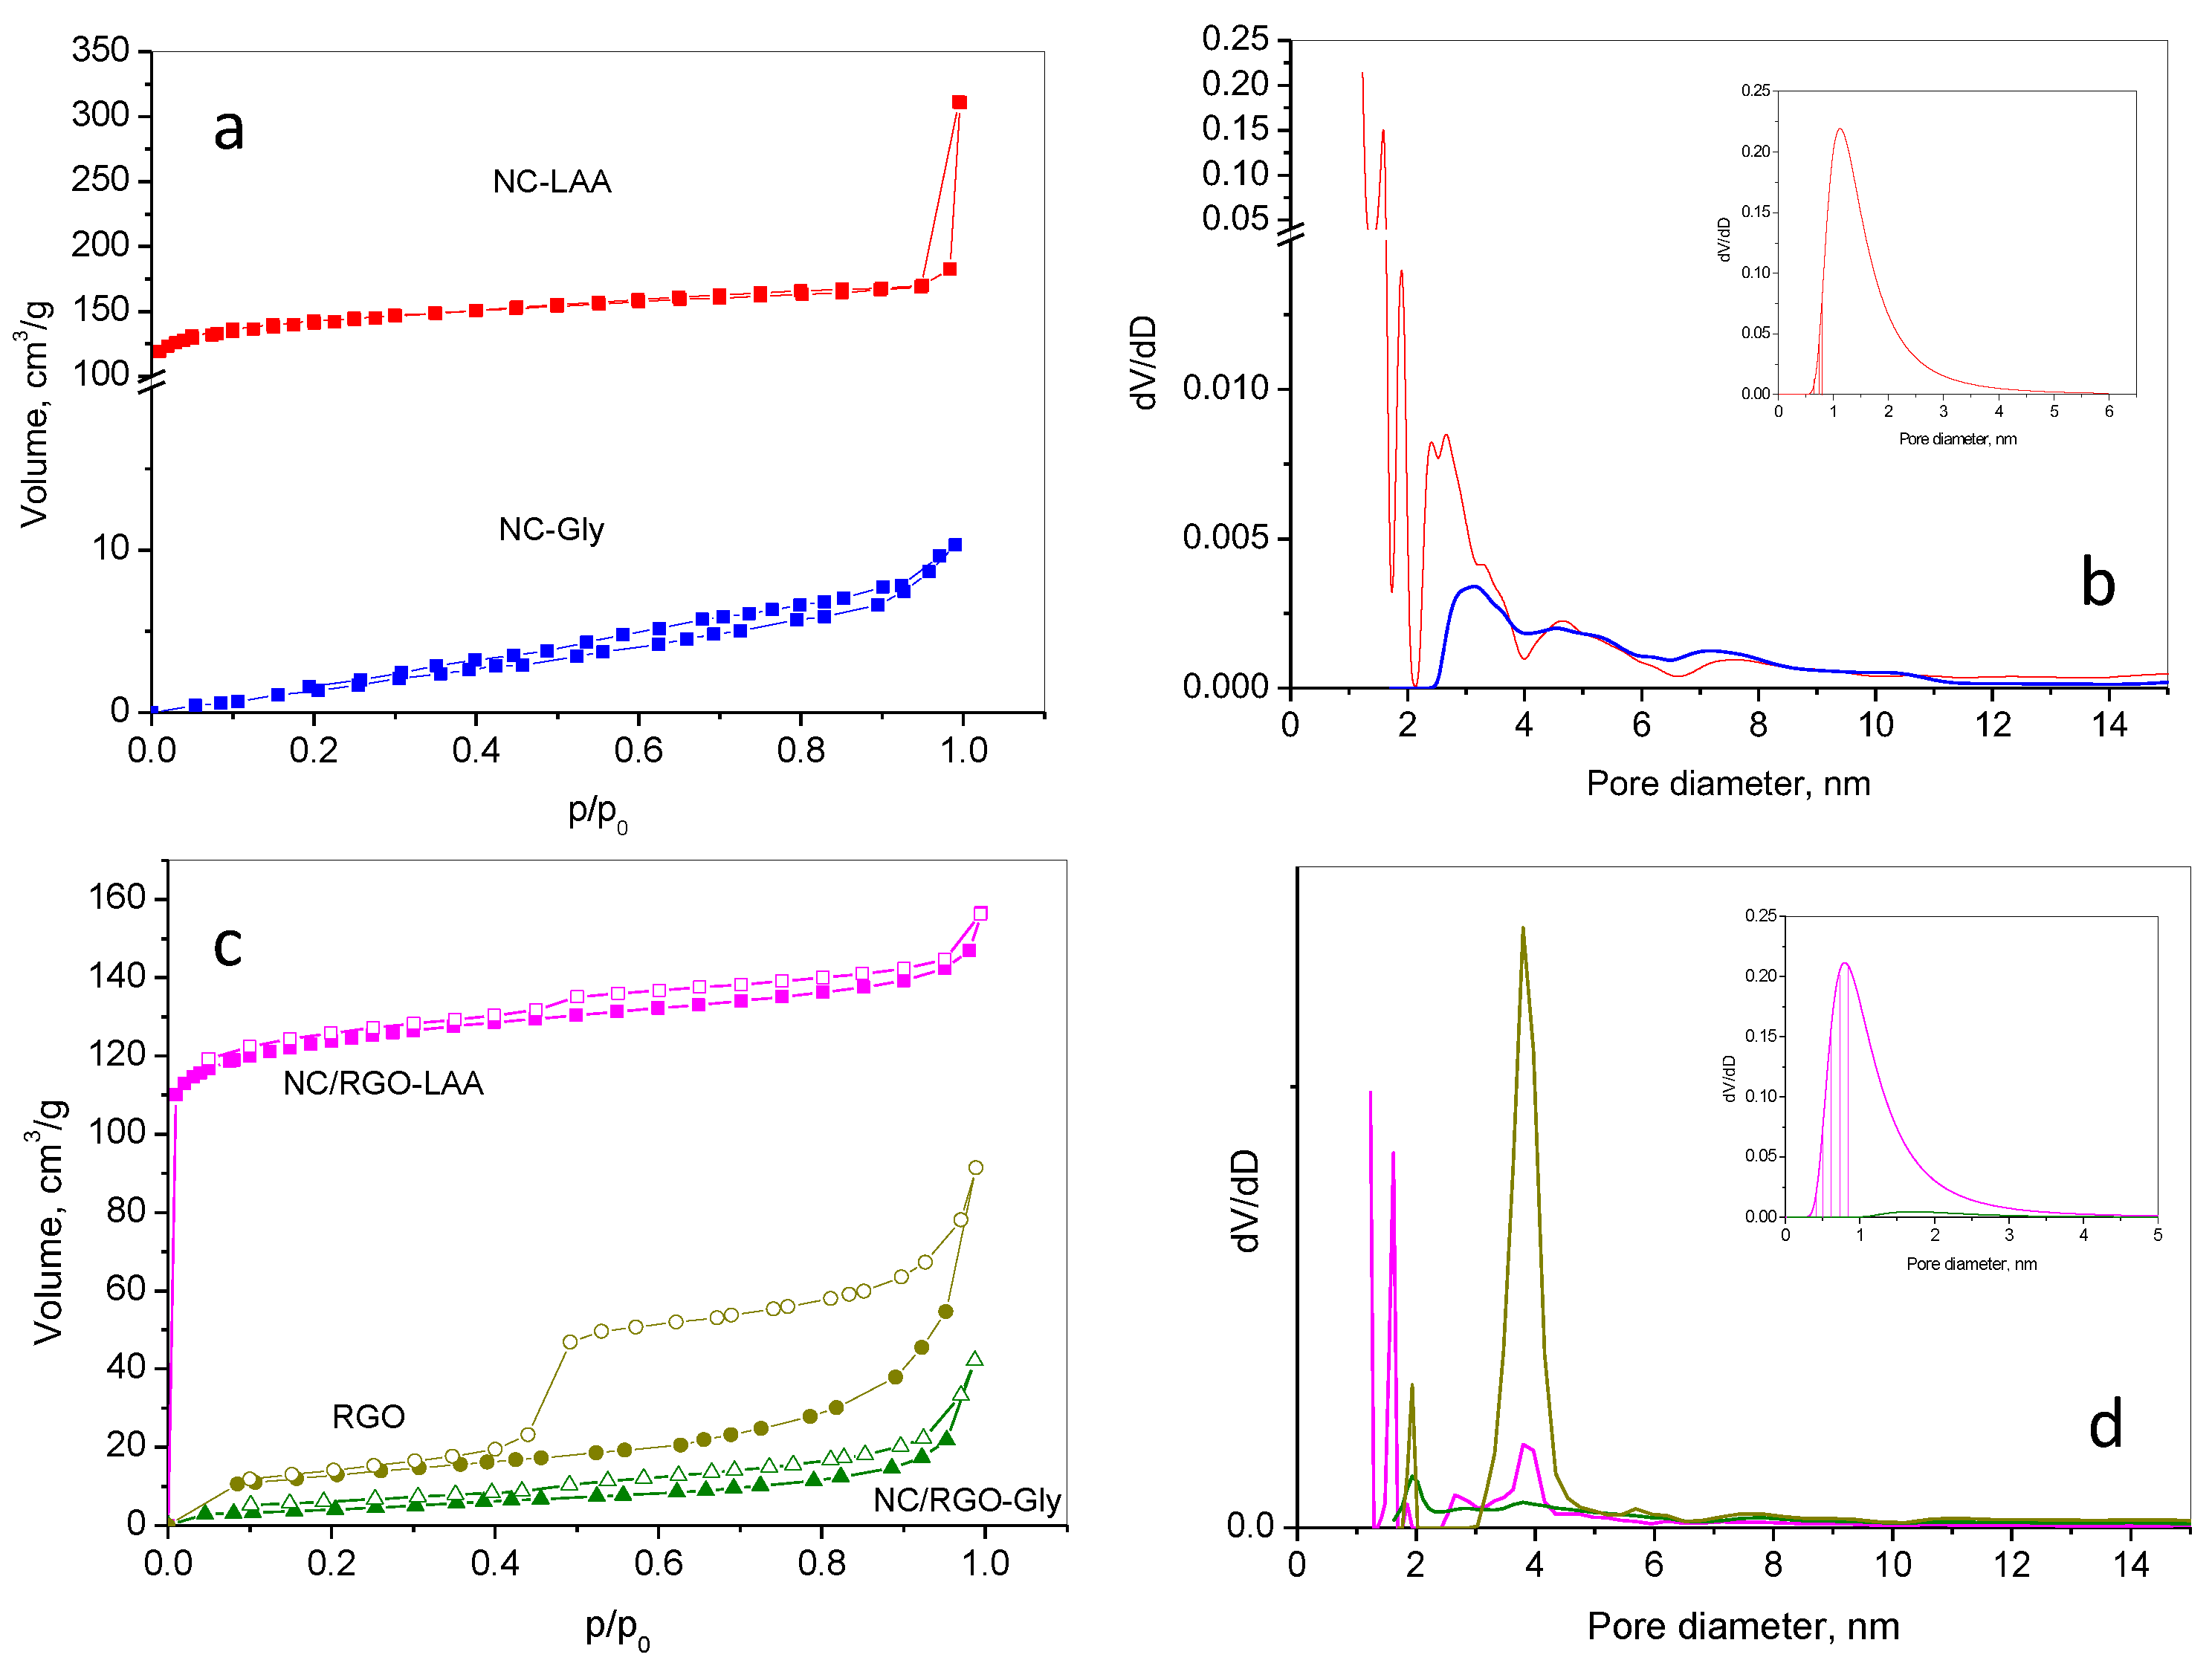
Nitrogen adsorption–desorption analysis was performed to study the surface and textural properties and to provide valuable information about the specific surface area, pore size distribution, and porosity of the materials prepared. The results are presented in Table 2 and Figure 2.
The result for NC-LAA (red), according to the IUPAC classification [71], shows a mixed adsorption isotherm of types I (a steep initial rise in adsorption at low relative pressure and a plateau at higher pressures) and II (gradual uptake due to multilayer adsorption in mesopores/macropores), which usually occurs with a material of both microporous and mesoporous structures, leading to a combination of adsorption behaviors. There is no hysteresis. This suggests a hierarchical porous structure, confirmed by the high specific surface area and total pore volume, and by the significant presence of microporous volume (Table 1) in the sample. The pore size distribution supports this observation. NC-Gly (blue) shows an isotherm of type II (with no hysteresis), which indicates a material with non-porous or macroporous adsorption behavior. The specific surface area and total pore volume are not high, reflecting the particle aggregation and the absence of micropores.
The composite material’s adsorption–desorption isotherms differ from those of the pure nanocarbon materials. Both NC/RGO-LAA (magenta) and NC/RGO-Gly (dark green) exhibit mixed type I and II isotherms, with a pronounced hysteresis (H3). This suggests that the composite materials have a non-rigid pore structure of aggregated plate-like particles with slit-like opened mesopores. A significant fraction of mesopores implies the presence of reduced graphene oxide. The specific surface area of NC/RGO-LAA is not as high as in NC-LAA, but the micropore volume is higher, with a larger content of micropores below 0.8 nm (inset). The content of pores below 0.8 nm was estimated to be 0.05 cm3 for NC/RGO-LAA and 0.005 cm3 for NC-LAA. Conversely, the specific surface area and pore volume of NC/RGO-Gly were higher than those of NC-Gly; additionally, a small amount of micropores appeared (Table 2, Figure 2, insets).
The bare RGO sample (dark yellow) shows a type II–IV isotherm along with H3 type hysteresis. It possesses pronounced mesoporosity, with a negligible amount of micropores. Its specific surface area is not high, suggesting stacked graphene sheets or RGO agglomerates.
The texture analyses suggest that the pore structures of NC/RGO-LAA and NC/RGO-Gly combine the textural features of NC-LAA and NC-Gly with those of RGO, and new textural properties emerge.

2.3. SEM

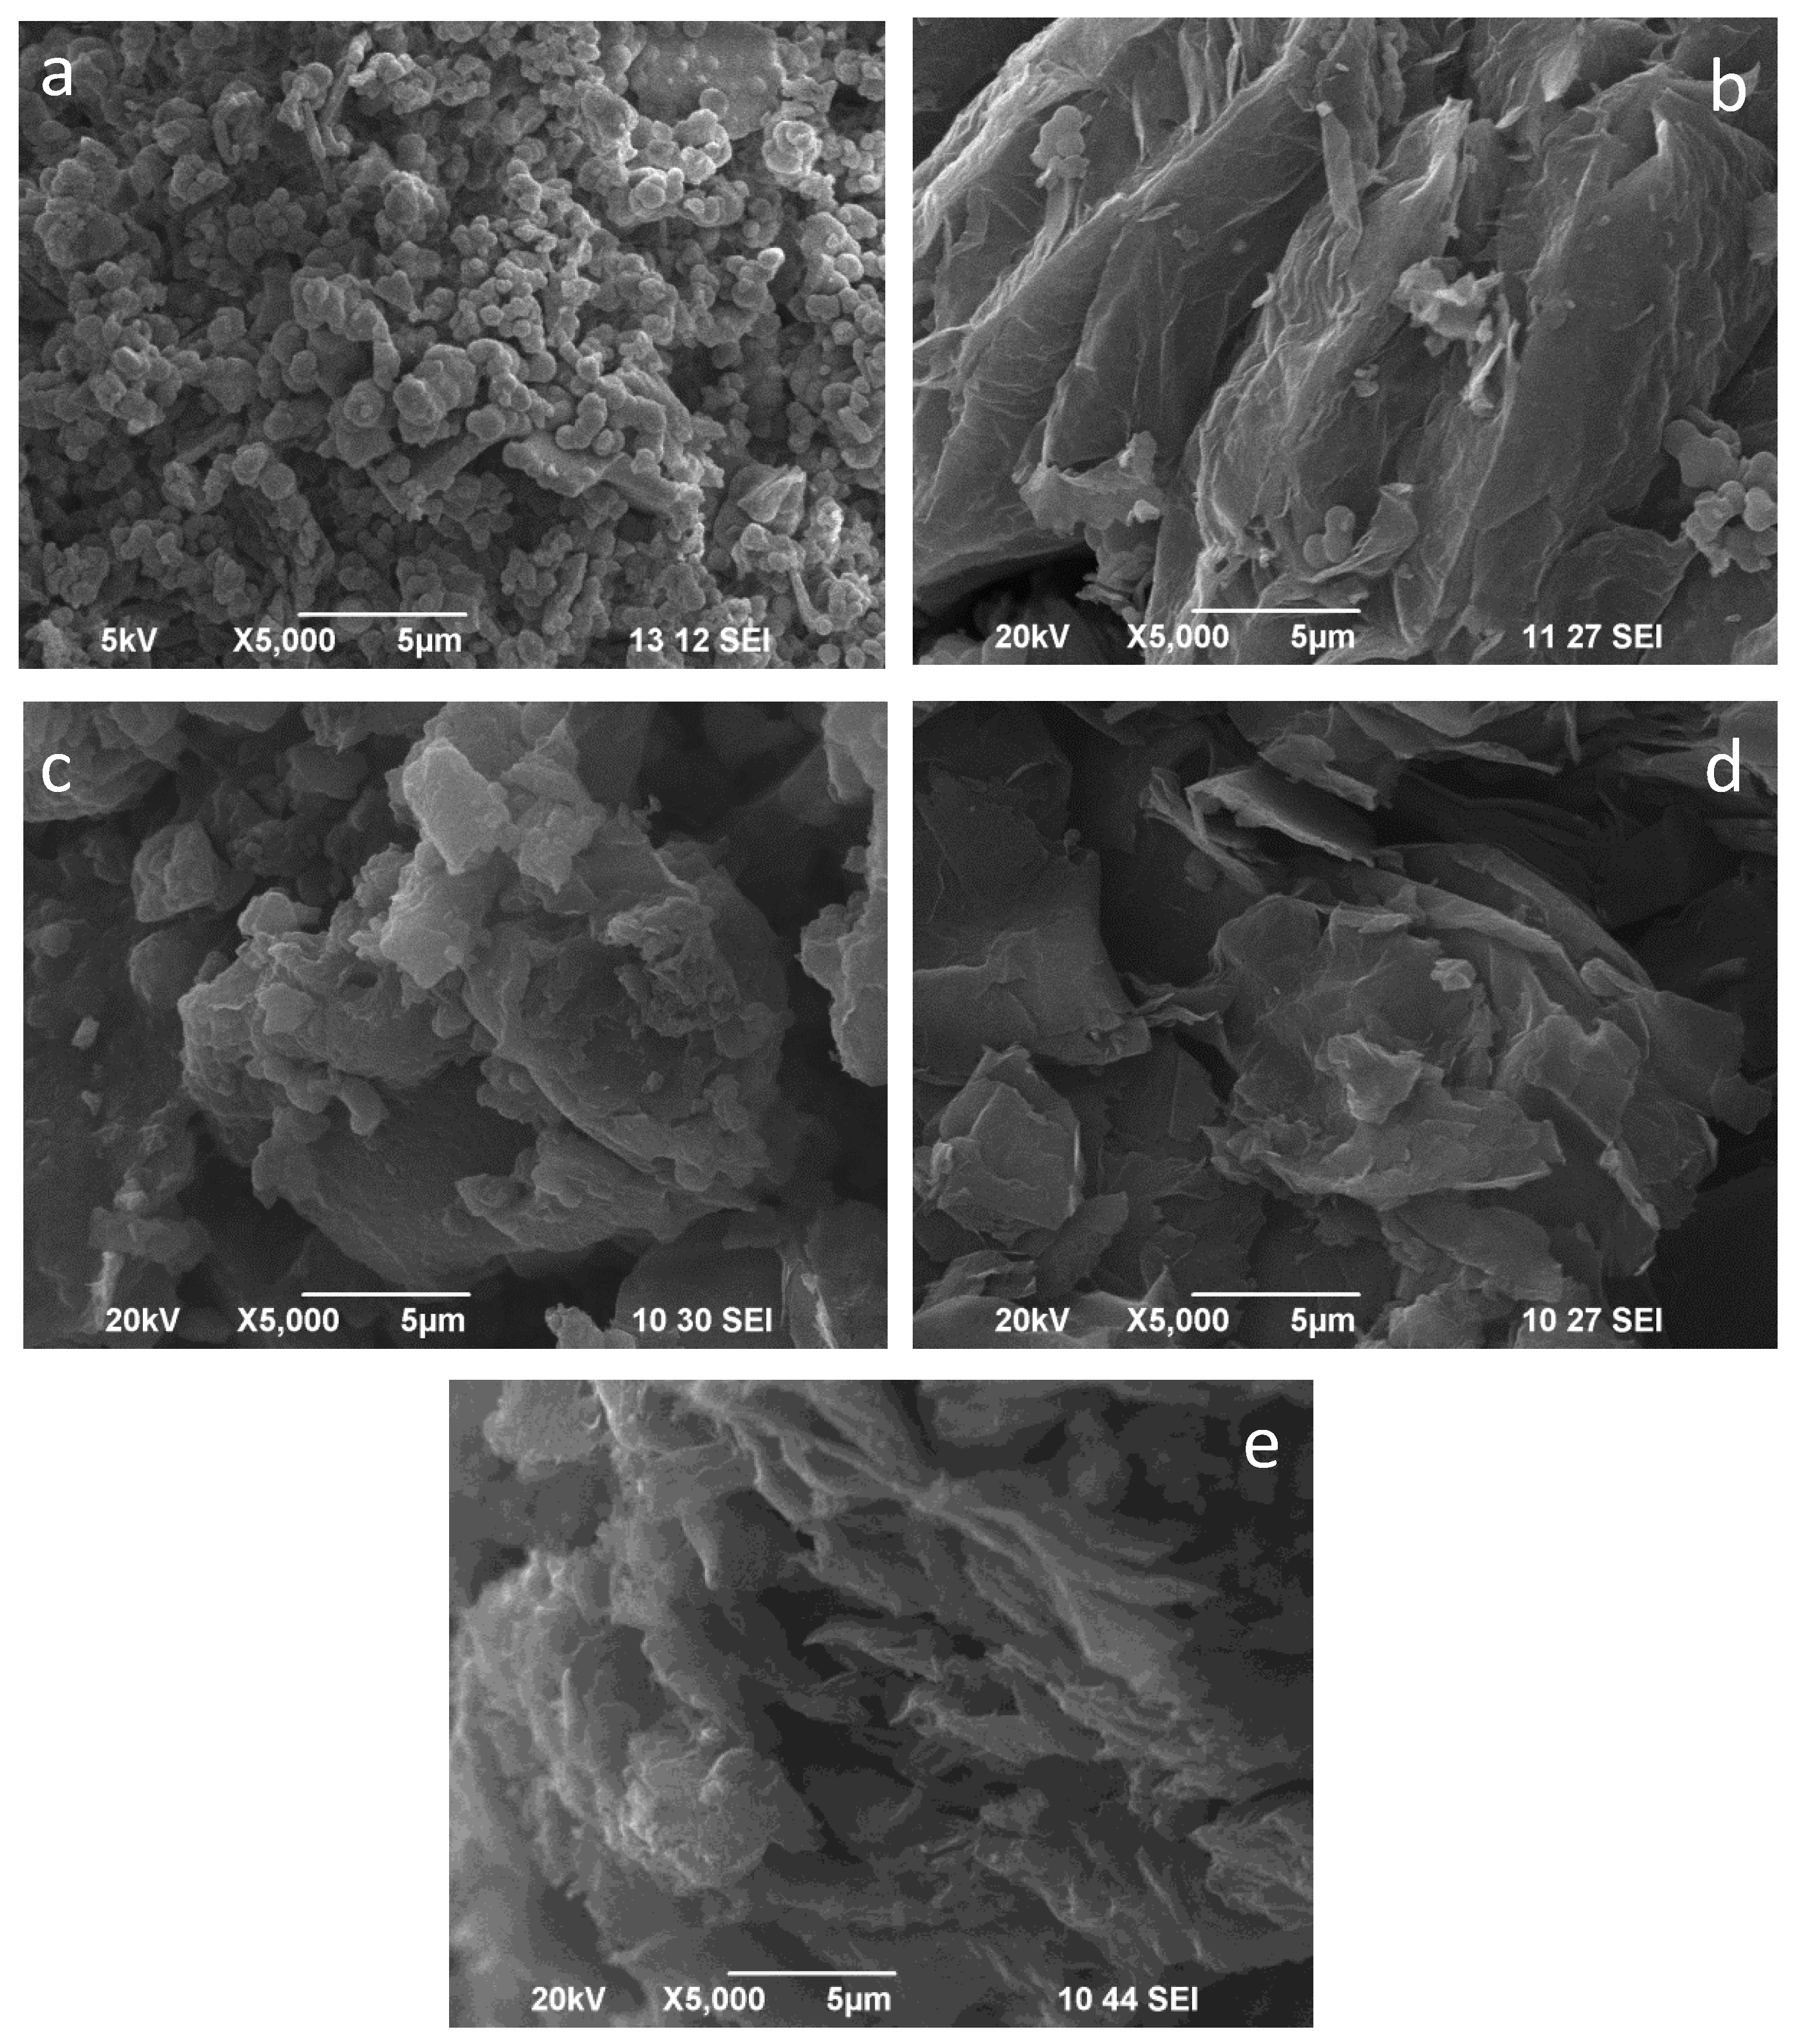
The Secondary Electron Imaging (SEI) pictures of the studied materials are presented in Figure 3. The referent RGO (Figure 3e) presents a typical, well-developed sheet morphology. The NCs obtained from two precursors show quite different morphologies. The NC-LAA material (Figure 3a) is built of round-shaped particles with similar sizes, loosely aggregated, and with a large number of voids between them. The approximate mean size (diameter) of the aggregates was evaluated to be less than 200 nm.
The observed morphology is a prerequisite for the developed porous structure registered by nitrogen physisorption studies. Conversely, the particles of the NC-Gly (Figure 3c) are irregularly shaped, exhibiting distinct edges and sizes ranging from nanometers to several microns, the latter being huge aggregates. As a result, the specific surface area is relatively small. The images of the NC/RGO-LAA show the features of both components of the composite (Figure 3b). One can see that the morphology of the reduced graphene oxide consists of several stacked graphene sheets, along with some ball-shaped particles, which represent the NC-LAA part of this composite, with particle aggregates of approx. 300 nm. The graphene sheets in the image of NC/RGO-Gly (Figure 3d) are more disrupted, forming smaller sheets, while the bigger sheets are wrinkled. The presence of NC-Gly in this sample is scarce and hardly distinguishable.

2.4. TEM

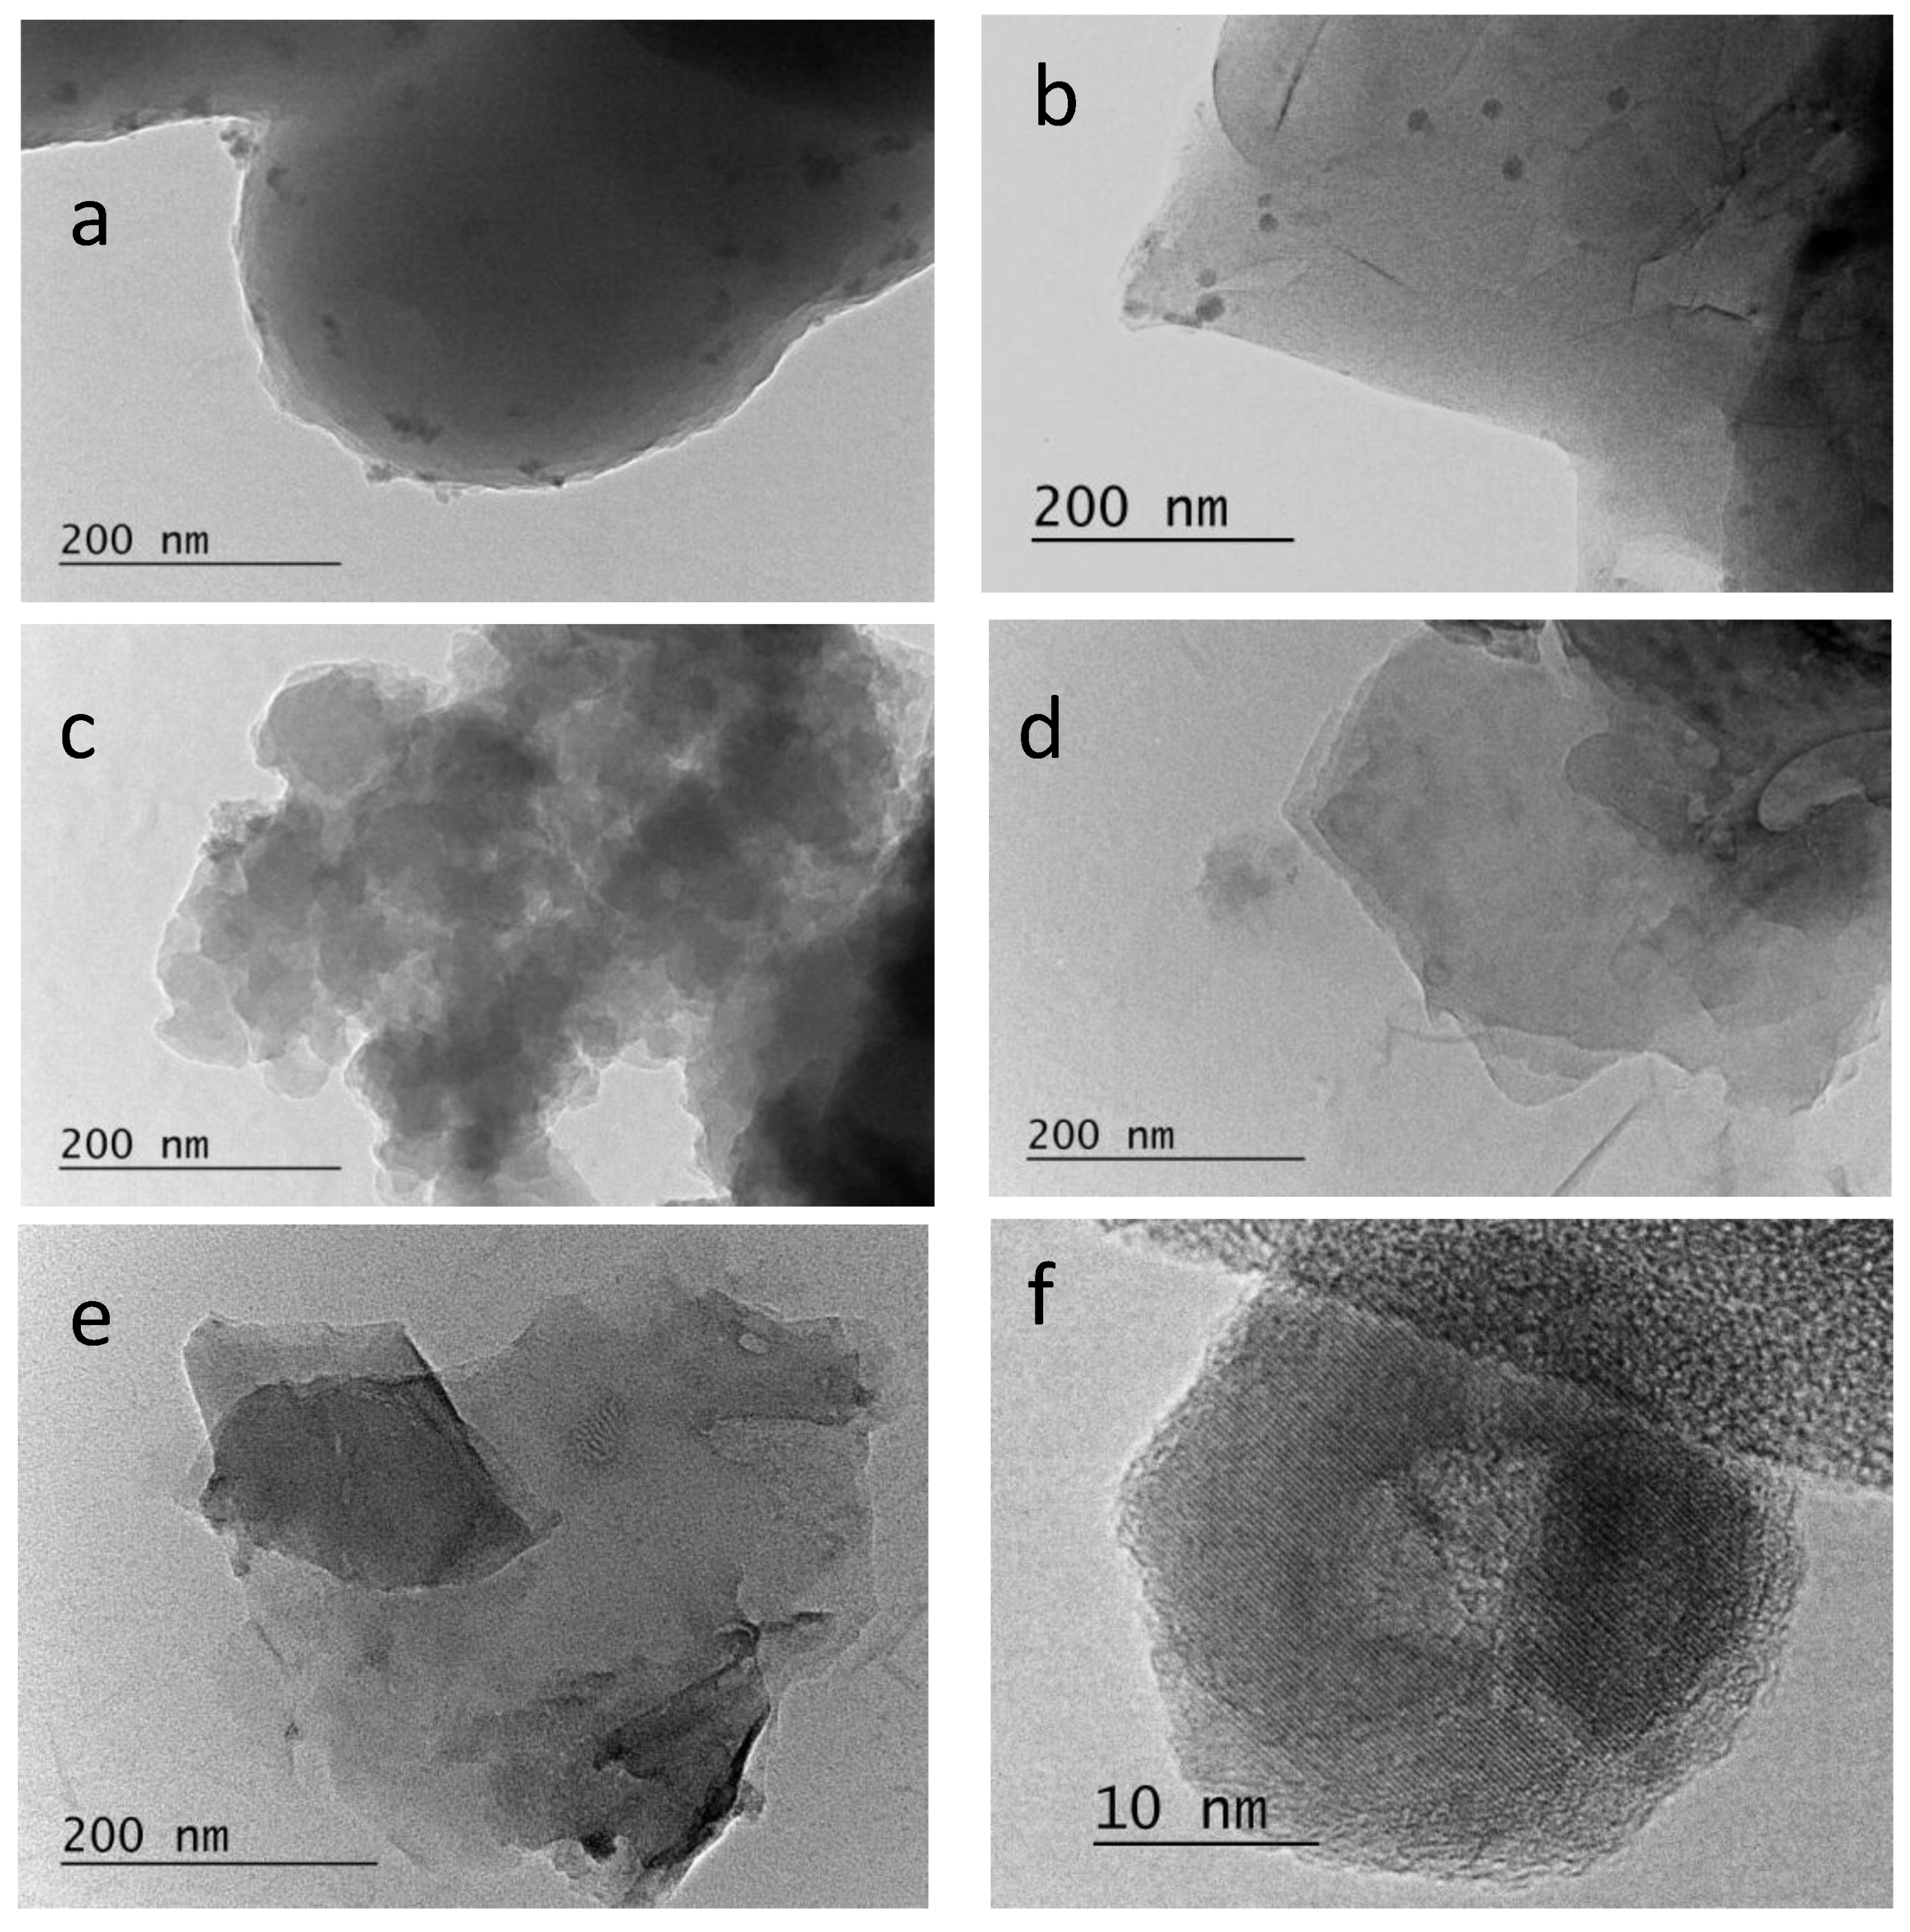
TEM images of all samples are presented in Figure 4. The referent RGO sample is presented as relatively small sheets, with some wrinkles and ragged edges. The NC-LAA contains amorphous mass covered with randomly distributed rounded small particles.
The NC/RGO-LAA image presents a large graphene sheet, which is also covered with well-defined, small, spherical, but clustered particles. This observation correlates well with the findings in the SEM analyses. It was determined that the average size of the particles of both LAA-derived samples was about 11.5 nm. The inset in Figure 4b represents an HRTEM of one of these particles, showing its core–shell structure. This observation leads us to the assumption that these particles represent carbon dots or dot-like objects. Carbon dots are an interesting class of non-traditional carbon materials composed of sp2 and sp3 domains, with a high capacity to retain various oxygen-containing groups on their surface, making a core–shell structure. These nanocarbon materials show specific morphological characteristics (spherical shape, and size below 20 nm or even 10 nm, with a carbonic core and oxygen-functionalized shell), enabling surface tuning [72]. The combination of the specific morphological forms of carbon dots and RGO could prevent restacking of the graphene sheets, thus leading to enhanced specific surface area of the composite, and providing large exposure of functional groups of both types of carbon materials.
On the other hand, the glycine-derived NC-Gly sample exhibits an amorphous material with irregularly shaped particles of no distinct sizes, as also seen in the SEM images. The image of NC/RGO-Gly shows predominantly large graphene sheets. Obviously, in this case, the NC material does not interact strongly with the RGO, and only a small part of the nanocarbon particles remains on the surface of the RGO sheets. This observation was further confirmed by the XPS analysis of the nitrogen content, estimating the nanocarbon content in the composite to be about 10%.

2.5. FTIR and Raman

FTIR and Raman analyses were conducted to examine the structural peculiarities of the materials obtained and the possible interaction of the two components of the composites. The main peaks observed provide insights into their chemical structures and the changes that occur during the preparation process. The comparison of the spectra of the nanocarbons and the composites revealed changes in the intensity of certain absorption peaks.
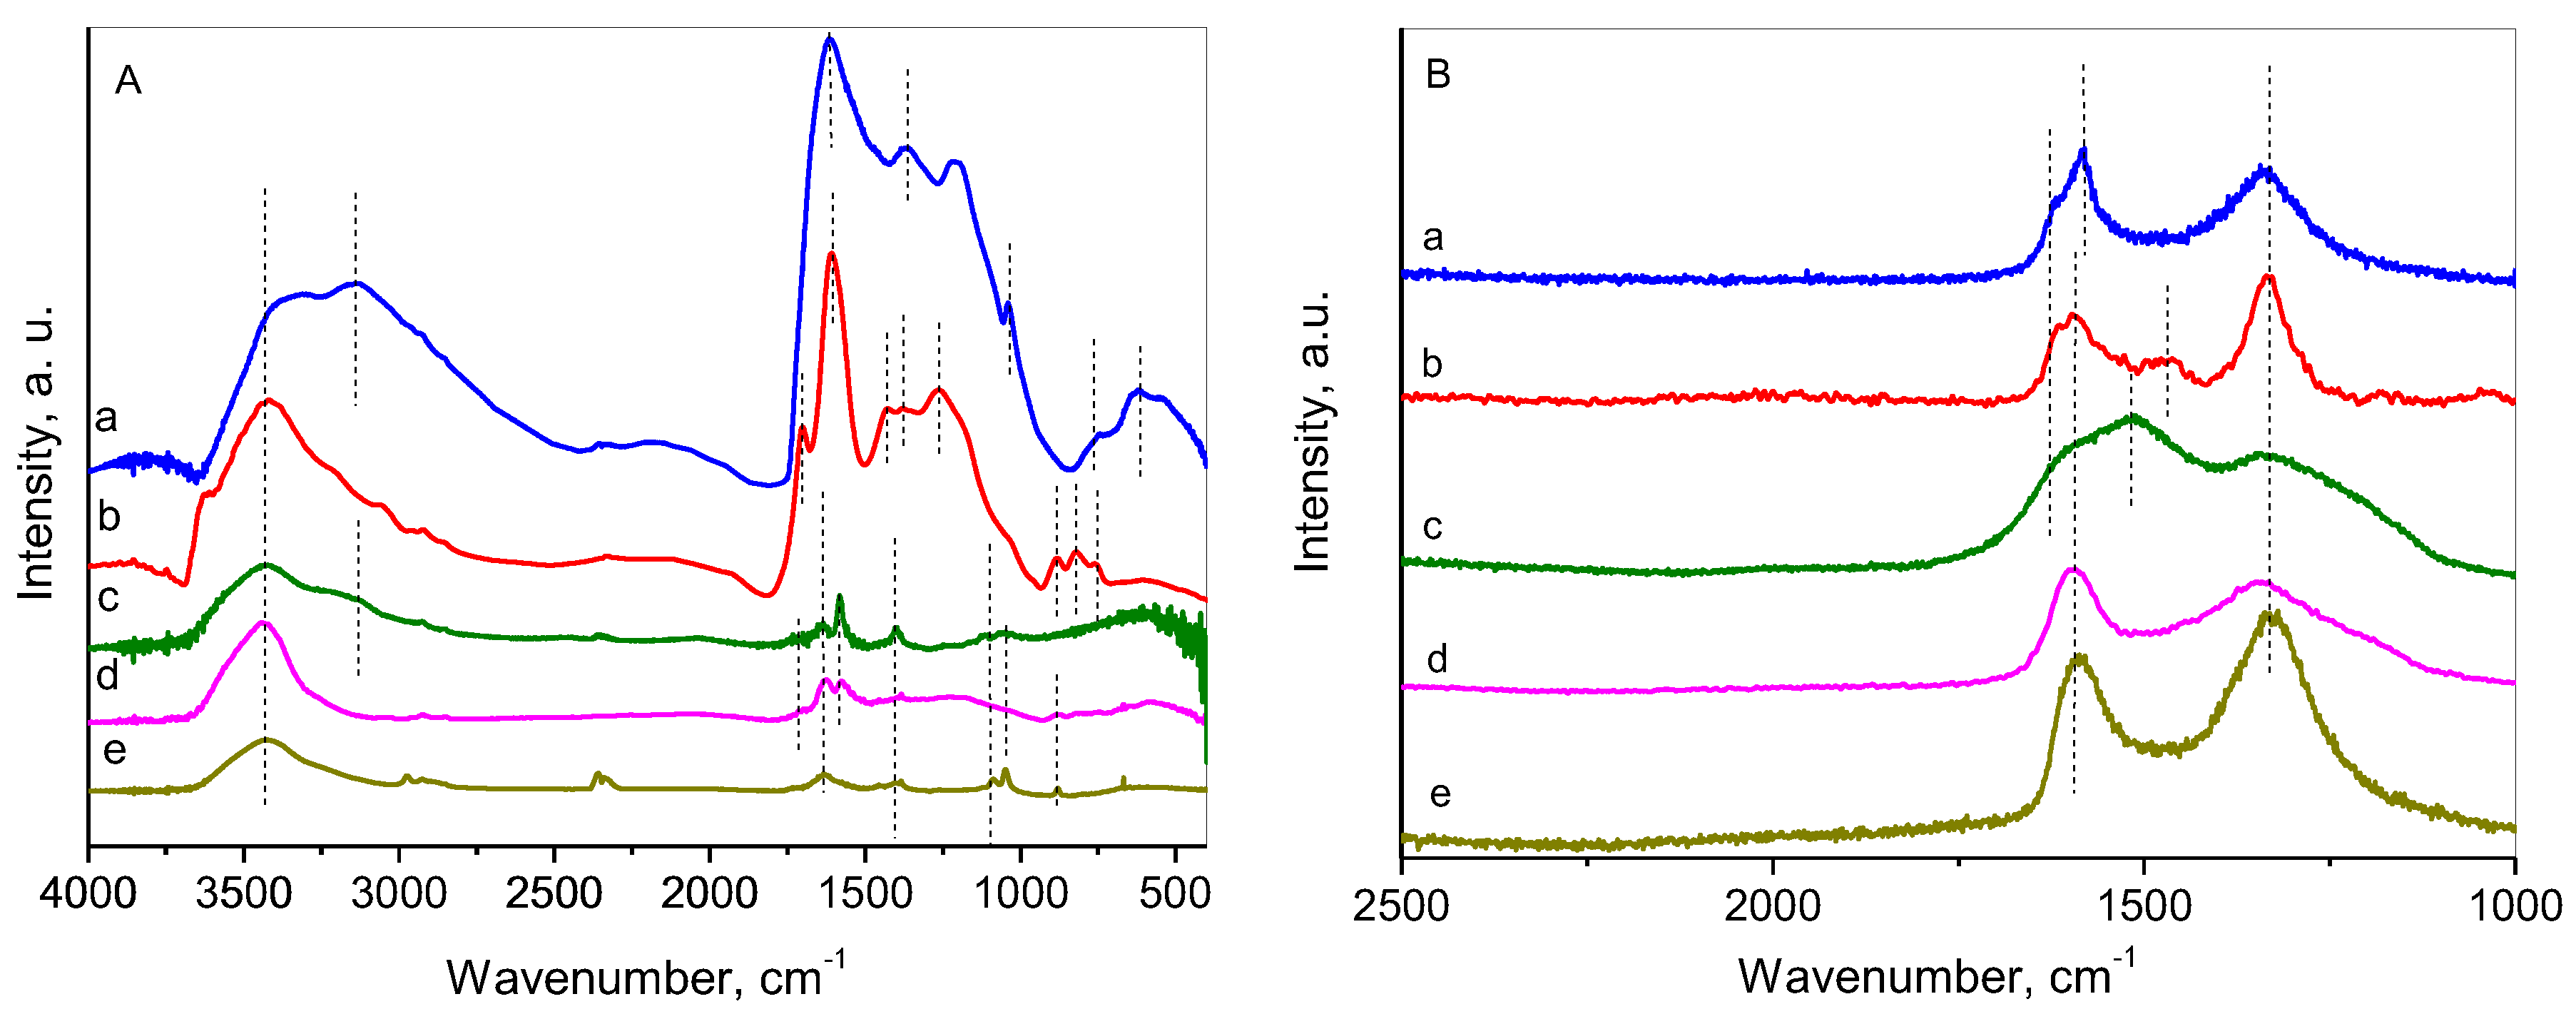
The FTIR and Raman spectra of the nanocarbon materials and their composites with RGO are presented in Figure 5. Additionally, information on the FTIR of L-AA and glycine is shown in Figure S2 and Figure S3, respectively, corresponding to the spectra given in the literature [73,74]. The first glance at the FTIR spectra (Figure 5A) reveals the distinct difference between the nanocarbons and the composites, demonstrated mainly in the peak intensities within the whole range. The spectrum of NC-Gly (blue) contains two intensive but broad peaks at 3400 and 3144 cm⁻1, corresponding to O–H and N–H stretching vibrations, respectively, indicating the presence of hydroxyl (-OH) or amine (-NH) groups, possibly from functionalized carbon or residual moisture [75]. The triplet at the region 2964–2852 cm⁻1 is assigned to C–H stretching vibrations, suggesting aliphatic carbon (sp3-hybridized) from amorphous carbon or functionalized carbon structures [76]. This region of the spectrum of NC-LAA (red) represents a narrower peak of O–H stretching vibrations and does not show a line for N–H. The triplet, assigned to the C–H stretching vibrations of sp3-hybridized carbon, is also observed. Similar to the NC-Gly, the peaks of O–H and N–H stretching vibrations, as well as the triplet of C–H stretching vibrations, suggesting aliphatic carbon, are observed in the spectrum of NC/RGO-Gly (dark green), with lower intensities. A similarity is also registered between the spectra of NC-LAA and NC/RGO-LAA (magenta).
A substantial difference is observed between the spectra of NC-Gly and NC-LAA in the range 1700–1000 cm−1. For NC-Gly, the peaks observed are at 1616 cm⁻1 for C=C stretching, characteristic of sp2-hybridized carbon; at 1360 cm⁻1 for C–O stretching from carboxyl or hydroxyl groups or C–N stretching in aromatic systems; at 1212 cm⁻1 for C–O stretching in oxygen-containing functional groups such as epoxide, carboxyl, or hydroxyl functionalities or C–N stretching in aliphatic amines; and at 1037 cm⁻1—C–O–C stretching vibrations, often linked to ether or epoxy groups [77]. For NC-LAA the spectrum presents peaks at 1702 cm−1, assigned to C=O stretching in carboxyl, ketone, and quinone groups; at 1612 cm−1, attributed to C=C stretching; at 1427 cm−1, due to C=C skeletal vibrations or C–O stretching; and at 1262 cm−1, linked to C–O stretching of epoxy or ether functionalities. Differences are also observed in the fingerprint region. For NC-LAA, the peaks in the range 890–760 cm−1 are attributed to C–H out-of-plane bending vibrations, while the peaks in the region 770–620 cm−1 for NC-Gly are assigned to C–N out-of-plane and C–N–C bending vibrations.
In the FTIR spectra of RGO (dark yellow), a broad band centered at approximately 3430 cm⁻1 is attributed to the O–H stretching vibrations of water molecules. The diminished intensity observed here implies a partial removal of surface-adsorbed water during the thermal treatment. The peak observed at 1630 cm⁻1, corresponding to C=C stretching vibrations, together with the doublet between 2800 and 3000 cm⁻1, suggests the retention of the conjugated carbon basal planes in RGO. Additionally, the bands at 1370 cm⁻1, 1080 cm⁻1, and 1050 cm⁻1 can be attributed to C−OH bending, alkoxy C−O stretching, and C−OH stretching vibrations, respectively. It is visible that the intensities of the peaks of the composites (magenta and dark green) in the upper region are quite lower than those of the NCs. In this region, the peaks related to the RGO component of the composites are predominant, while those related to the NC are suppressed. For both spectra, the line at 1730 cm−1 indicates a strong carbonyl (-C=O) presence, possibly from carboxyl or ester groups, characteristic of oxidized carbon materials [78]. A second common peak at 1580 cm−1 is further confirmation of sp2-hybridized carbon in graphitic regions of RGO [79].
Raman spectroscopy provides structural information about the sp2 and sp3 domains in the carbon materials (Figure 5b). All of the materials show two peaks in the 1750–1000 cm−1 region. These correspond to the G band, associated with graphitic C=C stretching vibrations, and the D band, arising from defects, edge effects, and sp3 carbon structures. For the referent RGO sample (dark yellow), the G band is observed at 1596 cm⁻1, and the D band appears at 1338 cm⁻1, typical for RGO [80]. Comparison of the Raman spectra of NC-Gly (blue) and NC-LAA (red) reveals that both nanocarbons exhibit a complex G band, which includes a D′ component associated with in-plane defect-activated vibrations of the graphene sheets. The D band is broader for NC-Gly, implying smaller particles or an amorphous state. The intermediate peak at 1470 cm−1 for NC-LAA suggests surface functionalization or disorder beyond the basic D/G modes and is often linked to doping or surface peculiarities. The Raman bands at ~1100 cm⁻1 and ~1400 cm⁻1 are not characteristic of highly ordered carbon materials like graphene or carbon nanotubes. However, they could be observed in defective, functionalized, or partially disordered carbon materials, especially those with polyene-type (conjugated sp2 carbon) segments. They could originate from finite-length, disordered, polyene-type sp2 carbon structures, and possibly from C–C/C–O modes associated with functionalized or partially oxidized graphene-like materials. Their presence supports the idea of fragmented or chemically modified nanocarbons.
As concerns the composite materials NC/RGO-Gly (dark green) and NC/RGO-LAA (magenta), the D and G bands are very broad and may be regarded as a superposition of several contributions. The linewidth of these Raman peaks is directly related to the degree of disorder, and broader linewidths typically indicate greater disorder in the carbon structure. The increase in linewidth and intensity in the D band, which is associated with defects and disorder in sp2 carbon systems, usually reflects more structural defects or amorphization. The G band, related to the in-plane vibration of sp2 carbon atoms, also broadens and shifts with increasing disorder. For the G band, the main contribution is from the presence of ordered sp2 carbon domains, and an additional D’ band at 1631 cm−1 is connected to the defect-induced mode or stress in the carbon lattice, distinct from the main D band. The observation of a D’ band at 1631 cm−1 as a shoulder of the G band is a characteristic feature that reflects the disordered nature of the material—specifically, the presence of defects and small sp2 clusters within the structure of the amorphous carbon material [81]. Both spectra show a very broad Raman D band, but the origin of the broadening seems different. In the case of NC/RGO-Gly, it is due to the nitrogen doping or amorphous carbon components, while for NC/RGO-LAA the broadening is possibly due to small graphitic domains, which are common in carbon dots due to their confined structure.

2.6. XPS

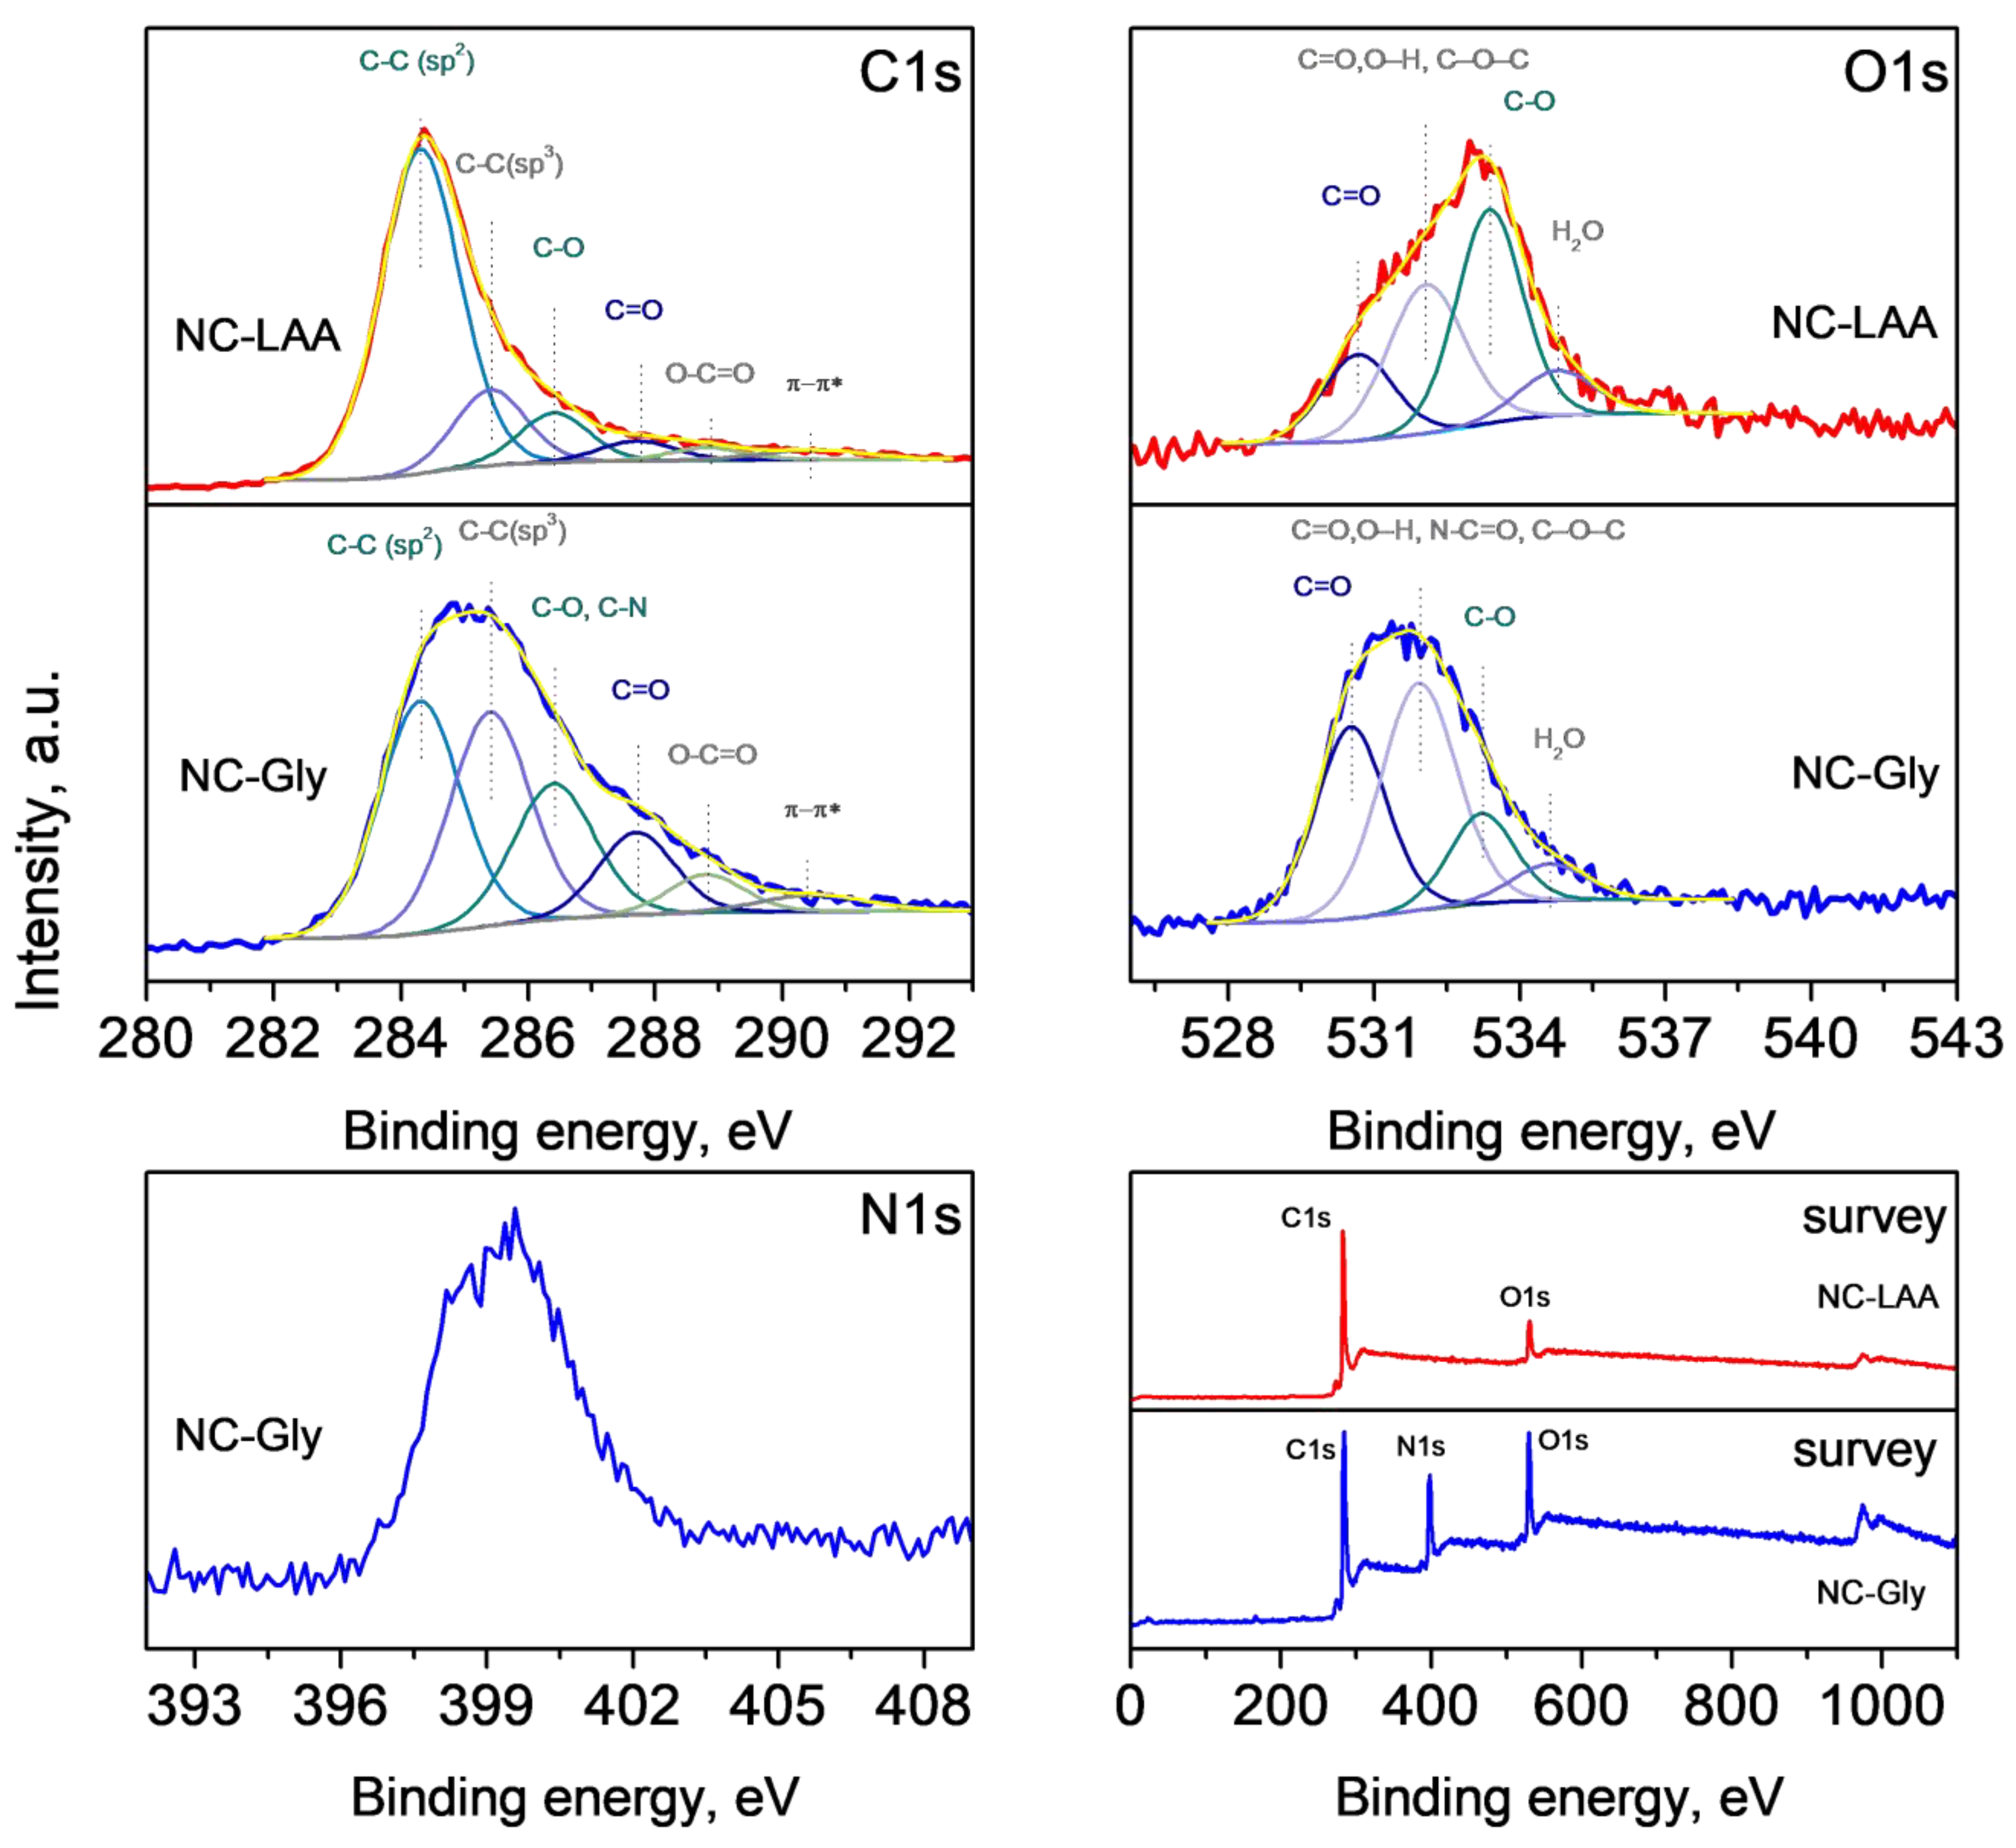
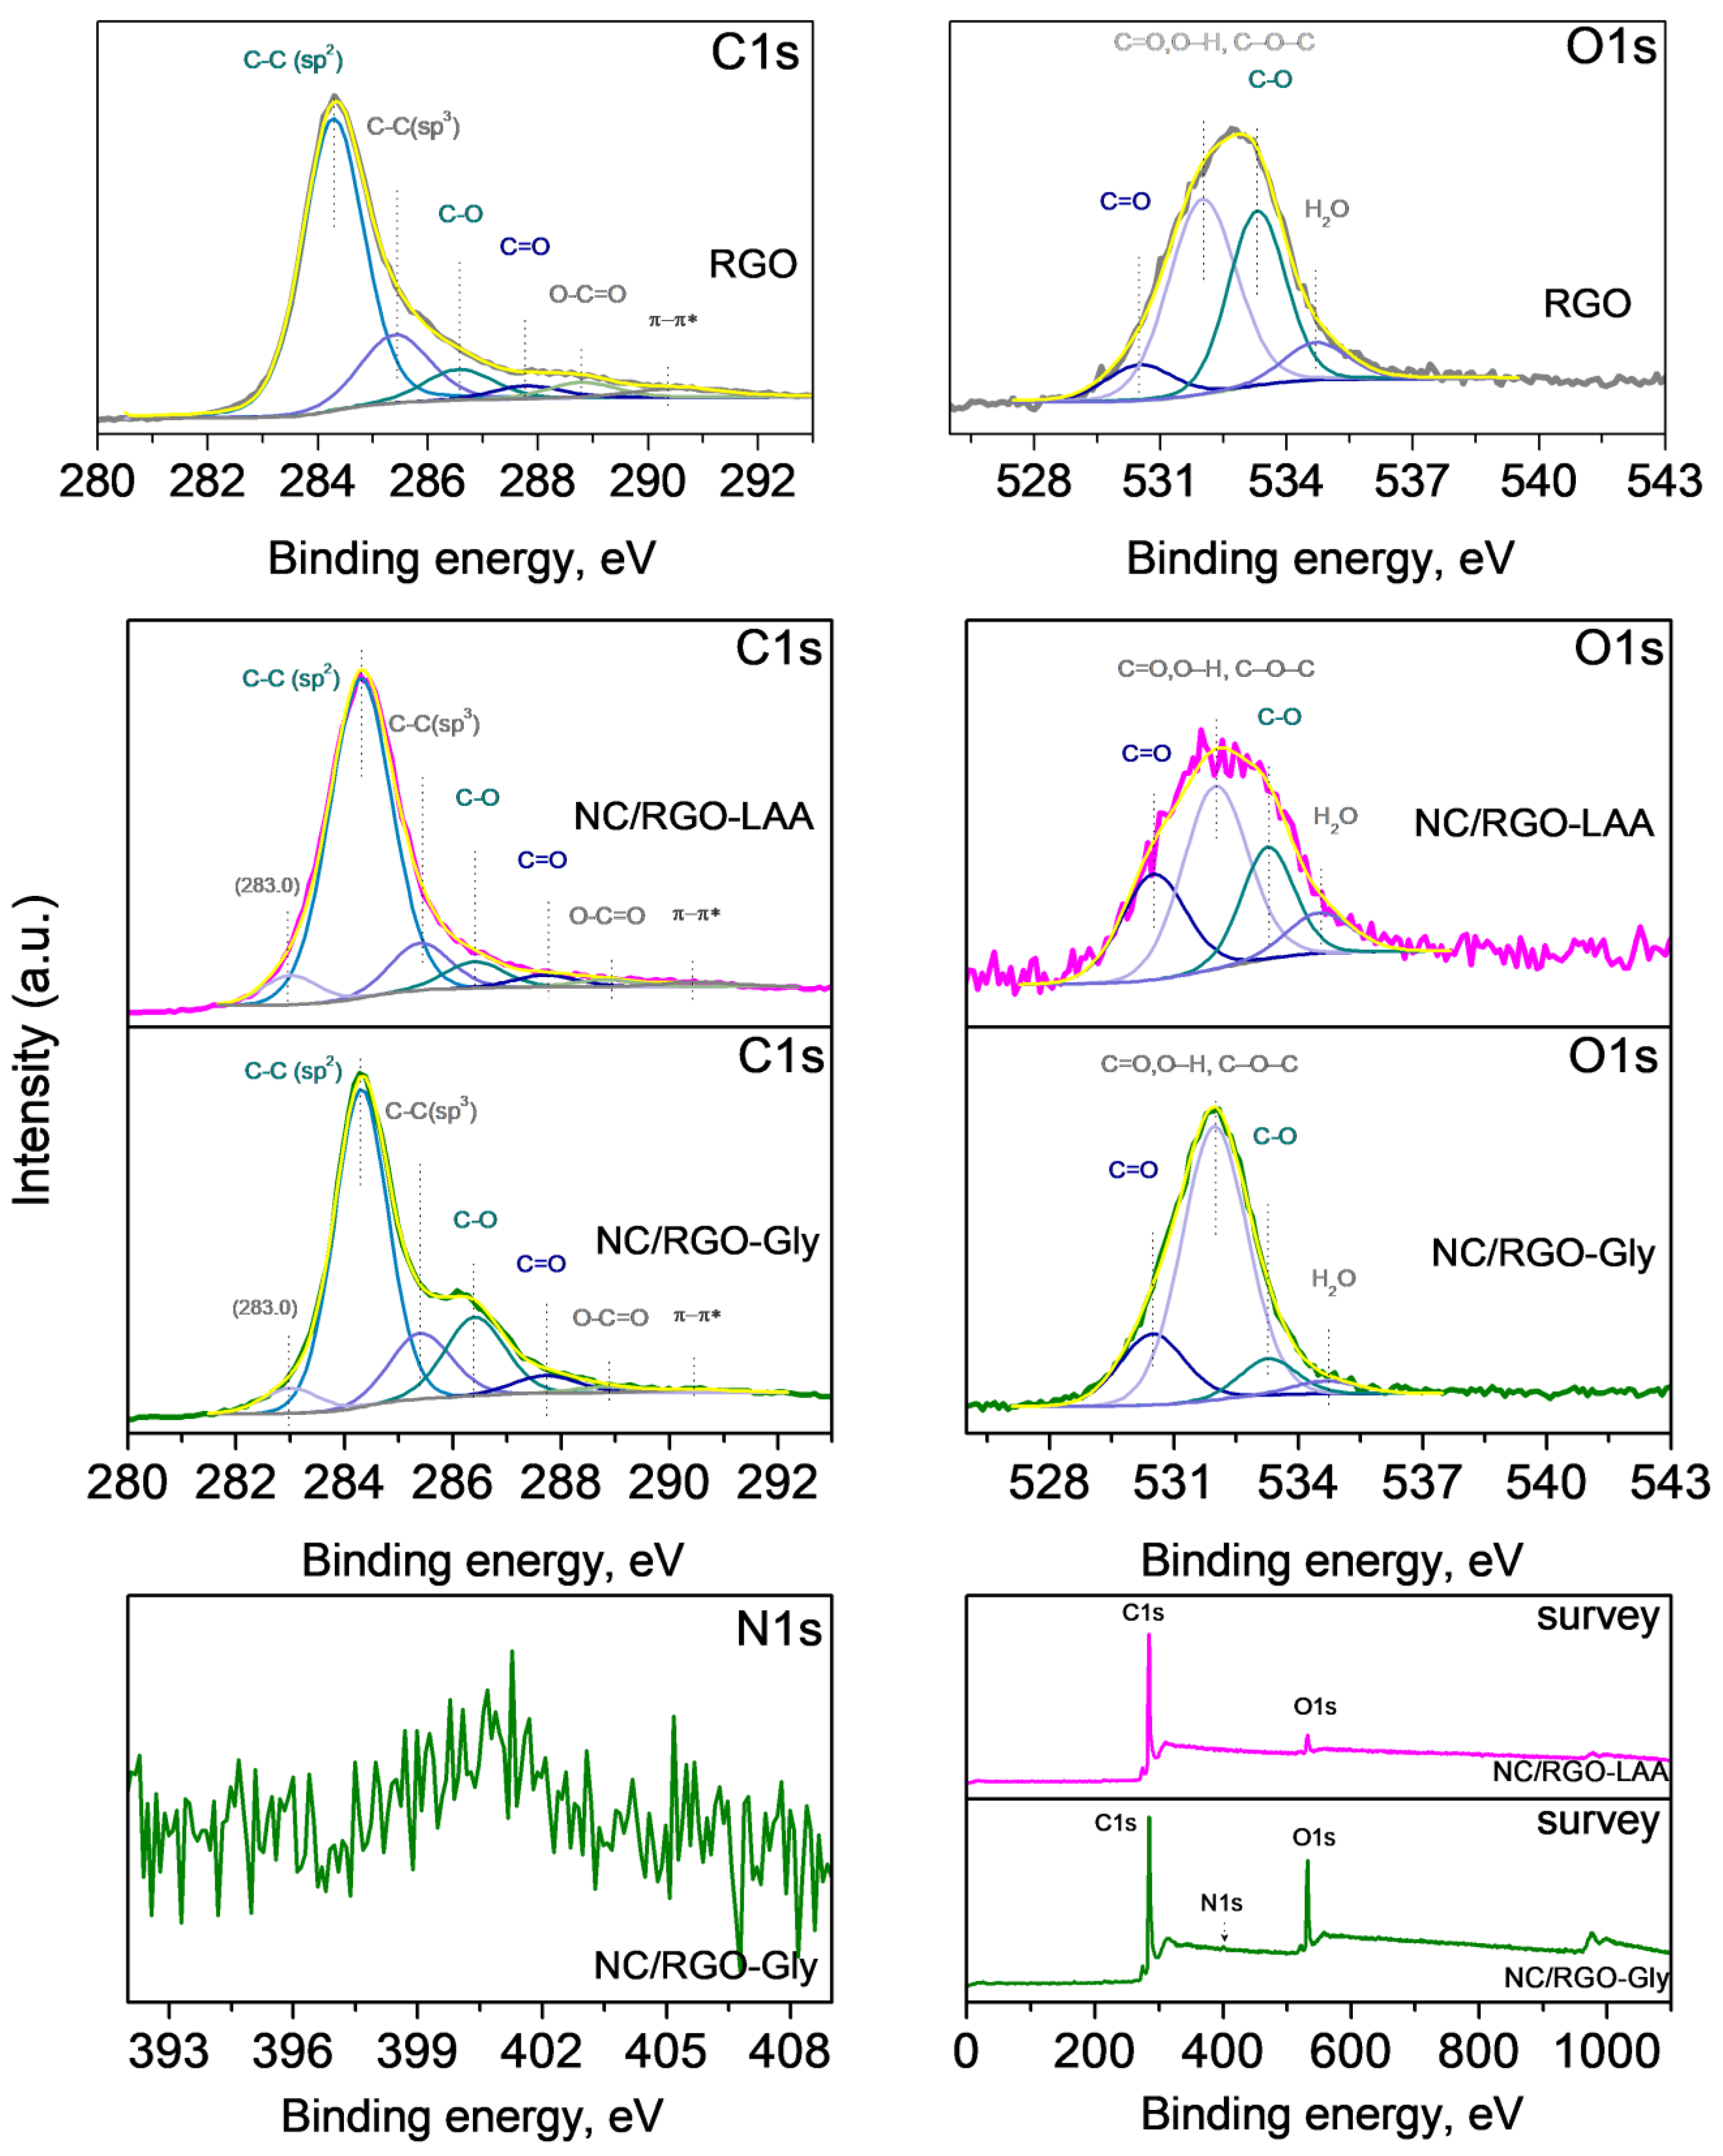
XPS analysis was used for elucidation of the surface chemical states. In the wide scan at 0–1100 eV, the photoelectron peaks of carbon C1s, oxygen O1s, and nitrogen N1s, the Auger peak O KLL of oxygen, and the corresponding X-ray satellite peaks were identified. The C1s region offers insights into the various chemical environments of carbon atoms in a material. Accurate deconvolution of the C1s envelope is critical for distinguishing between the bonding configurations.
Figure 6 and Figure 7 present the C1s, O1s, and survey spectra for NC-LAA, NC-Gly, NC/RGO-LAA, NC/RGO-Gly, and the reference RGO, along with the N1s spectrum of NC-Gly and NC/RGO-Gly. Table 2 presents the surface chemical composition of the studied materials.
The C1s region of all materials shows broad asymmetric peaks, due to the contribution of various carbon bonds. The careful deconvolution of the peaks reveals the main feature at 284.3 eV, belonging to sp2-hybridized carbon, characteristic of graphitic carbon, aromatic systems, etc. This peak was used for the calibration of the spectra, as the adventitious carbon is a contribution that cannot be distinguished. The contribution at 285.4 eV is often assigned to sp3-hybridized carbon atoms in aliphatic C–C and C–H bonds. One could notice that NC-Gly presents a higher peak for sp3-hybridized carbon, which is expected due to the aliphatic nature of the precursor glycine, while this peak is much lower for NC-LAA. The peaks at 286.4 eV and 287.7 eV could be ascribed to C–O (in alcohols and ethers) and C=O (in ketones or carboxylic derivatives), respectively. The peak at 286.4 eV also reflects the presence of C–N bonds in NC-Gly [82]. The peak at 288.8 eV is usually associated with O–C=O groups, and that at 290.5 eV represents a π–π* shake-up satellite that appears in highly conjugated π systems [83,84].
The O1s spectra of both nanocarbons confirm the presence of oxidized species such as C=O (530.5 eV), O–H, C–O–C (532.0 eV), C–O (533.3 eV), and H2O (534.6 eV). In the case of NC-Gly, a contribution of N-C=O at 532.0 eV could be suggested [82].
The spectra presented in Figure 7 for the composites and RGO show the same features at the same binding energies, differing only in their intensities. The small contribution in the C1s spectra of NC/RGO-LAA and NC/RGO-Gly at 283.0 eV likely originates from the presence of very small graphene particles, which exhibit different electrostatic charging during photoemission [85,86]. The N1s spectra definitively confirm the presence of nitrogen atoms in NC-Gly and NC/RGO-Gly (as detected by FTIR), although their content differs significantly in the samples, being 22.3 at.% and 2.1 at.%, respectively. Thus, it can be assumed that the content of nanocarbon in NC/RGO-Gly is approximately 10%. For the NC/RGO-LAA sample, the nanocarbon content could not be assessed, as both components contain the same chemical elements. The N1s peak at 399.3 eV in NC-Gly’s spectrum is well defined but is asymmetric, which indicates nitrogen atoms involved in different types of functional groups (pyrrolic, amine) [87]. The assignment of the N1s XPS peak at approximately 400.6 eV in NC/RGO-Gly is to graphitic (or quaternary) nitrogen, resulting from the substitution of a carbon atom by a nitrogen atom within the graphitic basal plane of the reduced graphene oxide [88].
The data presented in Table 3 reveal the contribution of each component of the composites in comparison to bare RGO. It is evident that the oxygen content is enhanced in the NC/RGO-LAA and NC/RGO-Gly due to the presence of nanocarbons. In the NC/RGO-Gly, the O/N ratio is also enhanced.

2.7. CO2 Adsorption

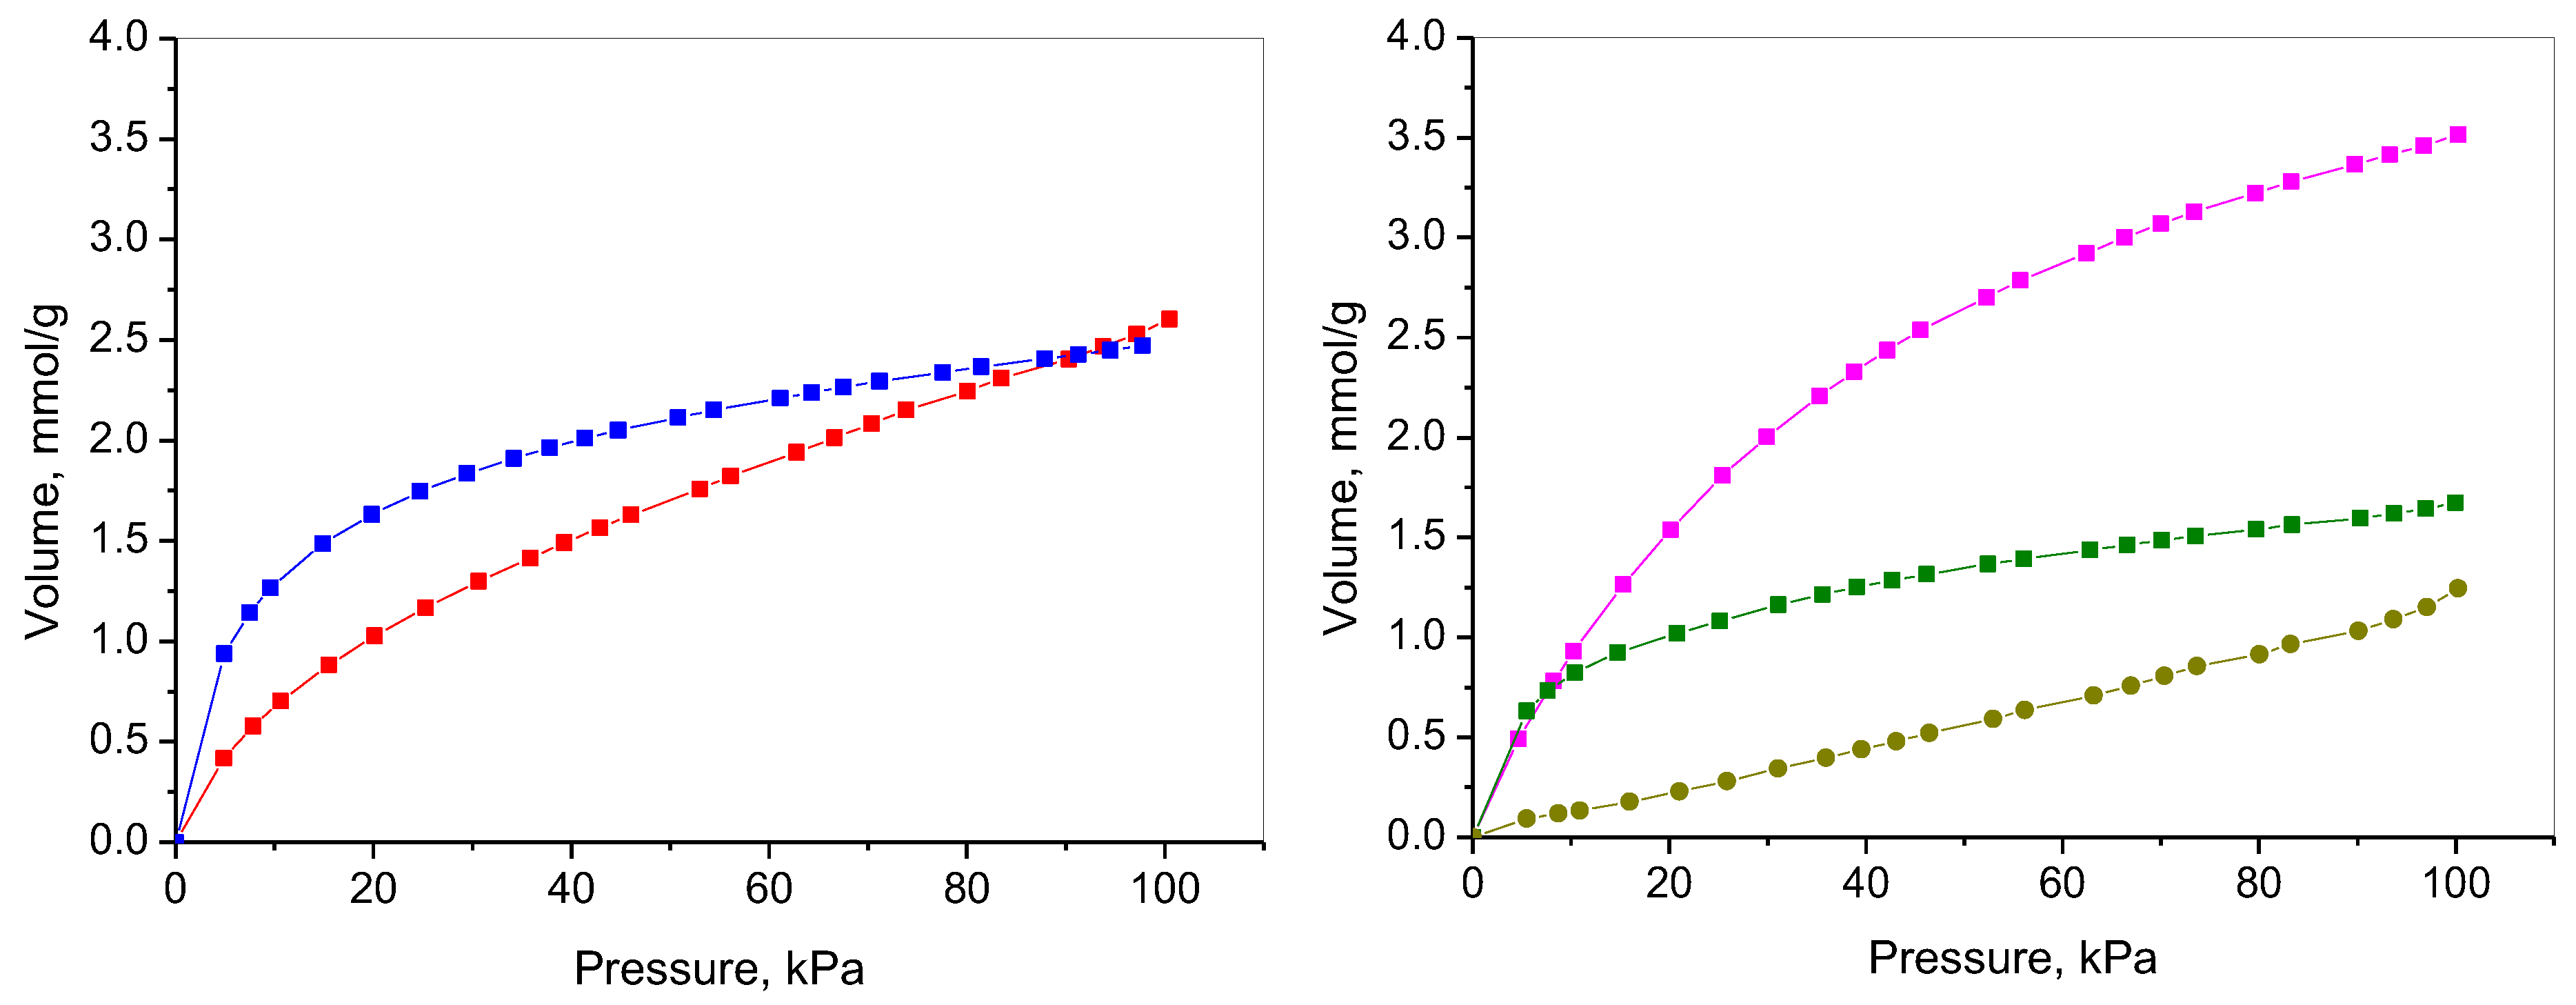
Figure 8 presents the adsorption of CO2 on the prepared NCs and NC/RGO composites. At 273 K and 100 kPa, the observed adsorption capacities for NC-LAA and NC-Gly reached 2.6 mmol/g and 2.5 mmol/g, respectively. The registered adsorption capacities for the composites were 3.5 mmol/g and 1.7 mmol/g for NC/RGO-LAA and NC/RGO-Gly, respectively. The referent bare RGO, prepared by the same procedure without L-AA and glycine, presented an adsorption capacity of 1.2 mmol/g.
Recent studies have drawn attention to the relationship between CO2 uptake and total surface area, emphasizing the complexity of CO2 adsorption mechanisms beyond conventional pore size classifications. While the total BET surface area is commonly regarded as an important factor affecting gas adsorption capacity, emerging research suggests that this correlation is more nuanced than traditionally assumed. Factors other than surface area, such as the material’s porosity and the chemical properties of the adsorbent, play critical roles in the adsorption process, highlighting that a high BET surface area does not always translate into effective CO2 capture [89].
The CO2 adsorption is influenced not only by the total surface area but also by how that surface area is distributed among various pore sizes. A higher BET surface area is generally favorable, but the chemical environment and the specific porous architecture may more profoundly influence the CO2 uptake efficiency. In our case, NC-LAA possessed the highest BET surface area (496 m2/g), while NC-Gly had the lowest (15 m2/g), but their adsorption capacities were not proportional to them. In general, the adsorption capacities of the carbon-based materials are not due to their high specific surface area but, rather, a result of the volume of narrow micropores. Micropores significantly influence the adsorption behavior of CO2 due to their structural characteristics, and the volume and size distribution of these micropores are crucial for the CO2 capture efficiency of various carbon materials. Studies have emphasized the importance of narrow micropores in CO2 adsorption, as their dimensions closely match the kinetic diameter of CO2 molecules, thus strengthening van der Waals interactions, which, in turn, boosts the adsorption capacity. Consequently, materials possessing a higher volume of such micropores typically exhibit greater CO2 uptake [90,91]. It was found that the pore volume of micropores smaller than 0.8 nm (ultramicropores) is particularly influential in CO2 adsorption, especially under varying pressures [92,93,94], while larger micropores are filled with increased pressure. The ability of CO2 molecules to fill these small micropores is attributed to their strong adsorption potentials, which are enhanced in narrow micropores. In addition to volume, the specific surface area of microporous carbon materials also contributes to their CO2 adsorption capabilities. Furthermore, the interaction between CO2 molecules and the carbon surface, influenced by the micropore structure, can enhance adsorption through mechanisms such as hydrogen bonding and π–π interactions [95].
The different courses of the adsorption curves for NC-LAA and NC-Gly should be noted. At low pressures, NC-Gly adsorbs quite a lot of carbon dioxide, irrespective of its low micropore volume. As glycine is a nitrogen-containing compound, the prepared NC contains some amount of nitrogen in the form of basic functional groups, which can be registered from its XPS and FTIR spectra. In this case, glycine-derived materials may be regarded as N-doped carbon materials, leading to their enhanced CO2 affinity. The final adsorption capacities of both NC materials are almost equal, at 100kPa.
It was reported that graphene sheets exhibited higher adsorption capacities compared to other carbon nanostructures, such as activated carbons and carbon nanotubes, under similar conditions, underlining the importance of the textural properties and surface functionalities in the adsorption performance of graphene derivatives [55]. However, our reference RGO sample exhibited the lowest adsorption capacity compared to the NC and NC/RGO materials. Analyzing the CO2 adsorption curves of the bare RGO, nanocarbons, and composites, we can deduce that composites show enhanced adsorption capacity values surpassing the simple sum of their components (in the case of NC/RGO-Gly, the nanocarbon content is 10%); thus, a synergic effect between the nanocarbons and RGO can be considered. For NC/RGO composite materials, a significant difference in the CO2 adsorption properties is registered. This fact is connected mainly to the differences in their textural characteristics. The NC/RGO-LAA composite material forms an interconnected network that facilitates gas diffusion (due to the presence of mesoporosity), combining the advantages of both reduced graphene oxide and nanocarbons (comprised of amorphous carbon and carbon dots), thus providing abundant active sites for the efficient physisorption of CO2 molecules [96]. It contains a large number of micropores (30% of them ultramicropores, below 0.8 nm) that play a role as active sites for CO2 adsorption. Hence, the combination of both types of carbon material ensures the specific surface functionalization and morphological features, enabling better CO2 adsorption. On the other hand, the NC/RGO-Gly shows a low micropore volume, which explains its lower capacity. It is worth mentioning that NC-Gly retained more nitrogen functionalities than NC/RGO-Gly, and this could explain its higher CO2 adsorption even with a lower specific surface area and microporosity.
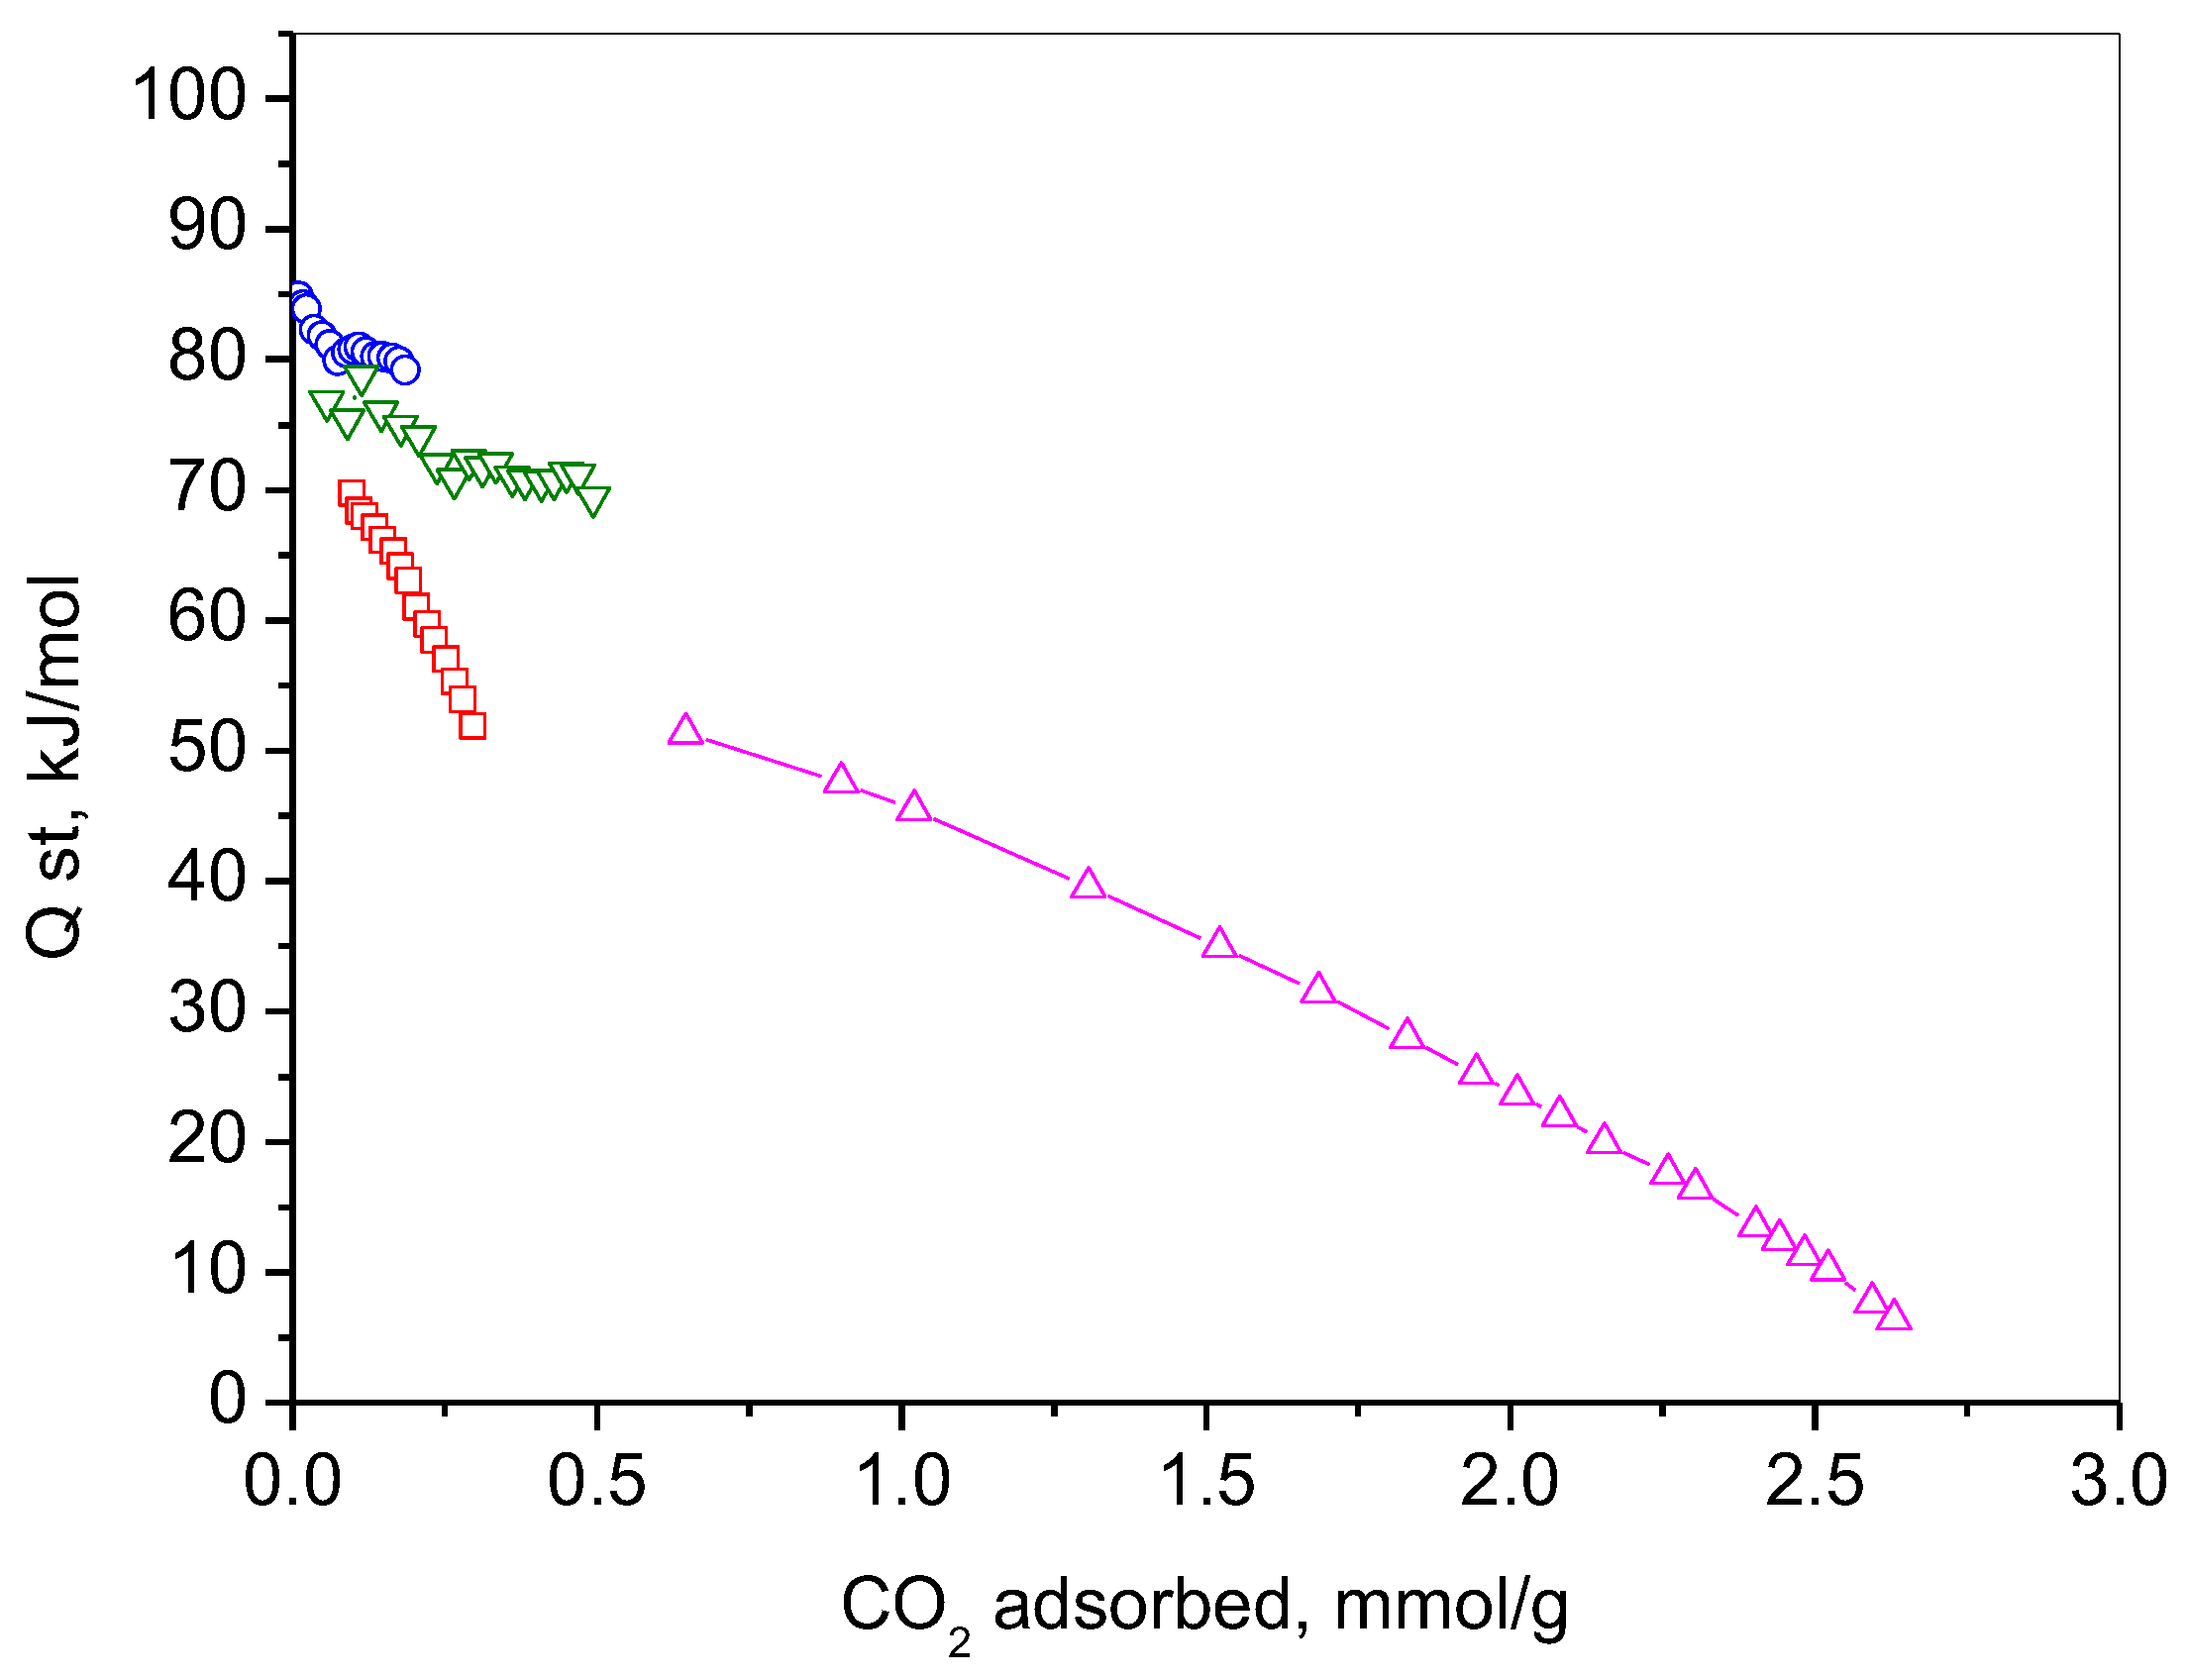
The adsorption behavior of the studied materials could be explained further by presenting their isosteric heats of adsorption (Qst), as on carbon-containing materials (like activated carbon, biochar, carbon nanotubes, graphene oxide, etc.) they vary depending on the material’s surface chemistry, porosity, and structure. This indicates the strength of the interaction between CO2 molecules and the surface of the adsorbent. The calculated isosteric heats, according to the Clausius–Clapeyron equation from adsorption isotherms at different temperatures, are presented in Figure 9.
The heat of adsorption for physical adsorption is generally low, within the range of 8–40 kJ/mol [97]. This is consistent with values comparable to the heat of condensation of the adsorbate, reflecting weak van der Waals interactions. Conversely, chemisorption exhibits significantly higher heats of adsorption, ranging from 40 to 800 kJ/mol, indicative of stronger chemical bonding, and aligning with the enthalpy changes associated with chemical reactions [98]. It can be seen that all investigated samples at low CO2 coverage present high adsorption heats in the range of chemisorption. The results confirm the assumption that NC-Gly and NC/RGO-Gly adsorb CO2 through their nitrogen-containing groups. NC-LAA and NC/RGO-LAA have lower heats of adsorption compared to the glycine-derived materials, but they are still in a chemisorption range due to their oxygen surface functionalities.
The NC/RGO-LAA, showing the highest adsorption capacity, combines initial chemisorption followed by physisorption. The composite NC/RGO-LAA benefits from a composite structure that combines hierarchical porosity with functional groups arising from incomplete reduction (see FTIR and XPS), promoting selective CO2 binding. The probable presence of carbon dots relies on the optimized formation of ultramicropores during preparation processes, creating an ideal environment for the physisorption of CO2. Some studies highlight that the design of carbon-based CO2 adsorbents must consider both the microstructural properties arising from the material’s precursor and the specific preparation methods used to tune their porosity and surface modification [55,99].
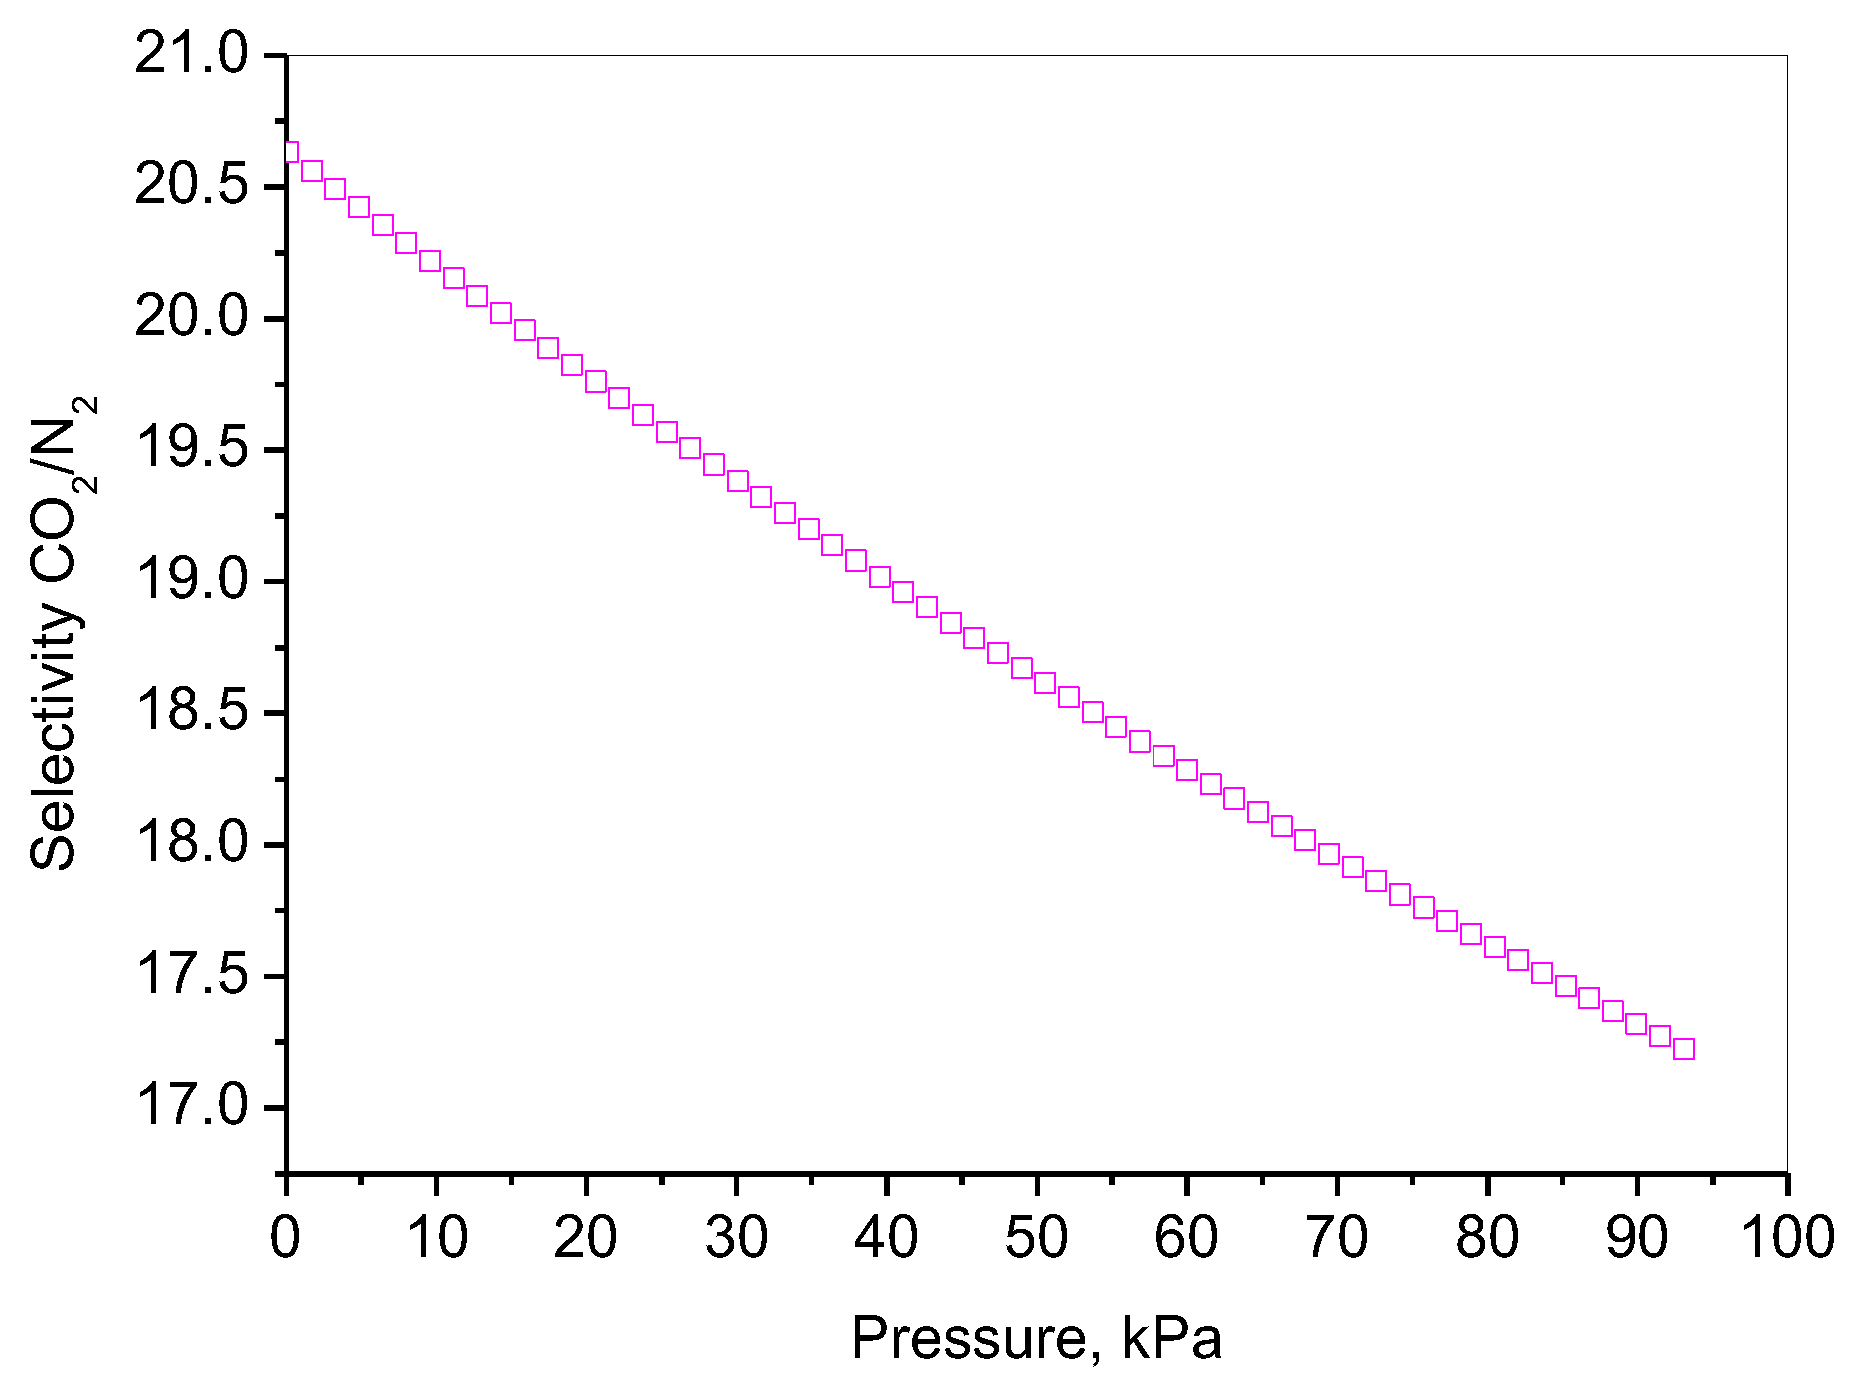
The effectiveness of carbon capture using solid adsorbents largely depends on their ability to selectively separate CO2 from N2. Because of this, post-combustion CO2 capture technologies require sorbents with high CO2/N2 selectivity. Typically, flue gas consists of 15% CO2 and a minor presence of water vapor, with N2 being the main component in it. The selectivity of an adsorbent material for CO2 over N2 is primarily motivated by differences in their physical and chemical properties and how they interact with the adsorbent’s surface. The predictive selectivity towards CO2 and N2 for the best-performing material (NC/RGO-LAA) was evaluated by separately measuring the adsorption capacity of pure CO2 and pure N2 at 0 °C using the IAST [100] and presented in Figure 10.
The selectivity of an adsorbent for CO2 over N2 is driven by differences in molecular properties, including size, polarizability, electrostatic interactions, and adsorption energy [101,102,103]. At low pressures, CO2, which has a higher quadrupole moment (oxygen-containing) [104] and greater polarizability than N2 [105,106], preferentially adsorbs onto the NC/RGO-LAA due to interactions with functional groups (e.g., hydroxyl, carboxyl, etc.). The selectivity (CO2/N2) is usually high because CO2 interacts more strongly with the surface, and N2 adsorption remains weak. At intermediate pressures, competition with N2 may begin. As the NC/RGO-LAA material has high microporosity, the selectivity can remain relatively high. At higher pressures, the selectivity decreases as N2 adsorption increases, due to physical adsorption in larger pores. The NC/RGO-LAA material seems to show an optimized pore structure, with appropriate basic functional groups facilitating the electrostatic interactions with CO2, thus enhancing the selectivity over N2.

3. Materials and Methods

3.1. Materials

The materials used were synthetic graphite powder (Sigma-Aldrich, Saint Louis, MO, USA, 99% carbon, 50 mesh), H2SO4 (98%), KMnO4, H3PO4 (85%), and p.a. from Merck KGaA, Darmstadt, Germany.

3.2. Synthesis of Composites

The synthesis of the composites started with the use of the modified Tour procedure for obtaining GO [107]. According to this, to 1 g of graphite powder previously ground in an agate mortar, 36 mL of H2SO4 and 4 mL of H3PO4 were added. The components were stirred intensively with a mechanical stirrer in an ice bath for 15 min. Then, 5 g of KMnO4 in 100 mL of distilled H2O was added dropwise to the mixture to avoid an increase in the temperature of the reaction mixture. This combination of strong acid and oxidizing agent ensures the effective oxidation of the graphite compound, providing exfoliation of the graphite sheets and pillaring them with oxygen-containing functional groups. Stirring was continued for another 30 min in the ice bath. After that, 50 mL of deionized water was added. The resulting suspension was left to stand for 12 h. As a next step, a solution of 5 mL of 30% hydrogen peroxide in 70 mL of deionized water was slowly added under constant stirring at room temperature to stop the oxidation. Then, 50 g of two types of reducing agent—one of them pure low-molecular-weight carbohydrate L-ascorbic acid (C6H8O6, L-AA), and the second one the simplest stable nitrogen-containing amino acid glycine (C2H5NO2, Gly)—was added directly to the suspension. In this synthesis step, part of the reducing agent provides in situ reduction of the GO to RGO, and the remaining content interacts with the aforementioned strong acids and KMnO4, resulting in dehydration and carbonization to a form of nanocarbon. During this stage, a certain amount of gases (CO2, SO2, O2, H2O) is released, although the gas evolution is not intensive. In the case of glycine, additional gases like NH3 or NO2 could be emitted. Then, the mixtures were sonicated for 15 min using a Sonix ultrasonic processor (20 KHz, 750 W) and left to stand for 2 h. A washing procedure was applied on a Buchner funnel until the drained water reaches pH = 6.5. The wet solid residue was dried at 363 K for 3 h. The resulting powder was subjected to additional thermal treatment at 873 K in Ar flow for 3 h. This step was intended to achieve full carbonization, accompanied by an increase in the specific surface area of the material.
The preparation scheme is presented in Figure S4.

3.3. Synthesis of Nanocarbons

The synthesis of NC-LAA and NC-Gly was performed in the following way: To the initial mixture of the abovementioned quantities of H2SO4 and H3PO4, stirred for 15 min, a solution of 5 g of KMnO4 in 100 mL of distilled water was poured. Then, 50 g of L-ascorbic acid (L-AA) or 50 g of glycine was added. In this case (in the absence of graphite), the chemical reactions included only the interaction between the strong oxidants and the organic components. The mixture was stirred for 30 min in an ice bath, followed by the addition of 50 mL of deionized water. After standing for 12 h, a 5 mL hydrogen peroxide solution was slowly added. The sonication of the mixture was performed for 15 min, and after being left for 2 h it was washed to pH = 6.5 and dried at 363 K for 3 h. The additional thermal treatment was carried out at 873 K for 3 h in Ar flow.

3.4. Synthesis of RGO

For comparison, bare RGO was prepared as described in Section 3.2, without using reducing agents. The obtained GO was washed to pH = 6.5 and dried at 363 K for 3 h. The reduction of GO was performed thermally at 873 K for 3 h in Ar flow.

3.5. Characterization

X-ray diffraction (XRD) analyses were carried out to determine the phase composition of the prepared materials. А Bruker D8 Advance powder X-ray diffractometer (Bruker AXS, Karlsruhe, Germany) with Ni-filtered Cu Kα radiation and a LynxEye solid-state position-sensitive detector was applied. The PDF-2 (2021) database of the International Center for Data Diffraction (ICDD) and the DiffracPlus EVA software package (version 4.1, Bruker AXS, Karlsruhe, Germany) were used to perform the analyses. The samples were placed on a zero-background sample holder from the standard set of the diffractometer accessories.
The morphology of the prepared materials was examined using scanning electron microscopy (SEM) on a JEOL JSM-6390 (JEOL Ltd., Tokyo, Japan) with EDS (Oxford Instruments, Abingdon, UK). The samples were placed on a double-sided conductive copper tape. The particle diameter size evaluation was carried out on the basis of about 200 particles (aggregates) for each sample, using ImageJ (v. 1.51) (NIH, Bethesda, MD, USA).
The transmission electron microscopy (TEM) was carried out on a JEOL JEM 2100 microscope (JEOL Ltd., Tokyo, Japan) at 200 kV. High-resolution (HRTEM) mode was also used for observations of the structure of the samples. The samples were gently ground in an agate mortar and ultrasonically dispersed in ethanol for 15 min. A drop of the suspension was deposited onto a holey carbon film on a copper grid.
The texture properties of the synthesized materials were analyzed using the nitrogen adsorption isotherms obtained at −196 °C, performed on a Quantachrome Nova 1200e instrument (Anton Paar, Boynton Beach, FL, USA). The specific surface area was calculated using the BET method, while the total pore volume was determined at a p/p0 ≈ 0.99. The average pore diameter and pore size distributions were calculated using the NLDFT method with the slit pore model (equilibrium kernel). The volumes of the micropores were determined by the V-t method, and the micropore distributions were evaluated by the Dubinin–Astakhov method.
A micro-Raman spectrometer (LabRAM HR800, HORIBA Jobin Yvon IBH Ltd. Glasgow, UK), configured with a 600 mm⁻1 diffraction grating and integrated optical microscopy, was employed for spectral acquisition. Excitation was provided by a 633 nm helium–neon (He–Ne) laser operating at an output power of 40 μW. A 100× objective lens was used to achieve precise laser focusing onto the sample surface. The samples were placed on a glass holder.
The Fourier-transform infrared (FTIR) spectra of NC-LAA, NC-Gly, NC/RGO-LAA, NC/RGO-Gly, and RGO in KBr pellets were recorded using a Thermo Nicolet Avatar 360 FTIR spectrometer (Thermo Fisher Scientific, Waltham, MA, USA) at a spectral resolution of 2 cm⁻1 and accumulation of 64 scans.
An AXIS Supra electron spectrometer (Kratos Analytical Ltd. Manchester, UK) using Al Kα radiation, with a photon energy of 1486.6 eV, was used for the XPS measurements. Before the measurements, the samples were stored in an ultra-high vacuum chamber overnight. The binding energies (BEs) were determined with an accuracy of ±0.1 eV using the commercial data processing software ESCApe™ 1.2.0.1325 (Kratos Analytical Manchester, UK). The samples for the analysis were placed on conductive tape. The concentrations of the different chemical elements (in at.%) were calculated by normalizing the areas of the photoelectron peaks to their relative sensitivity factors. The deconvolution of the peaks was performed using the commercial data processing software ESCApeTM from Kratos Analytical Ltd.

3.6. CO2 Adsorption Experiments

CO2 adsorption isotherms were measured using a Quantachrome Nova 1200e (Anton Paar, Boynton Beach, FL, USA) analyzer. Before analysis, the samples were degassed at 200 °C for 18 h. The experiments were conducted with pure CO2 gas (99.995%, Messer, Sofia, Bulgaria) at two different temperatures (273 K and 303 K) to calculate the heat of adsorption. The adsorption capacities were determined, and the isosteric heats of adsorption (Qst) were also computed. Predicted selectivity was determined using the Ideal Adsorbed Solution Theory (IAST) from the single-component adsorption isotherms at the same temperatures.

4. Conclusions

This paper reports the preparation of two types of nanocarbon and composite graphene-based materials for CO2 capture by a one-step, simple, cost-effective, and environmentally benign method, using a green approach with the application of L-ascorbic acid and glycine. XRD analyses revealed the amorphous nature of the prepared NCs and the presence of reduced graphene oxide in the composites. The NCs and NC/RGO composites obtained from two precursors showed quite different morphologies, which is a prerequisite for the observed developed porous structure. A hierarchical porous structure was found for NC-LAA, NC/RGO-LAA, and NC/RGO-Gly. The pore structures of NC/RGO-LAA and NC/RGO-Gly combined the textural features of NC-LAA and NC-Gly with those of RGO, and new textural properties emerged. The NC/RGO-LAA consisted of large graphene sheets, covered with well-defined, small, spherical particles. It was determined that the average size of the particles of both LAA-derived samples was about 11.5 nm, leading to the assumption that these particles were carbon dots or dot-like objects.
At 273 K and 100 kPa, the adsorption capacity of RGO was 1.2 mmol/g. NC-LAA and NC-Gly reached 2.6 mmol/g and 2.5 mmol/g, respectively, while for the composites, the capacities were 1.7 mmol/g for NC/RGO-Gly and 3.5 mmol/g for NC/RGO-LAA. The composites showed enhanced adsorption capacity values, surpassing the simple sum of their components; thus, a synergic effect between the nanocarbons and RGO can be considered. The adsorption ability of the glycine-derived materials is related to the presence of nitrogen-containing functional groups. The heats of adsorption for NC-LAA, NC-Gly, and NC/RGO-Gly reveal chemisorption with CO2. Except for chemisorption, the NC/RGO-LAA material showed a sustained physical adsorption up to higher CO2 coverage. The best adsorption of CO2, observed for NC/RGO-LAA, was due to the combination of the specific morphological forms of carbon dots and RGO that prevents restacking of the graphene sheets, leads to enhanced specific surface area of the composite, and provides large exposure of functional groups of both types of carbon materials.
In conclusion, the composition of two carbon materials in NC/RGO-LAA ensures both sufficient oxygen surface functionalization and a proper hierarchical porous structure, thus providing excellent adsorption properties toward carbon dioxide and enhanced selectivity over nitrogen.

Supplementary Materials

The following supporting information can be downloaded at https://www.mdpi.com/article/10.3390/molecules30112408/s1: Figure S1: XRD patterns of the initial graphite, L-AA, and Glycine.; Figure S2: FTIR spectrum of L-AA.; Figure S3: FTIR spectrum of Glycine; Figure S4: Scheme of preparation of the composite materials.

Author Contributions

Conceptualization, D.K. (Daniela Kovacheva) and I.S.; methodology, D.K. (Daniela Kovacheva) and I.S.; formal analysis, D.K. (Diana Kichukova), I.S., T.L. and G.A.; writing—original draft preparation, D.K. (Daniela Kovacheva) and I.S.; writing—review and editing, D.K. (Daniela Kovacheva) and I.S.; visualization, G.A. and I.S.; project administration, I.S. All authors have read and agreed to the published version of the manuscript.

Funding

This research was funded by the National Science Fund, Project KP-06-H 59/8 “Porous 3D graphene-based hierarchical materials for environmental protection”.

Institutional Review Board Statement

Not applicable.

Informed Consent Statement

Not applicable.

Data Availability Statement

The original contributions presented in this study are included in the article/Supplementary Materials. Further inquiries can be directed to the corresponding author.

Acknowledgments

Research infrastructure support by the Bulgarian Ministry of Education and Science (project INFRAMAT) is acknowledged. Equipment by virtue of the “Research, Innovation and Digitization for Smart Transformation” program 2021–2027 (Project BG16RFPR002-1.014-0006 “National Center of Excellence Mechatronics and Clean Technologies”), supported by the European Regional Development Fund, was also used.

Conflicts of Interest

The authors declare no conflicts of interest.

References

  1. Allen, M.; Frame, D.; Huntingford, C.; Jones, C.D.; Lowe, J.A.; Meinshausen, M.; Meinshausen, N. Warming caused by cumulative carbon emissions towards the trillionth tonne. Nature 2009, 458, 1163–1166. [Google Scholar] [CrossRef] [PubMed]
  2. Matthews, H.D.; Gillett, N.P.; Stott, P.A. The proportionality of global warming to cumulative carbon emissions. Nature 2009, 459, 829–832. [Google Scholar] [CrossRef]
  3. Hack, J.; Maeda, N.; Meier, D. Review on CO2 capture using amine-functionalized materials. ACS Omega 2022, 7, 39520–39530. [Google Scholar] [CrossRef]
  4. Sayari, A.; Belmabkhout, Y.; Serna-Guerero, R. Flue gas treatment via CO2 adsorption. Chem. Eng. J. 2011, 171, 760–774. [Google Scholar] [CrossRef]
  5. Maina, J.W.; Pozo-Gonzalo, C.; Kong, L.; Schütz, J.; Hill, M.; Dumée, L.F. Metal organic framework based catalysts for CO2 conversion. Mater. Horiz. 2017, 4, 345–361. [Google Scholar] [CrossRef]
  6. Zulfiqar, S.; Karadas, F.; Park, J.; Deniz, E.; Stucky, G.D.; Jung, Y.; Atilhan, M.; Yavuz, C.T. Amidoximes: Promising candidates for CO2 capture. Energy Environ. Sci. 2011, 4, 4528–4531. [Google Scholar] [CrossRef]
  7. Wang, Y.; Kang, C.; Zhang, Z.; Usadi, A.; Calabro, D.; Baugh, L.; Zhao, D. Evaluation of Schiff-Base Covalent Organic Frameworks for CO2 Capture: Structure–Performance Relationships, Stability, and Performance under Wet Conditions. ACS Sustain. Chem. Eng. 2022, 10, 332–341. [Google Scholar] [CrossRef]
  8. Zentou, H.; Hoque, B.; Abdalla, M.A.; Saber, A.F.; Abdelaziz, O.Y.; Aliyu, M.; Alkhedhair, A.M.; Alabduly, A.J.; Abdelnaby, M.M. Recent advances and challenges in solid sorbents for CO2 capture. Carbon Capture Sci. Technol. 2025, 15, 100386. [Google Scholar] [CrossRef]
  9. Patel, H.A.; Karadas, F.; Canlier, A.; Park, J.; Deniz, E.; Jung, Y.; Atilhan, M.; Yavuz, C.T. High capacity carbon dioxide adsorption by inexpensive covalent organic polymers. J. Mater. Chem. 2012, 22, 8431–8437. [Google Scholar] [CrossRef]
  10. Xu, S.; Luo, Y.; Tan, B. Recent Development of Hypercrosslinked Microporous Organic Polymers. Macromol. Rapid Commun. 2013, 34, 471–484. [Google Scholar] [CrossRef]
  11. Karadas, F.; Yavuz, C.T.; Zulfiqar, S.; Aparicio, S.; Stucky, G.D.; Atilhan, M. CO2 Adsorption Studies on Hydroxy Metal Carbonates M(CO3)x(OH)y (M = Zn, Zn−Mg, Mg, Mg−Cu, Cu, Ni, and Pb) at High Pressures up to 175 bar. Langmuir 2011, 27, 10642–10647. [Google Scholar] [CrossRef] [PubMed]
  12. Andonova, S.; Akbari, S.S.; Karadaş, F.; Spassova, I.; Paneva, D.; Hadjiivanov, K. Structure and properties of KNi–hexacyanoferrate Prussian Blue Analogues for efficient CO2 capture: Host–guest interaction chemistry and dynamics of CO2 adsorption. J. CO2 Util. 2021, 50, 101593. [Google Scholar] [CrossRef]
  13. Franchi, R.S.; Harlick, P.J.E.; Sayari, A. Applications of pore expanded mesoporous silica. 2. Development of a high-capacity, water-tolerant adsorbent for CO2. Ind. Eng. Chem. Res. 2005, 44, 8007–8013. [Google Scholar] [CrossRef]
  14. Bae, T.-H.; Hudson, M.R.; Mason, J.A.; Queen, W.L.; Dutton, J.J.; Sumida, K.; Micklash, K.J.; Kaye, S.S.; Brown, C.M.; Long, J.R. Evaluation of cation-exchanged zeolite adsorbents for post-combustion carbon dioxide capture. Energy Environ. Sci. 2013, 6, 128–138. [Google Scholar] [CrossRef]
  15. Khandaker, T.; Hossain, M.S.; Dhar, P.K.; Rahman, M.S.; Hossain, M.A.; Ahmed, M.B. Efficacies of Carbon-Based Adsorbents for Carbon Dioxide Capture. Processes 2020, 8, 654. [Google Scholar] [CrossRef]
  16. Mehra, P.; Paul, A. CO2 Adsorption on Nitrogen-Rich Porous Carbon Materials Synthesized via a Soft-Templating Approach. ACS Omega 2022, 7, 34538–34546. [Google Scholar] [CrossRef]
  17. Li, M.; Huang, K.; Schott, J.A.; Wu, Z.; Dai, S. Effect of Metal Oxides Modification on CO2 Adsorption Performance over Mesoporous Carbon. Microporous Mesoporous Mater. 2017, 249, 34–41. [Google Scholar] [CrossRef]
  18. Jin, X.; Li, Z.-Q.; Ge, J.; Zhu, L.; Liu, C.; Li, Q.; Liu, J.; Yin, C.; Su, G. Rapid Synthesis of MOF CaBTC Using an Ultrasonic Irradiation Method and Its Derivative Materials for CO2 Capture. New J. Chem. 2025. accepted manuscript. [Google Scholar] [CrossRef]
  19. Kirren, P.; Barka, L.; Rahmani, S.; Bondon, N.; Donzel, N.; Trens, P.; Bessière, A.; Raehm, L.; Charnay, C.; Durand, J.-O. Periodic Mesoporous Organosilica Nanoparticles for CO2 Adsorption at Standard Temperature and Pressure. Molecules 2022, 27, 4245. [Google Scholar] [CrossRef]
  20. Ma, X.; Li, L.; Chen, R.; Wang, C.; Li, H.; Wang, S. Heteroatom-Doped Nanoporous Carbon Derived from MOF-5 for CO2 Capture. Appl. Surf. Sci. 2018, 435, 494–502. [Google Scholar] [CrossRef]
  21. Zhao, Y.; Zhang, Z.; Gao, Q.; Wei, W. High-Performance CO2 Adsorption over Functionalized Porous Carbon Nanomaterials. ACS Appl. Nano Mater. 2025, 8, 7190–7199. [Google Scholar] [CrossRef]
  22. Gao, H.; Li, Q.; Ren, S. Progress on CO2 Capture by Porous Organic Polymers. Curr. Opin. Green Sustain. Chem. 2019, 16, 55–63. [Google Scholar] [CrossRef]
  23. Dani, A.; Crocellà, V.; Magistris, C.; Santoro, V.; Yuana, J.; Bordiga, S. CO2 Adsorption on Porous Polymers Containing Polar Groups: Structure–Property Relationship. J. Mater. Chem. A 2017, 5, 372–383. [Google Scholar] [CrossRef]
  24. Velikova, N.; Spassova, I. Amine Functionalized Mesoporous Hybrid Materials: Influence of KCl and Xylene on the Textural Characteristics and CO2 Sorption. J. Sol-Gel Sci. Technol. 2019, 91, 374–384. [Google Scholar] [CrossRef]
  25. Velikova, N.; Spassova, I. Bifunctional Mesoporous Hybrid Sol–Gel Prepared Silicas for CO2 Adsorption. J. Sol-Gel Sci. Technol. 2021, 100, 326–340. [Google Scholar] [CrossRef]
  26. Manyà, J.J.; González, B.; Azuara, M.; Arner, G. Ultra-Microporous Adsorbents Prepared from Vine Shoots-Derived Biochar with High CO2 Uptake and CO2/N2 Selectivity. Chem. Eng. J. 2018, 345, 631–639. [Google Scholar] [CrossRef]
  27. Cheung, O.; Bacsik, Z.; Fil, N.; Krokidas, P.; Wardecki, D.; Hedin, N. Highly Efficient Carbon Dioxide Adsorption by Porous Carbon Materials Derived from Polymer Blends. ACS Omega 2020, 5, 25371–25380. [Google Scholar] [CrossRef]
  28. Li, S.; Jia, S.; Nagasaka, T.; Bai, H.; Yang, L. CO2 Adsorption Properties of Amine-Modified Zeolites Synthesized Using Different Types of Solid Waste. Sustainability 2023, 15, 10144. [Google Scholar] [CrossRef]
  29. Sun, M.; Gu, Q.; Hanif, A.; Wang, T.; Shang, J. Transition Metal Cation-Exchanged SSZ-13 Zeolites for CO2 Capture and Separation from N2. Chem. Eng. J. 2019, 370, 1450–1458. [Google Scholar] [CrossRef]
  30. Singh, G.; Kim, Y.; Lakhi, K.S.; Joseph, S.; Srivastava, P.; Naidu, R.; Vinu, A. Heteroatom Functionalized Activated Porous Biocarbons and Their Excellent Performance for CO2 Capture at High Pressure. J. Mater. Chem. A 2017, 5, 21196–21204. [Google Scholar] [CrossRef]
  31. Yang, B.; Hu, H.; Yu, Q.; Zhang, X.; Li, Z.; Lei, L. Pretreated multiwalled carbon nanotube adsorbents with amine-grafting for removal of carbon dioxide in confined spaces. RSC Adv. 2014, 4, 56224–56234. [Google Scholar] [CrossRef]
  32. Bhanja, P.; Das, S.K.; Patra, A.K.; Bhaumik, A. Functionalized graphene oxide as an efficient adsorbent for CO2 capture and support for heterogeneous catalysis. RSC Adv. 2016, 6, 72055–72068. [Google Scholar] [CrossRef]
  33. Wen, C.; Qiu, Z.; Zhao, G.; Wei, X.; Zhu, Z.; Wang, Y.; Cui, P.; Zhong, L. Preparation and Characterization of UiO-66-(OH)2/MWCNTs Composites for CO2/N2 Adsorption Separation. Fuel 2024, 373, 132292. [Google Scholar] [CrossRef]
  34. Gautam, S.; Sahoo, S. Experimental Investigation on Different Activated Carbons as Adsorbents for CO2 Capture. Therm. Sci. Eng. Prog. 2022, 33, 101339. [Google Scholar] [CrossRef]
  35. Xie, L.; Li, Q.; Demir, M.; Yu, Q.; Hu, X.; Jiang, Z.; Wang, L. Lotus Seed Pot-Derived Nitrogen Enriched Porous Carbon for CO2 Capture Application. Colloids Surf. A Physicochem. Eng. Asp. 2022, 655, 130226. [Google Scholar] [CrossRef]
  36. Chew, T.L.; Ahmad, A.L.; Bhatia, S. Ordered mesoporous silica (OMS) as an adsorbent and membrane for separation of carbon dioxide (CO2). Adv. Colloid Interface Sci. 2010, 153, 43–57. [Google Scholar] [CrossRef]
  37. Li, J.-R.; Ma, Y.; Colin McCarthy, M.; Sculley, J.; Yu, J.; Jeong, H.-K.; Balbuena, P.B.; Zhou, H.-C. Carbon dioxide capture-related gas adsorption and separation in metal-organic frameworks. Coord. Chem. Rev. 2011, 255, 1791–1823. [Google Scholar] [CrossRef]
  38. Dos Santos, M.C.; Maynart, M.C.; Aveiro, L.R.; da Paz, E.C.; dos Santos Pinheiro, V. Carbon-Based Materials: Recent Advances, Challenges, and Perspectives. In Reference Module in Materials Science and Materials Engineering; Elsevier Ltd.: Amsterdam, The Netherlands, 2017; pp. 1–12. [Google Scholar] [CrossRef]
  39. Lee, J.; Kim, J.; Hyeon, T. Recent progress in the synthesis of porous carbon materials. Adv. Mater. 2006, 18, 2073–2094. [Google Scholar] [CrossRef]
  40. Hu, B.; Wang, K.; Wu, L.; Yu, S.H.; Antonietti, M.; Titirici, M.M. Engineering carbon materials from the hydrothermal carbonization process of biomass. Adv. Mater. 2010, 22, 813–828. [Google Scholar] [CrossRef]
  41. Stein, A.; Wang, Z.; Fierke, M.A. Functionalization of porous carbon materials with designed pore architecture. Adv. Mater. 2009, 21, 265–293. [Google Scholar] [CrossRef]
  42. Kundu, S.; Khandaker, T.; Anik, M.A.M.; Hasan, M.K.; Dhar, P.K.; Dutta, S.K.; Latif, M.A.; Hossain, M.S. A comprehensive review of enhanced CO2 capture using activated carbon derived from biomass feedstock. RSC Adv. 2024, 14, 29693. [Google Scholar] [CrossRef] [PubMed]
  43. Song, S.; Ma, F.; Wu, G.; Ma, D.; Geng, W.; Wan, J. Facile self-templating large scale preparation of biomass-derived 3D hierarchical porous carbon for advanced supercapacitors. J. Mater. Chem. A 2015, 3, 18154–18162. [Google Scholar] [CrossRef]
  44. Parshetti, G.K.; Chowdhury, S.; Balasubramanian, R. Biomass derived low-cost microporous adsorbents for efficient CO2 capture. Fuel 2015, 148, 246–254. [Google Scholar] [CrossRef]
  45. Pham, V.P.; Jang, H.S.; Whang, D.; Choi, J.Y. Direct growth of graphene on rigid and flexible substrates: Progress, applications, and challenges. Chem. Soc. Rev. 2017, 46, 6276–6300. [Google Scholar] [CrossRef]
  46. Cigala, R.M.; De Luca, G.; Ielo, I.; Crea, F. Biopolymeric Nanocomposites for CO2 Capture. Polymers 2024, 16, 1063. [Google Scholar] [CrossRef]
  47. Barker-Rothschild, D.; Chen, J.; Wan, Z.; Renneckar, S.; Burgert, I.; Ding, Y.; Lu, Y.; Rojas, O.J. Lignin-based porous carbon adsorbents for CO2 capture. Chem. Soc. Rev. 2025, 54, 623. [Google Scholar] [CrossRef]
  48. Verma, S.K.; Tripathi, P.; Bhatnagar, A. Carbon Nanotubes for CO2 Capture and Conversion. In Nanomaterials for Carbon Dioxide Capture and Conversion Technologies; Mazari, S.A., Mubarak, N.M., Tripathi, M., Eds.; Micro and Nano Technologies Series; Elsevier: Amsterdam, The Netherlands, 2023; pp. 245–260. [Google Scholar] [CrossRef]
  49. Broud, M.T.; Samandari, M.; Yu, L.; Harper, D.P.; Keffer, D.J. Selective Carbon Dioxide Binding on Carbon Quantum Dots. J. Phys. Chem. C 2023, 127, 13639–13650. [Google Scholar] [CrossRef]
  50. Jung, S.; Park, Y.; Kwon, E.E. Strategic use of biochar for CO2 capture and sequestration. J. CO2 Util. 2019, 32, 128–139. [Google Scholar] [CrossRef]
  51. Ekhlasi, L.; Younesi, H.; Rashidi, A.; Bahramifar, N. Populus wood biomass-derived graphene for high CO2 capture at atmospheric pressure and estimated cost of production. Process Saf. Environ. Prot. 2018, 113, 97–108. [Google Scholar] [CrossRef]
  52. Zhou, Y.; Yan, K.; Yang, Z.; Bauer, R.A.; Hong, N.; Verweij, H. Nanometer-thick supported graphene oxide membrane for CO2 capture. ACS Appl. Nano Mater. 2020, 3, 6654–6663. [Google Scholar] [CrossRef]
  53. Ai, N.; Lou, S.; Lou, F.; Xu, C.; Wang, Q.; Zeng, G. Facile synthesis of macroalgae-derived graphene adsorbents for efficient CO2 capture. Process Saf. Environ. Prot. 2021, 148, 1048–1059. [Google Scholar] [CrossRef]
  54. Politakos, N.; Barbarin, I.; Cantador, L.S.; Cecilia, J.A.; Mehravar, E.; Tomovska, R. Graphene-Based Monolithic Nanostructures for CO2 Capture. Ind. Eng. Chem. Res. 2020, 59, 8612–8621. [Google Scholar] [CrossRef]
  55. Isah, M.; Lawal, R.; Onaizi, S.A. CO2 Capture and Conversion Using Graphene-Based Materials: A Review on Recent Progresses and Future Outlooks. Green Chem. Eng. 2024, 4. in press. [Google Scholar] [CrossRef]
  56. Wang, C.; Wang, Z.; Zhang, S.; Zhang, J.; Li, K. Ab Initio Investigation of the Adsorption of CO2 Molecules on Defect Sites of Graphene Surfaces: Role of Local Vacancy Structures. Materials 2023, 16, 981. [Google Scholar] [CrossRef]
  57. Chandra, V.; Yu, S.U.; Kim, S.H.; Yoon, Y.S.; Kim, D.Y.; Kwon, A.H.; Meyyappan, M.; Kim, K.S. Highly selective CO2 capture on N-doped carbon produced by chemical activation of polypyrrole functionalized graphene sheets. Chem. Commun. 2012, 48, 735–737. [Google Scholar] [CrossRef]
  58. Gadipelli, S.; Lu, Y.; Skipper, N.T.; Yildirim, T.; Guo, Z. Design of hyperporous graphene networks and their application in solid-amine based carbon capture systems. J. Mater. Chem. A 2017, 5, 17833–17840. [Google Scholar] [CrossRef]
  59. Kumar, R.; Raut, D.; Ramamurty, U.; Rao, C.N. Remarkable improvement in the mechanical properties and CO2 uptake of MOFs brought about by covalent linking to graphene. Angew. Chem. Int. Ed. 2016, 55, 7857–7861. [Google Scholar] [CrossRef]
  60. Stankovic, B.; Barbarin, I.; Sanz, O.; Tomovska, R.; Ruipérez, F. Experimental and theoretical study of the effect of different functionalities of graphene oxide/polymer composites on selective CO2 capture. Sci. Rep. 2022, 12, 15992. [Google Scholar] [CrossRef]
  61. Sari Yilmaz, M. Preparation and CO2 capture performances of KIT-6@reduced graphene oxide composites. J. Porous. Mater. 2023, 30, 1555–1564. [Google Scholar] [CrossRef]
  62. Bhowmik, K.; Chakravarty, A.; Bysakh, S.; De, G. γ-alumina nanorod/reduced graphene oxide as support for poly(ethylenimine) to capture carbon dioxide from flue gas. Energy Technol. 2016, 4, 1409–1419. [Google Scholar] [CrossRef]
  63. Che Othman, F.E.; Yusof, N.; González-Benito, J.; Fan, X.; Ismail, A.F. Electrospun Composites Made of Reduced Graphene Oxide and Polyacrylonitrile-Based Activated Carbon Nanofibers (rGO/ACNF) for Enhanced CO2 Adsorption. Polymers 2020, 12, 2117. [Google Scholar] [CrossRef] [PubMed]
  64. Goswami, A.D.; Trivedi, D.H.; Jadhav, N.L.; Pinjari, D.V. Sustainable and Green Synthesis of Carbon Nanomaterials: A Review. J. Environ. Chem. Eng. 2021, 9, 106118. [Google Scholar] [CrossRef]
  65. Ashourirad, B.; Sekizkardes, A.K.; Altarawneh, S.; El-Kaderi, H.M. Exceptional Gas Adsorption Properties by Nitrogen-Doped Porous Carbons Derived from Benzimidazole-Linked Polymers. Chem. Mater. 2015, 27, 1349–1358. [Google Scholar] [CrossRef]
  66. Chen, J. Acid/base-treated activated carbons: Characterization of functional groups and metal adsorptive properties. Langmuir 2004, 20, 2233–2242. [Google Scholar] [CrossRef]
  67. Tian, W.; Zhang, H.; Sun, H.; Suvorova, A.; Saunders, M.; Tadé, M.; Wang, S. Heteroatom (N or N-S)-doping induced layered and honeycomb microstructures of porous carbons for CO2 capture and energy applications. Adv. Funct. Mater. 2016, 26, 8651–8661. [Google Scholar] [CrossRef]
  68. Creamer, A.; Gao, B. Carbon-based adsorbents for postcombustion CO2 capture: A critical review. Environ. Sci. Technol. 2016, 50, 7276–7289. [Google Scholar] [CrossRef]
  69. Sahoo, P.C.; Singh, R.; Sivagurunathan, P.; Singh, D.; Kumar, M.; Gupta, R.P.; Srivastava, U. Carbon Dot-Blended Mixed Amine for Efficient CO2 Capture under Highly Oxidative Flue Gas Conditions. Int. J. Greenh. Gas Control 2025, 142, 104340. [Google Scholar] [CrossRef]
  70. Rajan, A.S.; Sampath, S.; Shukla, A.K. An In Situ Carbon-Grafted Alkaline Iron Electrode for Iron-Based Accumulators. Energy Environ. Sci. 2014, 7, 1110–1116. [Google Scholar] [CrossRef]
  71. Thommes, M.; Kaneko, K.; Neimark, A.V.; Olivier, J.P.; Rodriguez-Reinoso, F.; Rouquerol, J.; Sing, K.S.W. Physisorption of gases, with special reference to the evaluation of surface area and pore size distribution (IUPAC Technical Report). Pure Appl. Chem. 2015, 87, 1051–1069. [Google Scholar] [CrossRef]
  72. Yi, C.; Pan, Y.; Fang, Y. Chapter 5—Surface Engineering of Carbon Nanodots (C-Dots) for Biomedical Applications. In Micro and Nano Technologies, Novel Nanomaterials for Biomedical, Environmental and Energy Applications; Wang, X., Chen, X., Eds.; Elsevier: Amsterdam, The Netherlands, 2019; pp. 137–188. [Google Scholar] [CrossRef]
  73. Farias, M.D.P.; Albuquerque, P.B.S.; Soares, P.A.G.; de Sá, D.M.A.T.; Vicente, A.A.; Carneiro-da-Cunha, M.G. Xyloglucan from Hymenaea courbaril var. courbaril seeds as encapsulating agent of L-ascorbic acid. Int. J. Biol. Macromol. 2018, 107, 1559–1566. [Google Scholar] [CrossRef]
  74. Kumar, R.A.; Vizhi, R.E.; Sivakumar, N.; Vijayan, N.; Rajan Babu, D. Crystal growth, optical and thermal studies of nonlinear optical γ-glycine single crystal grown from lithium nitrate. Optik 2012, 123, 409–413. [Google Scholar] [CrossRef]
  75. Rammal, A.; Perrin, E.; Chabbert, B.; Bertrand, I.; Habrant, A.; Lecart, B.; Vrabie, V. Evaluation of lignocellulosic biomass degradation by combining mid- and near-infrared spectra by the outer product and selecting discriminant wavenumbers using a genetic algorithm. Appl. Spectrosc. 2015, 69, 1303–1312. [Google Scholar] [CrossRef] [PubMed]
  76. Jha, S.; Mehta, S.; Chen, Y.; Ma, L.; Renner, P.; Parkinson, D.; Liang, H. Correction to "Design and synthesis of lignin-based flexible supercapacitors". ACS Sustain. Chem. Eng. 2020, 8, 9597–9598. [Google Scholar] [CrossRef]
  77. Demirel, G.; Temiz, A.; Jebrane, M.; Terzıev, N.; Gezer, E. Micro-distribution, water absorption, and dimensional stability of wood treated with epoxidized plant oils. Bioresources 2018, 13, 5124–5138. [Google Scholar] [CrossRef]
  78. Gaidukevič, J.; Pauliukaitė, R.; Niaura, G.; Matulaitienė, I.; Opuchovič, O.; Radzevič, A.; Barkauskas, J. Synthesis of reduced graphene oxide with adjustable microstructure using regioselective reduction in the melt of boric acid: Relationship between structural properties and electrochemical performance. Nanomaterials 2018, 8, 889. [Google Scholar] [CrossRef]
  79. Zhang, W.; Zhang, Y.; Tian, Y.; Yang, Z.; Xiao, Q.; Guo, X.; Sun, K. Insight into the capacitive properties of reduced graphene oxide. ACS Appl. Mater. Interfaces 2014, 6, 2248–2254. [Google Scholar] [CrossRef]
  80. Sharma, N.; Sharma, V.; Vyas, R.; Kumari, M.; Kaushal, A.; Gupta, R.; Sharma, S.K.; Sachdev, K. A New Sustainable Green Protocol for Production of Reduced Graphene Oxide and Its Gas Sensing Properties. J. Sci. Adv. Mater. Devices 2019, 4, 473–482. [Google Scholar] [CrossRef]
  81. Li, Z.; Deng, L.; Kinloch, I.A.; Young, R.J. Raman Spectroscopy of Carbon Materials and Their Composites: Graphene, Nanotubes and Fibres. Prog. Mater. Sci. 2023, 135, 101089. [Google Scholar] [CrossRef]
  82. Moreira, V.R.; Lebron, Y.A.R.; da Silva, M.M.; de Souza Santos, L.V.; Jacob, R.S.; de Vasconcelos, C.K.B.; Viana, M.M. Graphene Oxide in the Remediation of Norfloxacin from Aqueous Matrix: Simultaneous Adsorption and Degradation Process. Environ. Sci. Pollut. Res. 2020, 27, 34513–34528. [Google Scholar] [CrossRef]
  83. Chen, X.; Wang, X.; Fang, D. A review on C1s XPS-spectra for some kinds of carbon materials. Fuller. Nanotub. Carbon Nanostructures 2020, 28, 1048–1058. [Google Scholar] [CrossRef]
  84. Avramova, I.; Dimov, D.A.; Stankova, N.; Petrov, M.; Karaivanova, D.; Avdeev, G.; Russev, S.; Karashanova, D.; Georgieva, B.; Valcheva, E.; et al. Novel Approach for Synthesis of Graphene-like Phases by Pulsed Laser Ablation in a Flow-Mode Suspension. Materials 2022, 15, 7870. [Google Scholar] [CrossRef] [PubMed]
  85. Biesinger, M.C. Accessing the robustness of adventitious carbon for charge referencing (correction) purposes in XPS analysis: Insights from a multi-user facility data review. Appl. Surf. Sci. 2022, 597, 153681. [Google Scholar] [CrossRef]
  86. Yang, C.-C.; Tsai, M.-H.; Yang, Z.-R.; Yang, Y.-W.; Tseng, Y.-C.; Wang, C.-H. An Effective Charge Neutralization Enabled by Graphene Overlayer in Ambient Pressure XPS Measurements of Insulators. Adv. Mater. Interfaces 2023, 10, 2201926. [Google Scholar] [CrossRef]
  87. Matsuoka, M.; Isotani, S.; Mansano, R.D.; Sucasaire, W.; Pinto, R.A.C.; Mittani, J.C.R.; Ogata, K.; Kuratani, N. X-Ray Photoelectron Spectroscopy and Raman Spectroscopy Studies on Thin Carbon Nitride Films Deposited by Reactive RF Magnetron Sputtering. World J. Nano Sci. Eng. (WJNSE) 2012, 2, 92–102. [Google Scholar] [CrossRef]
  88. Radim, P.L.; Otyepka, M.M. Spectroscopic Fingerprints of Graphitic, Pyrrolic, Pyridinic, and Chemisorbed Nitrogen in N-Doped Graphene. J. Phys. Chem. C 2019, 123, 10695–10702. [Google Scholar] [CrossRef]
  89. Dawson, R.; Stöckel, E.; Holst, J.; Adams, D.; Cooper, A. Microporous organic polymers for carbon dioxide capture. Energy Environ. Sci. 2011, 4, 4239. [Google Scholar] [CrossRef]
  90. Hong, S.; Jang, E.; Dysart, A.; Pol, V.; Lee, K. CO2 capture in the sustainable wheat-derived activated microporous carbon compartments. Sci. Rep. 2016, 6, 34590. [Google Scholar] [CrossRef]
  91. Kowalczyk, P.; Furmaniak, S.; Gauden, P.; Terzyk, A. Carbon dioxide adsorption-induced deformation of microporous carbons. J. Phys. Chem. C 2010, 114, 5126–5133. [Google Scholar] [CrossRef]
  92. Ge, C.; Song, J.; Qin, Z.; Wang, J.; Fan, W. Polyurethane foam-based ultramicroporous carbons for CO2 capture. ACS Appl. Mater. Interfaces 2016, 8, 18849–18859. [Google Scholar] [CrossRef]
  93. Jiménez, V.; Ramírez-Lucas, A.; Díaz, J.; Sánchez, P.; Romero, A. CO2 capture in different carbon materials. Environ. Sci. Technol. 2012, 46, 7407–7414. [Google Scholar] [CrossRef]
  94. Sevilla, M.; Parra, J.; Fuertes, A. Assessment of the role of micropore size and N-doping in CO2 capture by porous carbons. ACS Appl. Mater. Interfaces 2013, 5, 6360–6368. [Google Scholar] [CrossRef] [PubMed]
  95. Wilson, P.; Vijayan, S.; Prabhakaran, K. Waste-fish-derived nitrogen self-doped microporous carbon as effective sorbent for CO2 capture. ChemistrySelect 2018, 3, 9555–9563. [Google Scholar] [CrossRef]
  96. Sudeep, P.; Narayanan, T.; Ganesan, A.; Shaijumon, M.; Yang, H.; Özden, Ş.; Ajayan, P. Covalently interconnected three-dimensional graphene oxide solids. ACS Nano 2013, 7, 7034–7040. [Google Scholar] [CrossRef]
  97. Petrovic, B.; Gorbounov, M.; Soltani, S.M. Impact of Surface Functional Groups and Their Introduction Methods on the Mechanisms of CO2 Adsorption on Porous Carbonaceous Adsorbents. Cisco Certif. Support Tech. (CCST) 2022, 3, 100045. [Google Scholar] [CrossRef]
  98. Nakao, S.; Yogo, K.; Goto, K.; Kai, T.; Yamada, H. Introduction. In Advanced CO2 Capture Technologies; Springer Briefs in Energy; Springer: Cham, Switzerland, 2019. [Google Scholar] [CrossRef]
  99. Qian, D.; Cheng, L.; Wang, E.; Li, W.; Lu, A. A method for creating microporous carbon materials with excellent CO2-adsorption capacity and selectivity. ChemSusChem 2013, 7, 291–298. [Google Scholar] [CrossRef]
  100. Myers, A.L.; Prausnitz, J.M. Thermodynamics of mixed-gas adsorption. AIChE J. 1964, 11, 121–127. [Google Scholar] [CrossRef]
  101. Bhunia, S.; Bhanja, P.; Das, S.; Sen, T.; Bhaumik, A. Triazine containing N-rich microporous organic polymers for CO2 capture and unprecedented CO2/N2 selectivity. J. Solid State Chem. 2017, 247, 113–119. [Google Scholar] [CrossRef]
  102. Ziaee, A.; Chovan, D.; Lusi, M.; Perry, J.; Zaworotko, M.; Tofail, S. Theoretical optimization of pore size and chemistry in SIFSIX-3-M hybrid ultramicroporous materials. Cryst. Growth Des. 2016, 16, 3890–3897. [Google Scholar] [CrossRef]
  103. Keskın, S.; Sholl, D. Efficient methods for screening of metal organic framework membranes for gas separations using atomically detailed models. Langmuir 2009, 25, 11786–11795. [Google Scholar] [CrossRef]
  104. Graham, C.; Imrie, D.A.; Raab, R.E. Measurement of the Electric Quadrupole Moments of CO2, CO, N2, Cl2, and BF3. Mol. Phys. 1998, 93, 49–56. [Google Scholar] [CrossRef]
  105. KIDA. Carbon Dioxide (CO2)—Kinetic Database for Astrochemistry. Available online: https://kida.astrochem-tools.org/species/56/CO2.html (accessed on 14 May 2025).
  106. KIDA. Nitrogen (N2)—Kinetic Database for Astrochemistry. Available online: https://kida.astrochem-tools.org/species/32/N2 (accessed on 14 May 2025).
  107. Marcano, C.; Kosynkin, D.V.; Berlin, J.M.; Sinitskii, A.; Sun, Z.; Slesarev, A.; Alemany, L.B.; Lu, W.; Tour, J.M. Improved Synthesis of Graphene Oxide. ACS Nano 2010, 4, 4806–4814. [Google Scholar] [CrossRef]
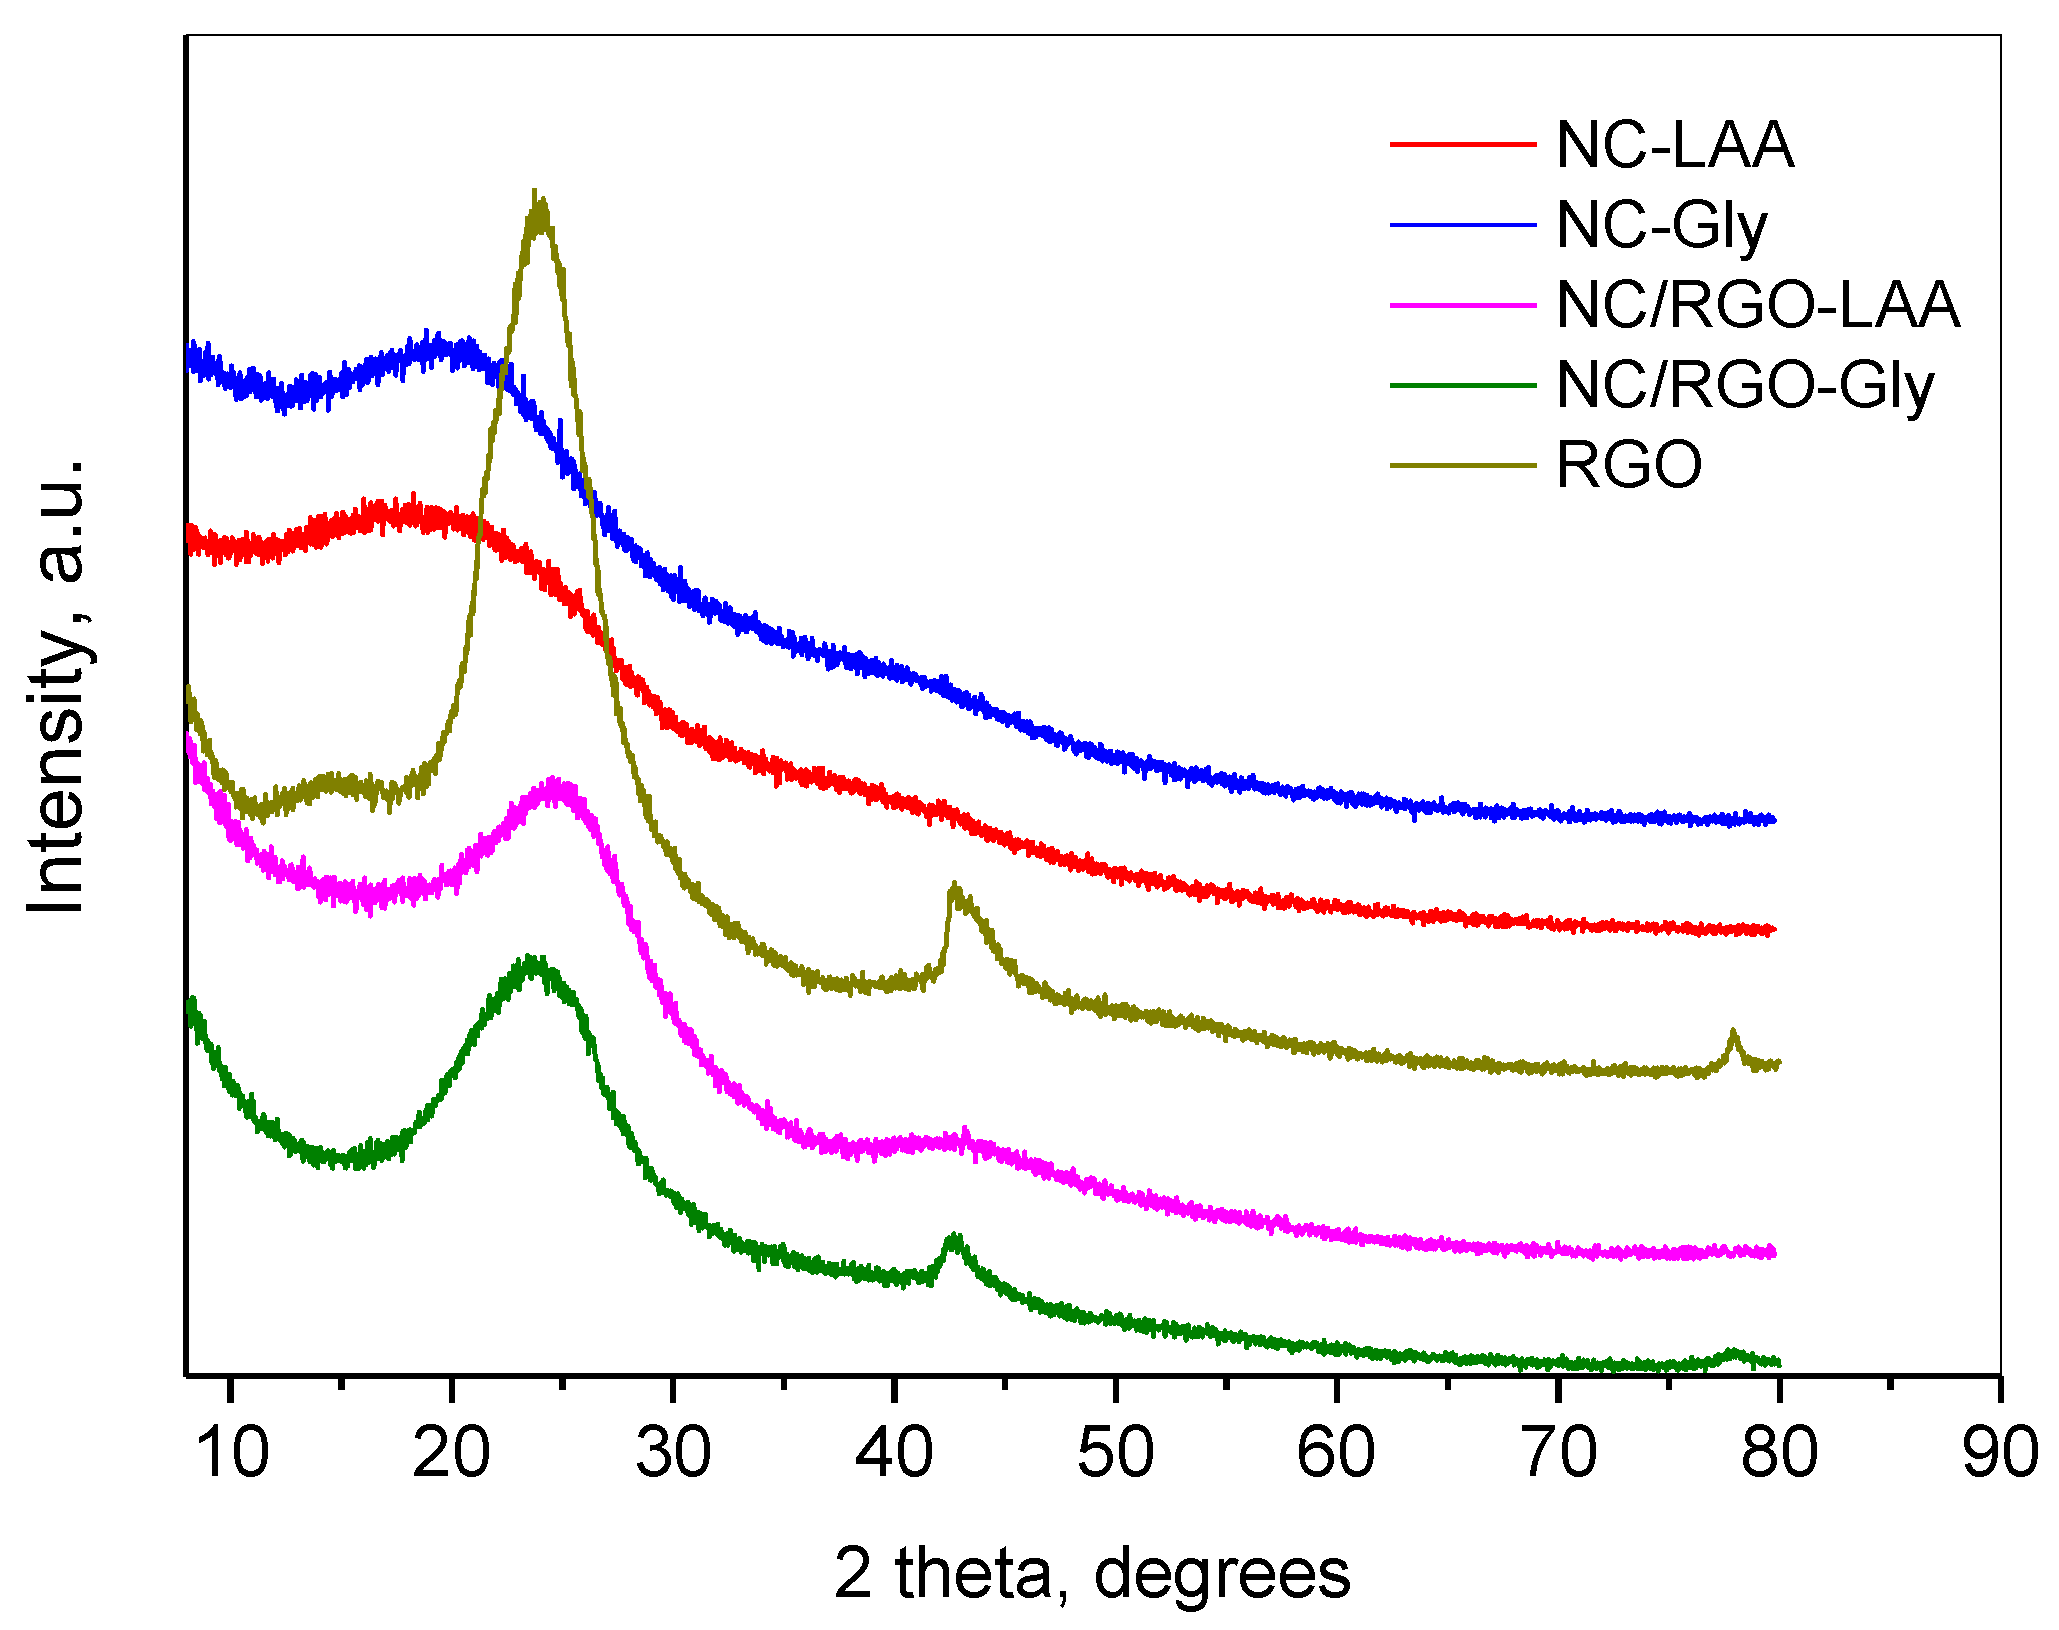
Figure 1. PXRD patterns of NC-LAA, NC-Gly, NC/RGO-LAA, NC/RGO-Gly, and referent RGO.
Molecules 30 02408 g001
Figure 2. Nitrogen adsorption–desorption isotherms (a,c) and pore size distribution (b,d) of NC-LAA (red), NC-Gly (blue), NC/RGO-LAA (magenta), and NC/RGO-Gly (olive). The insets in (b,d) present the micropore size distribution of the respective samples. The shaded part of the insets represents the pores below 0.8 nm.
Molecules 30 02408 g002
Figure 3. SEM (SEI) images of NC-LAA (a), NC/RGO-LAA (b), NC-Gly (c), NC/RGO-Gly (d) and RGO (e).
Molecules 30 02408 g003
Figure 4. Bright-field TEM micrographs of NC-LAA (a), NC/RGO-LAA (b), NC-Gly (c), NC/RGO-Gly (d), and RGO (e), and HRTEM image of NC/RGO-LAA (f).
Molecules 30 02408 g004
Figure 5. FTIR (A) and Raman spectra (B) of (a) NC-Gly (blue), (b) NC-LAA (red), (c) NC/RGO-Gly (olive), (d) NC/RGO-LAA (magenta), and (e) bare RGO (dark yellow).
Molecules 30 02408 g005
Figure 6. XPS C1s, O1s, and survey spectra of NC-LAA, NC/RGO-LAA, NC-Gly, and NC/RGO-Gly, and N1s spectra of NC-Gly and NC/RGO-Gly.
Molecules 30 02408 g006
Figure 7. XPS C1s, O1s, and survey spectra of NC/RGO-LAA, NC/RGO-Gly, and RGO, and N1s of NC/RGO-Gly.
Molecules 30 02408 g007
Figure 8. Adsorption isotherms of CO2 at 273 K for NC-LAA (left, red), NC-Gly (left, blue), NC/RGO-LAA (right, magenta), NC/RGO-Gly (right, olive), and bare RGO (right, dark yellow).
Molecules 30 02408 g008
Figure 9. Heats of CO2 adsorption for NC-LAA (red), NC-Gly (blue), NC/RGO-LAA (magenta), and NC/RGO-Gly (olive).
Molecules 30 02408 g009
Figure 10. Predictive CO2/N2 selectivity of NC/RGO-LAA at 273 K, depending on pressure.
Molecules 30 02408 g010
Table 1. The CO2 adsorption capacities of different adsorbents evaluated at 273 K and 1 bar.
AdsorbentAdsorption CapacityAdsorption MechanismReference
Potassium nickel hexacyanoferrate Prussian Blue analogs (K-NiFe-PBAs)3.0 mmol·g¹Physical[12]
N and B-doped graphene aerogels2.9 mmol·g¹Not pointed[15]
Chitosan aerogels with graphene oxide nanosheets4.14 mmol·g¹Not pointed[15]
Biordered ultramicroporous graphitic carbon7.81 mmol·g¹Physical[16]
Reduced graphene2.36 mmol·g¹Physical[16]
Activated carbon4.66 mmol·g¹Physical[17]
CaBTC-derived MOF (CaO/CN-5)2.30 mmol·g¹Chemical[18]
Periodic mesoporous organosilica (PMO) nanoparticles2.26 mmol·g¹Physical[19]
Metal–organic framework3.7 mmol·g¹Physical[20]
MIP-206-OH-Gly MOF2.15 mmol·g¹Physical[21]
Covalent Organic Frameworks (COFs)3.2 mmol·g¹Not pointed[22]
Click-based porous cationic polymer2 mmol·g¹Mixed[23]
Amine-functionalized mesoporous silica0.7 mmol·g¹Chemical[24]
Bifunctionalized mesoporous silica materials1.22 mmol·g¹Physical[25]
Biochar derived from vine shoots4.07 mmol·g⁻¹Physical[26]
Zeolite Na-ZK-4 (2.3)4.86 mmol·g⁻¹Physical[27]
Amine-modified zeolite NaA80 cm3·g⁻¹Chemical[28]
Ni(II)/SSZ-134.49 mmol·g¹Mixed[29]
N-doped activated biocarbon3.6 mmol·g¹Physical[30]
Multi-walled CNTs0.64 mmol·g¹Not pointed[31]
Graphene oxide with 2,6-diformyl-4-methyl phenol8.10 mmol·g¹Physical[32]
Composite of UiO-66-(OH)2 and MWCNTs5.75 mmol·g¹Physical[33]
AC CARB 6X12 554.53 mmol·g¹Physical[34]
Activated carbon Norit RB 43.02 mmol·g¹Physical[34]
Lotus seed pot-derived N-doped porous carbon6.2 mmol·g¹Mixed[35]
Table 2. Texture characteristics of the investigated materials and referent RGO for comparison.
SampleS, m2/gV, cm3/gDav, nmSmi, m2/gSext, m2/gVmi, cm3/g
NC-LAA4930.272.23671260.15
NC/RGO-LAA4870.242.0430560.17
NC-Gly150.0214---
NC/RGO-Gly880.125.363250.03
RGO450.1594410.002
S, specific surface area; V, total pore volume; Dav, average pore diameter; Smi, microporous specific surface area; Sext, external specific surface area; Vmi, micropore volume.
Table 3. Chemical composition of the surface.
SampleC, at%O, at%N, at%
NC-LAA90.29.8-
NC-Gly64.814.822.4
NC/RGO-LAA87.312.7-
NC/RGO-Gly81.716.22.1
RGO93.46.6
Disclaimer/Publisher’s Note: The statements, opinions and data contained in all publications are solely those of the individual author(s) and contributor(s) and not of MDPI and/or the editor(s). MDPI and/or the editor(s) disclaim responsibility for any injury to people or property resulting from any ideas, methods, instructions or products referred to in the content.