Author Contributions
Conceptualization, J.Z. and W.X.; methodology, H.B.; software, S.P.; validation, W.S., J.Z. and W.X.; formal analysis, J.L.; investigation, X.D.; resources, L.W.; data curation, W.X.; writing—original draft preparation, H.B.; writing—review and editing, S.P.; visualization, J.Z.; supervision, L.W.; project administration, J.Z.; funding acquisition, W.X. All authors have read and agreed to the published version of the manuscript.
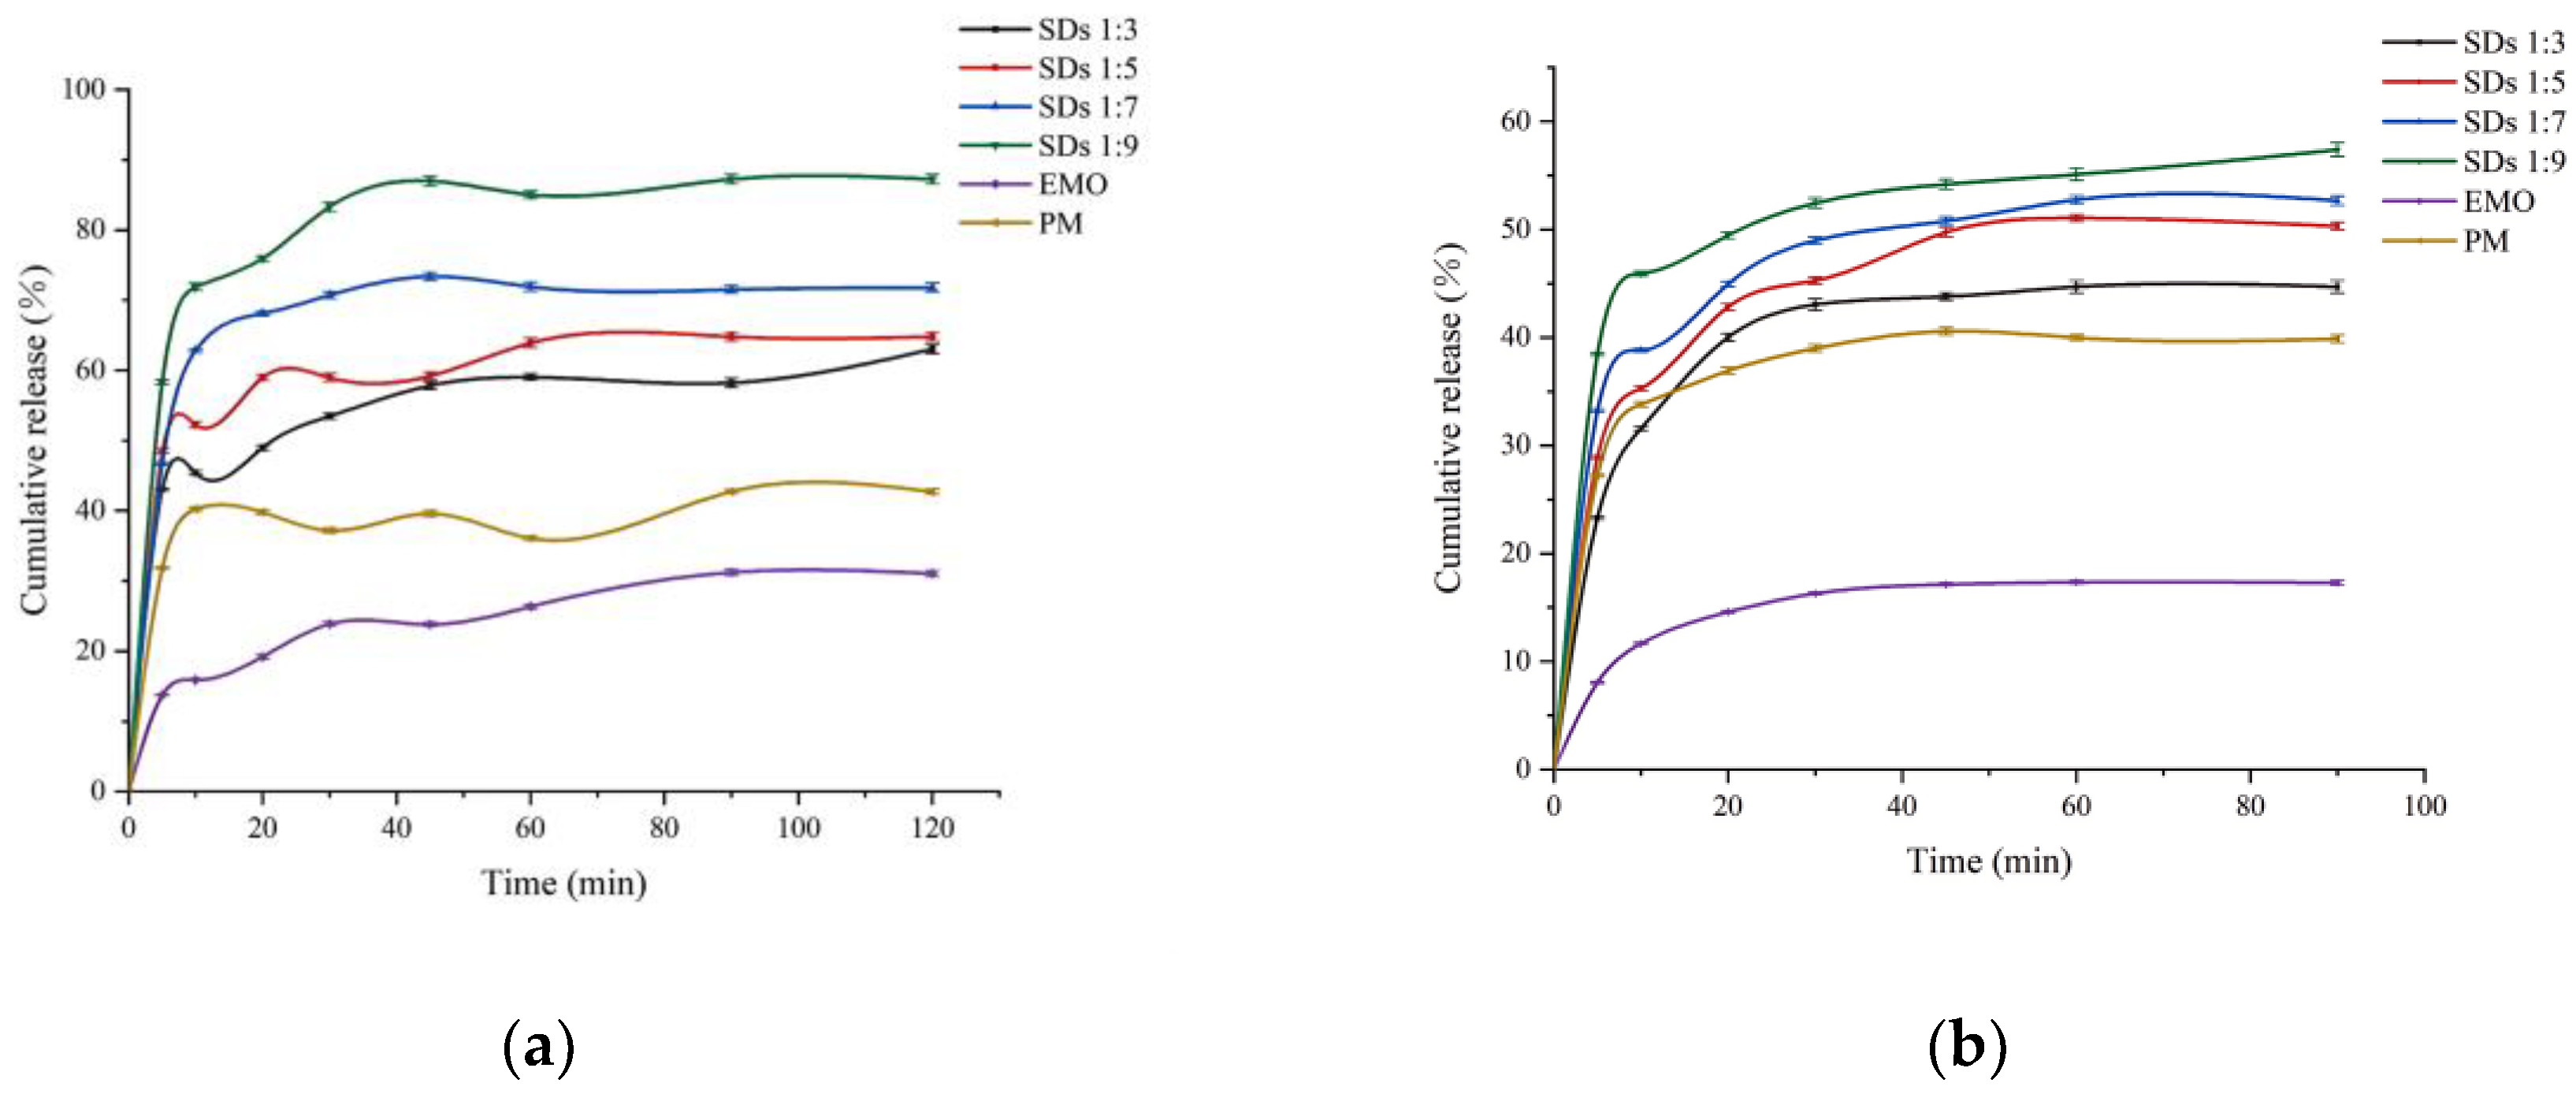
Figure 1.
Dissolution profiles of EMO and formulations (n = 3) in (a) pH 6.80 buffer and (b) pH 1.2 buffer.
Figure 1.
Dissolution profiles of EMO and formulations (n = 3) in (a) pH 6.80 buffer and (b) pH 1.2 buffer.
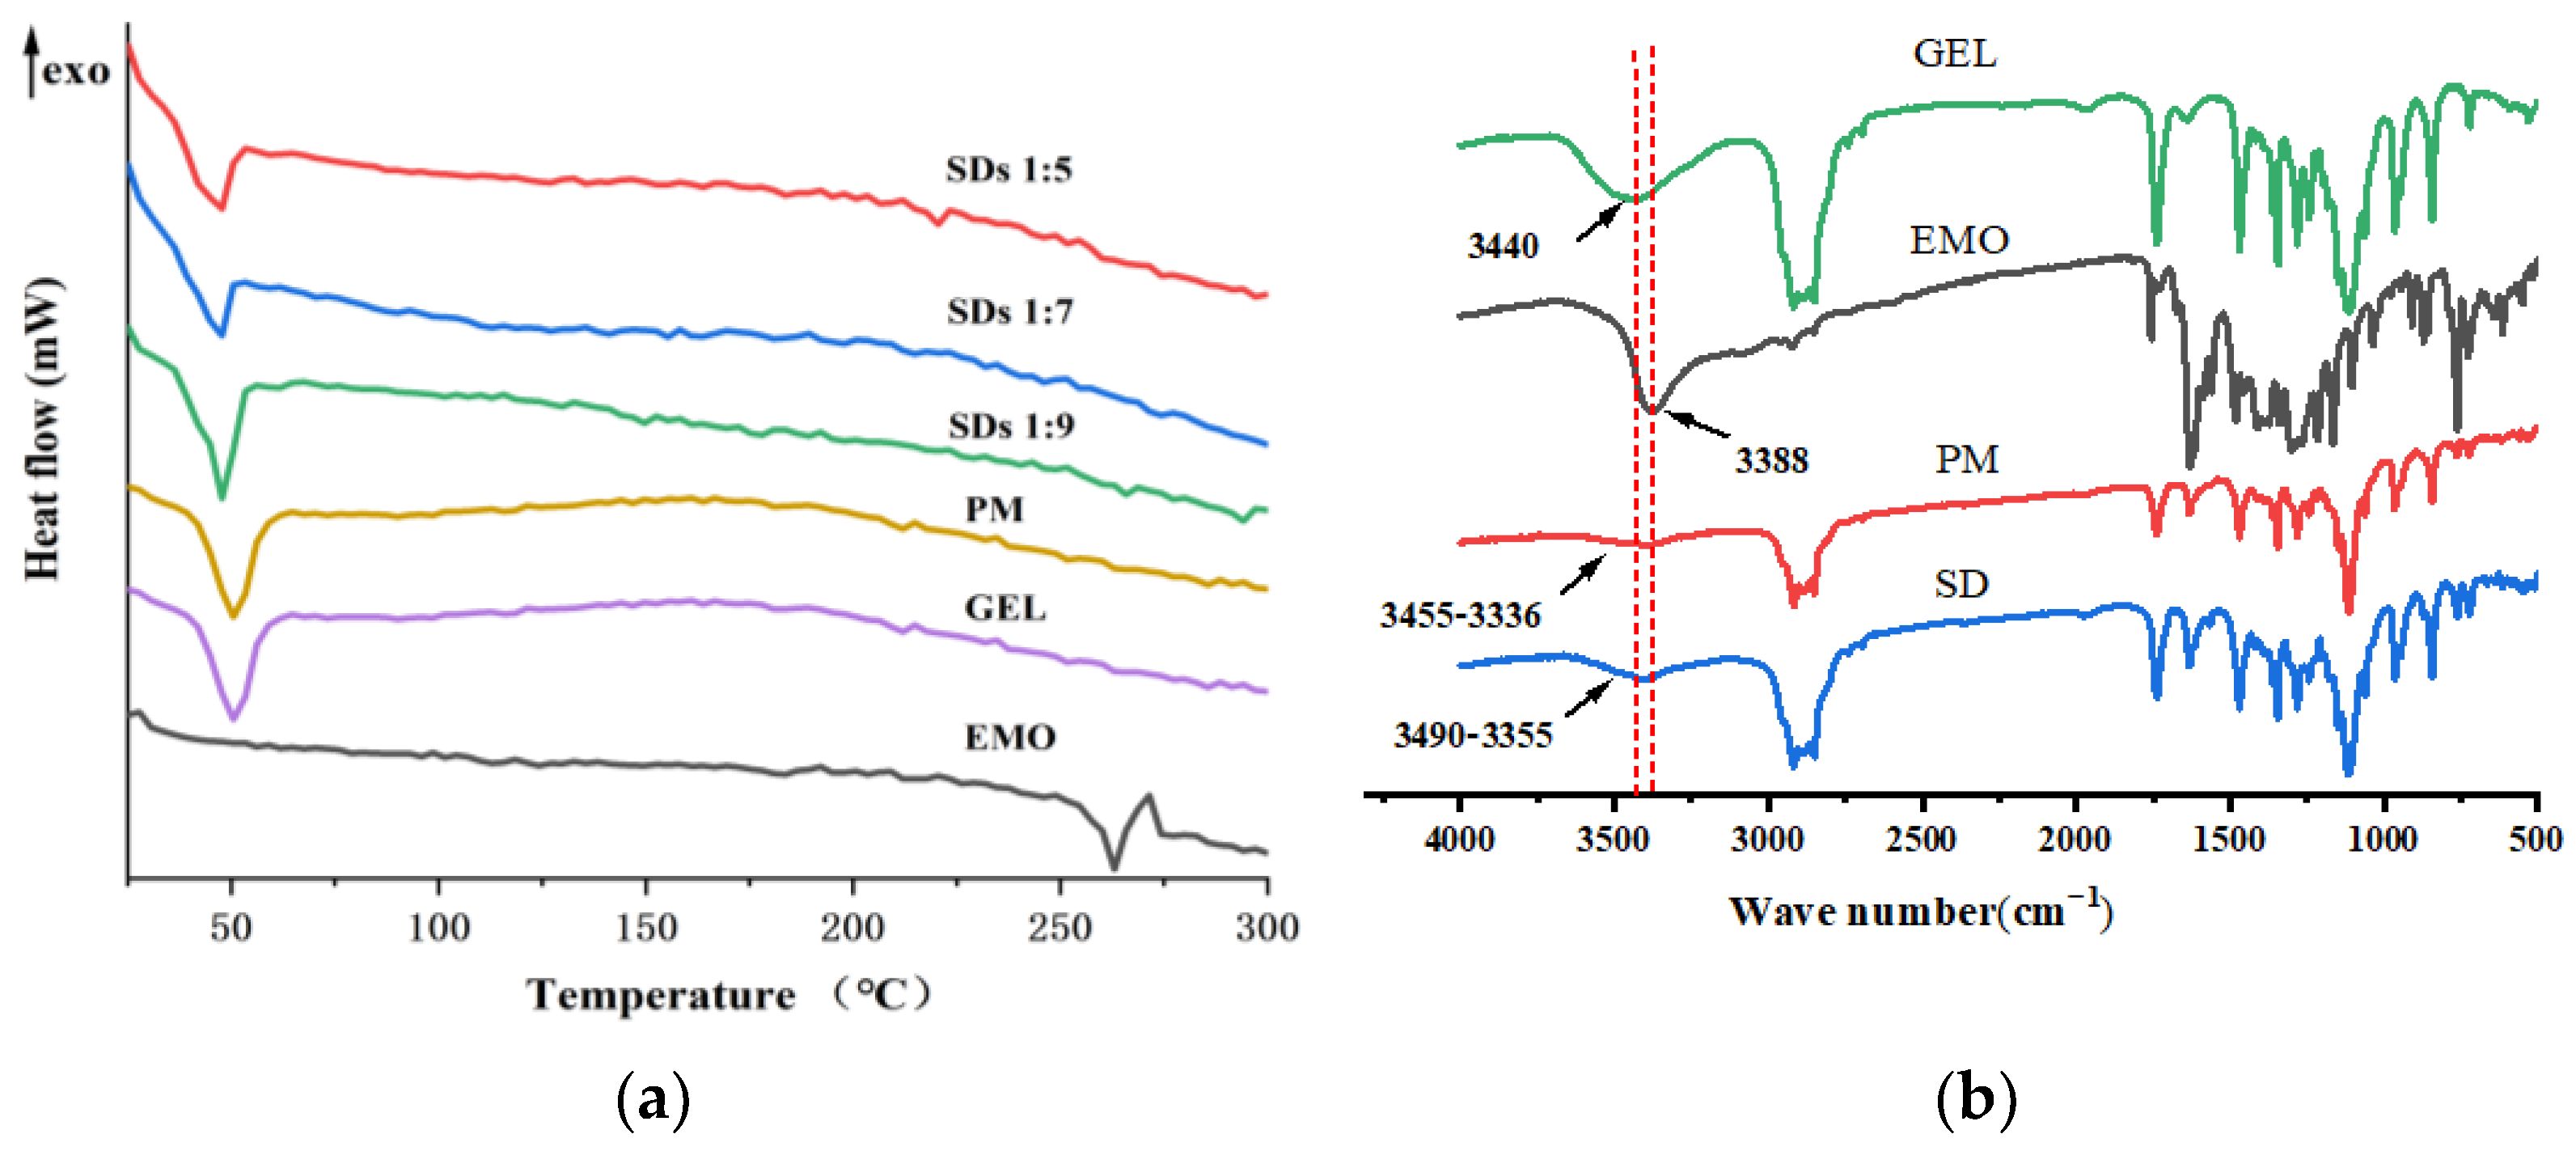
Figure 2.
DSC thermograms (a) and FTIR spectra (b) of EMO, GEL, PM, and SDs.
Figure 2.
DSC thermograms (a) and FTIR spectra (b) of EMO, GEL, PM, and SDs.
Figure 3.
NMR spectrum of EMO (a), SD (b), PM (c), and GEL (d).
Figure 3.
NMR spectrum of EMO (a), SD (b), PM (c), and GEL (d).
Figure 4.
Dissolution curves for EMO-GEL-SDs with different drug-loading ratios at (a) pH 6.8 and (b) pH 1.2.
Figure 4.
Dissolution curves for EMO-GEL-SDs with different drug-loading ratios at (a) pH 6.8 and (b) pH 1.2.
Figure 5.
Snapshots of EMO-GEL-SDs; the initial structures of systems with different drug-loading ratios, (a) 1:5, (c) 1:7, (e) 1:9; the initial structures of simulated annealing with different drug-loading ratios, (b) 1:5, (d) 1:7, (f) 1:9.
Figure 5.
Snapshots of EMO-GEL-SDs; the initial structures of systems with different drug-loading ratios, (a) 1:5, (c) 1:7, (e) 1:9; the initial structures of simulated annealing with different drug-loading ratios, (b) 1:5, (d) 1:7, (f) 1:9.
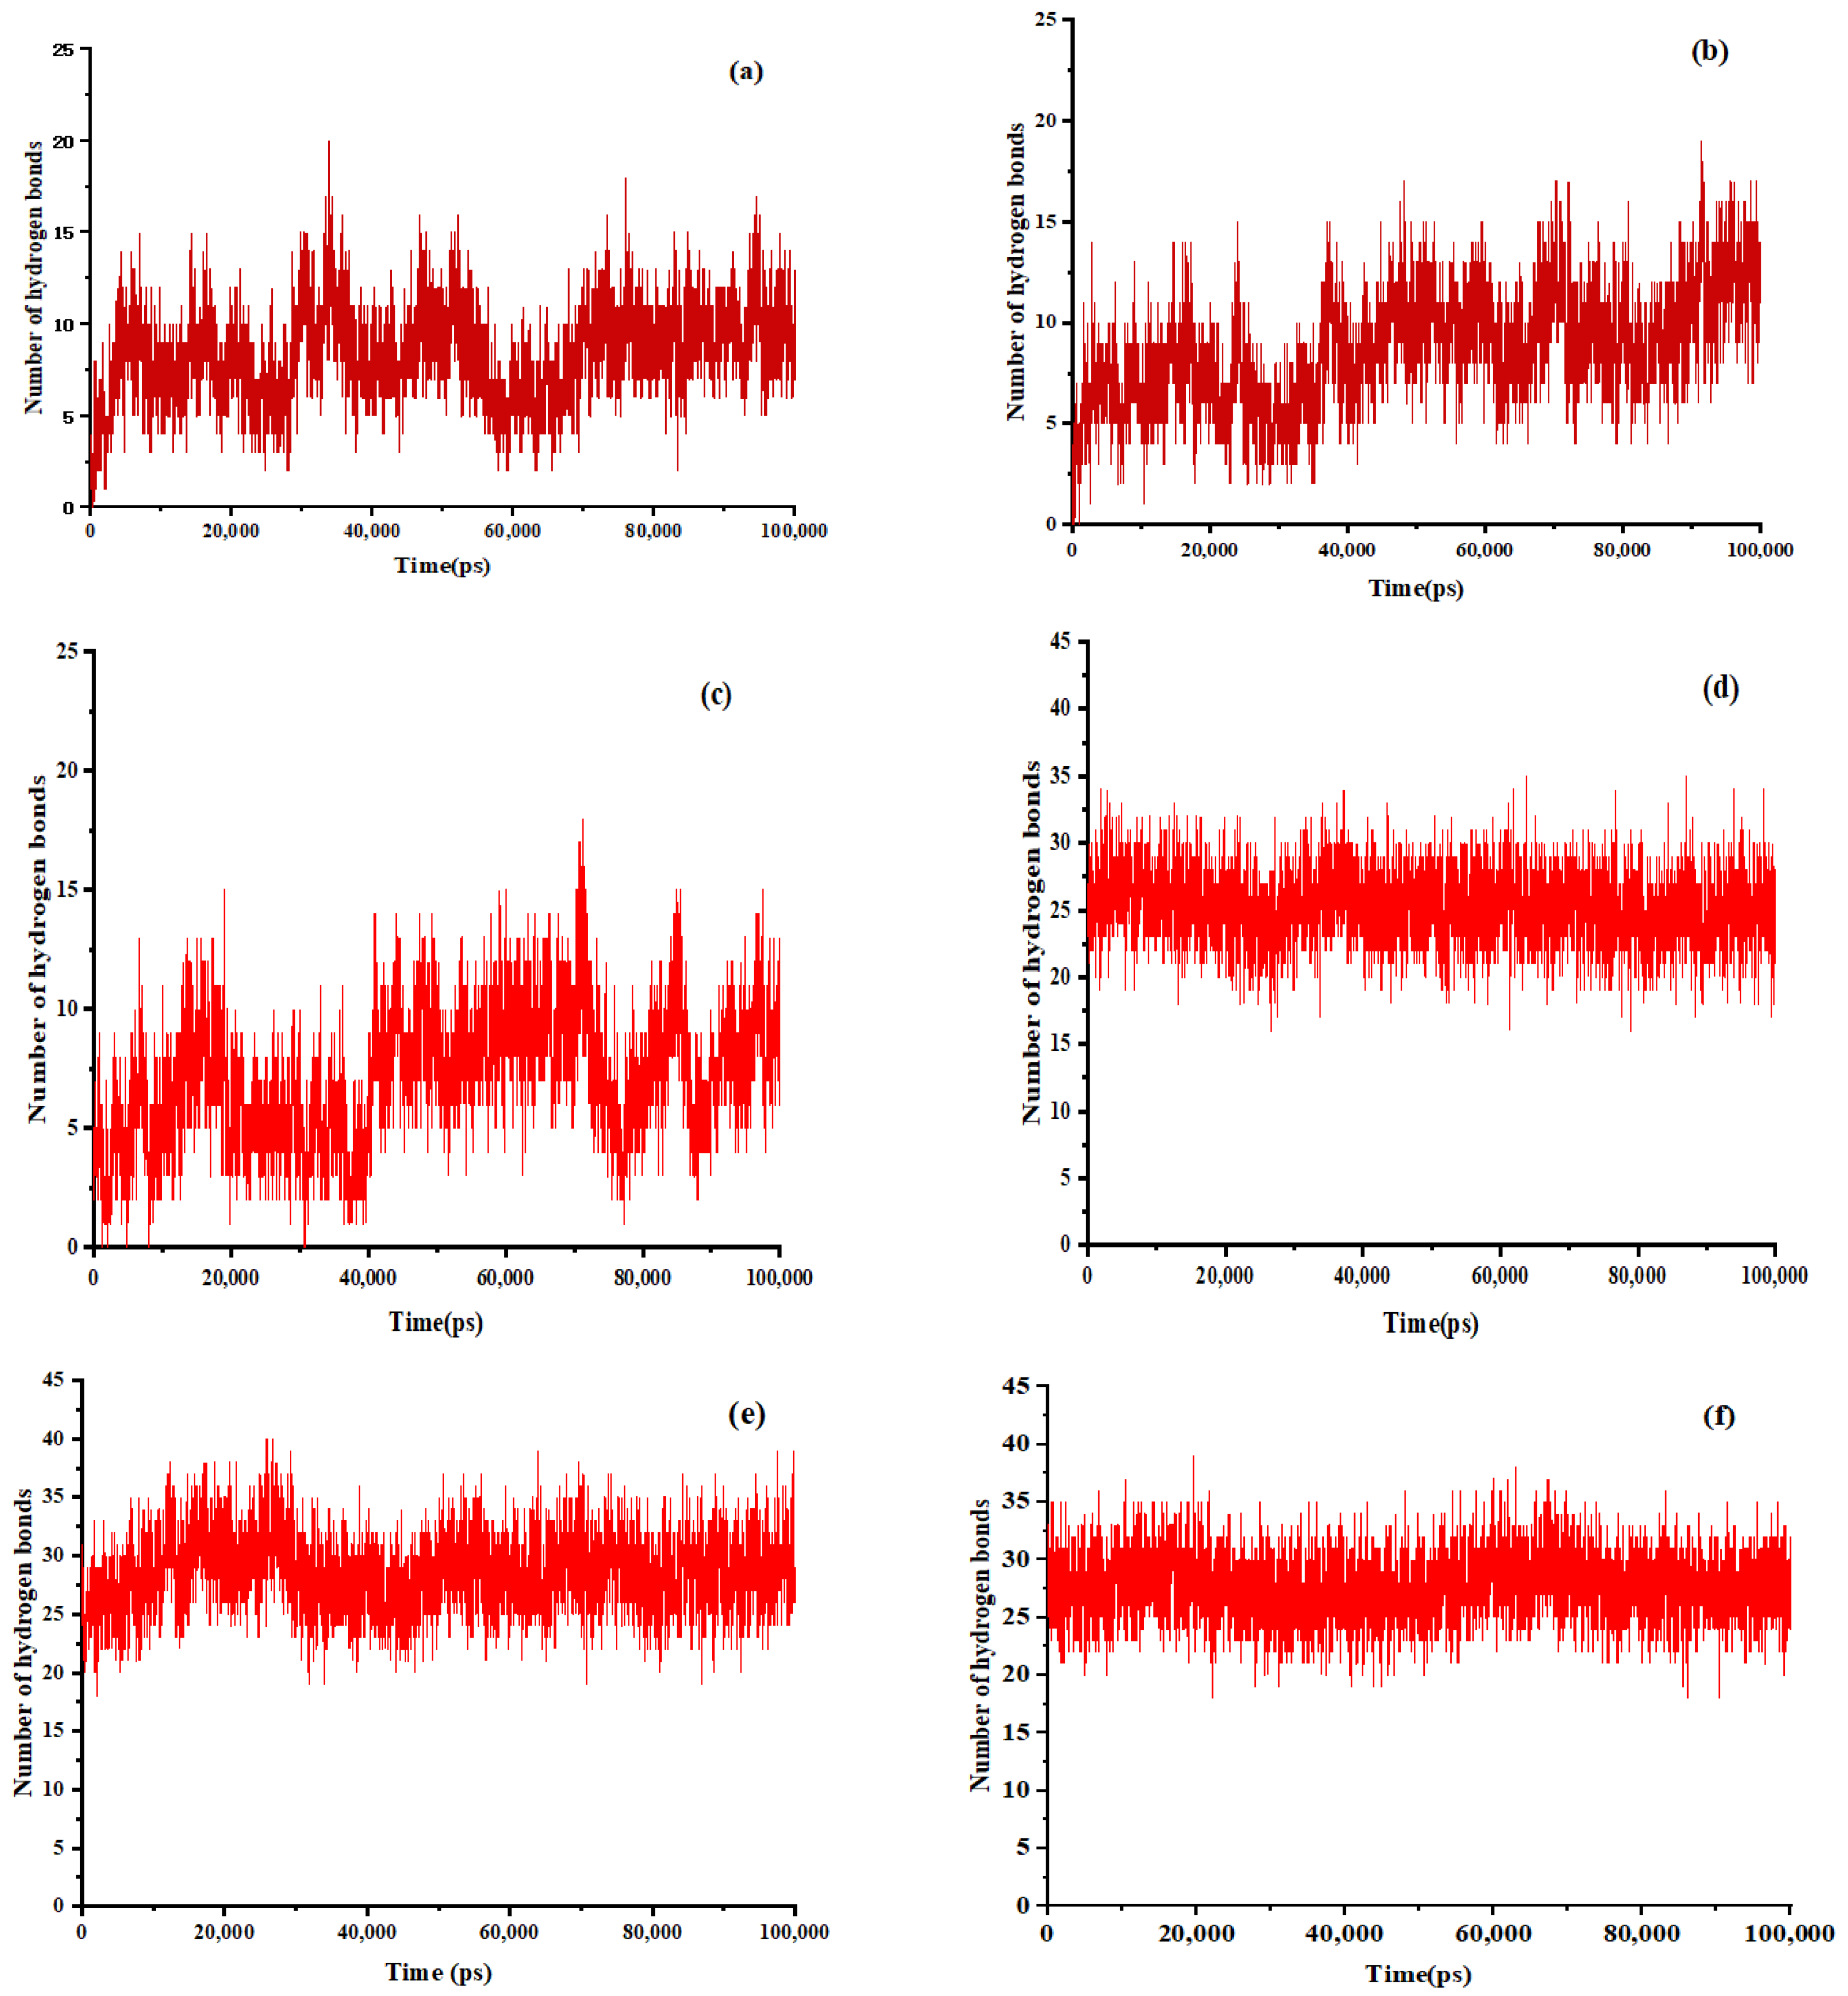
Figure 6.
The number of hydrogen bonds between EMO and GEL in ethanol, (a) drug-loading ratio of 1:5, (b) drug-loading ratio of 1:7, (c) drug-loading ratio of 1:9; the number of hydrogen bonds between EMO and GEL in a 100 ns MD simulation process after simulated annealing, (d) drug-loading ratio of 1:5, (e) drug-loading ratio of 1:7, (f) drug-loading ratio of 1:9.
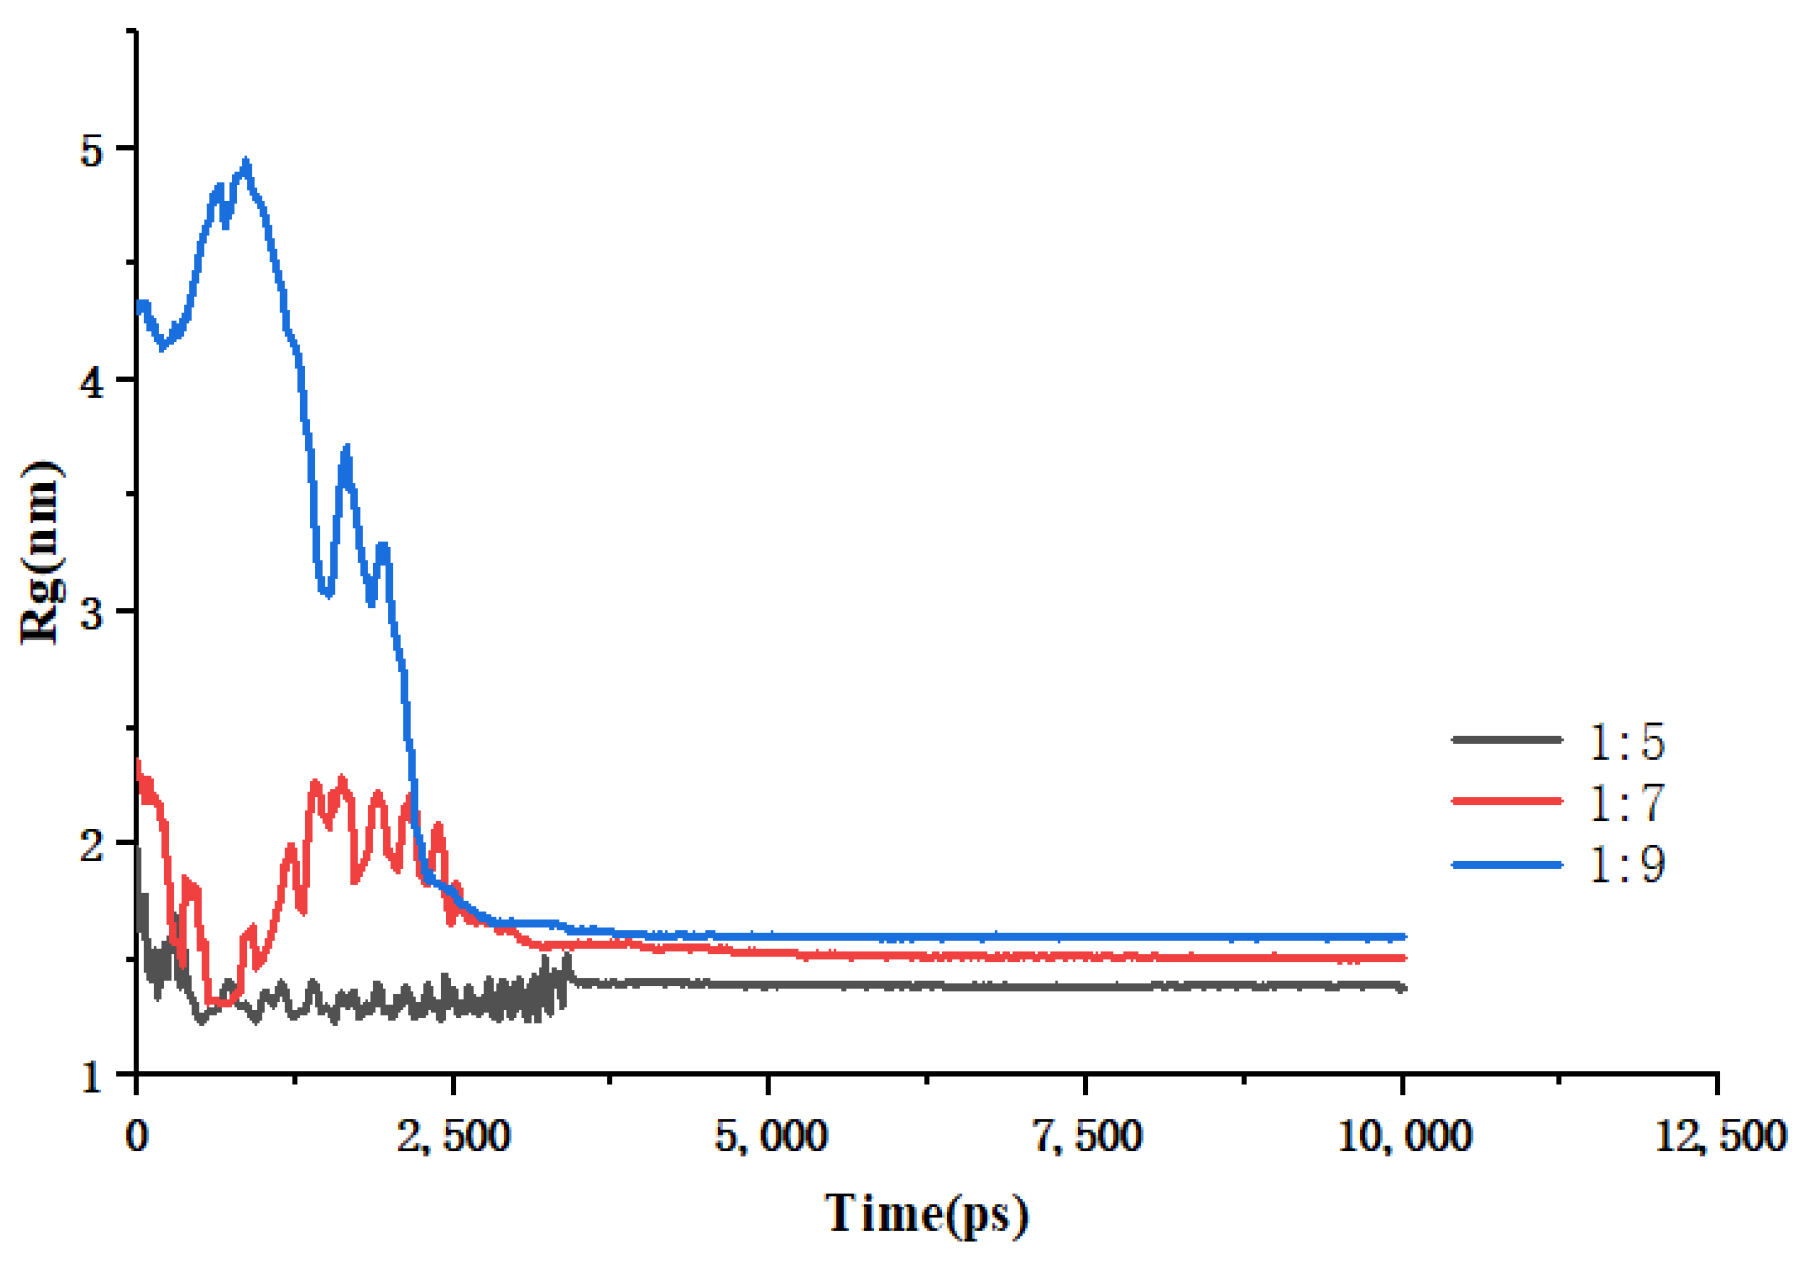
Figure 7.
Changes in Rg over time during simulated annealing of EMO-GEL-SDs.
Figure 7.
Changes in Rg over time during simulated annealing of EMO-GEL-SDs.
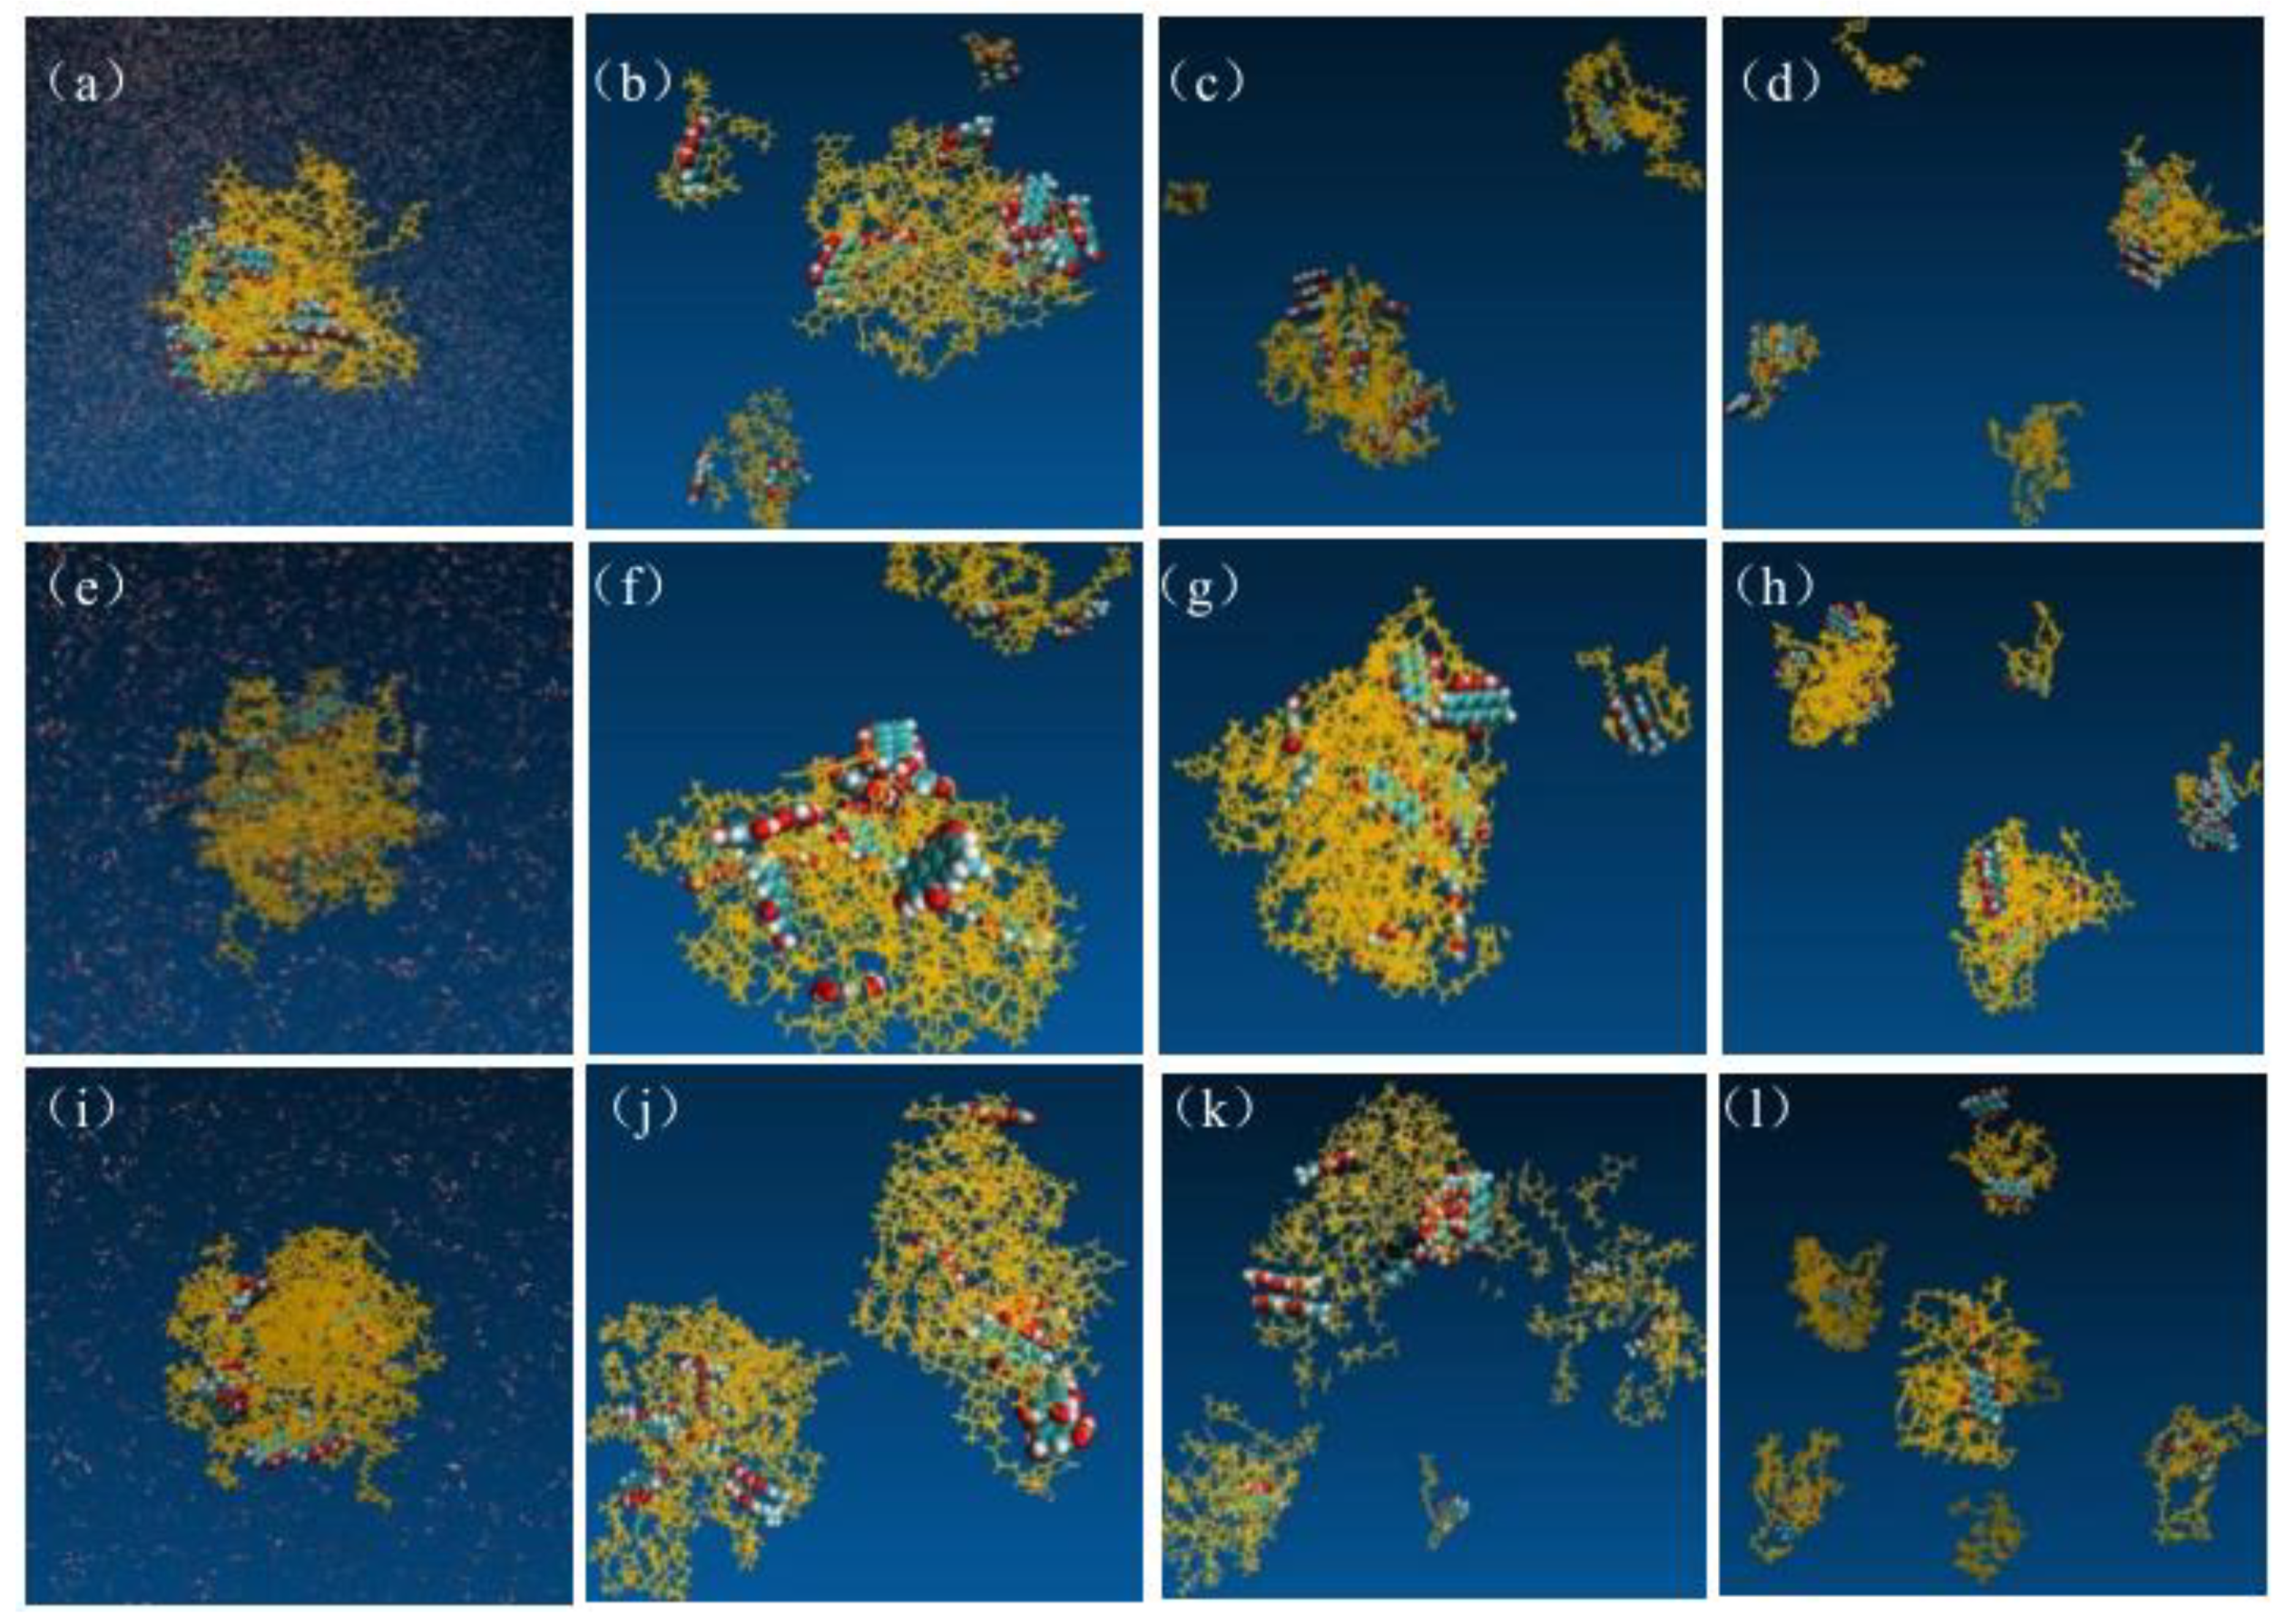
Figure 8.
Structures of EMO-GEL SDs with a 1:5 drug-loading ratio in water, (a) 0 ns, (b) 64 ns, (c) 200 ns, (d) 400 ns; structures of EMO-GEL SDs in water with a 1:7 drug-loading ratio, (e) 0 ns, (f) 50 ns, (g) 200 ns, (h) 370 ns; structure of EMO-GEL SD with a 1:9 drug-loading ratio in water, (i) 0 ns, (j) 50 ns, (k) 300 ns, (l) 600 ns.
Figure 9.
Structure of EMO-GEL-SDs with a drug-loading ratio of 1:9 in water containing SDS, (a) 0 ns, (b) 13 ns, (c) 64 ns, (d) 113 ns.
Figure 9.
Structure of EMO-GEL-SDs with a drug-loading ratio of 1:9 in water containing SDS, (a) 0 ns, (b) 13 ns, (c) 64 ns, (d) 113 ns.
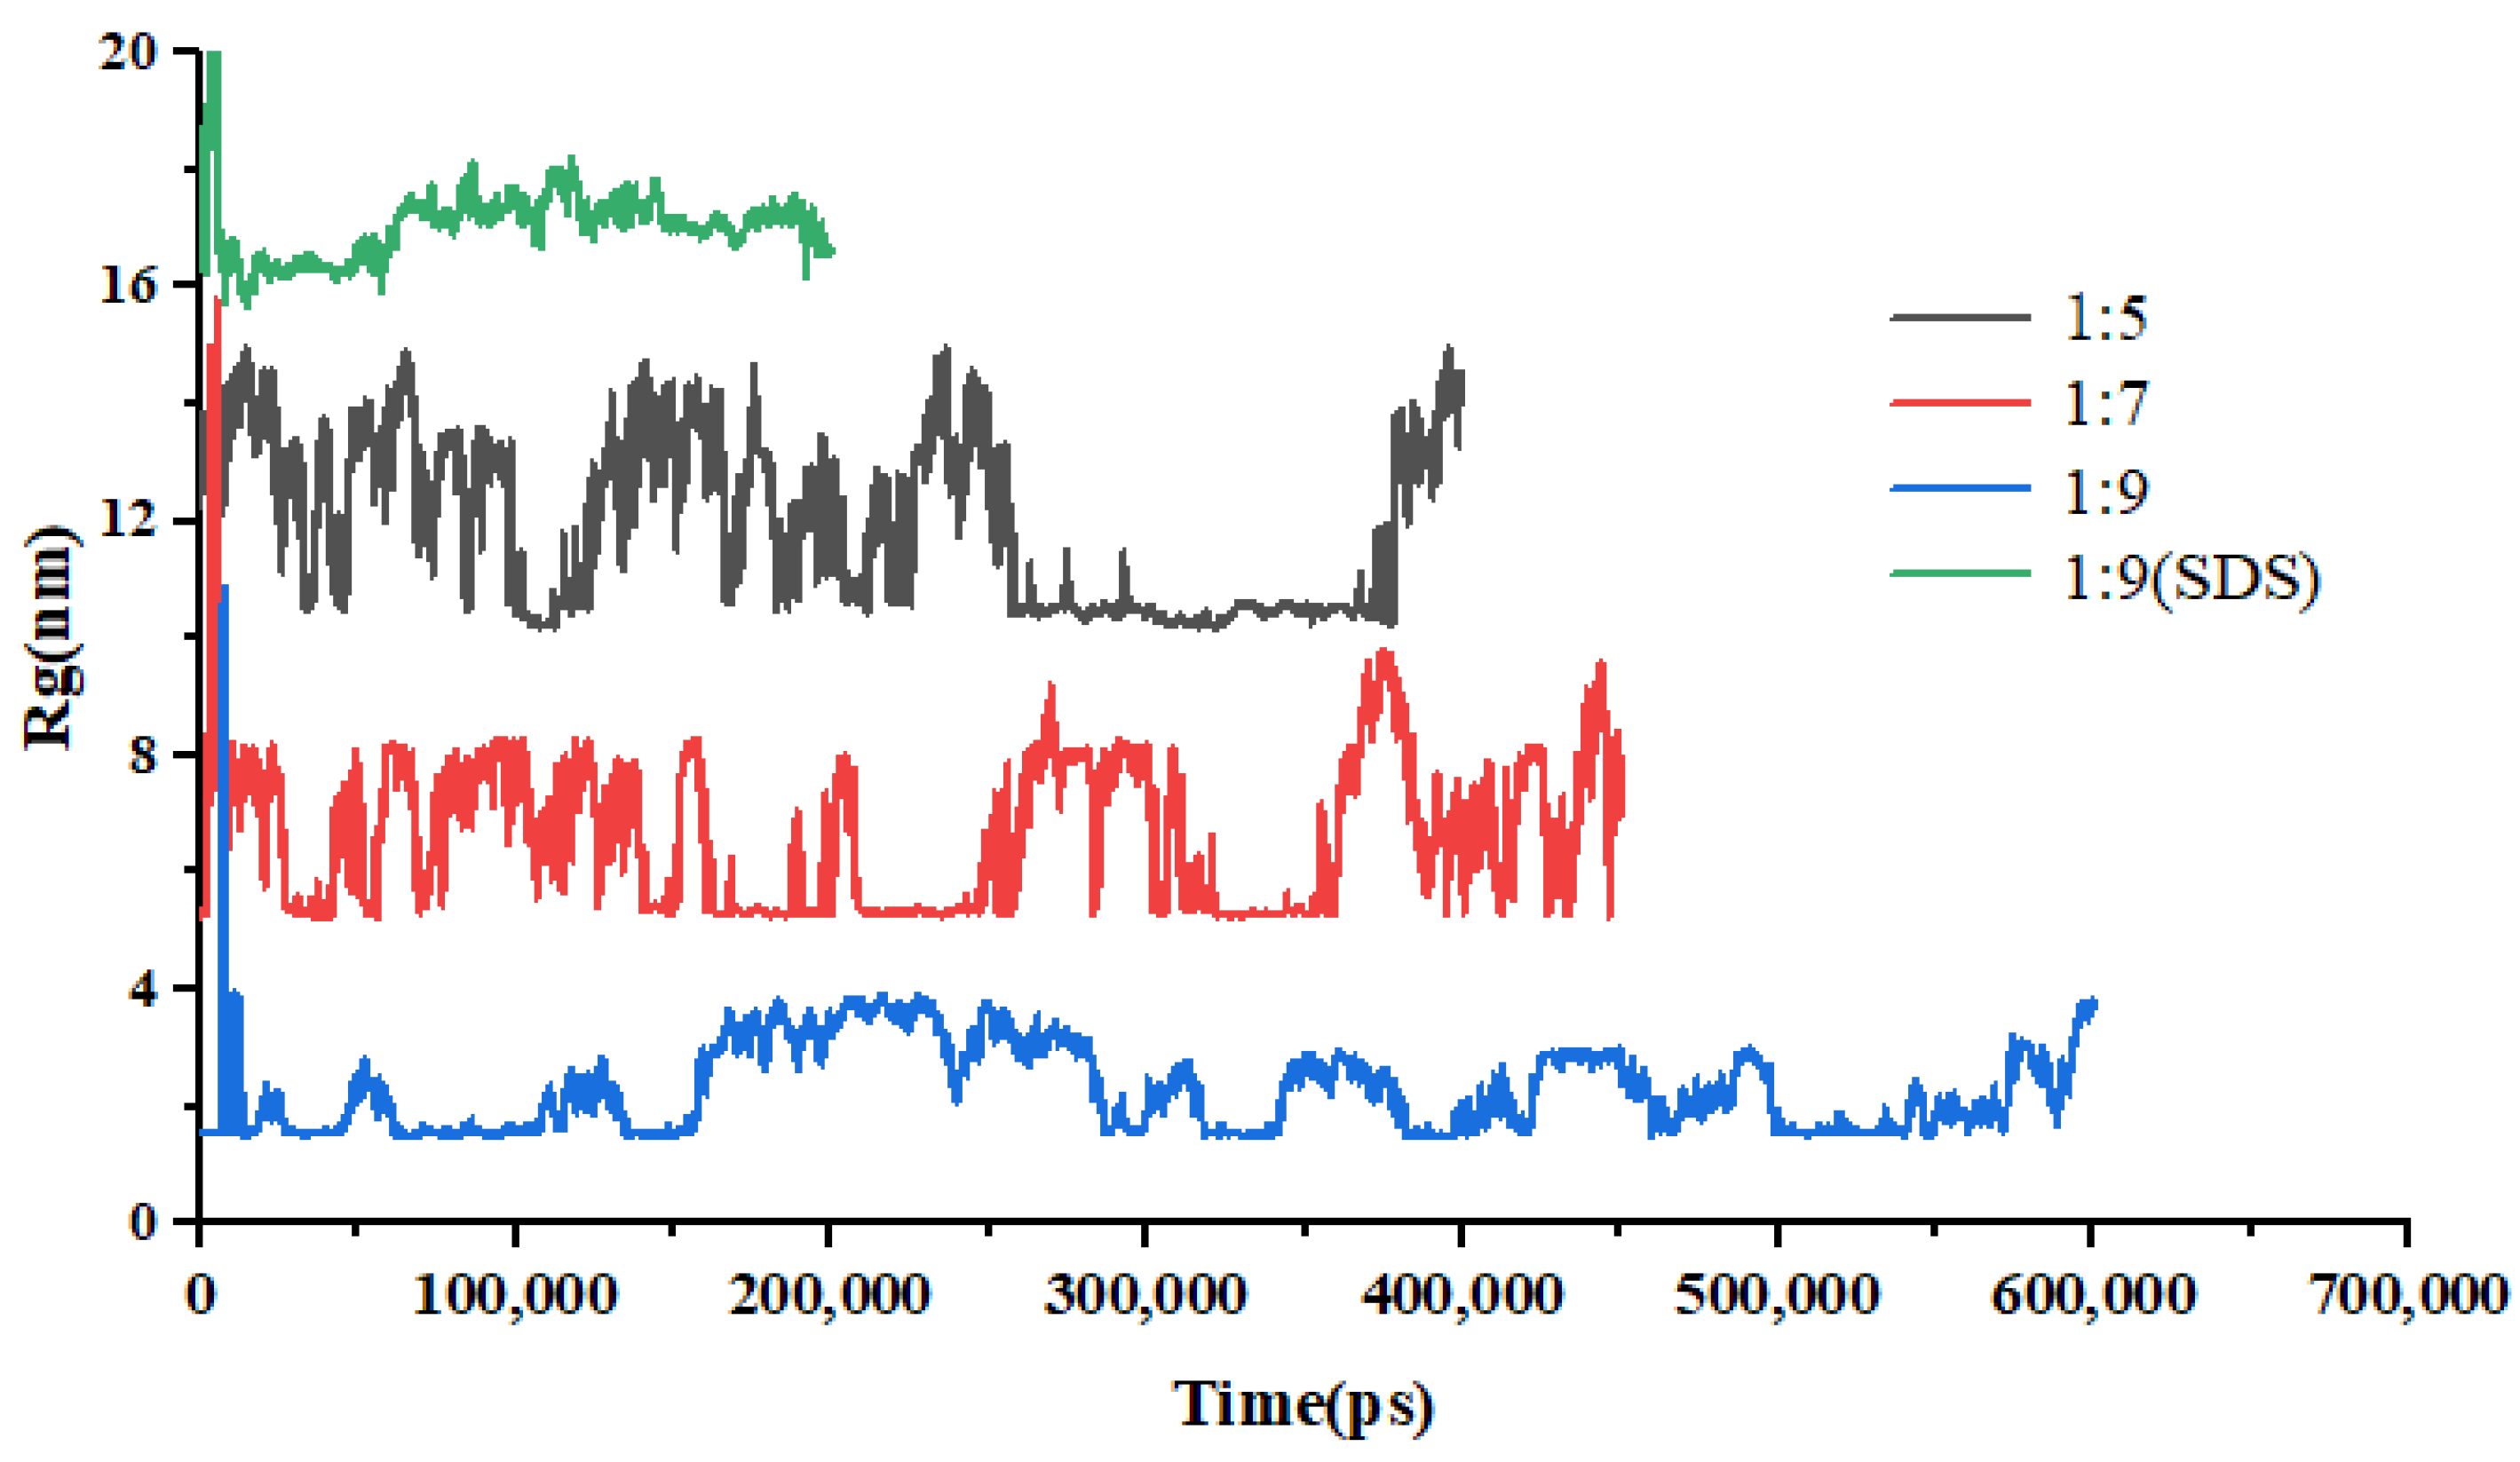
Figure 10.
Changes in Rg of EMO-GEL-SDs with different drug-loading ratios over time.
Figure 10.
Changes in Rg of EMO-GEL-SDs with different drug-loading ratios over time.
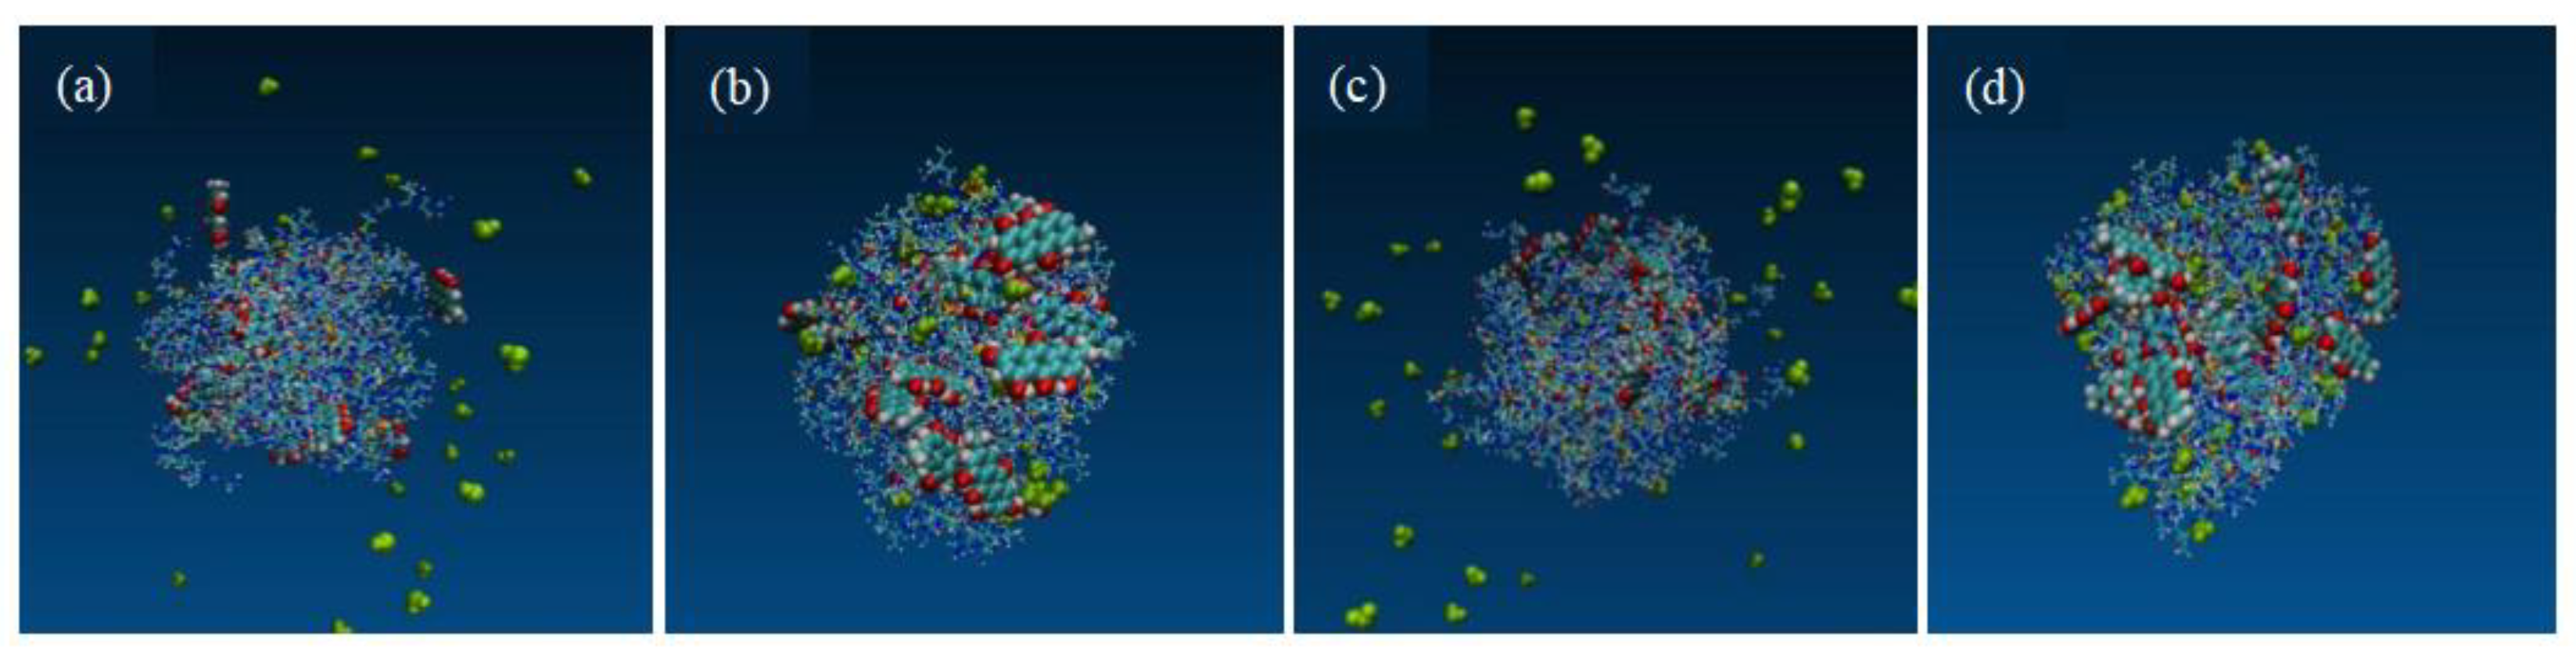
Figure 11.
The system with a 1:7 drug-loading ratio; the initial structure is depicted (a); the final structure following a 400 ns MD simulation under simulated acceleration conditions (b). The system with a 1:9 drug-loading ratio; the initial structure (c); the final structure after a 400 ns MD simulation under similar simulated acceleration conditions (d).
Figure 12.
RMSD for accelerated testing of EMO-GEL-SDs.
Figure 12.
RMSD for accelerated testing of EMO-GEL-SDs.
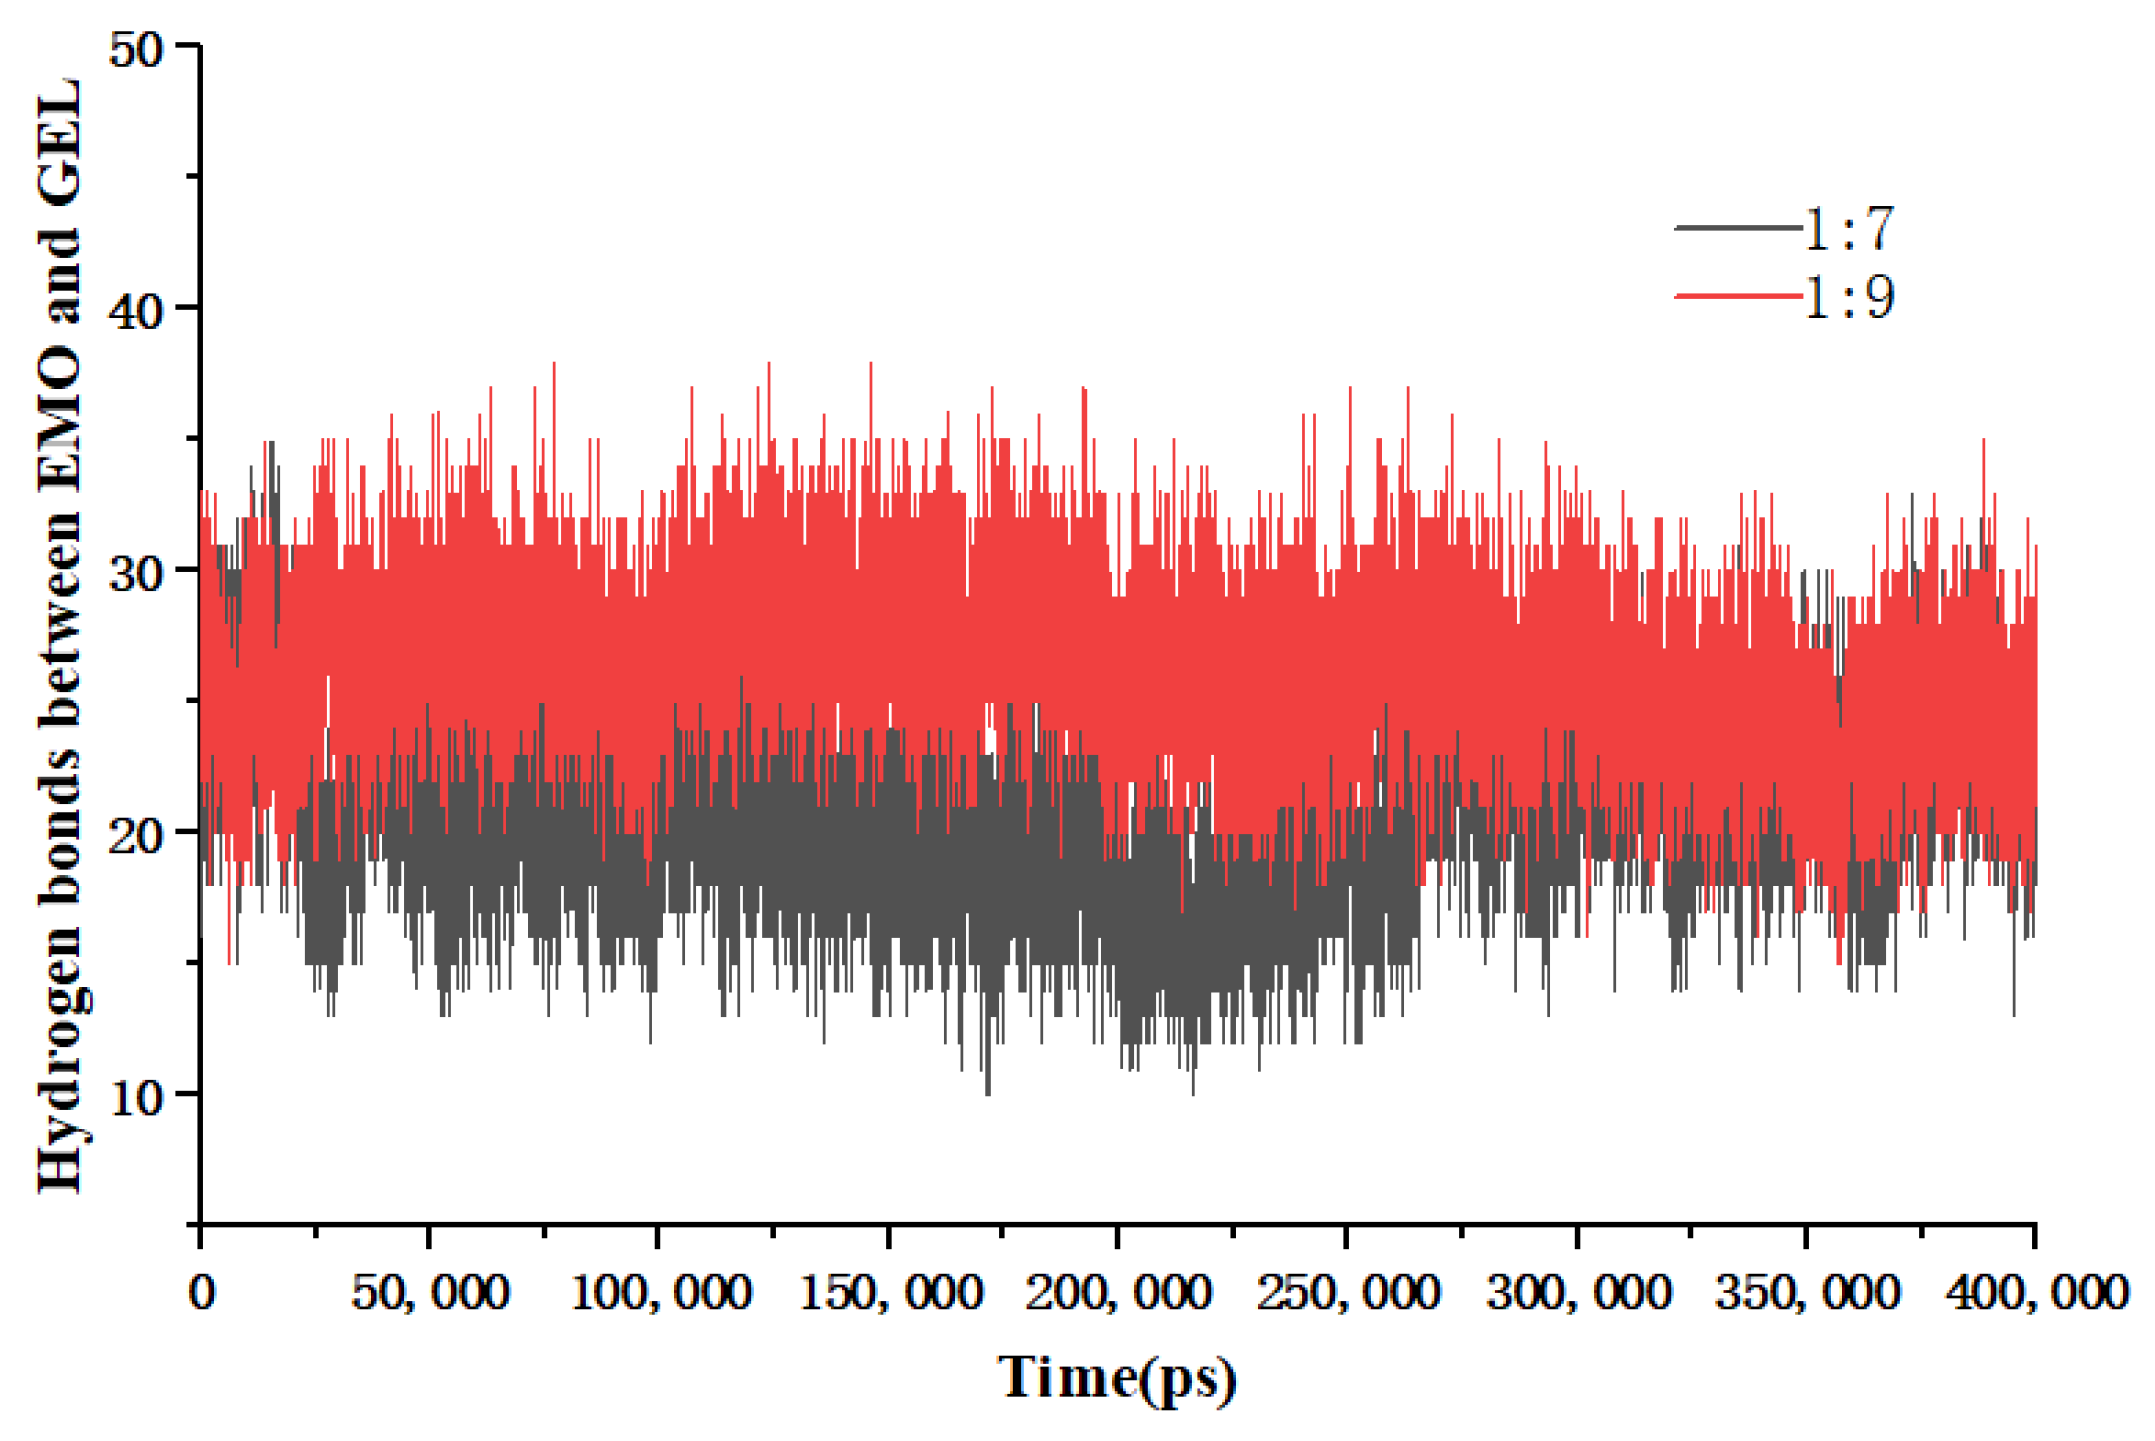
Figure 13.
Number of EMO-GEL hydrogen bonds for accelerated testing.
Figure 13.
Number of EMO-GEL hydrogen bonds for accelerated testing.
Table 1.
Solubility parameter (δ) calculation results.
Table 1.
Solubility parameter (δ) calculation results.
| Substances | δ (J/cm3)1/2 | Δδ (J/cm3)1/2 |
|---|
| EMO | 25.65 | — |
| PVPK30 | 21.66 | 3.99 |
| PVPVA64 | 20.14 | 5.51 |
| HPMC | 21.98 | 3.67 |
| GEL | 26.81 | 1.16 |
Table 2.
Flory–Huggins (F-H) interaction parameter (χ) calculation results.
Table 2.
Flory–Huggins (F-H) interaction parameter (χ) calculation results.
| Drug–Carrier | χ |
|---|
| EMO-PVPK30 | 1.10 |
| EMO-PVPVA64 | 2.09 |
| EMO-HPMC | 0.93 |
| EMO-GEL | 0.09 |
Table 3.
Solubility of EMO in aqueous polymer carrier solutions.
Table 3.
Solubility of EMO in aqueous polymer carrier solutions.
| Carrier Type | pH Value | Solubility (μg/mL) | Standard Deviation | Confidence Limits |
|---|
| - | 1.2 | - | - | - |
| - | 6.8 | - | - | - |
| PVPVA64 | 1.2 | 0.49 * | 0.025 | 0.441–0.539 |
| PVPVA64 | 6.8 | 2.38 * | 0.0455 | 2.291–2.469 |
| PVPK30 | 1.2 | 0.06 * | 0.00163 | 0.0568–0.0632 |
| PVPK30 | 6.8 | 0.37 * | 0.0125 | 0.3455–0.3945 |
| GEL | 1.2 | 18.95 * | 0.082 | 18.789–19.111 |
| GEL | 6.8 | 110.86 * | 0.499 | 109.882–111.838 |
| HPMC | 1.2 | - | - | - |
| HPMC | 6.8 | - | - | - |
Table 4.
1H NMR spectrum information of EMO, SD, PM, and carrier (25 °C).
Table 4.
1H NMR spectrum information of EMO, SD, PM, and carrier (25 °C).
| Sample | δa | δb | δc | δd | δe | δf | δg |
|---|
| EMO | 6.55 | 7.07 | 7.11 | 7.43 | 11.35 | 11.96 | 12.05 |
| SDs | 6.61 | 7.14 | 7.19 | 7.52 | — | 12.04 | 12.10 |
| PM | 6.62 | 7.15 | 7.20 | 7.53 | 11.40 | 12.04 | 12.11 |
Table 5.
Simulation details of SD systems.
Table 5.
Simulation details of SD systems.
| SD System | Weight Ratio | Molar Ratio | Number of EMO Molecules | Number of GEL Molecules | Number of Ethanol Molecules | Total Atoms in Systems |
|---|
| EMO/GEL | 1:5 | 16:36 | 16 | 36 | 8000 | 75,216 |
| EMO/GEL | 1:7 | 16:51 | 16 | 51 | 8000 | 76,356 |
| EMO/GEL | 1:9 | 16:64 | 16 | 64 | 10,000 | 95,344 |
Table 6.
Simulation details of the dissolution process of SD systems.
Table 6.
Simulation details of the dissolution process of SD systems.
| SD System | Weight Ratio | Molar Ratio | Number of EMO Molecules | Number of GEL Molecules | Number of SDS Molecules | Number of Water Molecules | Total Atoms in System |
|---|
| EMO/GEL | 1:5 | 16:36 | 16 | 36 | 0 | 30,000 | 93,216 |
| EMO/GEL | 1:7 | 16:51 | 16 | 51 | 0 | 30,000 | 94,356 |
| EMO/GEL | 1:9 | 16:64 | 16 | 64 | 0 | 20,000 | 65,344 |
| EMO/GEL/SDS | 1:9 | 16:64 | 16 | 64 | 7 | 20,000 | 65,638 |
Table 7.
Simulation details of the molecular mechanisms of stability of SD systems.
Table 7.
Simulation details of the molecular mechanisms of stability of SD systems.
| SD Systems | Weight Ratio | Molar Ratio | Number of EMO Molecules | Number of GEL Molecules | Number of Water Molecules | Total Atoms in System |
|---|
| EMO/GEL | 1:7 | 16:36 | 16 | 51 | 50 | 4506 |
| EMO/GEL | 1:9 | 16:64 | 16 | 64 | 50 | 5494 |


