

Biomimetic Chromatography/QSAR Investigations in Modeling Properties Influencing the Biological Efficacy of Phenoxyacetic Acid-Derived Congeners

Abstract
1. Introduction
2. Results and Discussion
2.1. Toxicity of Phenoxyacetic Acid-Derived Congeners (1–29) on Red Blood Cells
2.2. In Silico Characteristics
2.3. Chromatographic Data
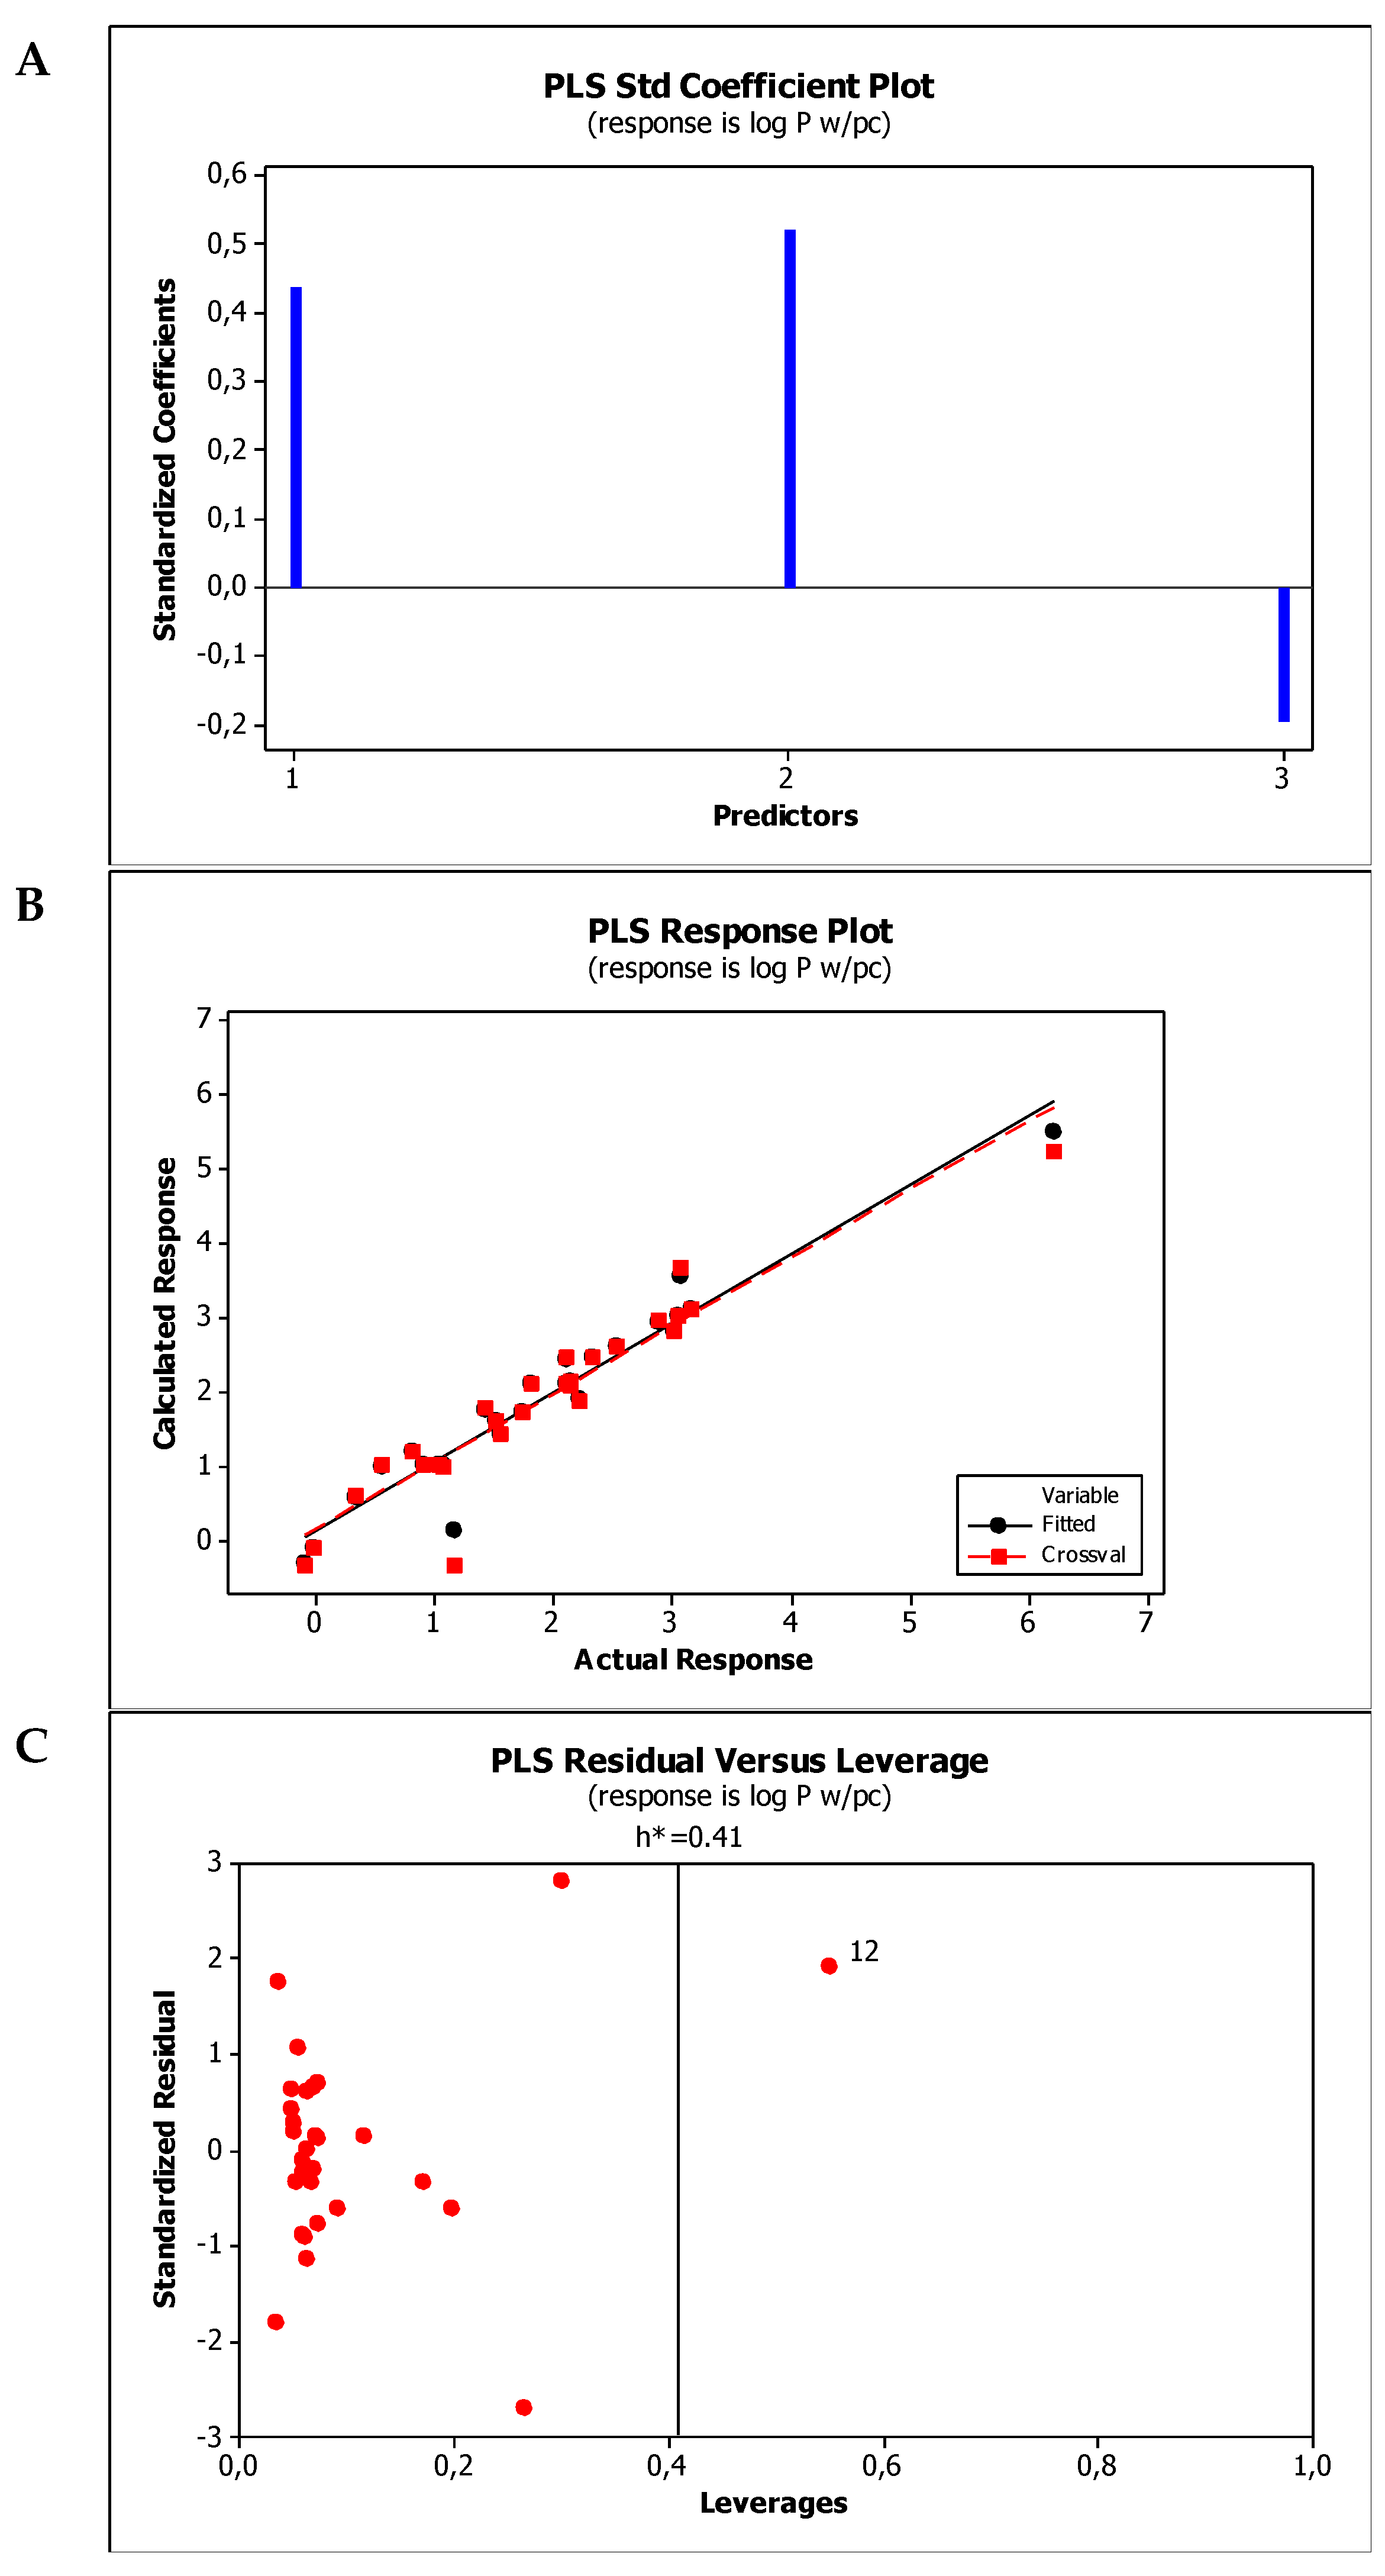
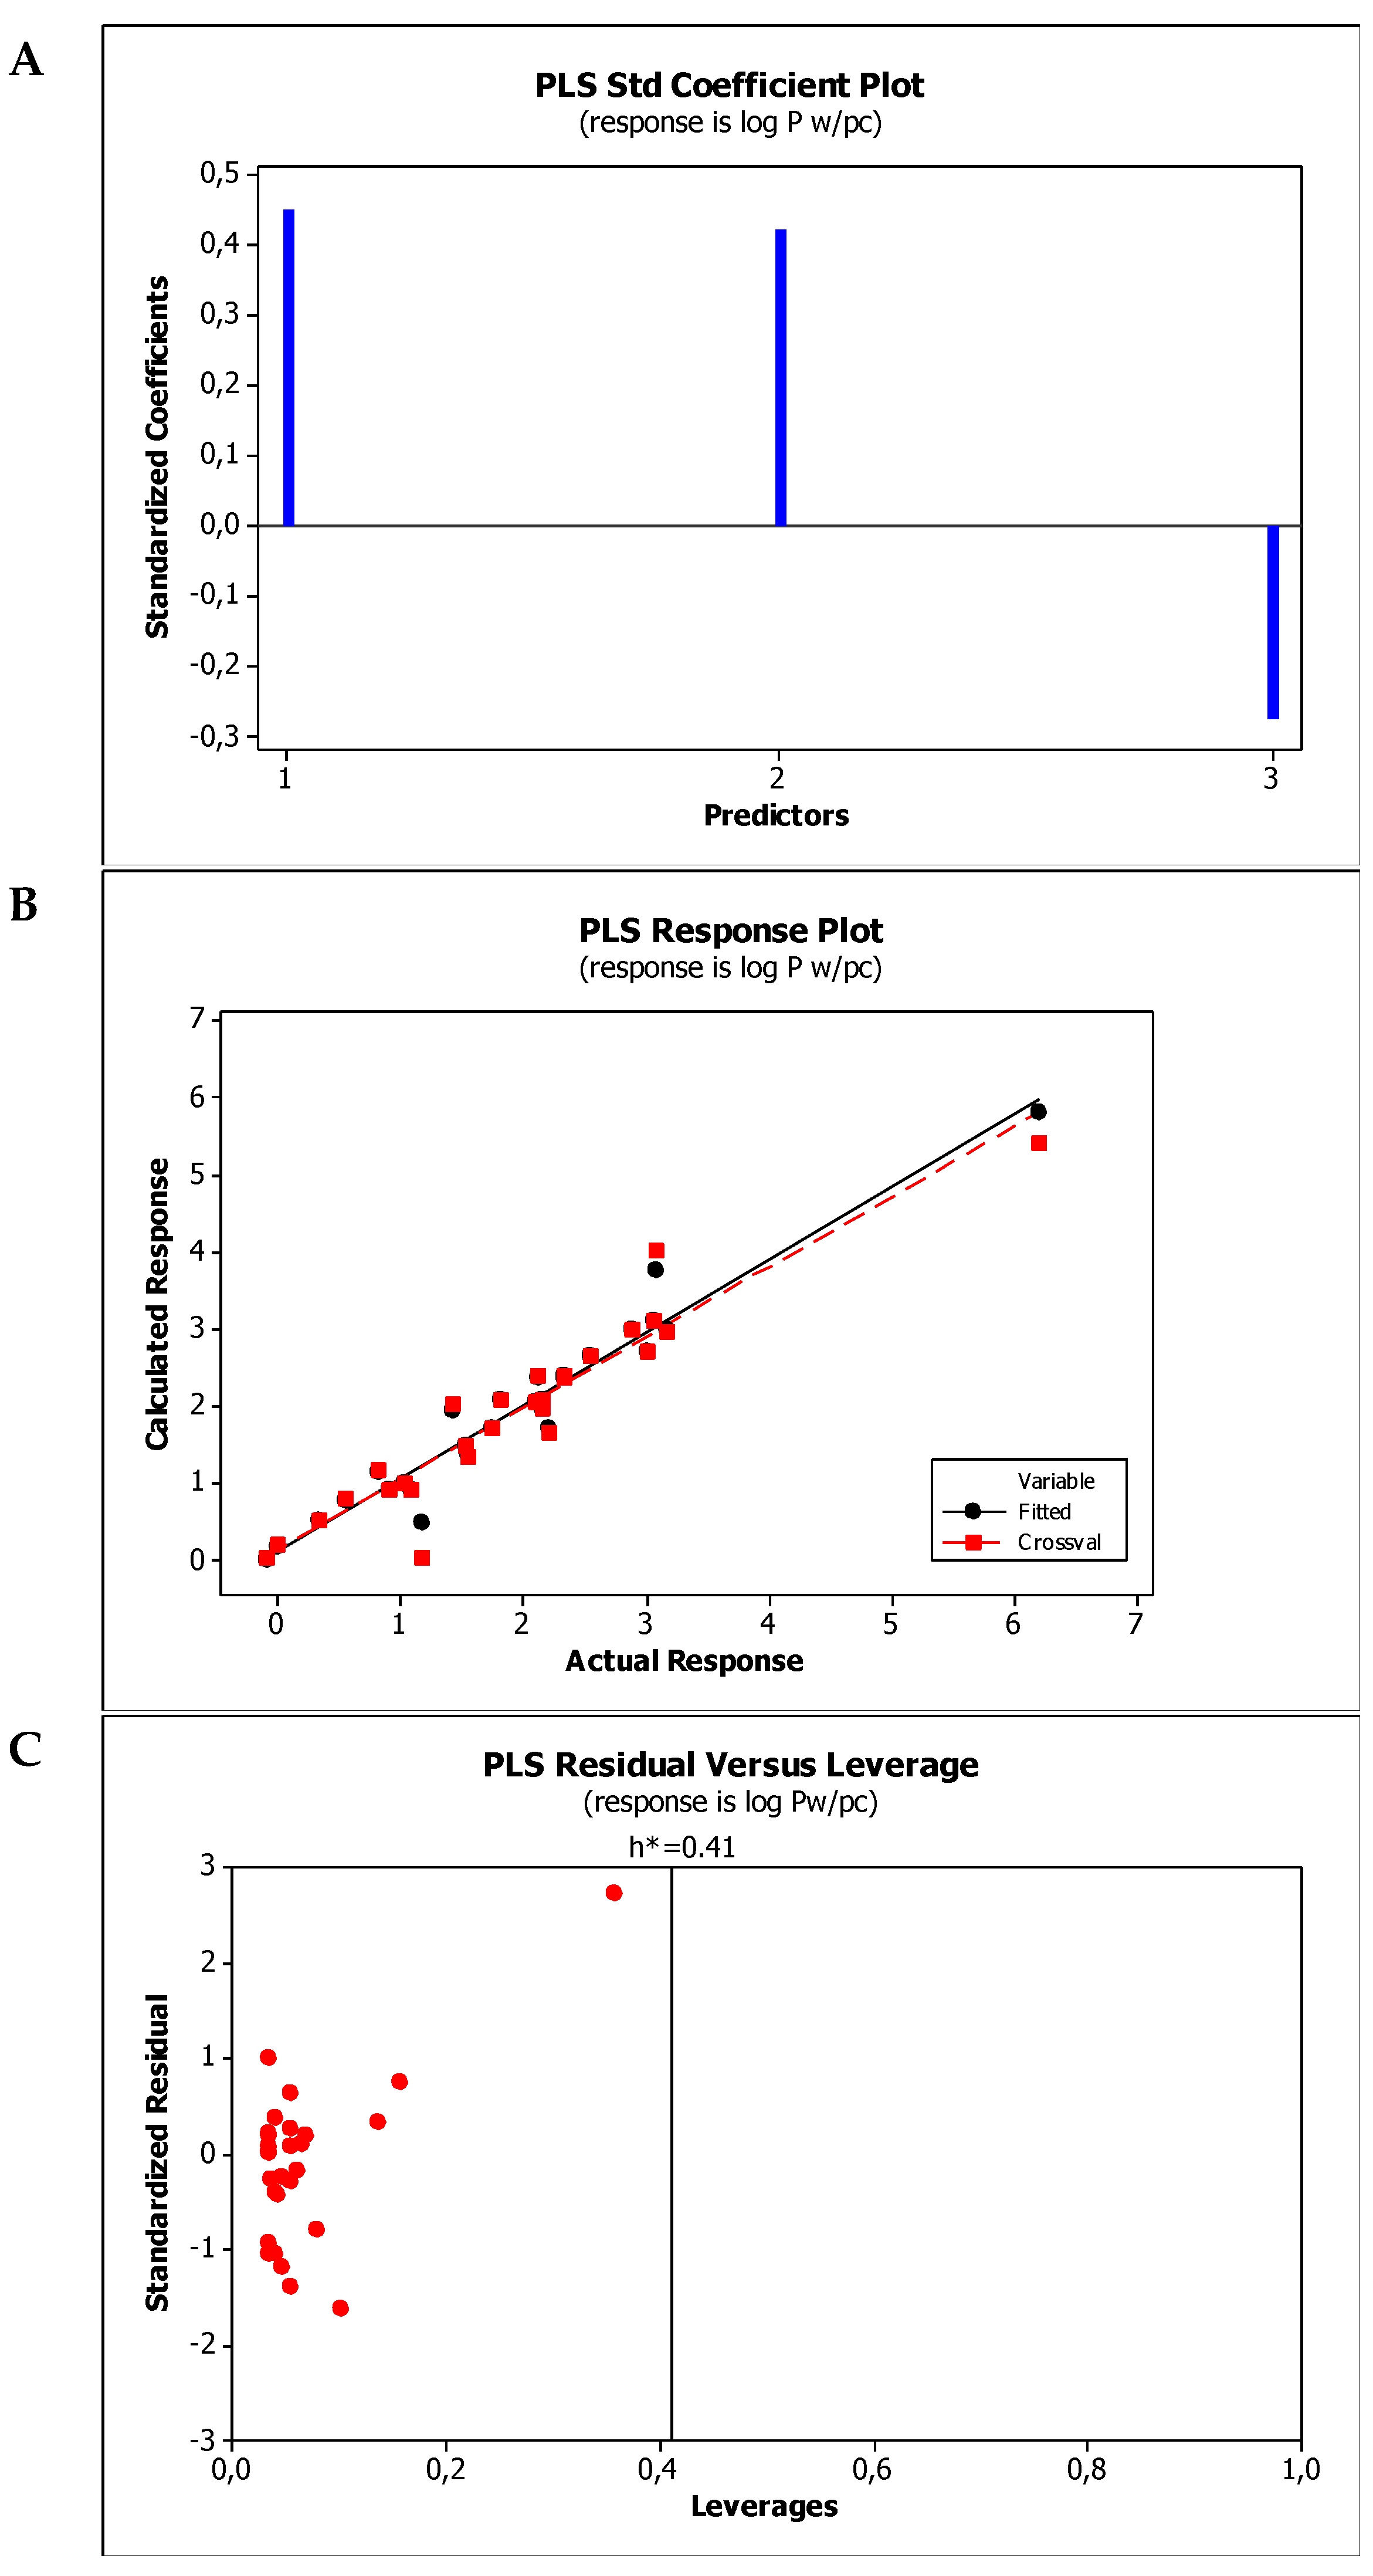
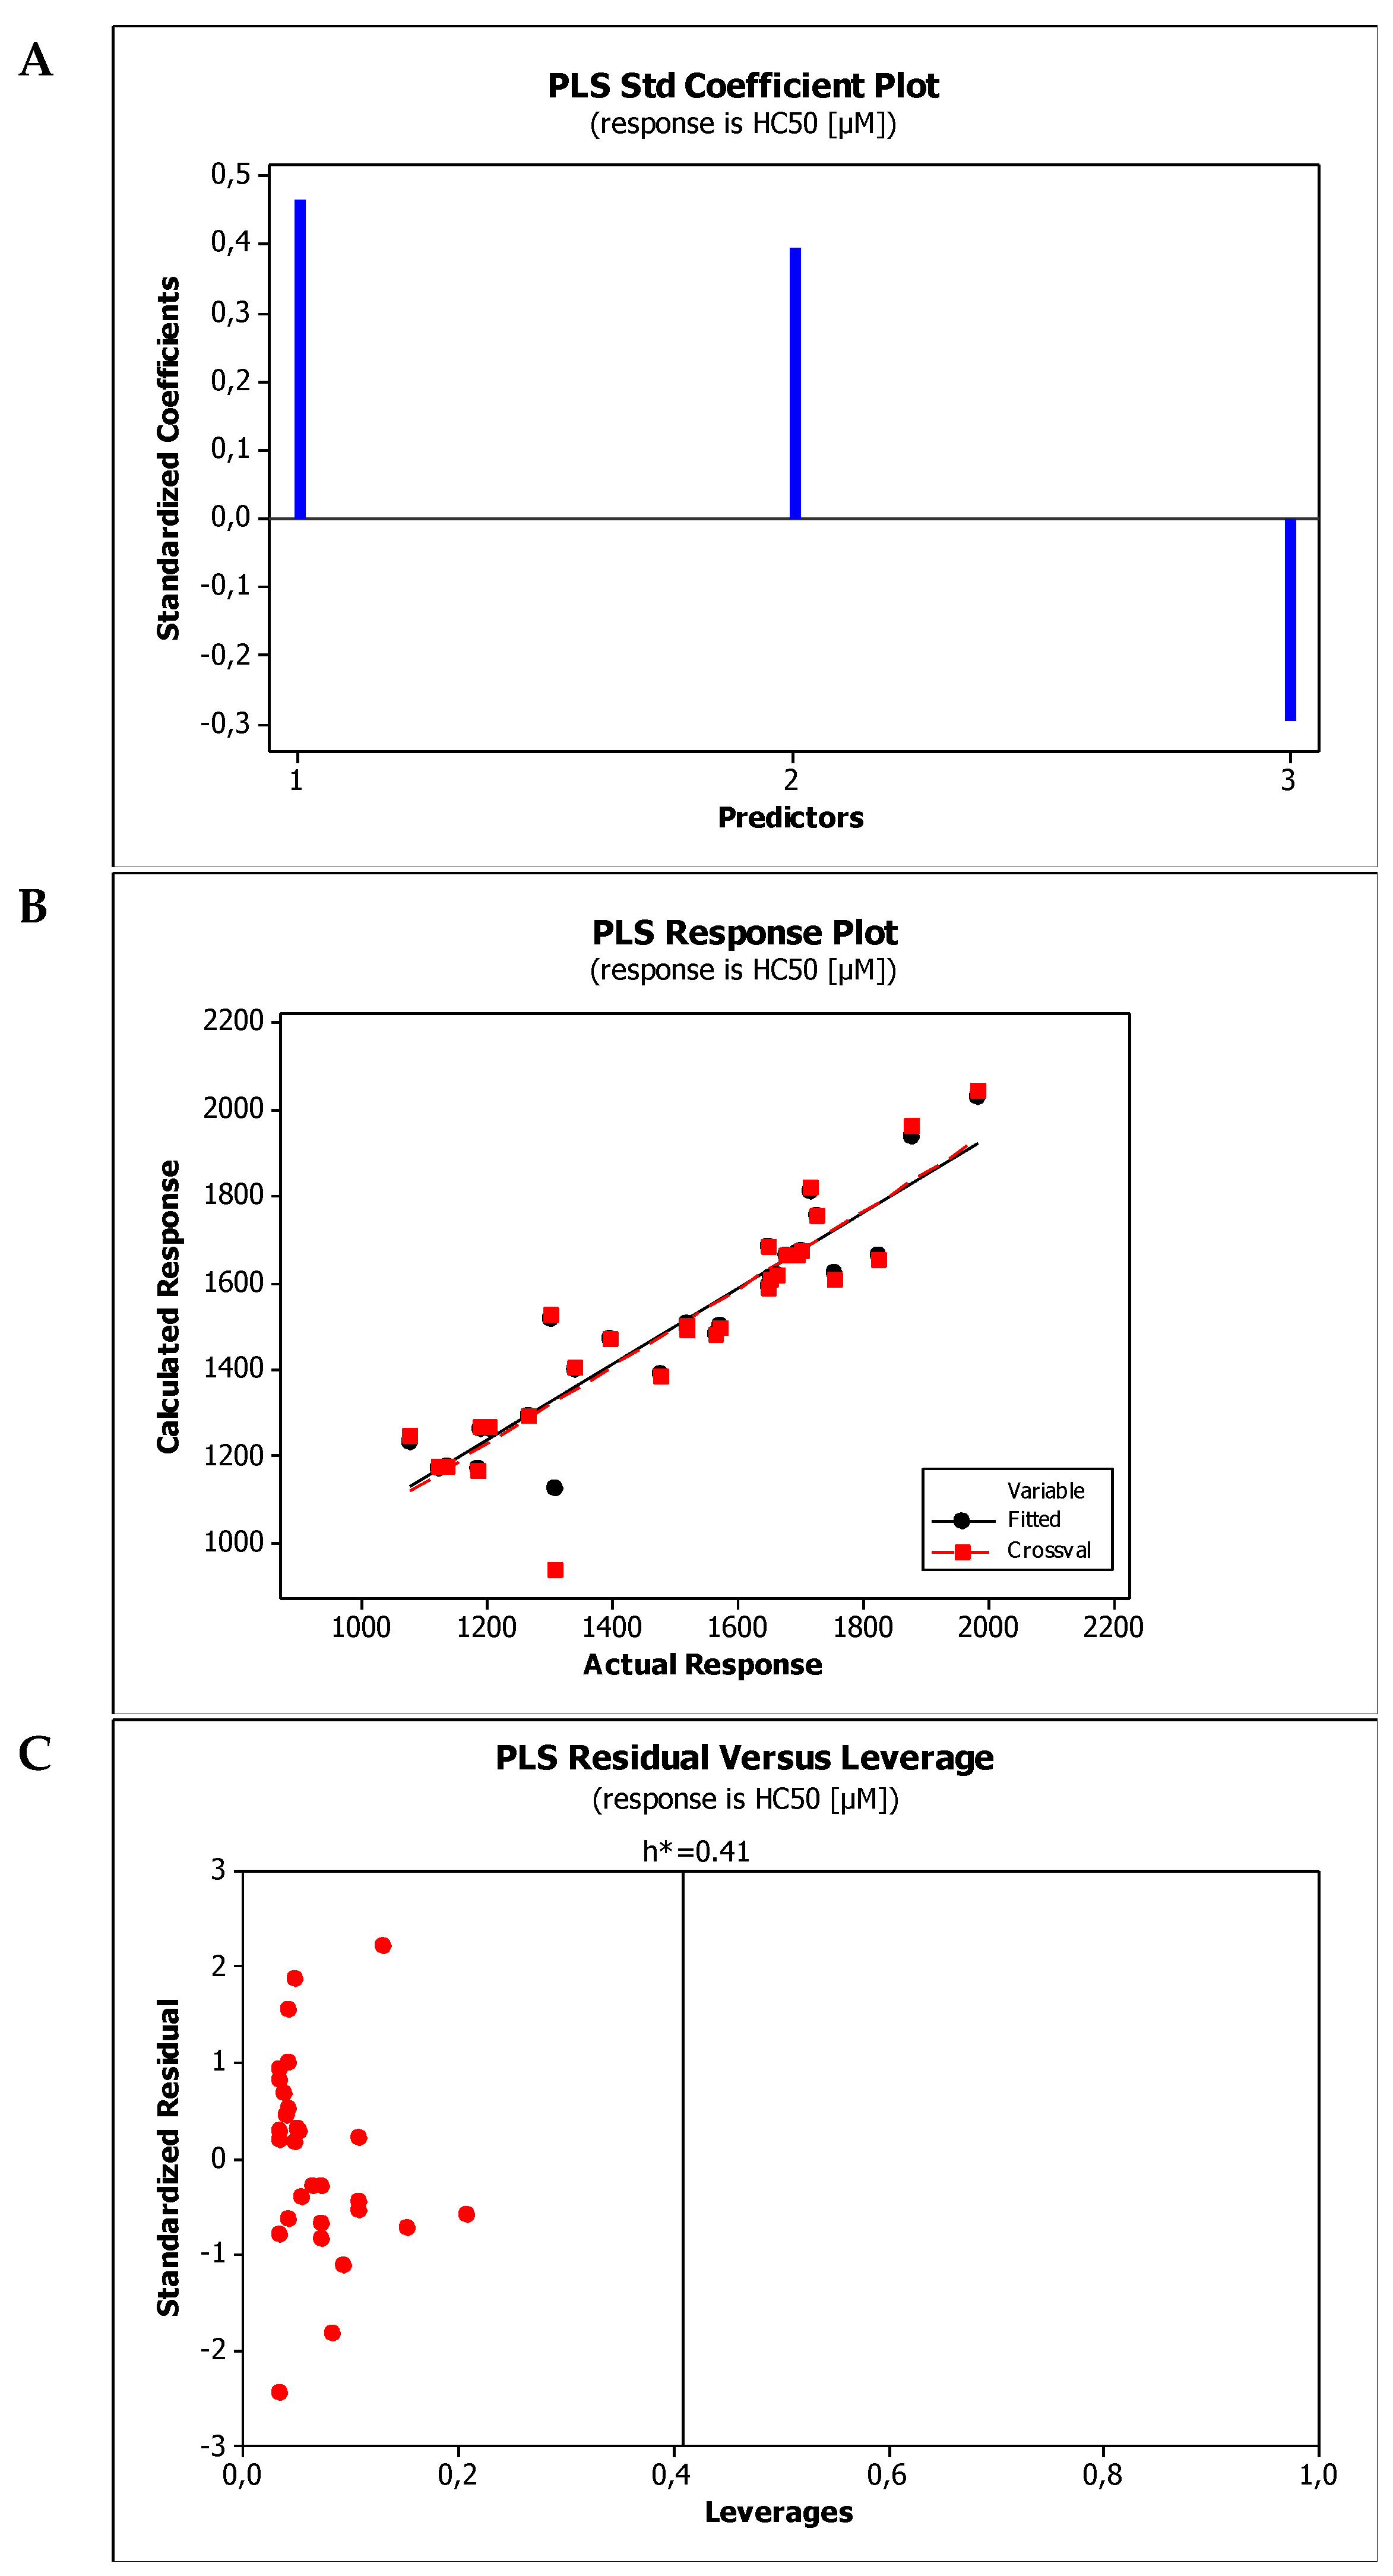
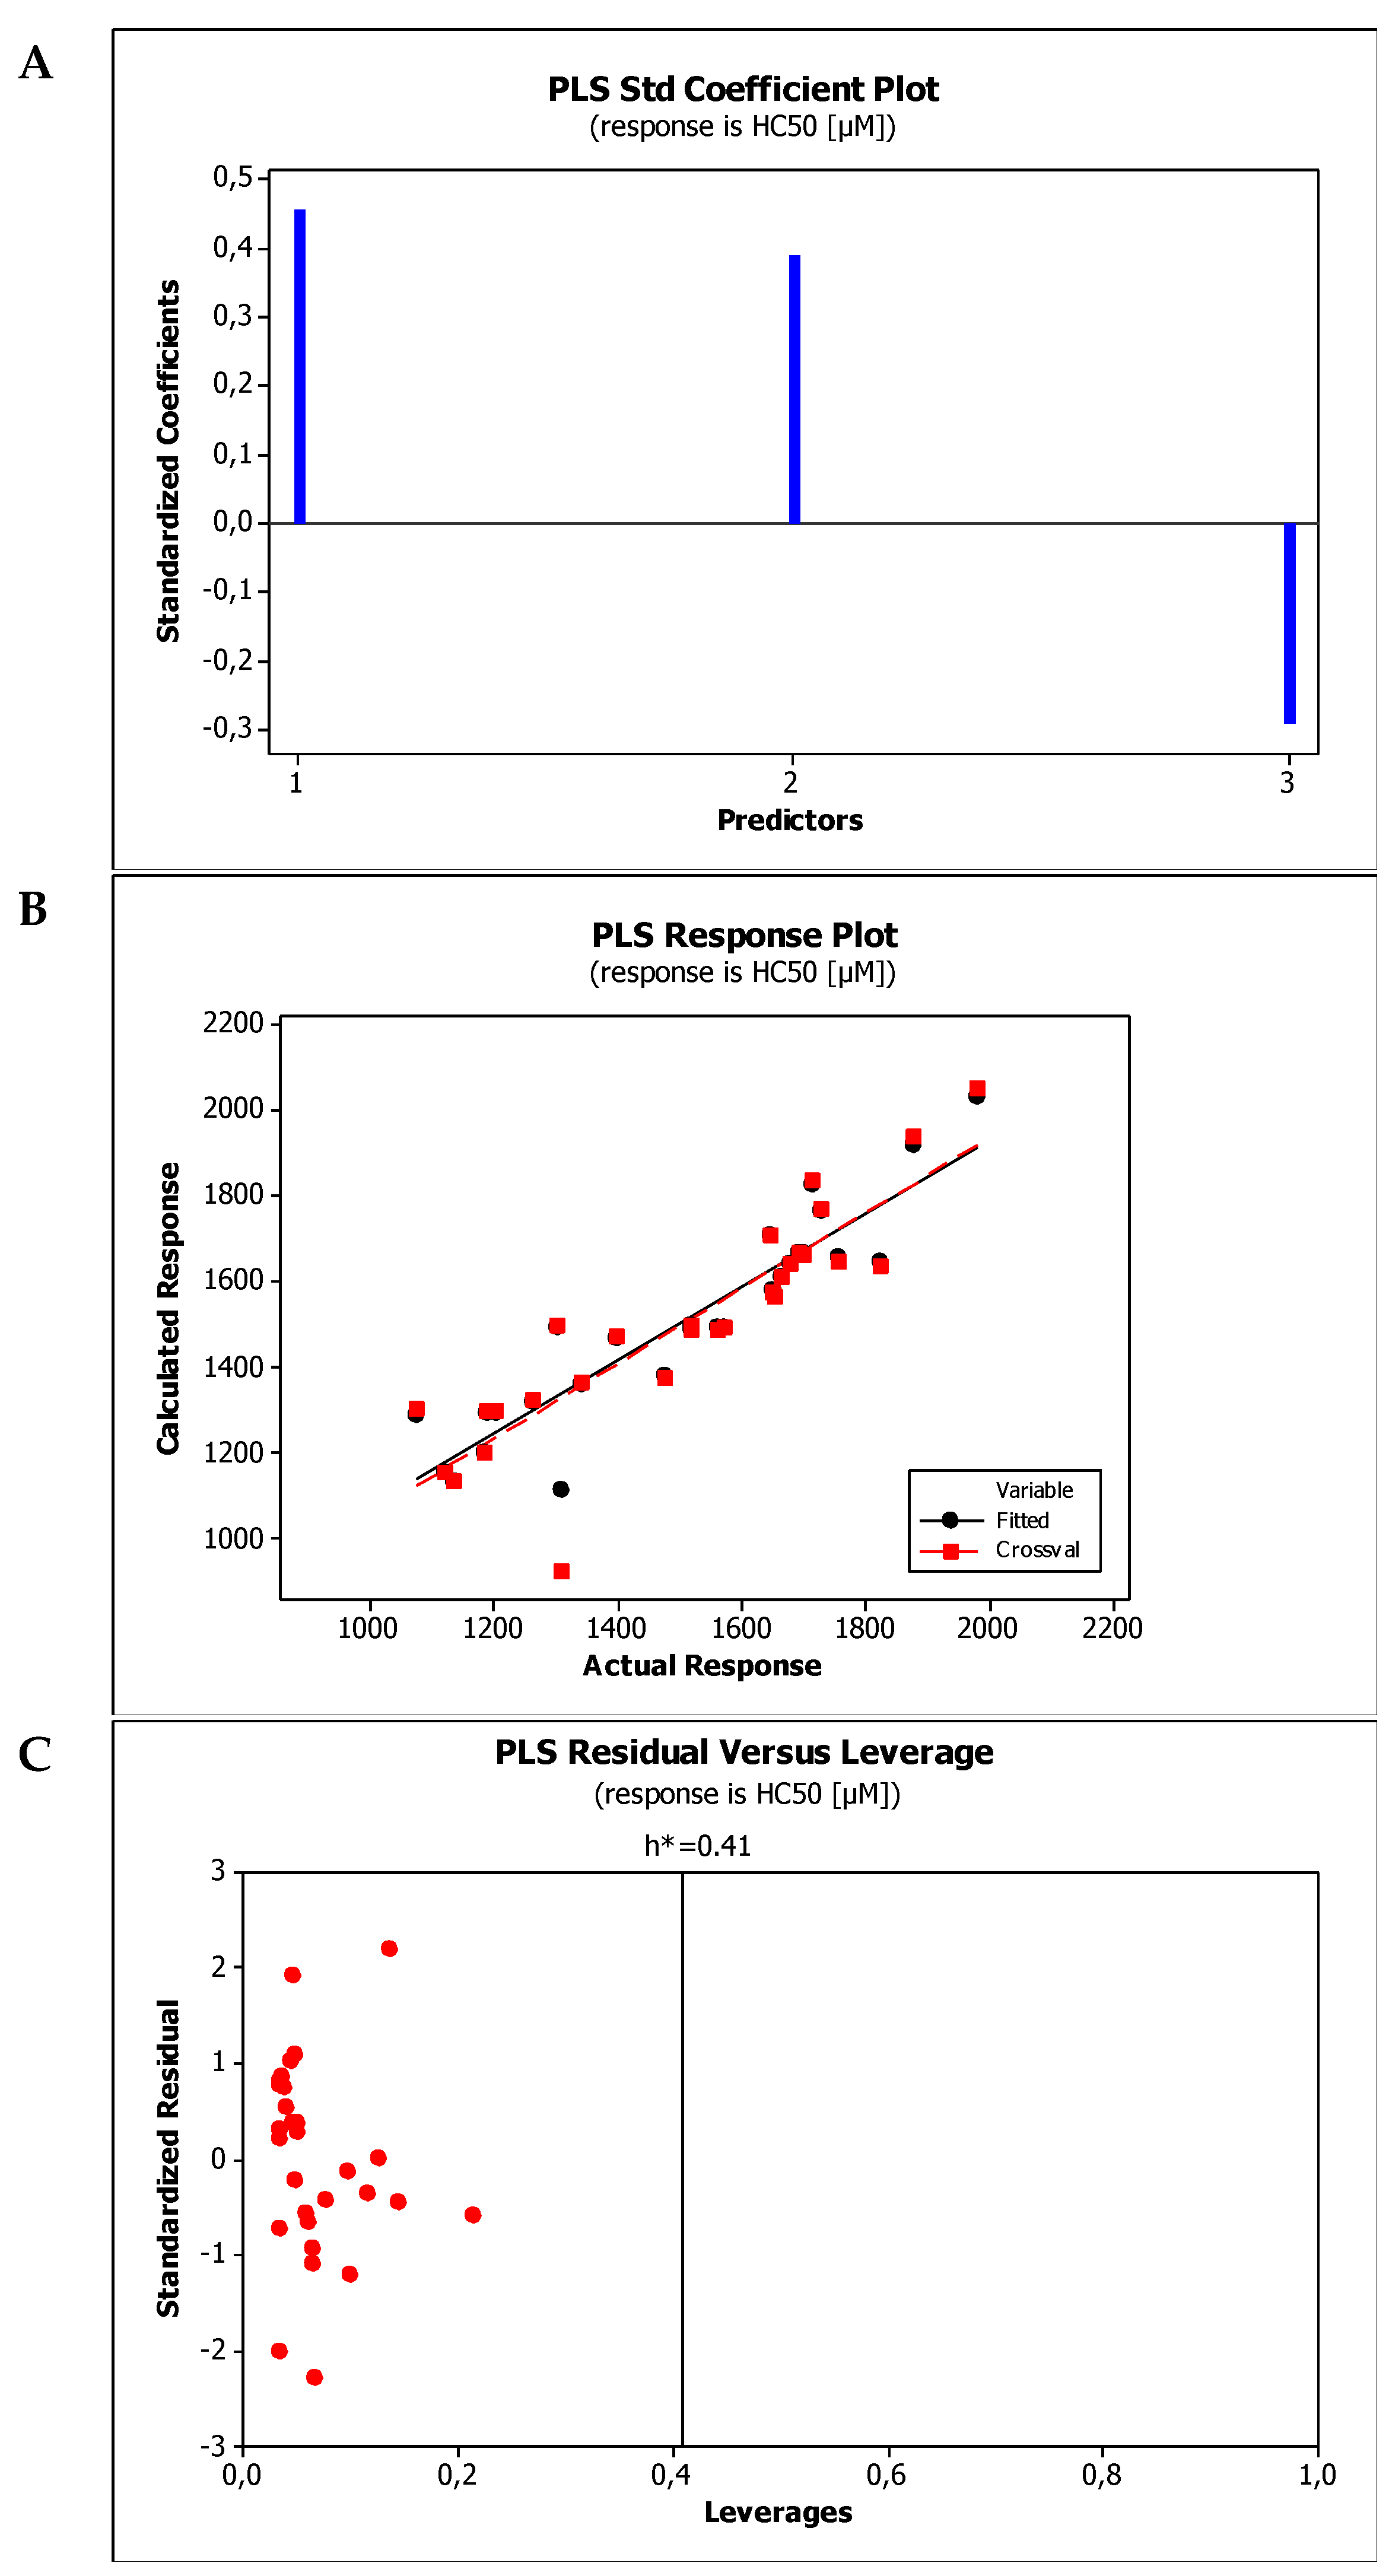
2.4. Establishment of Quantitative Structure Property Relationships
3. Materials and Methods
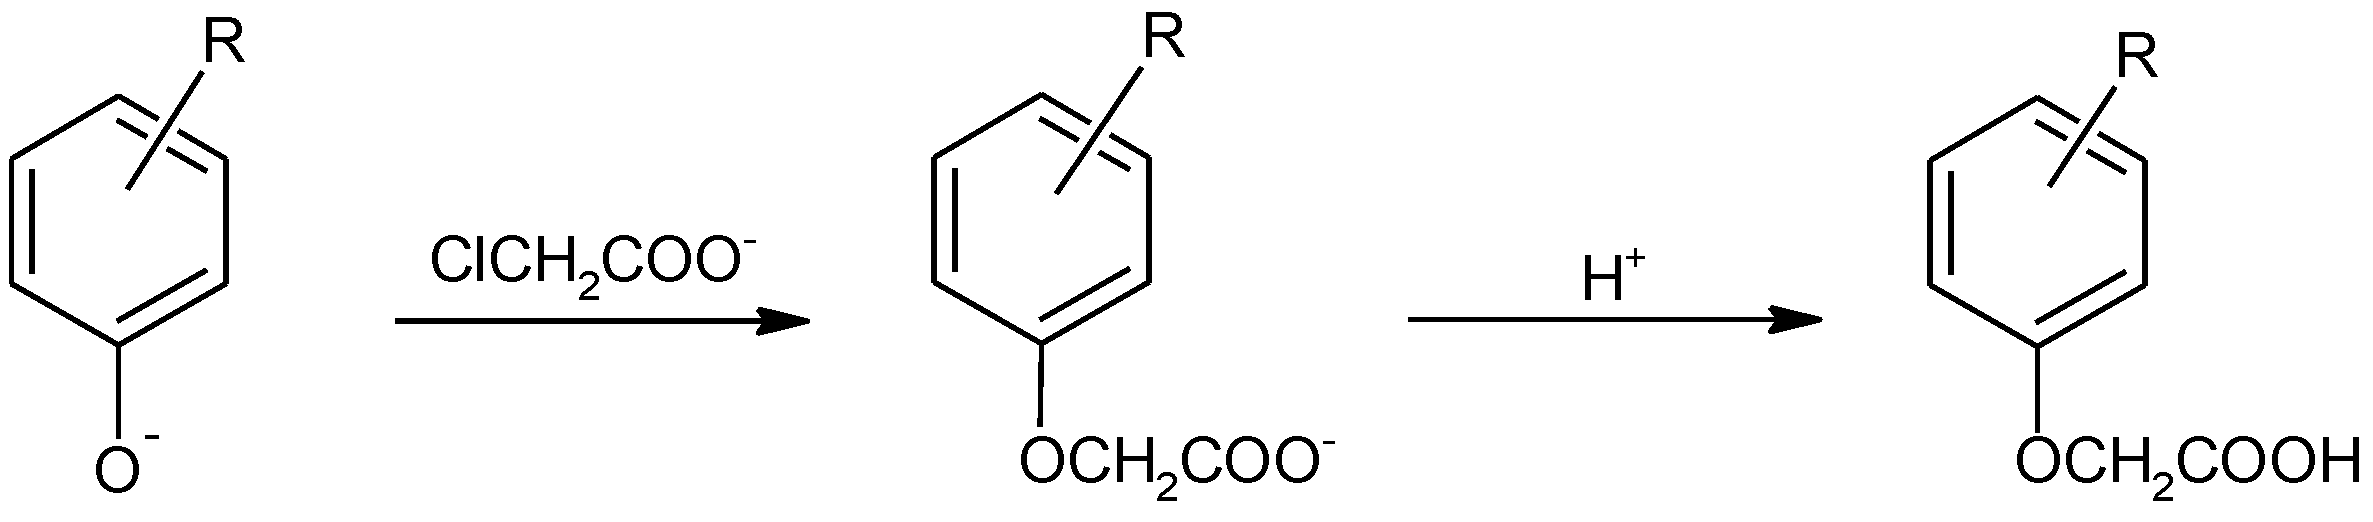
3.1. Herbicides and Herbicide-like Compounds
3.2. Hemolysis Assay
3.3. Chromatographic Measurements
3.4. In Silico Calculations
4. Conclusions
Supplementary Materials
Author Contributions
Funding
Institutional Review Board Statement
Informed Consent Statement
Data Availability Statement
Conflicts of Interest
References
- Jayakody, N.; Harris, E.C.; Coggon, D. Phenoxy herbicides, soft-tissue sarcoma and non-Hodgkin lymphoma: A systematic review of evidence from cohort and case-control studies. Br. Med. Bull. 2015, 114, 75–94. [Google Scholar] [CrossRef] [PubMed]
- Cobb, A.H.; Reade, J.P.H. Herbicides and Plant Physiology; John Wiley & Sons, Harper Adams University College: Shropshire, UK, 2011. [Google Scholar]
- Kleszczyńska, H.; Bonarska, D.; Bielecki, K.; Sarapuk, J. The hemolytic and physiological activities of mixtures of some phenoxy and organophosphorous herbicides. Cell Mol. Biol. Lett. 2003, 8, 55–61. [Google Scholar] [PubMed]
- Yoo-Na, S.; Miyoung, L. Suppressive Effect of Aqueous Extract of Red-Ginseng on the Herbicide-induced DNA Damage and Hemolysis. J. Appl. Biol. Chem. 2010, 53, 202–206. [Google Scholar]
- Çongur, G. Electrochemical investigation of the interaction of 2,4-D and double stranded DNA using pencil graphite electrodes. Turk. J. Chem. 2021, 45, 600–615. [Google Scholar] [CrossRef]
- Stenersen, J. Chemical Pesticides Mode of Action and Toxicology; CRC Press: Boca Raton, FL, USA, 2004. [Google Scholar]
- Seńczuk, W. Toksykologia Współczesna; PZWL Wydawnictwo Lekarskie: Warsaw, Poland, 2022. [Google Scholar]
- Timchalk, C. Comparative inter-species pharmacokinetics of phenoxyacetic acid herbicides and related organic acids. Evidence that the dog is not a relevant species for evaluation of human health risk. Toxicology 2004, 200, 1–19. [Google Scholar] [CrossRef]
- Elliott, B. Review of the genotoxicity of 4-chloro-2-methylphenoxyacetic acid. Mutagenesis 2005, 20, 3–13. [Google Scholar] [CrossRef]
- Loomis, D.; Guyton, K.; Grosse, Y.; El Ghissasi, F.; Bouvard, V.; Benbrahim-Tallaa, L.; Guha, N.; Mattock, H.; Straif, K. Carcinogenicity of lindane, DDT, and 2,4-dichlorophenoxyacetic acid. Lancet Oncol. 2015, 16, 891–892. [Google Scholar] [CrossRef]
- Blachnio, M.; Kusmierek, K.; Swiatkowski, A.; Derylo-Marczewska, A. Adsorption of Phenoxyacetic Herbicides from Water on Carbonaceous and Non-Carbonaceous Adsorbents. Molecules 2023, 28, 5404. [Google Scholar] [CrossRef]
- Kaliszan, R. Quantitative Structure-Chromatographic Retention Relationships; Winefordner, J.D., Ed.; John Wiley & Sons: Hoboken, NJ, USA, 1987. [Google Scholar]
- Valkó, K.L. Physicochemical and Biomimetic Properties in Drug Discovery: Chromatographic Techniques for Lead Optimization; John Wiley & Sons: Hoboken, NJ, USA, 2014. [Google Scholar]
- Tsopelas, F.; Vallianatou, T.; Tsantili-Kakoulidou, A. Recent developments in the application of immobilized artificial membrane (IAM) chromatography to drug discovery. Expert Opin. Drug Discov. 2024, 19, 1087–1098. [Google Scholar] [CrossRef]
- Markuszewski, M.; Kaliszan, R. Quantitative structure-retention relationships in affinity high-performance liquid chromatography. J. Chromatogr. B Analyt. Technol. Biomed. Life Sci. 2002, 768, 55–66. [Google Scholar] [CrossRef]
- De Vrieze, M.; Verzele, D.; Szucs, R.; Sandra, P.; Lynen, F. Evaluation of sphingomyelin, cholester, and phosphatidylcholine-based immobilized artificial membrane liquid chromatography to predict drug penetration across the blood-brain barrier. Anal. Bioanal. Chem. 2014, 406, 6179–6188. [Google Scholar] [CrossRef] [PubMed]
- Héberger, K. Quantitative structure-(chromatographic) retention relationships. J. Chromatogr. A 2007, 1158, 273–305. [Google Scholar] [CrossRef] [PubMed]
- Dobričić, V.; Savić, J.; Nikolic, K.; Vladimirov, S.; Vujić, Z.; Brborić, J. Application of biopartitioning micellar chromatography and QSRR modeling for prediction of gastrointestinal absorption and design of novel β-hydroxy-β-arylalkanoic acids. Eur. J. Pharm. Sci. 2017, 30, 280–284. [Google Scholar] [CrossRef] [PubMed]
- Bukowska, B.; Michałowicz, J.; Wojtaszek, A.; Marczak, A. Comparison of the effect of phenoxyherbicides on human erythrocyte membrane (in vitro). Biologia 2011, 66, 379–385. [Google Scholar] [CrossRef]
- Bukowska, B.; Rychlik, B.; Krokosz, A.; Michałowicz, J. Phenoxyherbicides induce production of free radicals in human erythrocytes: Oxidation of dichlorodihydrofluorescine and dihydrorhodamine 123 by 2,4-D-Na and MCPA-Na. Food Chem. Toxicol. 2008, 46, 359–367. [Google Scholar] [CrossRef]
- Duchowicz, P.; Szczepaniak, P.; Koter, M. Erythrocyte membrane protein damage by phenoxyacetic herbicides. Pest. Biochem. Physiol. 2005, 82, 59–65. [Google Scholar] [CrossRef]
- Duchnowicz, P.; Koter, M.; Duda, W. Damage of erythrocyte by phenoxyacetic herbicides and their metabolites. Pest. Biochem. Physiol. 2002, 74, 1–7. [Google Scholar] [CrossRef]
- Bukowska, B. Toxicity of 2,4-dichlorophenoxyacetic acid—Molecular mechanisms. Pol. J. Environ. Stud. 2006, 15, 365–374. [Google Scholar]
- Suwalsky, M.; Benites, M.; Villena, F.; Aguilar, F.; Sotomayor, C.P. Interaction of 2,4-dichlorophenoxyacetic acid (2,4-D) with cell and model membranes. Biochim. Biophys. Acta 1996, 1285, 267–276. [Google Scholar] [CrossRef]
- Lipinski, C.A.; Lombardo, F.; Dominy, B.W.; Feeney, P.J. Experimental and computational approaches to estimate solubility and permeability in drug discovery and development settings. Adv. Drug Deliv. Rev. 1997, 23, 3–25. [Google Scholar] [CrossRef]
- Ghose, A.K.; Viswanadhan, V.N.; Wendoloski, J.J. A knowledge-based approach in designing combinatorial or medicinal chemistry libraries for drug discovery. 1. A qualitative and quantitative characterization of known drug databases. J. Comb. Chem. 1999, 1, 55–68. [Google Scholar] [CrossRef] [PubMed]
- Clark, D.E. In silico prediction of blood–brain barrier permeation. Drug Discov. Today 2003, 15, 927–933. [Google Scholar] [CrossRef] [PubMed]
- van de Waterbeemd, H.; Camenish, G.; Folkers, G.; Chretien, J.R.; Raevsky, O.A. Estimation of blood-brain barrier crossing of drugs using molecular size and shape, and H-bonding descriptors. J. Drugs Target. 1998, 6, 151–165. [Google Scholar] [CrossRef] [PubMed]
- Kelder, J.; Grootenhuis, P.D.; Bayada, D.M.; Delbressine, L.P.; Ploemen, J.P. Polar molecular surface as dominating determinant for oral absorption and brain penetration of drugs. Pharm. Res. 1999, 16, 1514–1519. [Google Scholar] [CrossRef]
- Kralj, S.; Jukič, M.; Bren, U. Molecular filters in medicinal chemistry. Encyclopedia 2023, 3, 501–511. [Google Scholar] [CrossRef]
- Ajay; Bemis, G.W.; Murcko, M.A. Designing libraries with CNS activity. J. Med. Chem. 1999, 42, 4942–4951. [Google Scholar] [CrossRef]
- Eriksson, L.; Jaworska, J.; Worth, A.P.; Cronin, M.T.; McDowell, R.M.; Gramatica, P. Methods for reliability and uncertainty assessment and for applicability evaluations of classification- and regression-based QSARs. Environ. Health Perspect. 2003, 111, 1361–1375. [Google Scholar] [CrossRef]
- Liu, R.; Sun, H.; So, S.S. Development of quantitative structure-property relationship models for early ADME evaluation in drug discovery. 2. Blood-brain barrier penetration. J. Chem. Inf. Comput. Sci. 2001, 41, 1623–1632. [Google Scholar] [CrossRef]
- Abraham, M.H.; Chadha, H.S.; Mitchell, R.C. Hydrogen bonding. 33. Factors that influence the distribution of solutes between blood and brain. J. Pharm Sci. 1994, 83, 1257–1268. [Google Scholar] [CrossRef]
- Valkó, K.L. Lipophilicity and biomimetic properties measured by HPLC to support drug discovery. J. Pharm. Biomed. Anal. 2016, 130, 35–54. [Google Scholar] [CrossRef]
- Gramatica, P. On the development and validation of QSAR models. In Computational Toxicology; Reisfeld, B., Mayeno, A., Eds.; Methods in Molecular Biology; Humana Press: Totowa, NJ, USA, 2013. [Google Scholar]
- Sahigara, F.; Mansouri, K.; Ballabio, D.; Mauri, A.; Consonni, V.; Todeschini, R. Comparison of different approaches to define the applicability domain of QSAR models. Molecules 2012, 17, 4791–4810. [Google Scholar] [CrossRef] [PubMed]
- Mukaka, M.M. Statistics corner: A guide to appropriate use of correlation coefficient in medical research. Malawi Med. J. 2012, 24, 69–71. [Google Scholar] [PubMed]
- Faramarzi, S.; Kim, M.T.; Volpe, D.A.; Cross, K.P.; Chakravarti, S.; Stavitskaya, L. Development of QSAR models to predict blood-brain barrier permeability. Front. Pharmacol. 2022, 13, 1040838. [Google Scholar] [CrossRef] [PubMed]
- Zeng, R.; Deng, J.; Dang, L.; Yu, X. Correlation between the structure and skin permeability of compounds. Sci. Rep. 2021, 11, 10076. [Google Scholar] [CrossRef]
- Xue, C.X.; Zhang, R.S.; Liu, H.X.; Yao, X.J.; Liu, M.C.; Hu, Z.D.; Fan, B.T. QSAR models for the prediction of binding affinities to human serum albumin using the heuristic method and a support vector machine. J. Chem. Inf. Comput. Sci. 2004, 44, 1693–1700. [Google Scholar] [CrossRef]
- Singh, K.P.; Gupta, S.; Basant, N. In silico prediction of cellular permeability of diverse chemicals using qualitative and quan-titative SAR modeling approaches. Chemom. Intell. Lab. Syst. 2015, 140, 61–72. [Google Scholar] [CrossRef]
- Gupta, S.; Mallik, S. Modelling the water-plant cuticular polymer matrix membrane partitioning of diverse chemicals in multiple plant species using the support vector machine-based QSAR approach. SAR QSAR Environ. Res. 2018, 29, 171–186. [Google Scholar] [CrossRef]
- Veerasamy, R.; Rajak, H.; Jain, A.; Sivadasan, S.; Varghese, C.P.; Agrawal, R.K. Validation of QSAR Models—Strategies and Importance. Int. J. Drug Design Disc. 2011, 2, 511–519. [Google Scholar] [CrossRef]
- Müller, C.; Riederer, M. Plant Surface Properties in Chemical Ecology. J. Chem. Ecol. 2005, 31, 2621–2651. [Google Scholar] [CrossRef]
- Scheler, S.; Fahr, A.; Liu, X. Linear combination methods for prediction of drug skin permeation. ADMET DMPK 2015, 2, 199–220. [Google Scholar] [CrossRef]
- Katritzky, A.R.; Dobchev, D.A.; Fara, D.C.; Hür, E.; Tämm, K.; Kurunczi, L.; Karelson, M.; Varnek, A.; Solov′ev, V.P. Skin permeation rate as a function of chemical structure. J. Med. Chem. 2006, 49, 3305–3314. [Google Scholar] [CrossRef] [PubMed]
- Zhao, Y.H.; Abraham, M.H.; Ibrahim, A.; Fish, P.; Cole, S.; Lewis, M.L.; de Groot, M.J.; Reynolds, D.P. Predicting penetration across the blood-brain barrier from simple descriptors and fragmentation scheme. J. Chem. Inf. Model. 2007, 47, 170–175. [Google Scholar] [CrossRef] [PubMed]
- Winkler, D.A.; Burden, F.R. Modelling blood-brain barrier partitioning using Bayesian neural nets. J. Mol. Graph. Model. 2004, 22, 499–505. [Google Scholar] [CrossRef] [PubMed]
- Young, R.C. Development of a new physicochemical model of brain penetration and its application to the design of centrally acting H2 receptor histamine antagonists. J. Med. Chem. 1988, 31, 656–671. [Google Scholar] [CrossRef]
- Liu, X.; Tu, M.; Kelly, R.S.; Chen, C.; Smith, B.J. Development of the computational approach to predict blood-brain barrier permeability. Drug Metab. Dispos. 2004, 32, 132–139. [Google Scholar] [CrossRef]
- Tandon, H.; Ranjan, P.; Chakraborty, T.; Suhag, V. Polarizability: A promising descriptor to study chemical–biological interactions. Mol. Divers. 2021, 25, 249–262. [Google Scholar] [CrossRef]
- Janicka, M.; Śliwińska, A.; Sztanke, M.; Sztanke, K. Combined Micellar Liquid Chromatography Technique and QSARs Modeling in Predicting the Blood-Brain Barrier Permeation of Heterocyclic Drug-like Compounds. Int. J. Mol. Sci. 2022, 23, 15887. [Google Scholar] [CrossRef]
- Janicka, M.; Sztanke, M.; Sztanke, K. Modeling the Blood-Brain Barrier Permeability of Potential Heterocyclic Drugs via Biomimetic IAM Chromatography Technique Combined with QSAR Methodology. Molecules 2024, 29, 287. [Google Scholar] [CrossRef]
- Harmse, R.; van der Walt, M.M.; Petzer, J.P.; Terre′Blanche, G. Discovery of 1,3-diethyl-7-methyl-8-(phenoxymethyl)-xanthine derivatives as novel adenosine A1 and A2A receptor antagonists. Bioorg Med. Chem Lett. 2016, 26, 5951–5955. [Google Scholar] [CrossRef]
- Han, L.; Zhu, Q.; Jia, J.; Li, Y.; Gao, J. Synthesis and Biological Activity of 2-Aryloxyacetylamino-2-Deoxy-D-Glucoses. Asian J. Chem. 2012, 24, 1223–1226. [Google Scholar]
- Buckles, R.E.; Wawzonek, S. Small scale synthesis of 2,4-dichlorophenoxyacetic acid. J. Chem. Educ. 1948, 25, 514. [Google Scholar] [CrossRef]
- Sztanke, K.; Tuzimski, T.; Rzymowska, J.; Pasternak, K.; Kandefer-Szerszeń, M. Synthesis, determination of the lipophilicity, anticancer and antimicrobial properties of some fused 1,2,4-triazole derivatives. Eur. J. Med. Chem. 2008, 43, 404–419. [Google Scholar] [CrossRef] [PubMed]
- Finney, D.J. Probit analysis. J. Inst. Actuar. 1952, 78, 388–390. [Google Scholar]


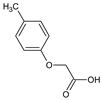 2-(4-Methylphenoxy)acetic acid (1) |  2-(4-Ethylphenoxy)acetic acid (2) |  2-(4-Isopropylphenoxy)acetic acid (3) | |
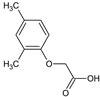 2-(2,4-Dimethylphenoxy)acetic acid (4) | 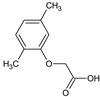 2-(2,5-Dimethylphenoxy)acetic acid (5) | 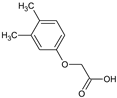 2-(3,4-Dimethylphenoxy)acetic acid (6) | |
 2-(2-Methoxyphenoxy)acetic acid (7) | 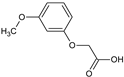 2-(3-Methoxyphenoxy)acetic acid (8) | 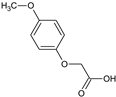 2-(4-Methoxyphenoxy)acetic acid (9) | |
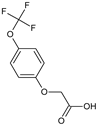 2-[4-(Trifluoromethoxy)phenoxy]acetic acid (10) | 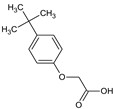 2-(4-Tert-butylphenoxy)acetic acid (11) |  2-(2,4-Di-tert-pentylphenoxy)acetic acid (12) | |
 2-(4-Bromophenoxy)acetic acid (13) |  2-(2,4-Dibromophenoxy)acetic acid (14) |  2-(2-Chlorophenoxy)acetic acid (15) | |
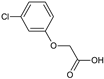 2-(3-Chlorophenoxy)acetic acid (16) |  2-(4-Chloro-2-methylphenoxy)acetic acid, CMPA (17) | 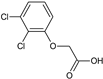 2-(2,3-Dichlorophenoxy)acetic acid (18) | |
 2-(2,4-Dichlorophenoxy)acetic acid, 2,4-D (19) |  2-(2,4,5-Trichlorophenoxy)acetic acid, 2,4,5-T (20) |  2-(2,4,6-Trichlorophenoxy)acetic acid (21) | |
 2-(4-Fluorophenoxy)acetic acid (22) |  2-(4-Iodophenoxy)acetic acid (23) |  2-(4-Hydroxyphenoxy)acetic acid (24) | |
 2-[4-(Hydroxymethyl)phenoxy]acetic acid (25) |  2-(2-Nitrophenoxy)acetic acid (26) | 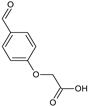 2-(4-Formylphenoxy)acetic acid (27) | |
 2-(4-Acetylphenoxy)acetic acid (28) | 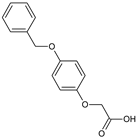 2-[4-(Benzyloxy)phenoxy]acetic acid (29) | ||
| No. | HC50 (µM) | No. | HC50 (µM) | No. | HC50 (µM) |
|---|---|---|---|---|---|
| 1 | 1477 ± 32.5 | 11 | 1826 ± 12.2 | 21 | 1728 ± 27.1 |
| 2 | 1572 ± 88.7 | 12 | 1982 ± 53.6 | 22 | 1342 ± 42.0 |
| 3 | 1650 ± 31.4 | 13 | 1678 ± 54.7 | 23 | 1757 ± 48.6 |
| 4 | 1520 ± 85.8 | 14 | 1878 ± 25.5 | 24 | 1136 ± 41.8 |
| 5 | 1520 ± 93.6 | 15 | 1398 ± 96.6 | 25 | 1124 ± 11.0 |
| 6 | 1564 ± 46.1 | 16 | 1302 ± 47.6 | 26 | 1309 ± 50.1 |
| 7 | 1078 ± 20.8 | 17 | 1665 ± 35.1 | 27 | 1188 ± 55.3 |
| 8 | 1205 ± 15.9 | 18 | 1695 ± 45.8 | 28 | 1266 ± 41.4 |
| 9 | 1190 ± 30.4 | 19 | 1701 ± 38.0 | 29 | 1649 ± 80.7 |
| 10 | 1654 ± 39.2 | 20 | 1716 ± 27.7 |
| No. | MW [g mol−1] | TPSA [Å2] | α [Å3] | HBD | HBA | NRB | pKa | log Po/w | log Pw/pc | log Kp | log Pw/HSA | log BB | log kBMC | log kw,IAM |
|---|---|---|---|---|---|---|---|---|---|---|---|---|---|---|
| 1 | 166.17 | 46.53 | 17.42 | 1 | 3 | 3 | 3.22 | 1.853 | 1.559 | −5.399 | −0.177 | −0.244 | 0.234 | −0.363 |
| 2 | 180.20 | 46.53 | 19.30 | 1 | 3 | 3 | 3.21 | 2.390 | 2.110 | −5.075 | 0.051 | −0.118 | 0.572 | 0.156 |
| 3 | 194.23 | 46.53 | 21.14 | 1 | 3 | 3 | 3.21 | 2.805 | 2.548 | −4.838 | 0.232 | 0.001 | 0.817 | 0.486 |
| 4 | 180.20 | 46.53 | 19.34 | 1 | 3 | 4 | 3.27 | 2.470 | 2.153 | −5.050 | 0.097 | −0.052 | 0.583 | 0.178 |
| 5 | 180.20 | 46.53 | 19.34 | 1 | 3 | 4 | 3.23 | 2.470 | 2.153 | −5.050 | 0.097 | −0.052 | 0.543 | 0.120 |
| 6 | 180.20 | 46.53 | 19.34 | 1 | 3 | 4 | 3.23 | 2.470 | 2.153 | −5.050 | 0.097 | −0.052 | 0.489 | 0.134 |
| 7 | 182.17 | 55.76 | 18.16 | 1 | 4 | 5 | 3.21 | 0.684 | 0.563 | −6.284 | −0.735 | −0.830 | −0.160 | −0.526 |
| 8 | 182.17 | 55.76 | 18.16 | 1 | 4 | 4 | 3.14 | 1.387 | 1.087 | −5.812 | −0.431 | −0.417 | −0.030 | −0.508 |
| 9 | 182.17 | 55.76 | 18.16 | 1 | 4 | 7 | 3.24 | 1.183 | 0.919 | −5.953 | −0.508 | −0.470 | −0.030 | −0.508 |
| 10 | 236.14 | 55.76 | 18.34 | 1 | 4 | 3 | 3.05 | 1.742 | 1.432 | −5.383 | −0.440 | −0.367 | 0.937 | 0.466 |
| 11 | 208.25 | 46.53 | 22.80 | 1 | 3 | 3 | 3.22 | 3.379 | 3.060 | −4.518 | 0.434 | 0.149 | 0.981 | 0.700 |
| 12 | 292.41 | 46.53 | 33.76 | 1 | 3 | 3 | 3.27 | 6.535 | 6.201 | −2.679 | 1.741 | 0.956 | 1.670 | 1.850 |
| 13 | 231.04 | 46.53 | 18.56 | 1 | 3 | 3 | 3.09 | 1.928 | 1.815 | −5.441 | 0.062 | −0.277 | 0.721 | 0.302 |
| 14 | 309.94 | 46.53 | 21.61 | 1 | 3 | 3 | 2.98 | 2.843 | 2.897 | −4.931 | 0.667 | −0.064 | 1.070 | 0.827 |
| 15 | 186.59 | 46.53 | 17.45 | 1 | 3 | 3 | 3.07 | 1.760 | 1.530 | −5.488 | −0.156 | −0.327 | 0.351 | −0.137 |
| 16 | 186.59 | 46.53 | 17.45 | 1 | 3 | 3 | 3.08 | 1.920 | 1.743 | −5.328 | −0.050 | −0.274 | 0.567 | 0.024 |
| 17 | 200.62 | 46.53 | 19.37 | 1 | 3 | 3 | 3.14 | 2.323 | 2.123 | −5.156 | 0.124 | −0.152 | 0.872 | 0.598 |
| 18 | 221.04 | 46.53 | 19.39 | 1 | 3 | 3 | 2.96 | 2.457 | 2.331 | −5.042 | 0.245 | −0.177 | 0.856 | 0.620 |
| 19 | 221.04 | 46.53 | 19.39 | 1 | 3 | 3 | 2.98 | 2.413 | 2.335 | −5.053 | 0.254 | −0.184 | 0.892 | 0.608 |
| 20 | 255.48 | 46.53 | 21.33 | 1 | 3 | 3 | 2.88 | 3.118 | 3.171 | −4.592 | 0.673 | −0.048 | 1.114 | 1.094 |
| 21 | 255.48 | 46.53 | 21.33 | 1 | 3 | 3 | 2.87 | 3.007 | 3.022 | −4.704 | 0.609 | −0.055 | 0.855 | 0.715 |
| 22 | 170.14 | 46.53 | 15.51 | 1 | 3 | 4 | 3.13 | 1.274 | 1.038 | −5.665 | −0.457 | −0.437 | 0.222 | −0.554 |
| 23 | 278.04 | 46.53 | 20.63 | 1 | 3 | 4 | 3.08 | 2.287 | 2.218 | −5.372 | 0.390 | −0.123 | 0.011 | −0.376 |
| 24 | 168.15 | 66.76 | 16.26 | 2 | 4 | 4 | 3.27 | 0.424 | -0.080 | −6.768 | −0.668 | −0.956 | −0.274 | −1.298 |
| 25 | 182.17 | 66.76 | 18.07 | 2 | 4 | 4 | 3.15 | 0.582 | 0.000 | −6.758 | −0.726 | −0.735 | −0.443 | −1.393 |
| 26 | 197.14 | 95.36 | 18.11 | 1 | 6 | 6 | 2.91 | 1.121 | 1.173 | −5.942 | −0.338 | −0.704 | 0.153 | −0.502 |
| 27 | 180.16 | 63.60 | 18.19 | 1 | 4 | 3 | 3.04 | 0.459 | 0.343 | −6.517 | −0.733 | −0.804 | −0.422 | −1.079 |
| 28 | 194.18 | 63.60 | 19.49 | 1 | 4 | 3 | 3.01 | 1.014 | 0.824 | −6.223 | −0.538 | −0.649 | −0.041 | −0.526 |
| 29 | 258.27 | 55.76 | 27.87 | 1 | 4 | 3 | 3.24 | 3.020 | 3.077 | −5.112 | 0.606 | −0.125 | 1.002 | 0.996 |
| Model No. | Model |
|---|---|
| M1 | log Pw/pc = −0.809(±0.510) + 0.953(±0.179)log kBMC + 0.191(±0.022)α − 0.339(±0.091)(HBD + HBA) |
| M2 | log Pw/pc = −0.149(±0.540) + 0.747(±0.151)log kw,IAM + 0.170(±0.027)α − 0.304(±0.100)(HBD + HBA) |
| M3 | log BB = −0.385(±0.241) + 0.131(±0.068)log kw,IAM + 0.050(±0.011)α − 0.198(±0.045)(HBD + HBA) |
| M4 | log Kp = −6.121(±0.438) + 0.764(±0.153)log kBMC + 0.084(±0.019)α − 0.283(±0.078)(HBD + HBA) |
| M5 | log Kp = −5.610(±0.478) + 0.572(±0.134)log kw,IAM + 0.071(±0.024)α − 0.267(±0.086)(HBD + HBA) |
| M6 | log Pw/HSA = −0.8375(±0.336) + 0.308(±0.094)log kBMC + 0.076(±0.016)α − 0.150(±0.062)(HBD + HBA) |
| M7 | HC50 = 1189.68(±141.15) + 263.29(±48.84)log kBMC + 2.27(±0.57)MW − 82.71(±29.30)HBA |
| M8 | HC50 = 1351.34(±157.04) + 179.72 (±38.62)log kw,IAM + 2.14(±0.66)MW − 88.82(±31.46)HBA |
| Model No. | R2 | R2adj | R2pred | PRESS | VIF * | SS | MSE | SD | Q2cv | PRESScv |
|---|---|---|---|---|---|---|---|---|---|---|
| M1 | 0.9428 | 0.9419 | 0.8692 | 5.56762 | <2.8 | 40.3664 | 0.0883 | 0.2971 | 0.9481 | 5.56762 |
| M2 | 0.9439 | 0.9372 | 0.8514 | 6.32727 | <3.8 | 40.1859 | 0.0955 | 0.3090 | 0.9439 | 6.32727 |
| M3 | 0.8765 | 0.8617 | 0.7433 | 0.98749 | <3.8 | 3.37173 | 0.01900 | 0.1378 | 0.8765 | 0.98750 |
| M4 | 0.9094 | 0.8985 | 0.7658 | 4.19807 | <2.8 | 16.3026 | 0.06498 | 0.2549 | 0.9094 | 4.19807 |
| M5 | 0.8956 | 0.8831 | 0.7126 | 5.15174 | <3.8 | 16.0554 | 0.07487 | 0.2736 | 0.8956 | 5.15174 |
| M6 | 0.8924 | 0.8795 | 0.8066 | 1.66068 | <3.8 | 7.66453 | 0.03697 | 0.1923 | 0.8975 | 1.62810 |
| M7 | 0.8818 | 0.8676 | 0.7487 | 441,915 | <2.2 | 1,550,450 | 8312 | 91.1712 | 0.8818 | 441,915 |
| M8 | 0.8630 | 0.8466 | 0.7371 | 462,177 | <2.5 | 240,817 | 9633 | 98.1462 | 0.8630 | 462,177 |
Disclaimer/Publisher’s Note: The statements, opinions and data contained in all publications are solely those of the individual author(s) and contributor(s) and not of MDPI and/or the editor(s). MDPI and/or the editor(s) disclaim responsibility for any injury to people or property resulting from any ideas, methods, instructions or products referred to in the content. |
© 2025 by the authors. Licensee MDPI, Basel, Switzerland. This article is an open access article distributed under the terms and conditions of the Creative Commons Attribution (CC BY) license (https://creativecommons.org/licenses/by/4.0/).
Share and Cite
Janicka, M.; Sztanke, M.; Sztanke, K. Biomimetic Chromatography/QSAR Investigations in Modeling Properties Influencing the Biological Efficacy of Phenoxyacetic Acid-Derived Congeners. Molecules 2025, 30, 688. https://doi.org/10.3390/molecules30030688
Janicka M, Sztanke M, Sztanke K. Biomimetic Chromatography/QSAR Investigations in Modeling Properties Influencing the Biological Efficacy of Phenoxyacetic Acid-Derived Congeners. Molecules. 2025; 30(3):688. https://doi.org/10.3390/molecules30030688
Chicago/Turabian StyleJanicka, Małgorzata, Małgorzata Sztanke, and Krzysztof Sztanke. 2025. "Biomimetic Chromatography/QSAR Investigations in Modeling Properties Influencing the Biological Efficacy of Phenoxyacetic Acid-Derived Congeners" Molecules 30, no. 3: 688. https://doi.org/10.3390/molecules30030688
APA StyleJanicka, M., Sztanke, M., & Sztanke, K. (2025). Biomimetic Chromatography/QSAR Investigations in Modeling Properties Influencing the Biological Efficacy of Phenoxyacetic Acid-Derived Congeners. Molecules, 30(3), 688. https://doi.org/10.3390/molecules30030688