
Solubility and Diffusion of Main Biogas Components in a Glassy Polysulfone-Based Membrane

 , ,
, ,
Abstract

1. Introduction
2. Results and Discussion
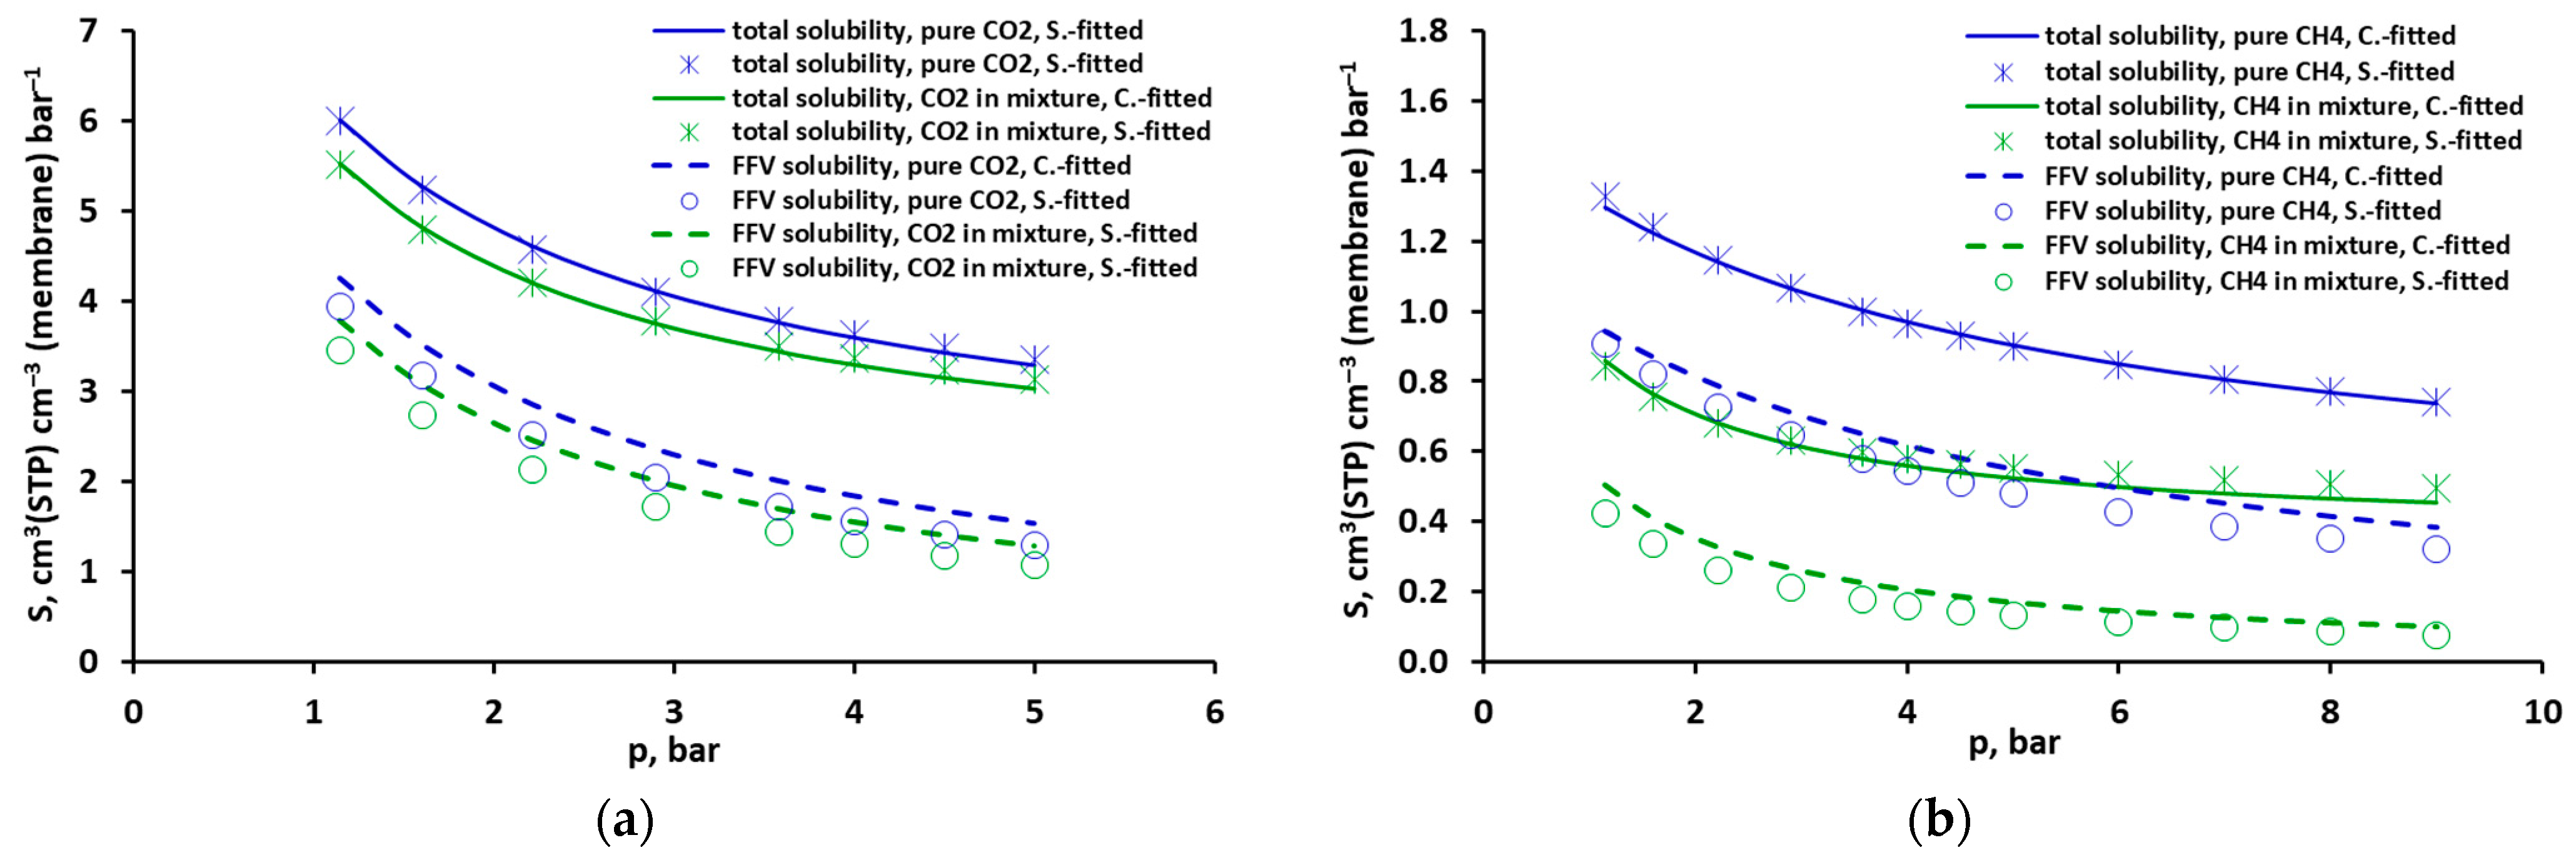
2.1. Solubility of Pure CO2, CH4 and Their Mixtures
2.2. Solubility of Pure CO2, CH4 and Their Mixtures According to DMS Model
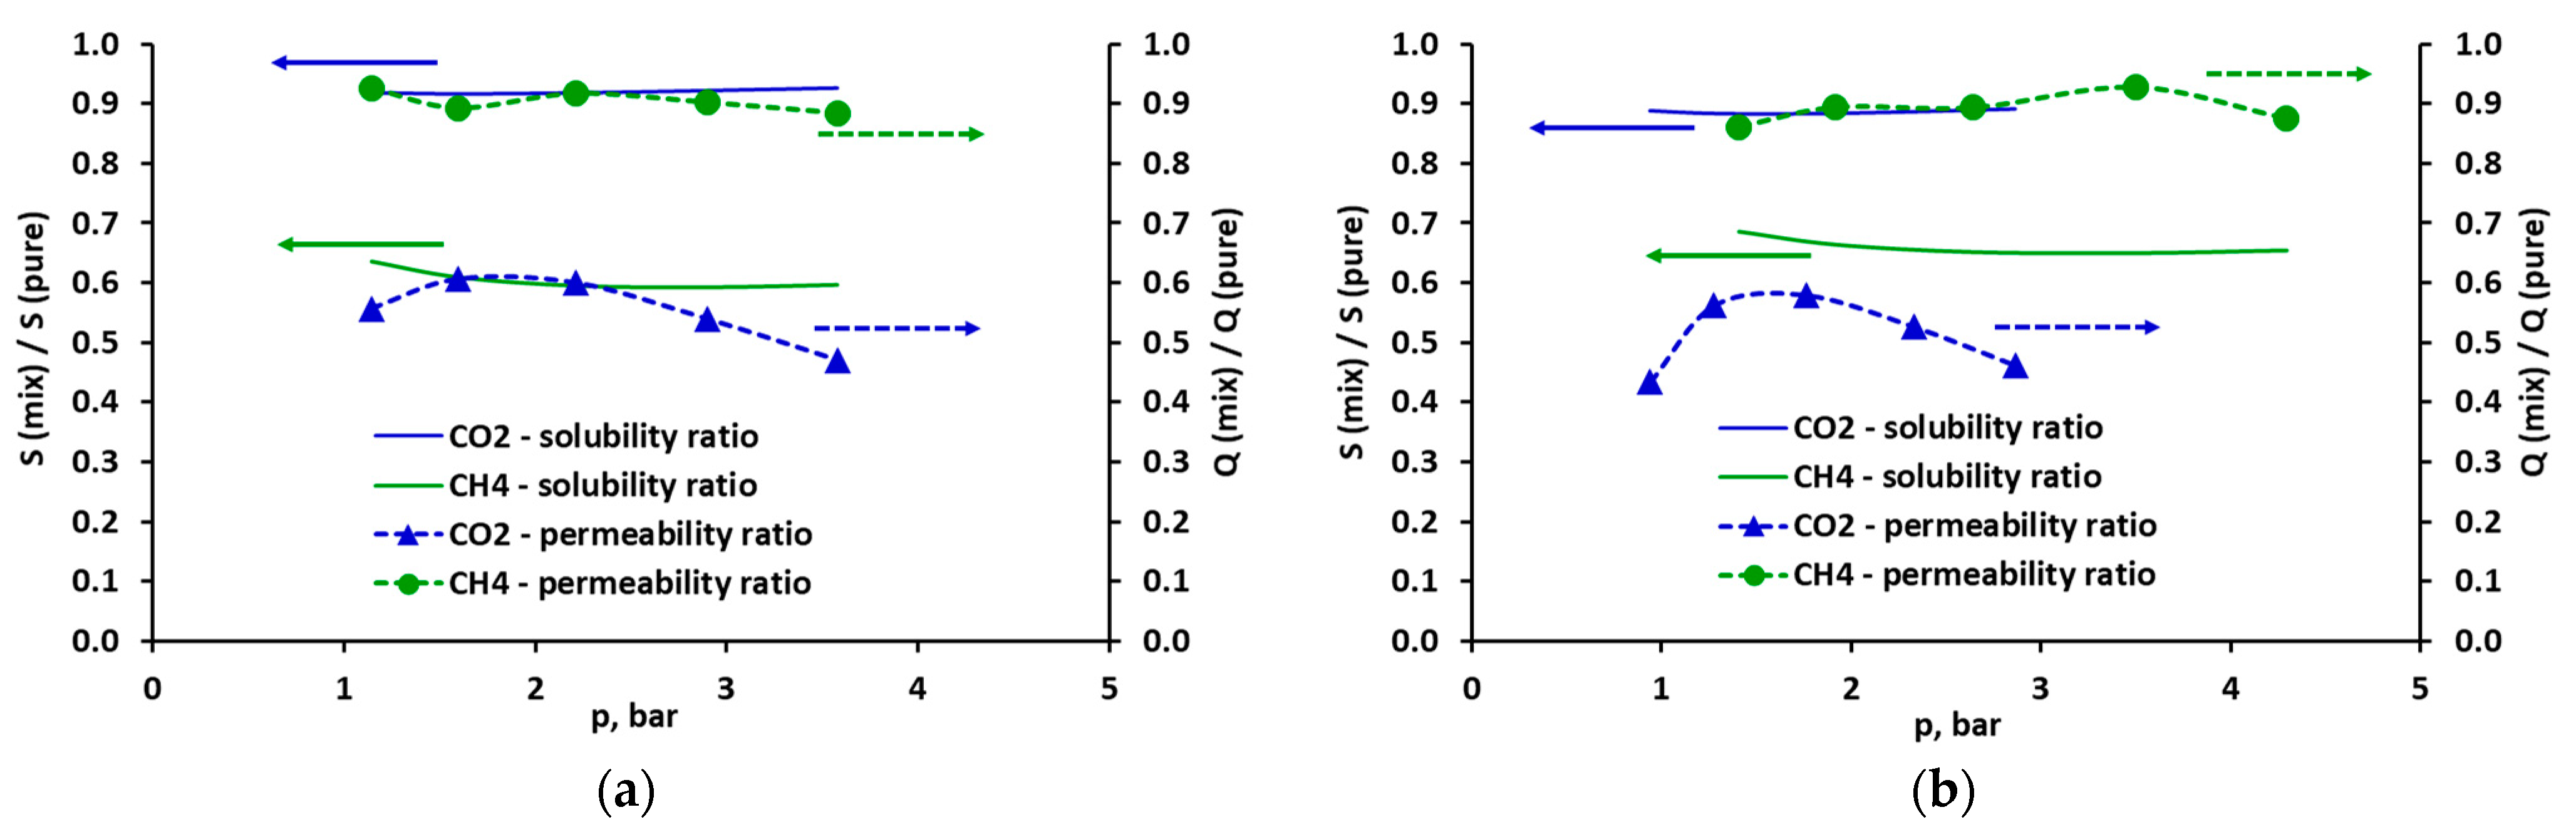
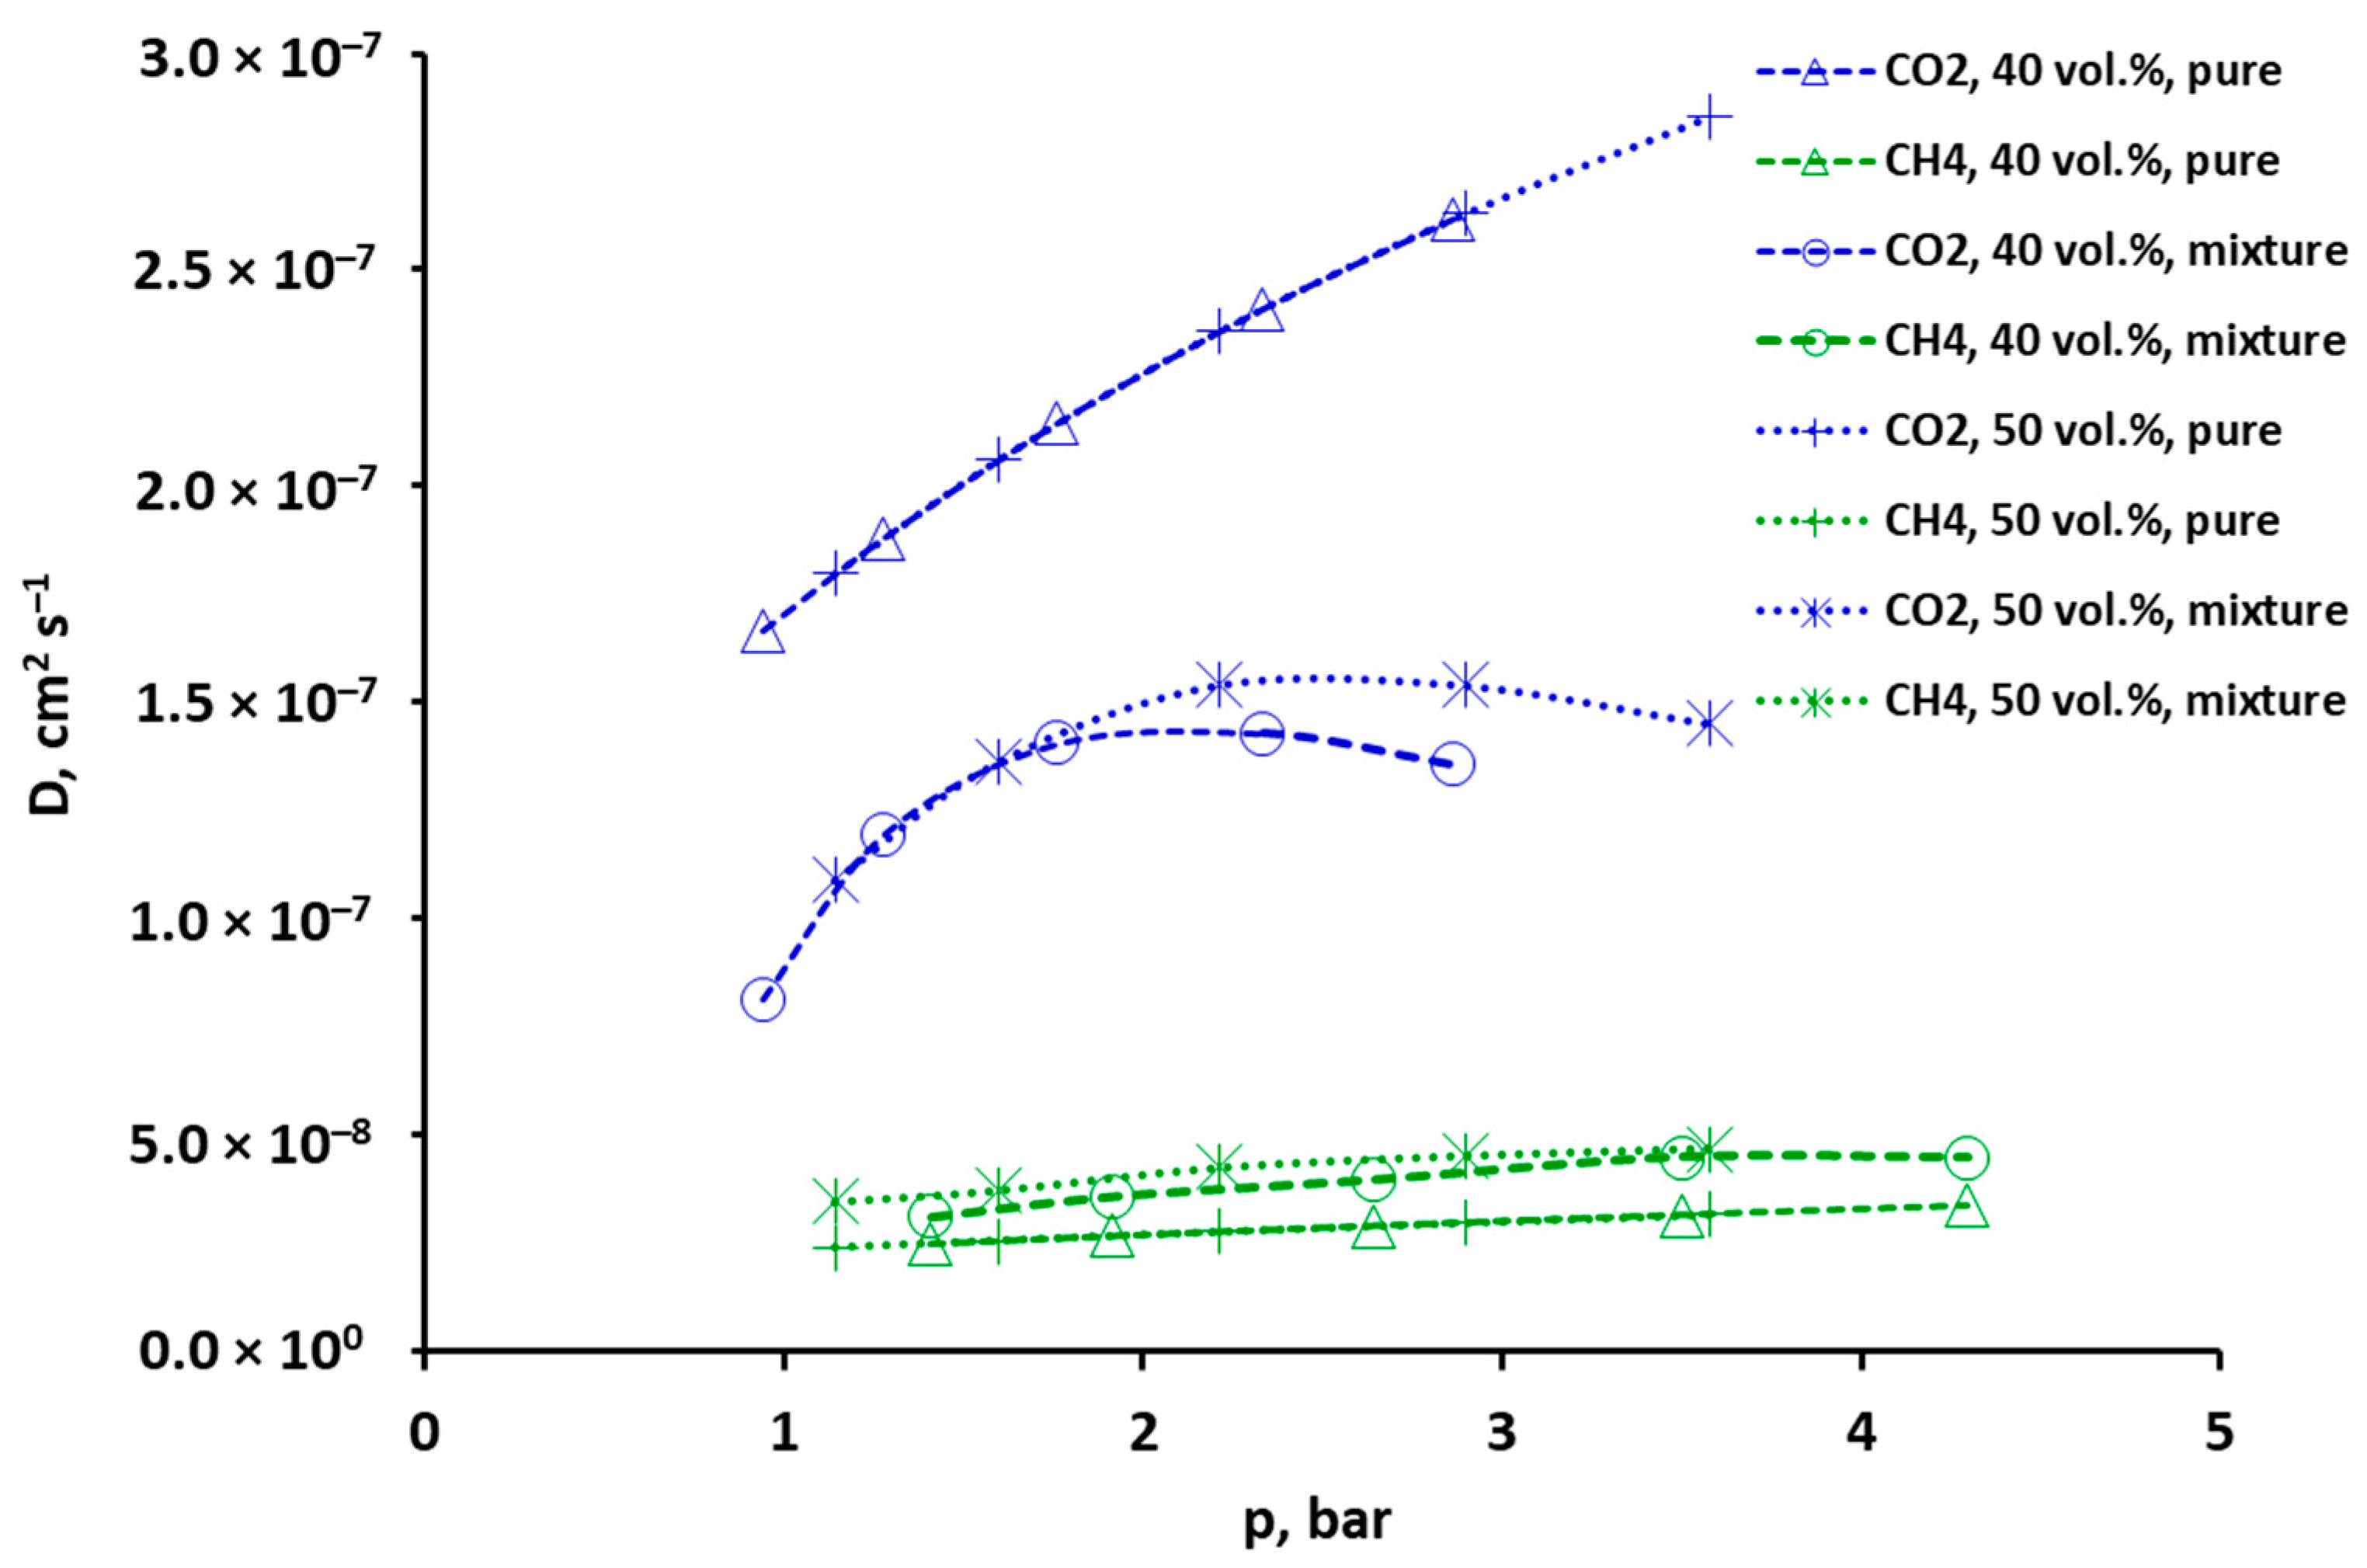
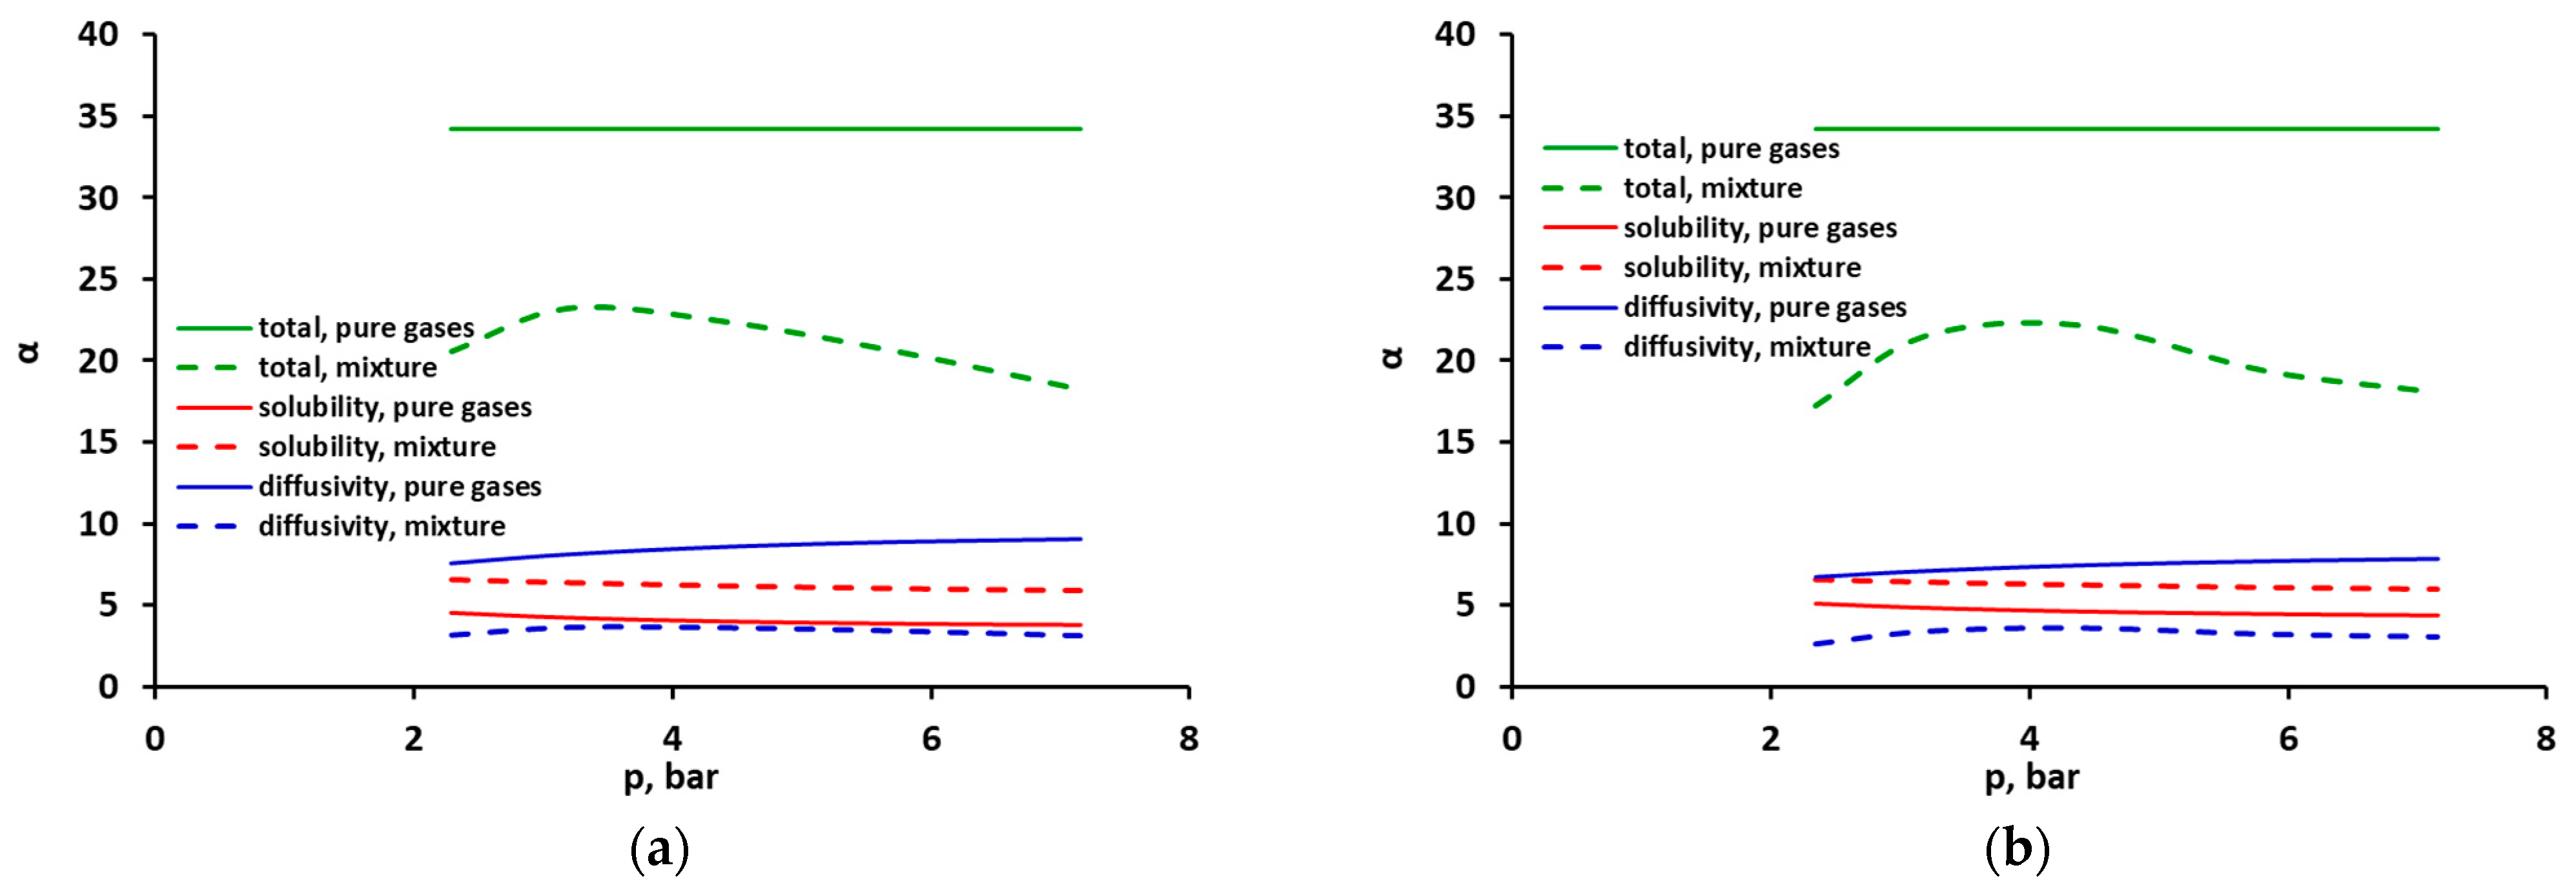
2.3. Selectivity and Diffusivity of Pure CO2, CH4 and Their Mixtures
3. Materials, Methods and Model
3.1. Membrane Sample and Gases
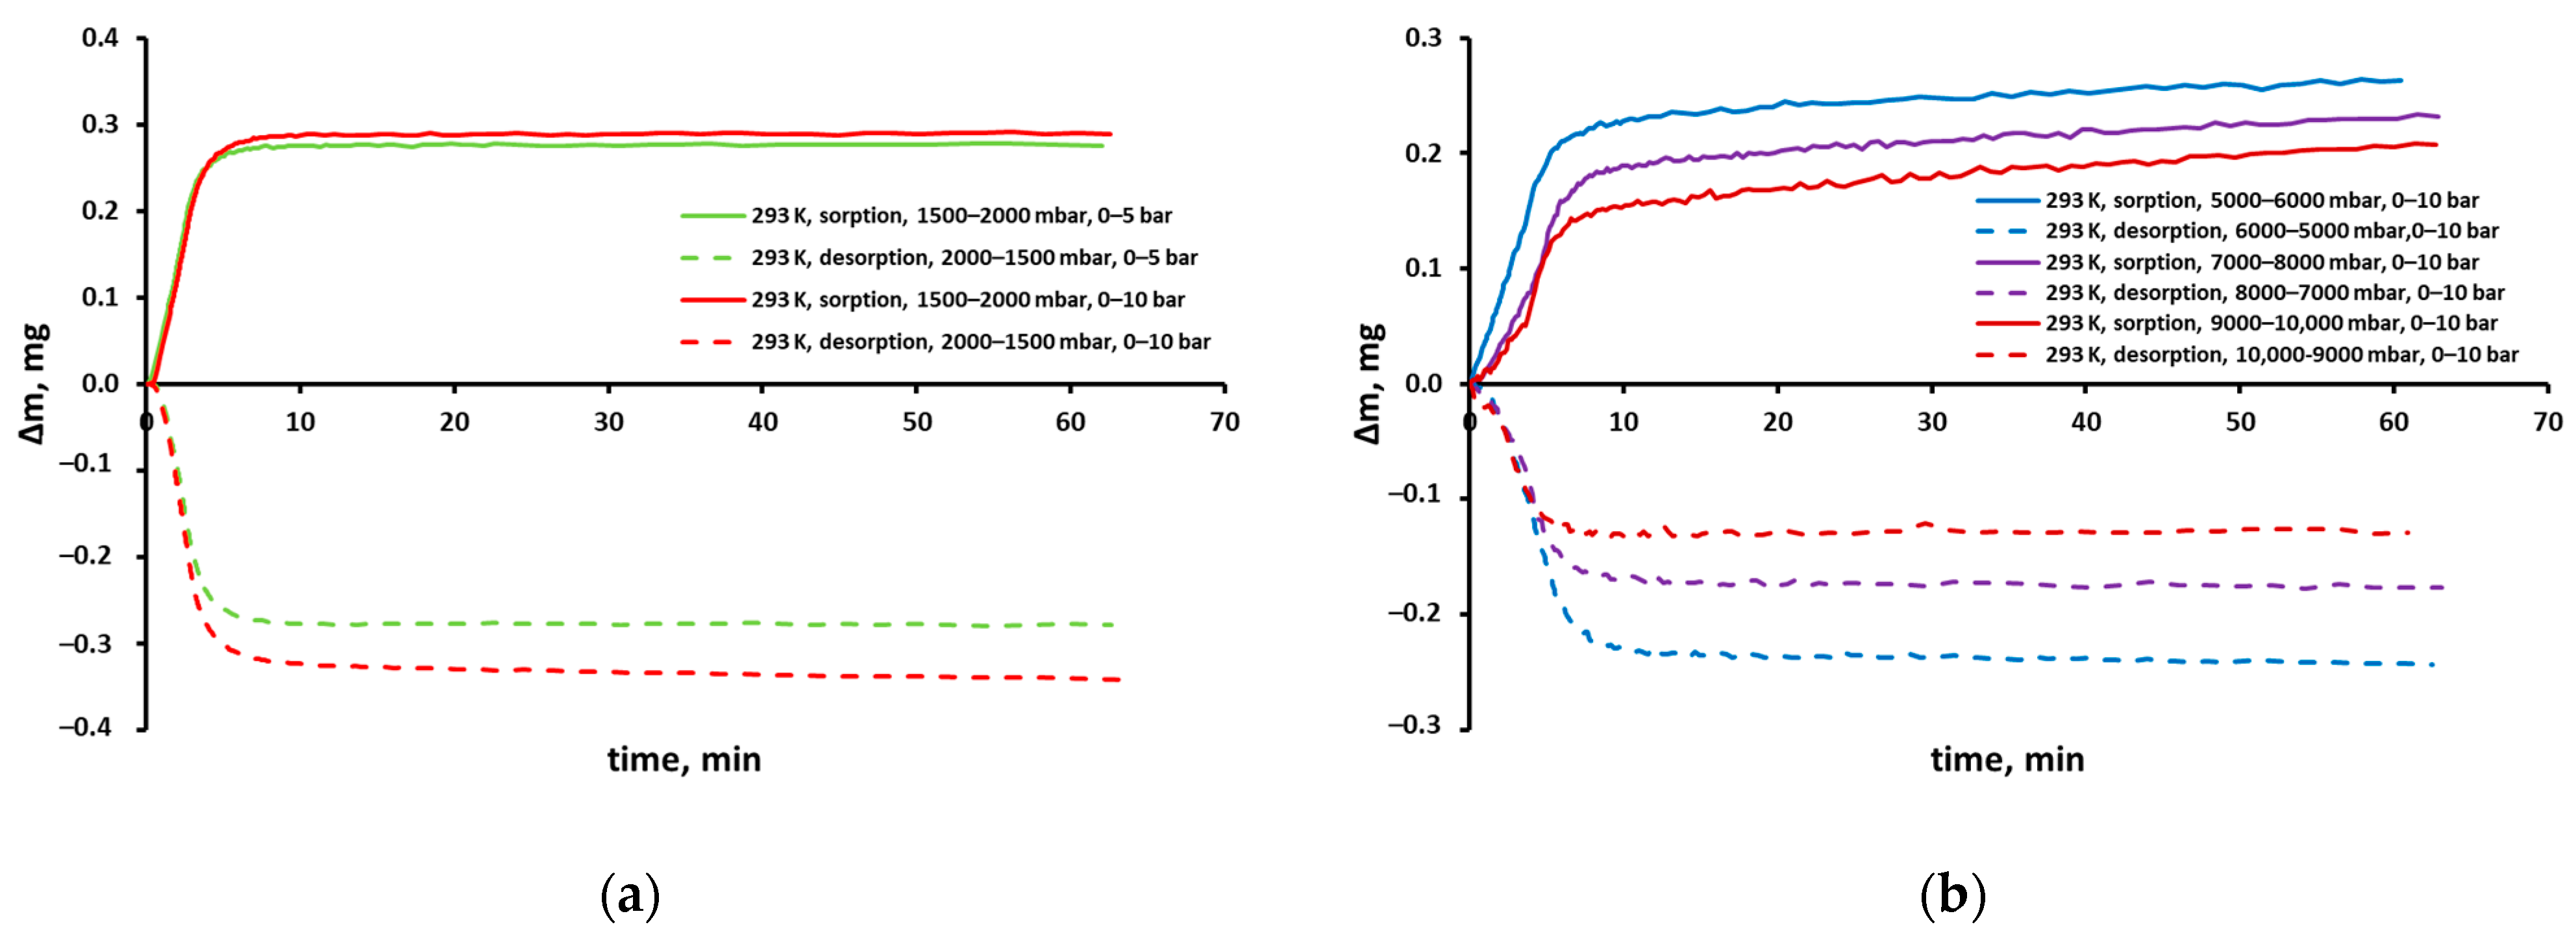
3.2. Sorption Experiments
3.3. Dual Mode Sorption Model
4. Conclusions
Supplementary Materials
Author Contributions
Funding
Institutional Review Board Statement
Informed Consent Statement
Data Availability Statement
Conflicts of Interest
References
- Tomczak, W.; Gryta, M.; Daniluk, M.; Żak, S. Biogas Upgrading Using a Single-Membrane System: A Review. Membranes 2024, 14, 80. [Google Scholar] [CrossRef]
- Werkneh, A.A. Biogas Impurities: Environmental and Health Implications, Removal Technologies and Future Perspectives. Heliyon 2022, 8, e10929. [Google Scholar] [CrossRef] [PubMed]
- Janusz-Cygan, A.; Jaschik, J.; Tańczyk, M. Upgrading Biogas from Small Agricultural Sources into Biomethane by Membrane Separation. Membranes 2021, 11, 938. [Google Scholar] [CrossRef] [PubMed]
- PRISM GreenSep. Available online: https://membranesolutions.com/prism-greensep/ (accessed on 8 October 2024).
- UBE CO2 Separator for Biogas Upgrading. Available online: https://ube.es/products/biogas-upgrading-biomethane-co2-separator/ (accessed on 8 October 2024).
- SEPURAN® Green I Membranes for Efficient Biogas Upgrading. Available online: https://www.membrane-separation.com/en/upgrading-of-biogas-to-biomethane-with-sepuran-green (accessed on 21 November 2023).
- Air Liquide Biogas Upgrading Units|Air Liquide Advanced Technologies. Available online: https://advancedtech.airliquide.com/markets-solutions/energy-transition/biogas-upgrading-units (accessed on 8 October 2024).
- EBA European Biogas Association. Available online: https://www.europeanbiogas.eu/wp-content/uploads/2023/12/PR_EBA-Statistical-Report-2023.pdf (accessed on 25 November 2024).
- EBA European Biogas Association. Available online: https://www.europeanbiogas.eu/wp-content/uploads/2023/12/EBA-Statistical-Report-2023-Launch-webinar.pdf (accessed on 25 November 2024).
- Jaschik, M.; Tanczyk, M.; Jaschik, J.; Janusz-Cygan, A. The Performance of a Hybrid VSA-Membrane Process for the Capture of CO2 from Flue Gas. Int. J. Greenh. Gas Control 2020, 97, 103037. [Google Scholar] [CrossRef]
- Ricci, E.; De Angelis, M.G. Modelling Mixed-Gas Sorption in Glassy Polymers for CO2 Removal: A Sensitivity Analysis of the Dual Mode Sorption Model. Membranes 2019, 9, 8. [Google Scholar] [CrossRef]
- Ricci, E.; Minelli, M.; De Angelis, M.G. Modelling Sorption and Transport of Gases in Polymeric Membranes across Different Scales: A Review. Membranes 2022, 12, 857. [Google Scholar] [CrossRef] [PubMed]
- Miandoab, E.S.; Kentish, S.E.; Scholes, C.A. Modelling Competitive Sorption and Plasticization of Glassy Polymeric Membranes Used in Biogas Upgrading. J. Membr. Sci. 2021, 617, 118643. [Google Scholar] [CrossRef]
- Tsujita, Y. Gas Sorption and Permeation of Glassy Polymers with Microvoids. Prog. Polym. Sci. 2003, 28, 1377–1401. [Google Scholar] [CrossRef]
- Wind, J.D.; Staudt-Bickel, C.; Paul, D.R.; Koros, W.J. The Effects of Crosslinking Chemistry on CO2 Plasticization of Polyimide Gas Separation Membranes. Ind. Eng. Chem. Res. 2002, 41, 6139–6148. [Google Scholar] [CrossRef]
- Reijerkerk, S.R.; Nijmeijer, K.; Ribeiro, C.P.; Freeman, B.D.; Wessling, M. On the Effects of Plasticization in CO2/Light Gas Separation Using Polymeric Solubility Selective Membranes. J. Membr. Sci. 2011, 367, 33–44. [Google Scholar] [CrossRef]
- Visser, T.; Koops, G.H.; Wessling, M. On the Subtle Balance between Competitive Sorption and Plasticization Effects in Asymmetric Hollow Fiber Gas Separation Membranes. J. Membr. Sci. 2005, 252, 265–277. [Google Scholar] [CrossRef]
- Wang, Y.; Ma, X.; Ghanem, B.S.; Alghunaimi, F.; Pinnau, I.; Han, Y. Polymers of Intrinsic Microporosity for Energy-Intensive Membrane-Based Gas Separations. Mater. Today Nano 2018, 3, 69–95. [Google Scholar] [CrossRef]
- Genduso, G.; Pinnau, I. Quantification of Sorption, Diffusion, and Plasticization Properties of Cellulose Triacetate Films under Mixed-Gas CO2/CH4 Environment. J. Membr. Sci. 2020, 610, 118269. [Google Scholar] [CrossRef]
- Swaidan, R.; Ghanem, B.S.; Litwiller, E.; Pinnau, I. Pure- and Mixed-Gas CO2/CH4 Separation Properties of PIM-1 and an Amidoxime-Functionalized PIM-1. J. Membr. Sci. 2014, 457, 95–102. [Google Scholar] [CrossRef]
- Janusz-Cygan, A.; Jaschik, J.; Wojdyła, A.; Tańczyk, M. The Separative Performance of Modules with Polymeric Membranes for a Hybrid Adsorptive/Membrane Process of CO2 Capture from Flue Gas. Membranes 2020, 10, 309. [Google Scholar] [CrossRef] [PubMed]
- Wijmans, J.G.; Baker, R.W. The Solution-Diffusion Model: A Review. J. Membr. Sci. 1995, 107, 1–21. [Google Scholar] [CrossRef]
- Erb, A.J.; Paul, D.R. Gas Sorption and Transport in Polysulfone. J. Membr. Sci. 1981, 8, 11–22. [Google Scholar] [CrossRef]
- Biondo, L.D.; Duarte, J.; Zeni, M.; Godinho, M. A Dual-Mode Model Interpretation of CO2/CH4 Permeability in Polysulfone Membranes at Low Pressures. An. Acad. Bras. Ciênc. 2018, 90, 1855–1864. [Google Scholar] [CrossRef] [PubMed]
- McHattie, J.S.; Koros, W.J.; Paul, D.R. Gas Transport Properties of Polysulphones: 1. Role of Symmetry of Methyl Group Placement on Bisphenol Rings. Polymer 1991, 32, 840–850. [Google Scholar] [CrossRef]
- Houben, M.; van Geijn, R.; van Essen, M.; Borneman, Z.; Nijmeijer, K. Supercritical CO2 Permeation in Glassy Polyimide Membranes. J. Membr. Sci. 2021, 620, 118922. [Google Scholar] [CrossRef]
- Tiwari, R.R.; Jin, J.; Freeman, B.D.; Paul, D.R. Physical Aging, CO2 Sorption and Plasticization in Thin Films of Polymer with Intrinsic Microporosity (PIM-1). J. Membr. Sci. 2017, 537, 362–371. [Google Scholar] [CrossRef]
- Kadirkhan, F.; Goh, P.S.; Ismail, A.F.; Wan Mustapa, W.N.F.; Halim, M.H.M.; Soh, W.K.; Yeo, S.Y. Recent Advances of Polymeric Membranes in Tackling Plasticization and Aging for Practical Industrial CO2/CH4 Applications—A Review. Membranes 2022, 12, 71. [Google Scholar] [CrossRef]
- Suleman, M.S.; Lau, K.K.; Yeong, Y.F. Plasticization and Swelling in Polymeric Membranes in CO2 Removal from Natural Gas. Chem. Eng. Technol. 2016, 39, 1604–1616. [Google Scholar] [CrossRef]
- Scholes, C.A.; Tao, W.X.; Stevens, G.W.; Kentish, S.E. Sorption of Methane, Nitrogen, Carbon Dioxide, and Water in Matrimid 5218. J. Appl. Polym. Sci. 2010, 117, 2284–2289. [Google Scholar] [CrossRef]
- Rodero, M.d.R.; Muñoz, R.; González-Sánchez, A.; Ruiz, H.A.; Quijano, G. Membrane Materials for Biogas Purification and Upgrading: Fundamentals, Recent Advances and Challenges. J. Environ. Chem. Eng. 2024, 12, 114106. [Google Scholar] [CrossRef]
- Scholes, C.A.; Chen, G.Q.; Stevens, G.W.; Kentish, S.E. Plasticization of Ultra-Thin Polysulfone Membranes by Carbon Dioxide. J. Membr. Sci. 2010, 346, 208–214. [Google Scholar] [CrossRef]
- Ahmad, M.Z.; Peters, T.A.; Konnertz, N.M.; Visser, T.; Téllez, C.; Coronas, J.; Fila, V.; de Vos, W.M.; Benes, N.E. High-Pressure CO2/CH4 Separation of Zr-MOFs Based Mixed Matrix Membranes. Sep. Purif. Technol. 2020, 230, 115858. [Google Scholar] [CrossRef]
- Bos, A.; Pünt, I.G.M.; Wessling, M.; Strathmann, H. CO2-Induced Plasticization Phenomena in Glassy Polymers. J. Membr. Sci. 1999, 155, 67–78. [Google Scholar] [CrossRef]
- Park, J.; Yoon, H.W.; Paul, D.R.; Freeman, B.D. Gas Transport Properties of PDMS-Coated Reverse Osmosis Membranes. J. Membr. Sci. 2020, 604, 118009. [Google Scholar] [CrossRef]
- Genduso, G.; Ghanem, B.S.; Pinnau, I. Experimental Mixed-Gas Permeability, Sorption and Diffusion of CO2-CH4 Mixtures in 6FDA-mPDA Polyimide Membrane: Unveiling the Effect of Competitive Sorption on Permeability Selectivity. Membranes 2019, 9, 10. [Google Scholar] [CrossRef] [PubMed]
- Gleason, K.L.; Smith, Z.P.; Liu, Q.; Paul, D.R.; Freeman, B.D. Pure- and Mixed-Gas Permeation of CO2 and CH4 in Thermally Rearranged Polymers Based on 3,3′-Dihydroxy-4,4′-Diamino-Biphenyl (HAB) and 2,2′-Bis-(3,4-Dicarboxyphenyl) Hexafluoropropane Dianhydride (6FDA). J. Membr. Sci. 2015, 475, 204–214. [Google Scholar] [CrossRef]
- Neyertz, S.; Brown, D. Single- and Mixed-Gas Sorption in Large-Scale Molecular Models of Glassy Bulk Polymers. Competitive Sorption of a Binary CH4/N2 and a Ternary CH4/N2/CO2 Mixture in a Polyimide Membrane. J. Membr. Sci. 2020, 614, 118478. [Google Scholar] [CrossRef]
- Ricci, E.; Benedetti, F.M.; Dose, M.E.; De Angelis, M.G.; Freeman, B.D.; Paul, D.R. Competitive Sorption in CO2/CH4 Separations: The Case of HAB-6FDA Polyimide and Its TR Derivative and a General Analysis of Its Impact on the Selectivity of Glassy Polymers at Multicomponent Conditions. J. Membr. Sci. 2020, 612, 118374. [Google Scholar] [CrossRef]
- Genduso, G.; Wang, Y.; Ghanem, B.S.; Pinnau, I. Permeation, Sorption, and Diffusion of CO2-CH4 Mixtures in Polymers of Intrinsic Microporosity: The Effect of Intrachain Rigidity on Plasticization Resistance. J. Membr. Sci. 2019, 584, 100–109. [Google Scholar] [CrossRef]
- Hu, C.-C.; Chang, C.-S.; Ruaan, R.-C.; Lai, J.-Y. Effect of Free Volume and Sorption on Membrane Gas Transport. J. Membr. Sci. 2003, 226, 51–61. [Google Scholar] [CrossRef]
- Mueller, R.; Hariharan, V.; Zhang, C.; Lively, R.; Vasenkov, S. Relationship between Mixed and Pure Gas Self-Diffusion for Ethane and Ethene in ZIF-8/6FDA-DAM Mixed-Matrix Membrane by Pulsed Field Gradient NMR. J. Membr. Sci. 2016, 499, 12–19. [Google Scholar] [CrossRef]
- Bahadur, I.; Osman, K.; Coquelet, C.; Naidoo, P.; Ramjugernath, D. Solubilities of Carbon Dioxide and Oxygen in the Ionic Liquids Methyl Trioctyl Ammonium Bis(Trifluoromethylsulfonyl)Imide, 1-Butyl-3-Methyl Imidazolium Bis(Trifluoromethylsulfonyl)Imide, and 1-Butyl-3-Methyl Imidazolium Methyl Sulfate. J. Phys. Chem. B 2015, 119, 1503–1514. [Google Scholar] [CrossRef]
- Esposito, E.; Mazzei, I.; Monteleone, M.; Fuoco, A.; Carta, M.; McKeown, N.B.; Malpass-Evans, R.; Jansen, J.C. Highly Permeable Matrimid®/PIM-EA(H2)-TB Blend Membrane for Gas Separation. Polymers 2019, 11, 46. [Google Scholar] [CrossRef]
- Sanders, E.S.; Koros, W.J. Sorption of CO2, C2H4, N2O and Their Binary Mixtures in Poly(Methyl Methacrylate). J. Polym. Sci. Part B Polym. Phys. 1986, 24, 175–188. [Google Scholar] [CrossRef]
- Story, B.J.; Koros, W.J. Sorption of CO2/CH4 Mixtures in Poly(Phenylene Oxide) and a Carboxylated Derivative. J. Appl. Polym. Sci. 1991, 42, 2613–2626. [Google Scholar] [CrossRef]
- Dean, P.A.; Mizrahi Rodriguez, K.; Guo, S.; Roy, N.; Swager, T.M.; Smith, Z.P. Elucidating the Role of Micropore-Generating Backbone Motifs and Amine Functionality on H2S, CO2, CH4 and N2 Sorption. J. Membr. Sci. 2024, 696, 122465. [Google Scholar] [CrossRef]

| DMS Model with Minimized Concentration Squared Differences | DMS Model with Minimized Solubility Squared Differences | |||
|---|---|---|---|---|
| Gas | CO2 | CH4 | CO2 | CH4 |
| kD0 1 | 2.994 × 10⁻³ | 2.622 × 10⁻² | 1.567 × 10⁻² | 3.012 × 10⁻² |
| −ΔHD/R 2 | 1878.9 | 766.4 | 1439.6 | 776.9 |
| C’H0 3 | −0.136 | −0.096 | −0.175 | −0.093 |
| C’H1 4 | 49.33 | 33.41 | 58.95 | 31.39 |
| b0 5 | 9.997 × 10⁻⁴ | 1.427 × 10⁻² | 2.363 × 10⁻² | 1.122 × 10⁻¹ |
| −ΔHL/R 2 | 2025.1 | 825.8 | 1194.6 | 305.5 |
| C’H1/−C’H0 6 | 363.8 | 348.2 | 337.4 | 337.0 |
| RE 7 | 1.51 | 1.41 | 2.1 | 0.97 |
| SEE 8 | 0.182 | 0.039 | 0.173 | 0.021 |
| DMS Model with Minimized Concentration Squared Differences | DMS Model with Minimized Solubility Squared Differences | |||||||
|---|---|---|---|---|---|---|---|---|
| Pure | Mixture | Pure | Mixture | |||||
| Gas | CO2 | CH4 | CO2 | CH4 | CO2 | CH4 | CO2 | CH4 |
| K | 5.113 | 3.398 | 5.113 | 3.398 | 4.873 | 2.947 | 4.873 | 2.947 |
| DD 1 | 3.53 × 10⁻⁷ | 5.11 × 10⁻⁸ | 1.7 × 10⁻⁷ | 5.29 × 10⁻⁸ | 3.21 × 10⁻⁷ | 4.58 × 10⁻⁸ | 1.6 × 10⁻⁷ | 4.86 × 10⁻⁸ |
| F | 0.069 | 0.226 | 0.345 | 0 | 0 | 0.211 | 0.291 | 0 |
Disclaimer/Publisher’s Note: The statements, opinions and data contained in all publications are solely those of the individual author(s) and contributor(s) and not of MDPI and/or the editor(s). MDPI and/or the editor(s) disclaim responsibility for any injury to people or property resulting from any ideas, methods, instructions or products referred to in the content. |
© 2025 by the authors. Licensee MDPI, Basel, Switzerland. This article is an open access article distributed under the terms and conditions of the Creative Commons Attribution (CC BY) license (https://creativecommons.org/licenses/by/4.0/).
Share and Cite
Tańczyk, M.; Janusz-Cygan, A.; Pawlaczyk-Kurek, A.; Hamryszak, Ł.; Jaschik, J.; Janusz-Szymańska, K. Solubility and Diffusion of Main Biogas Components in a Glassy Polysulfone-Based Membrane. Molecules 2025, 30, 614. https://doi.org/10.3390/molecules30030614
Tańczyk M, Janusz-Cygan A, Pawlaczyk-Kurek A, Hamryszak Ł, Jaschik J, Janusz-Szymańska K. Solubility and Diffusion of Main Biogas Components in a Glassy Polysulfone-Based Membrane. Molecules. 2025; 30(3):614. https://doi.org/10.3390/molecules30030614
Chicago/Turabian StyleTańczyk, Marek, Aleksandra Janusz-Cygan, Anna Pawlaczyk-Kurek, Łukasz Hamryszak, Jolanta Jaschik, and Katarzyna Janusz-Szymańska. 2025. "Solubility and Diffusion of Main Biogas Components in a Glassy Polysulfone-Based Membrane" Molecules 30, no. 3: 614. https://doi.org/10.3390/molecules30030614
APA StyleTańczyk, M., Janusz-Cygan, A., Pawlaczyk-Kurek, A., Hamryszak, Ł., Jaschik, J., & Janusz-Szymańska, K. (2025). Solubility and Diffusion of Main Biogas Components in a Glassy Polysulfone-Based Membrane. Molecules, 30(3), 614. https://doi.org/10.3390/molecules30030614