Article

Anti-Neuroinflammatory Effects of Compounds Isolated from Quercus acuta Thunb. Fruits via NF-κB Signaling Inhibition in BV2 Microglia

by
Hwan Lee
1,†,
Yezhi Jin
2,†,
Ji-Ae Hong
1,
Chenyang Bai
2,
Gyoyoung Lee
2,
Suhyeon Woo
3,
Chi-Su Yoon
3,
Donghyuck Bae
1,* and
Dong-Sung Lee
2,*
1
Natural Resources Laboratory, Green Bio Headquarters, Jeonnam Bio Foundation (JBF), Jangheung-gun 59338, Jeollanam-do, Republic of Korea
2
Research Institute of Pharmaceutical Sciences (RIPS), College of Pharmacy, Chosun University, Dong-gu, Gwangju 61452, Jeollanam-do, Republic of Korea
3
Institute of Pharmaceutical Research and Development, College of Pharmacy, Wonkwang University, Iksan 54538, Jeollabuk-do, Republic of Korea
*
Authors to whom correspondence should be addressed.
These authors contributed equally to this work.
Molecules 2025, 30(23), 4514; https://doi.org/10.3390/molecules30234514 (registering DOI)
Submission received: 19 October 2025 / Revised: 16 November 2025 / Accepted: 20 November 2025 / Published: 22 November 2025
(This article belongs to the Special Issue Natural Products Chemistry in Asia)

Abstract

Aging is a major risk factor for neurodegenerative diseases in which microglia-driven neuroinflammation plays a critical role in neuronal dysfunction and disease progression. In this study, we sought to isolate bioactive metabolites from Quercus acuta Thunb. fruits—which have traditionally been used in oriental medicine but are chemically and pharmacologically underexplored—and evaluate their anti-neuroinflammatory potential. A total of 14 compounds were isolated from an ethanol extract of Q. acuta fruits through bioactivity-guided isolation, and their structures were identified by NMR spectroscopy. Notably, this study is the first to demonstrate that 3,5,7,2′,6′-pentahydroxyflavanone and 2,5-dihydroxybenzaldehyde, among the compounds isolated from Q. acuta fruits, exhibit significant anti-neuroinflammatory activities. Both compounds reduced the production of proinflammatory mediators, including IL-6 and TNF-α, while inhibiting the expression of iNOS and COX-2. Moreover, they significantly inhibited NF-κB activation in lipopolysaccharide-induced BV2 microglia. Collectively, these findings indicate that Q. acuta fruits contain bioactive constituents with previously unreported anti-neuroinflammatory properties, supporting their potential as a natural source for the development of therapeutic agents targeting age-related neuroinflammation.

1. Introduction

Aging is a major risk factor for neurodegenerative disorders, including Alzheimer’s and Parkinson’s diseases. Among the multiple pathological mechanisms, neuroinflammation has emerged as a critical contributor to neuronal dysfunction and disease progression [1,2]. Activated microglia, the resident immune cells of the central nervous system, release proinflammatory cytokines and mediators that exacerbate neuronal damage. Suppressing microglial activation is therefore considered an important strategy for mitigating neuroinflammatory processes [3,4].
BV2 microglia are widely used as a model for studying neuroinflammation due to their stable growth characteristics and reproducible responses [5,6,7]. Upon lipopolysaccharide (LPS) stimulation, these cells induce activation of the nuclear factor kappa B (NF-κB) signaling pathway, leading to the upregulation of inflammatory mediators such as cytokines and enzymes [8,9]. Specifically, LPS-induced BV2 cells produce nitric oxide (NO) through the induction of inducible nitric oxide synthase (iNOS), while releasing proinflammatory cytokines, including interleukin-6 (IL-6) and tumor necrosis factor-alpha (TNF-α). These mediators are tightly regulated by NF-κB signaling and play a crucial role in increasing neuroinflammation; therefore, they are widely recognized biomarkers of microglial activation [10,11,12]. Consequently, the LPS-induced BV2 cell model provides a reliable experimental system for assessing whether candidate compounds can suppress NF-κB mediated inflammatory pathways.
Quercus acuta Thunb. is an evergreen broadleaf tree native to East Asia, including countries like the Republic of Korea, Japan, and China. In the Republic of Korea, Q. acuta fruits, acorns, are traditionally consumed as acorn jelly. Oriental Korean medical texts, such as the Donguibogam, describe Q. acuta fruits (referred to as “myeonja”) as possessing blood-cleansing, diuretic, analgesic, and detoxifying properties, and note their use in treating conditions such as neuralgia and joint pain. Recently, Q. acuta has attracted attention for its high carbon storage efficiency compared with other Fagaceae plants, leading to expanded cultivation in the southern territories of the Republic of Korea in response to climate change [13]. However, aside from ecological studies and limited applications in food sectors, most research has focused on Q. acuta leaves, which have been reported to exhibit anti-neuroinflammatory, antiviral, antibacterial, and antihyperuricemic effects [14,15,16,17]. Furthermore, while previous studies on Q. acuta in relation to neuroinflammation have primarily focused on the methanol extract of the stem, this study investigates individual bioactive compounds isolated from the fruit [14]. Studies on this fruit have suggested antiphotoaging activity, but their chemical constituents and potential anti-neuroinflammatory effects remain largely unexplored [18].
This study aimed to isolate and identify bioactive compounds from Q. acuta fruits and evaluate their anti-neuroinflammatory activity in LPS-induced BV2 microglia, focusing on NF-κB-mediated signaling pathways implicated in aging-related neurodegeneration. Furthermore, this study was conducted to explore the potential of Q. acuta as a sustainable natural resource that contributes to ecological balance through carbon storage that may provide bioactive compounds relevant to aging-related neuroinflammation, thereby supporting both natural and human antiaging processes.

2. Results

2.1. Effects of Q. acuta Fruit Ethanol Extract on Cytotoxicity and Nitrite Production

Since the purpose of this study was to identify the active ingredients in Q. acuta acorns, it was essential to determine whether the extract itself exhibited anti-neuroinflammatory effects. Therefore, we investigated the effects of the Q. acuta fruit ethanol (EtOH) extract in BV2 microglia. First, we performed a toxicity evaluation of the extract. No significant cytotoxicity was observed at concentrations up to 100 μg/mL (Figure 1a). We then examined LPS-induced nitrite production in BV2 microglia under non-toxic conditions, testing three extract concentrations (25, 50, and 100 μg/mL). The EtOH extract of Q. acuta significantly reduced nitrite production in a concentration-dependent manner (Figure 1b).

2.2. UHPLC-HR-MS/MS-Based Metabolite Profiling of Q. acuta Fruit Ethanol Extract

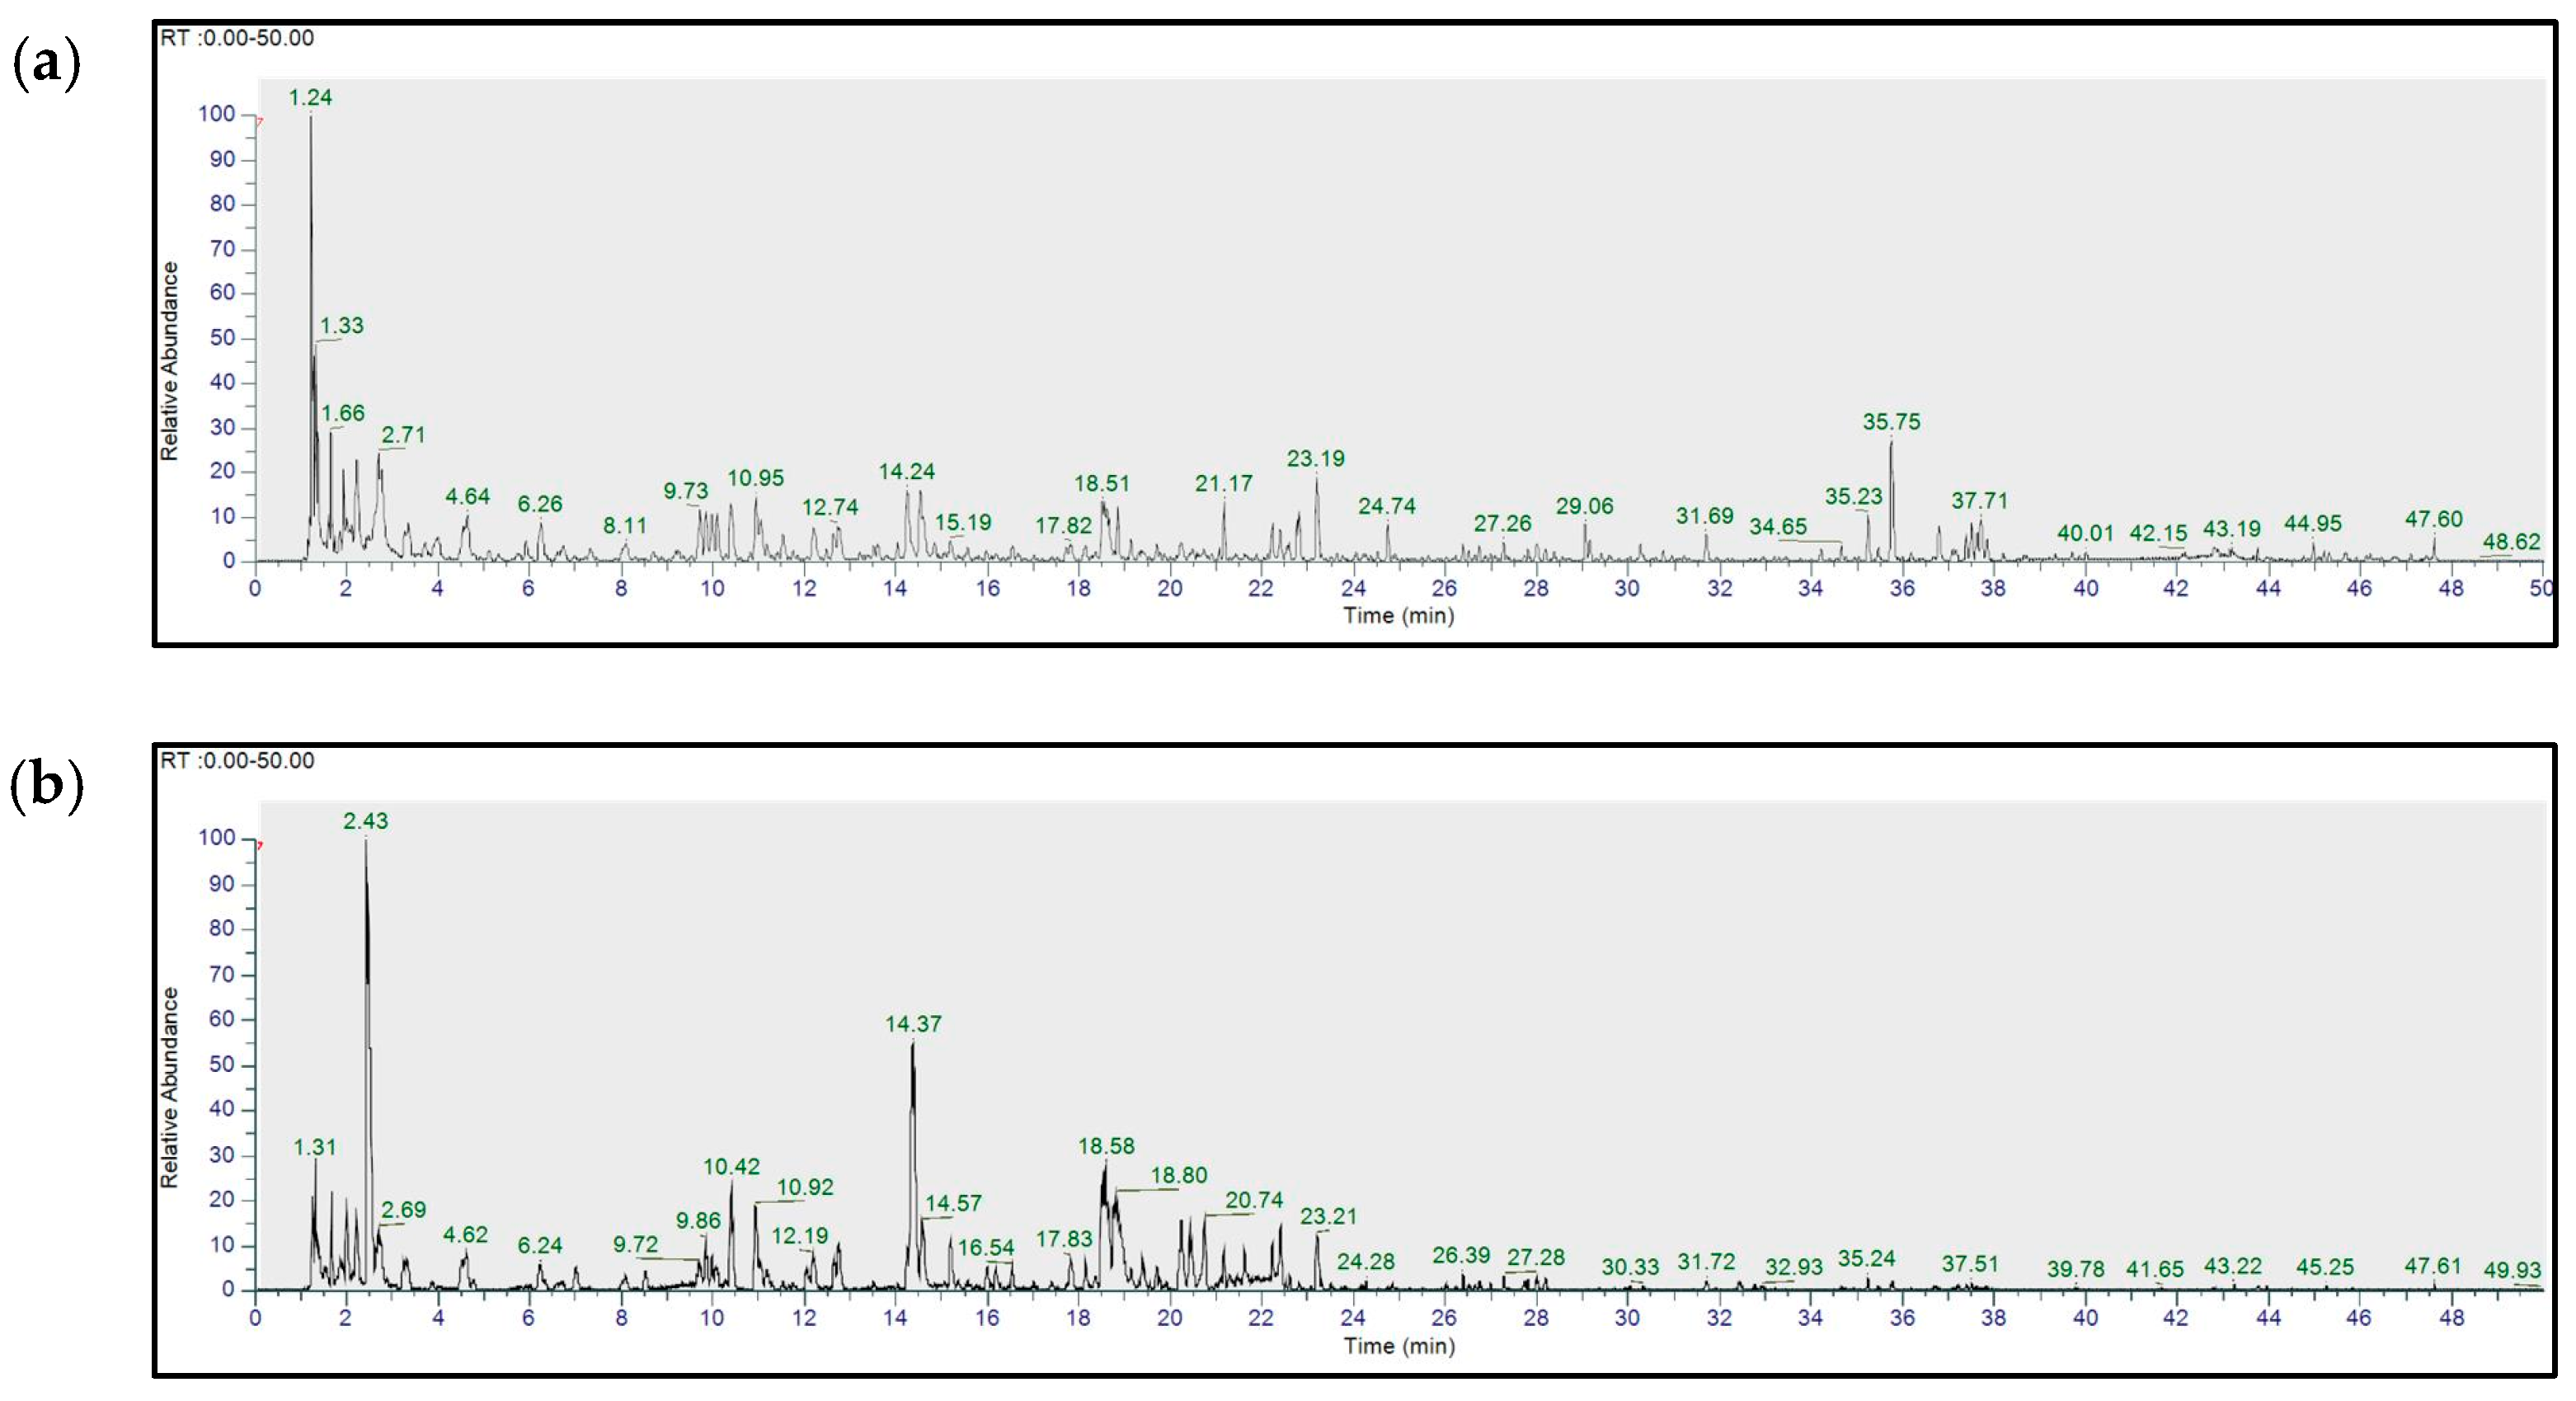
Metabolite profiling of the EtOH extract of Q. acuta fruits was performed using UHPLC-HR-MS/MS. The total ion current (TIC) chromatogram of the extract detected multiple peaks distributed across a retention time range of 0–50 min, suggesting the presence of various metabolites in both positive and negative mode chromatograms (Figure 2). Tentative annotations of the detected metabolites were predicted through MS/MS fragment analysis and comparison with databases and references [19,20,21,22,23,24,25,26,27,28,29,30,31,32,33,34].
The analysis revealed that the EtOH extract of Q. acuta acorns comprised a variety of compounds, including phenols, coumarins, flavonoids, and tannins (Table 1). These results provided a clear basis for further separation of the Q. acuta EtOH extract into fractions of different polarities using a solvent partitioning method.

2.3. Bioactivity of Q. acuta Fruit EtOH Extract Fractions

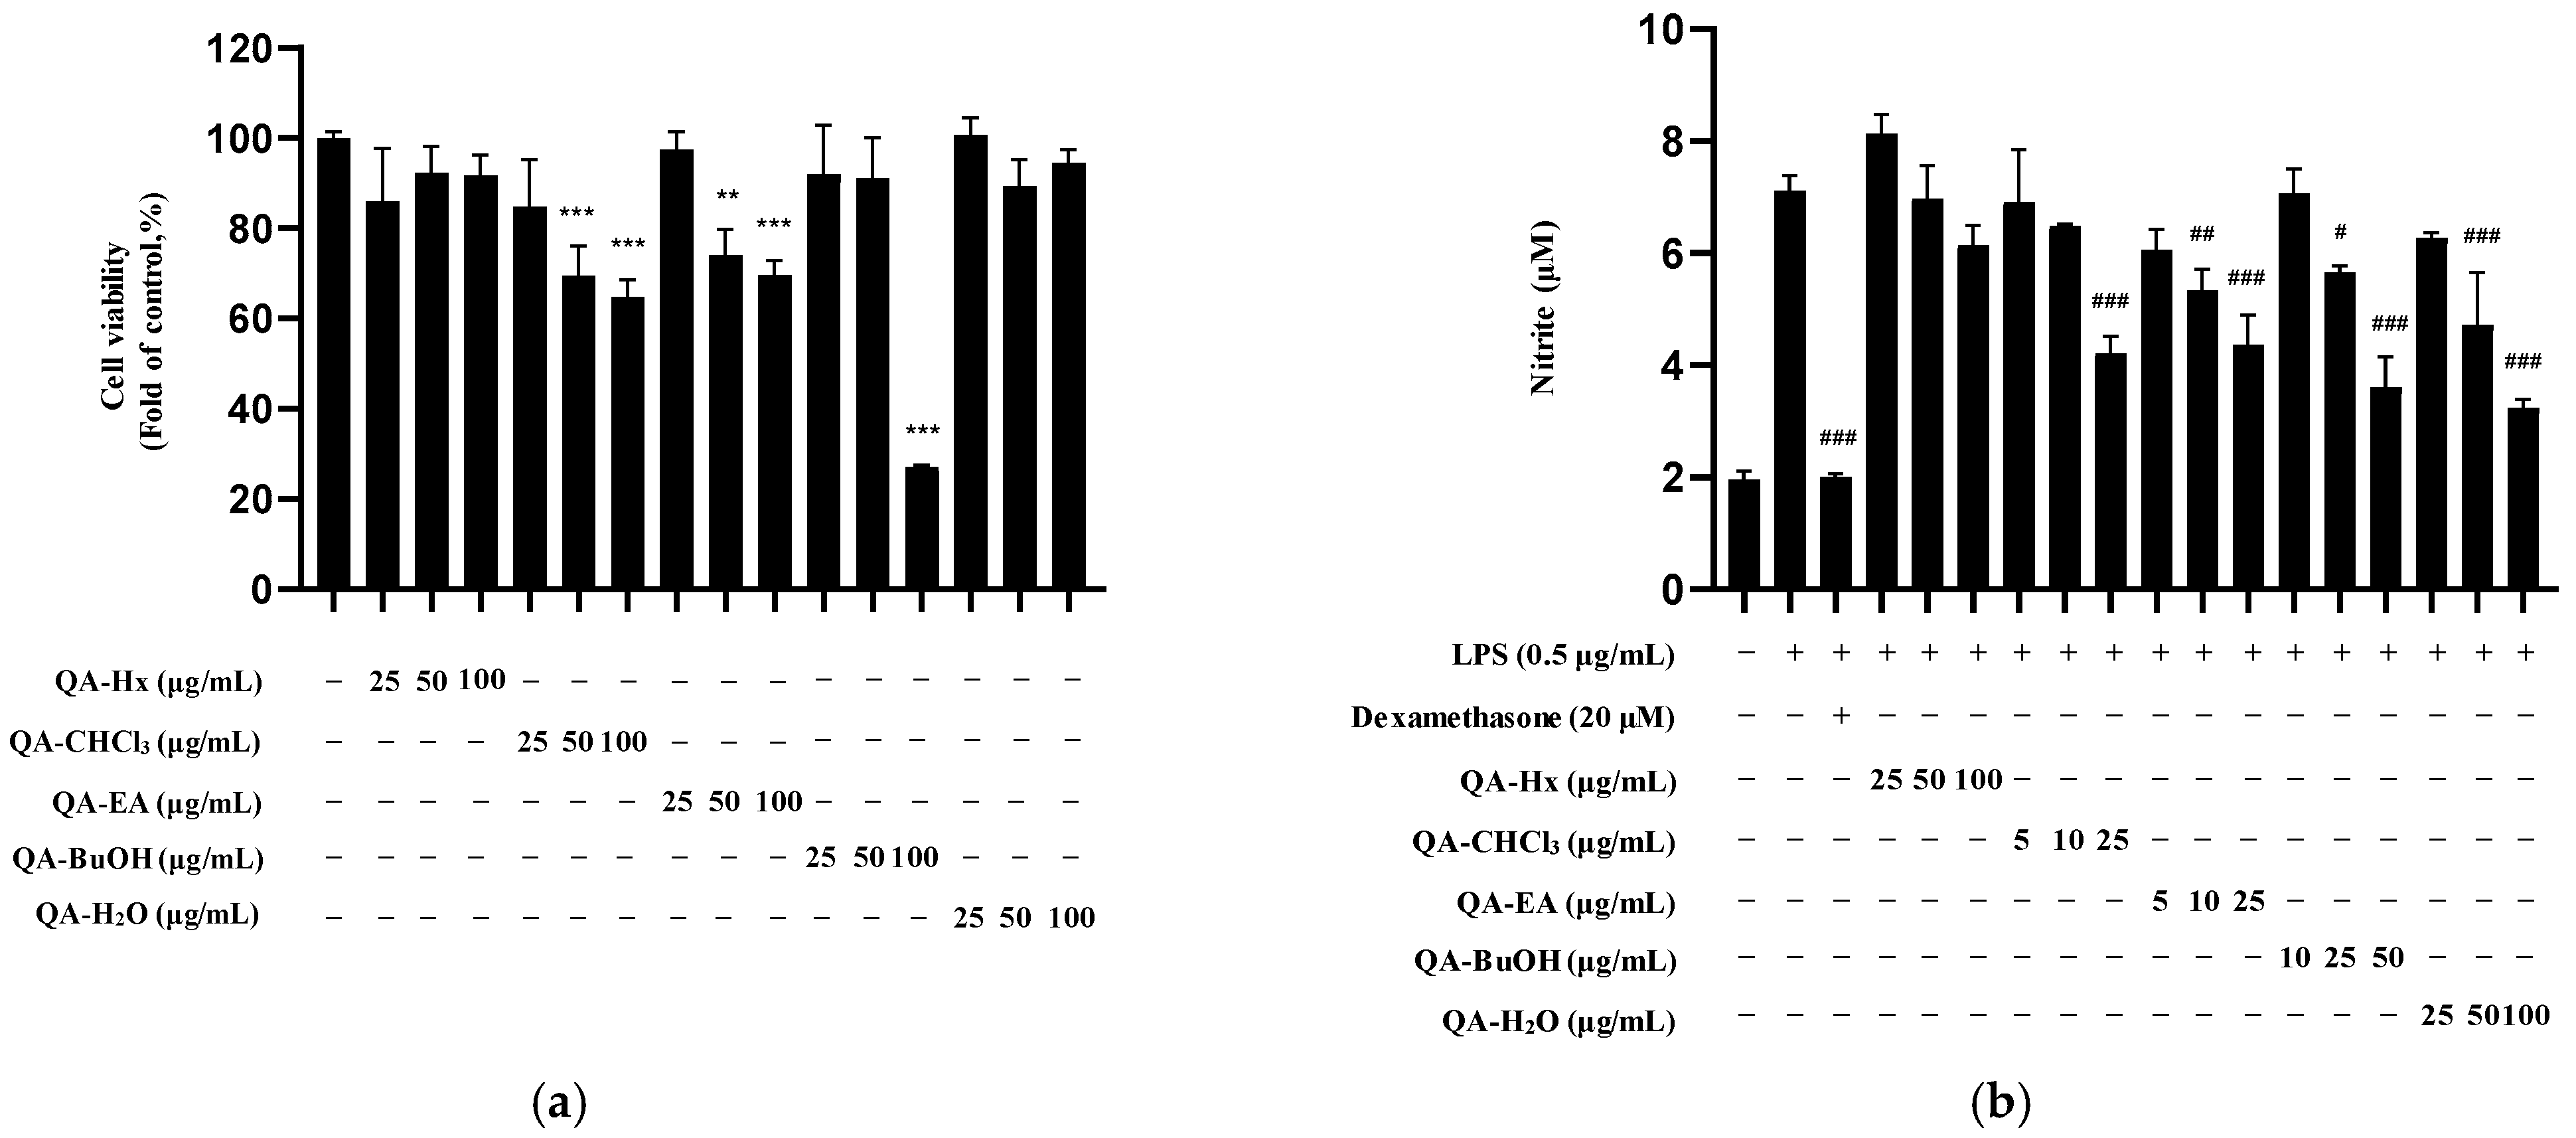
To isolate anti-neuroinflammatory compounds, we examined the inhibitory effects of each solvent fraction (n-hexane [Hx], chloroform [CF], ethyl acetate [EA], n-butanol [Bu], and H2O [DW]) on nitrite production. To determine the optimal concentration for sample processing, we first examined the cell viability of each solvent fraction in BV2 microglia using the MTT assay (Figure 3a). Based on the results, we investigated the inhibitory effects of each fraction at non-toxic concentrations on LPS-induced nitrite production in BV2 microglia. The CF, EA, Bu, and DW fractions significantly reduced nitrite production, whereas the Hx fraction showed no significant inhibitory effect (Figure 3b).
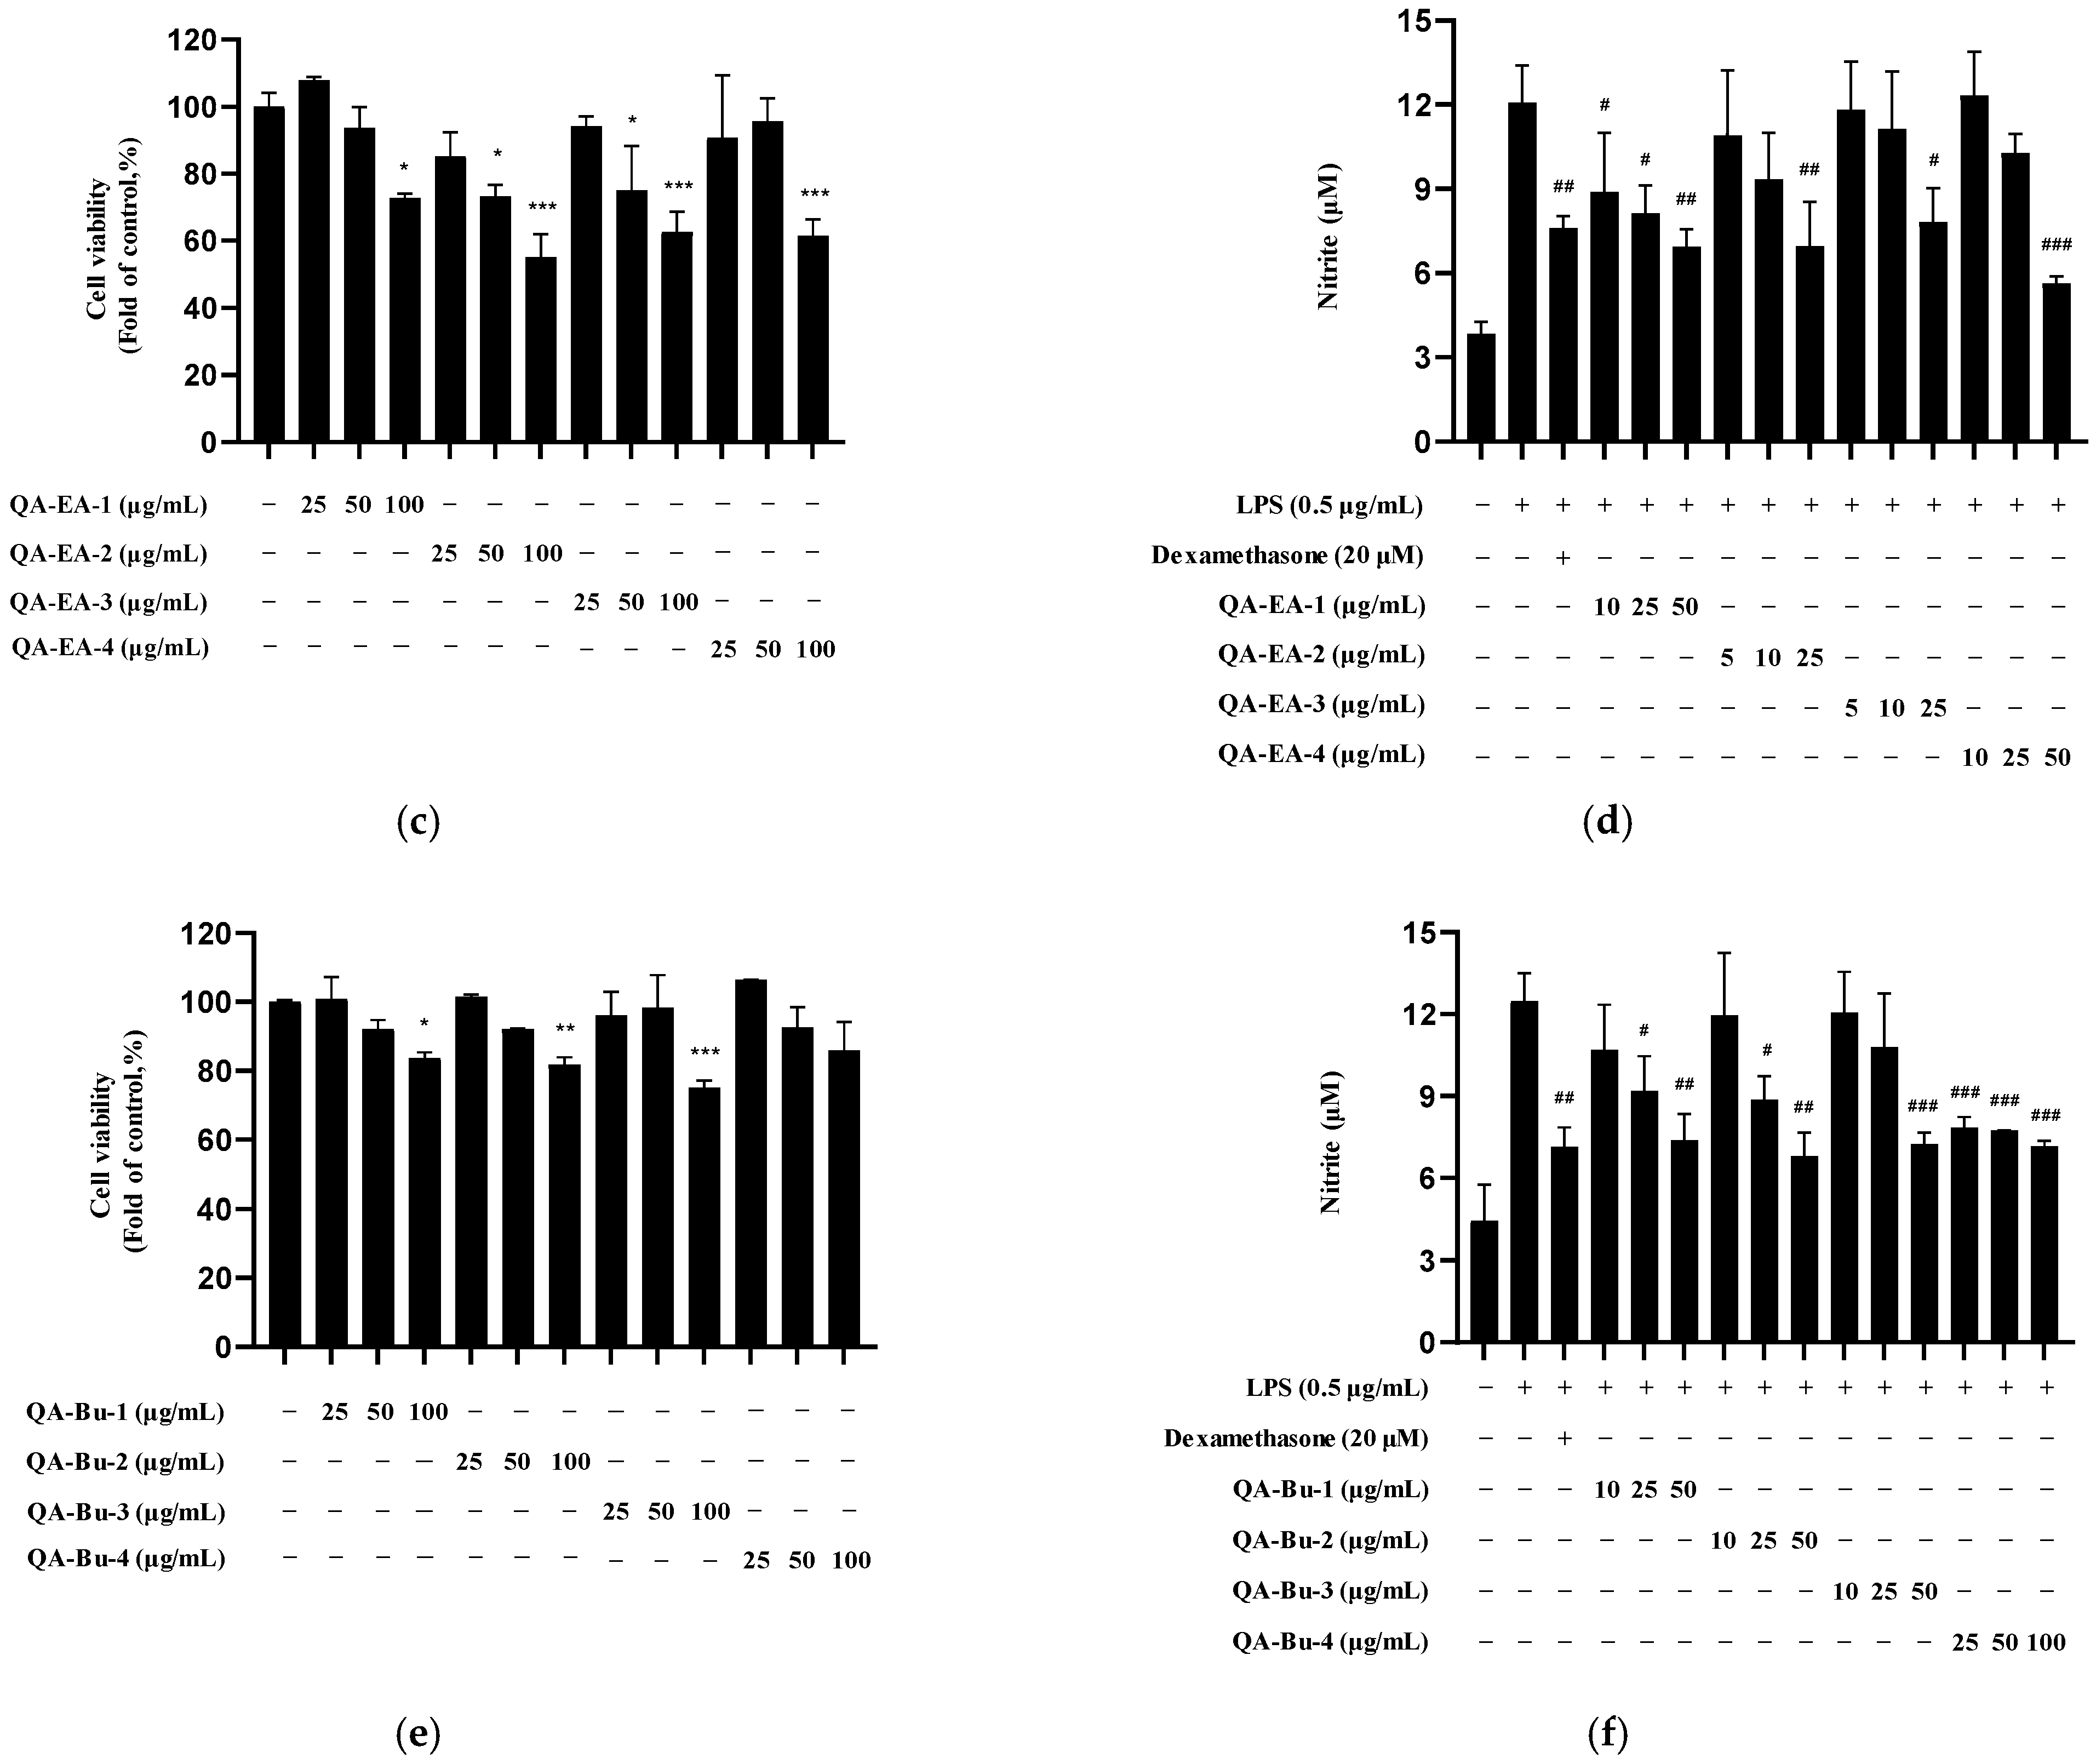
Since HPLC analyses revealed multiple chromatographic peaks in the EA and Bu fractions, such fractions were further fractionated by C18 reversed-phase chromatography (QA-EA-1–4 and Bu-1–4), and the treatment concentrations of the fractions were determined based on the corresponding cell viability results (Figure 3c,e). Subsequently, EA and Bu subfractions were used to treat LPS-induced BV2 cells, and they all consistently inhibited nitrite production, suggesting that multiple active compounds contribute to the anti-neuroinflammatory activity of Q. acuta fruits (Figure 3d,f).

2.4. Isolation and Structural Identification of Compounds

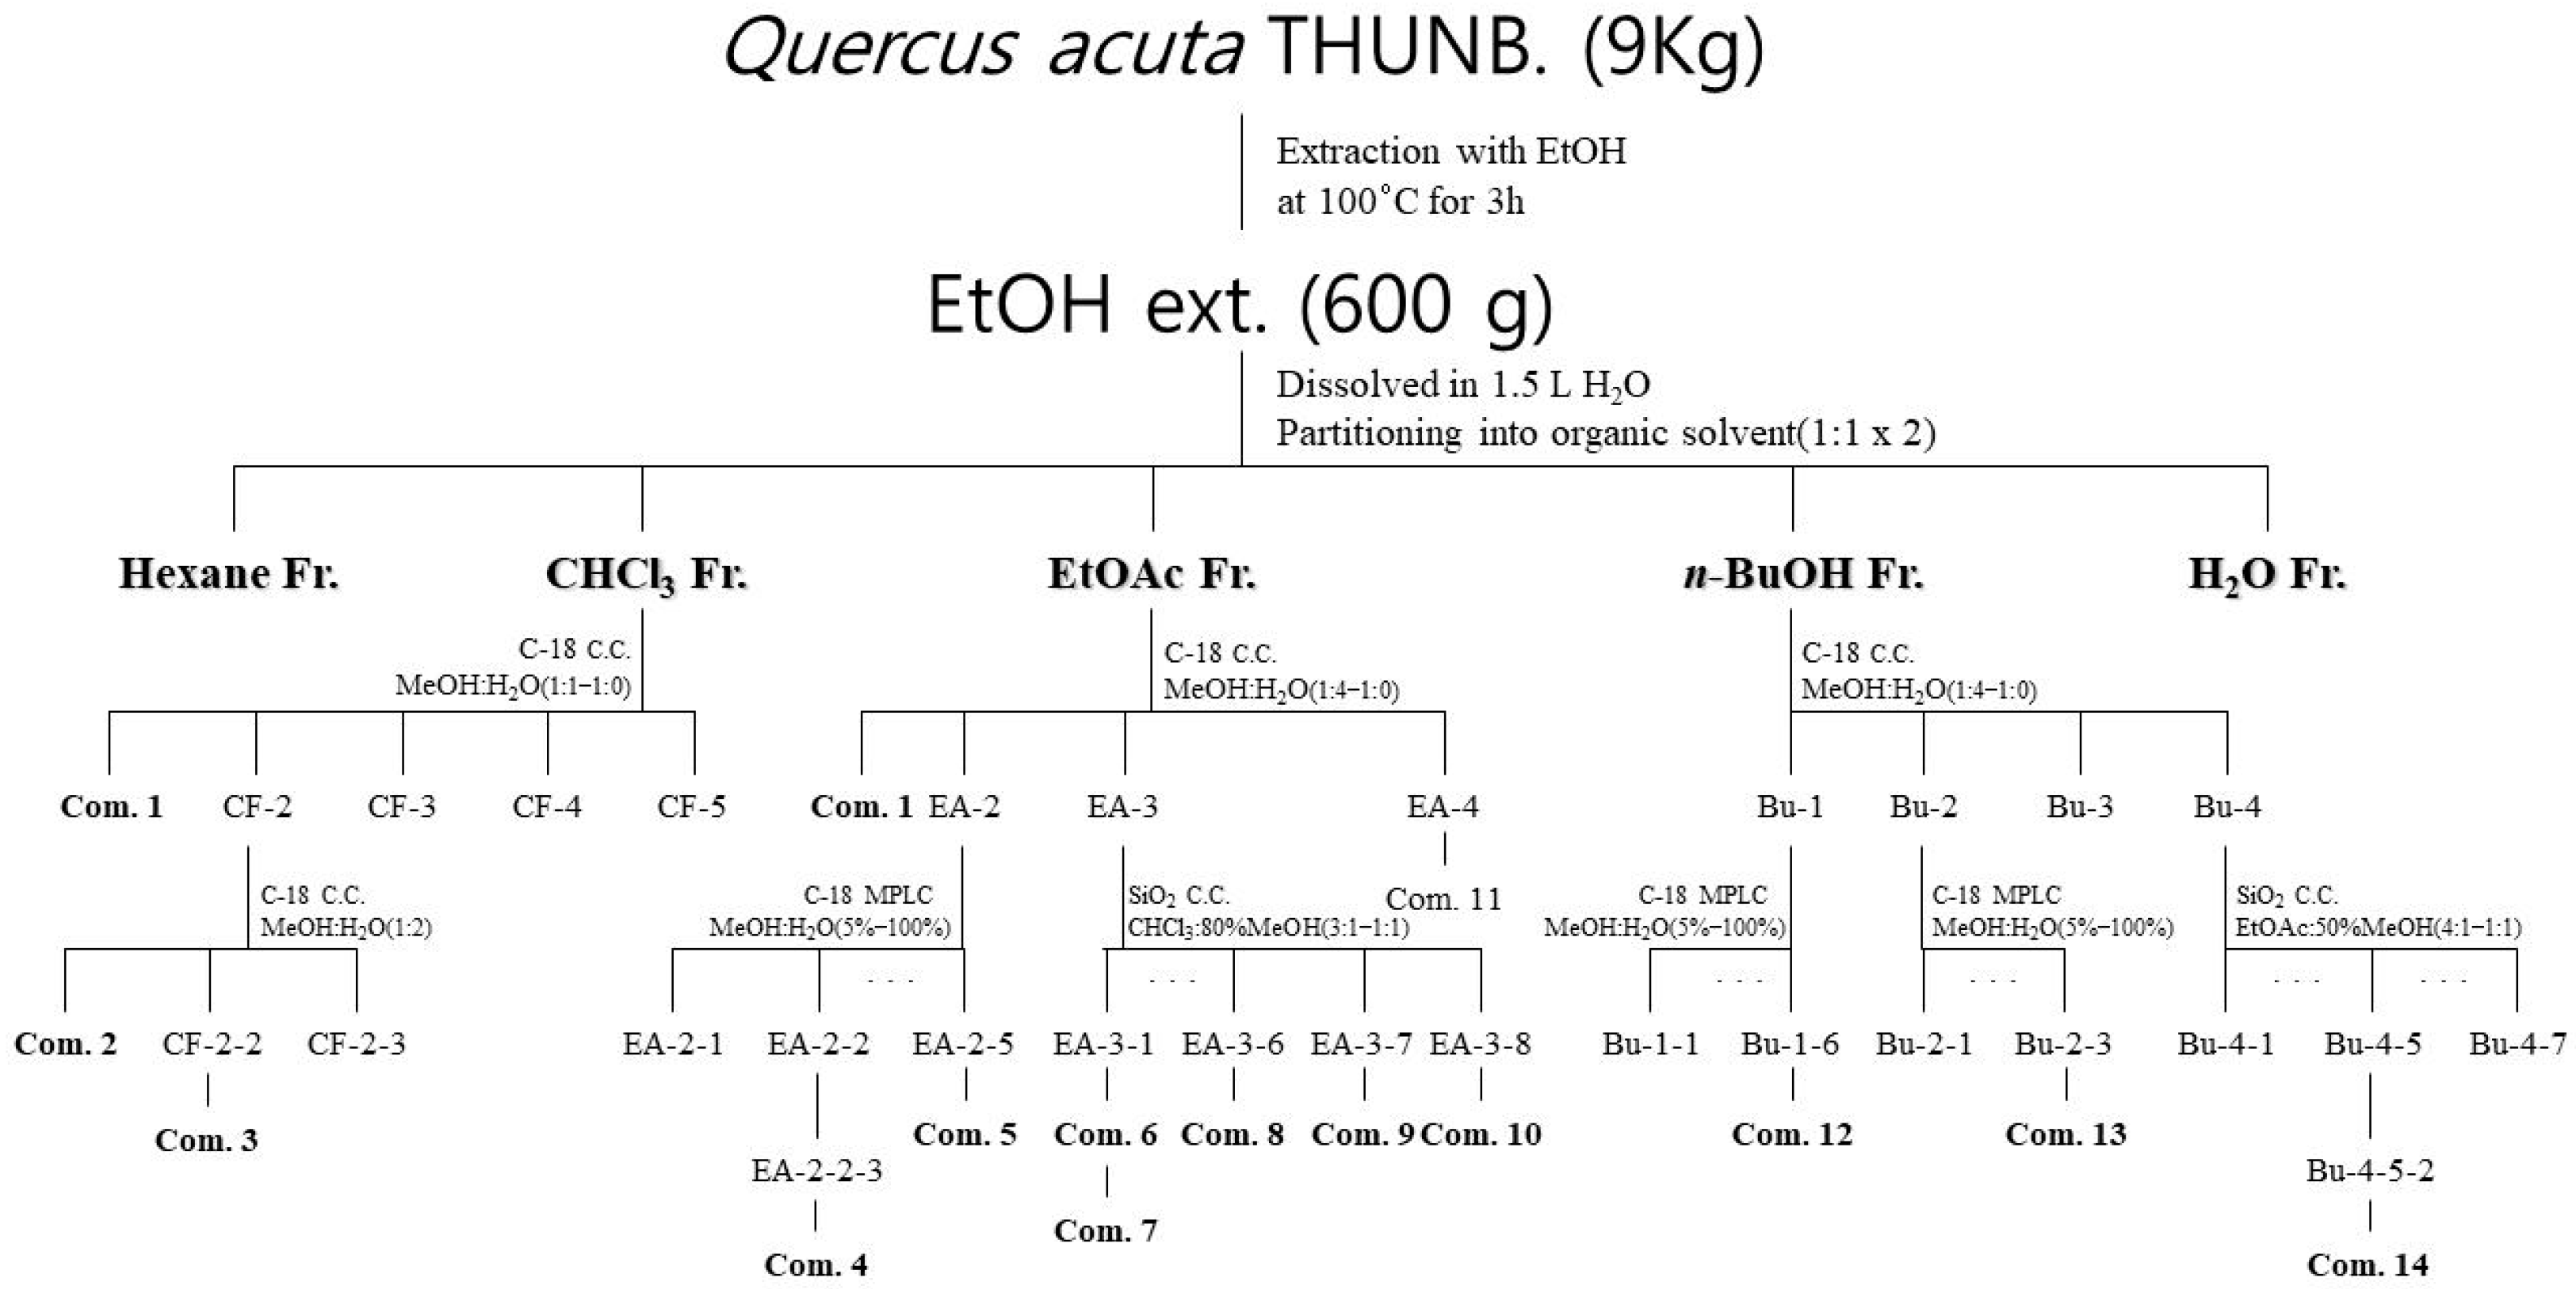
Guided by the nitrite inhibition effect and HPLC chromatogram results (Figure 3 and Figure S1), a total of 14 pure compounds were isolated from the CF, EA, and Bu fractions of the Q. acuta fruit extract (Figure 4).
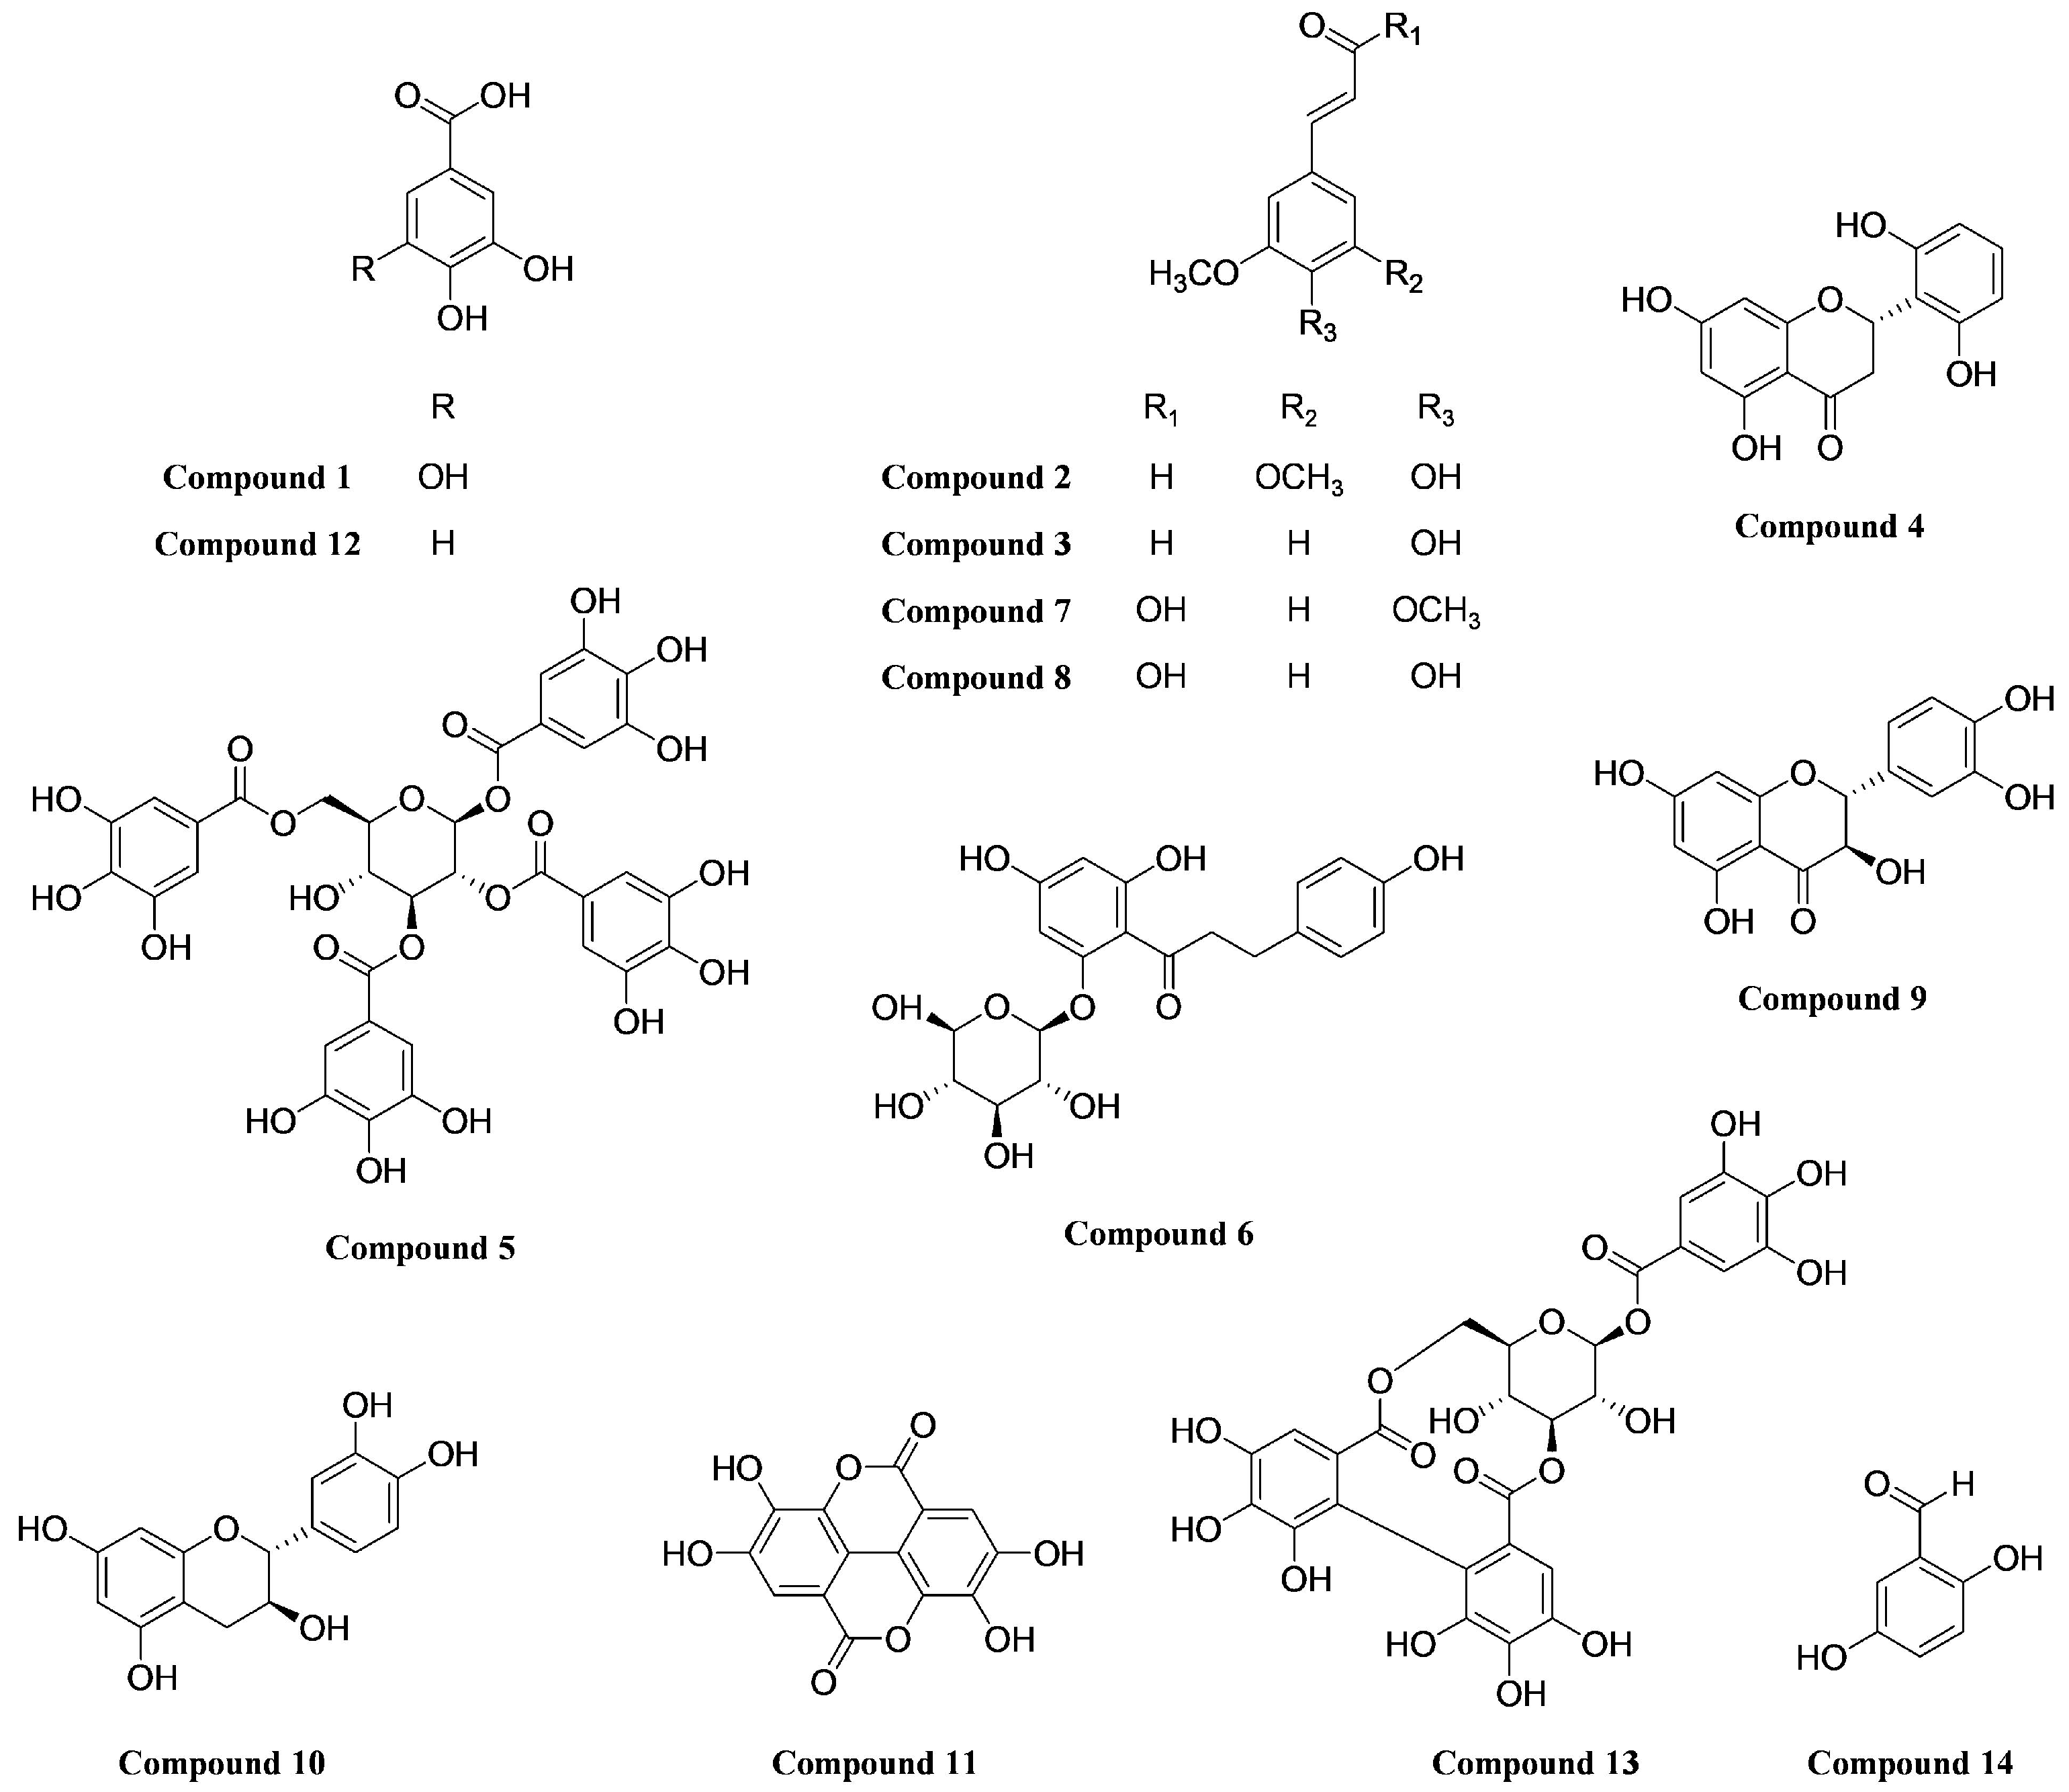
The chemical structures of the isolated compounds were determined through 1D and 2D NMR spectroscopic analyses and comparison with published spectral data (Figure 5).

2.5. Nitrite Inhibition by Isolated Compounds

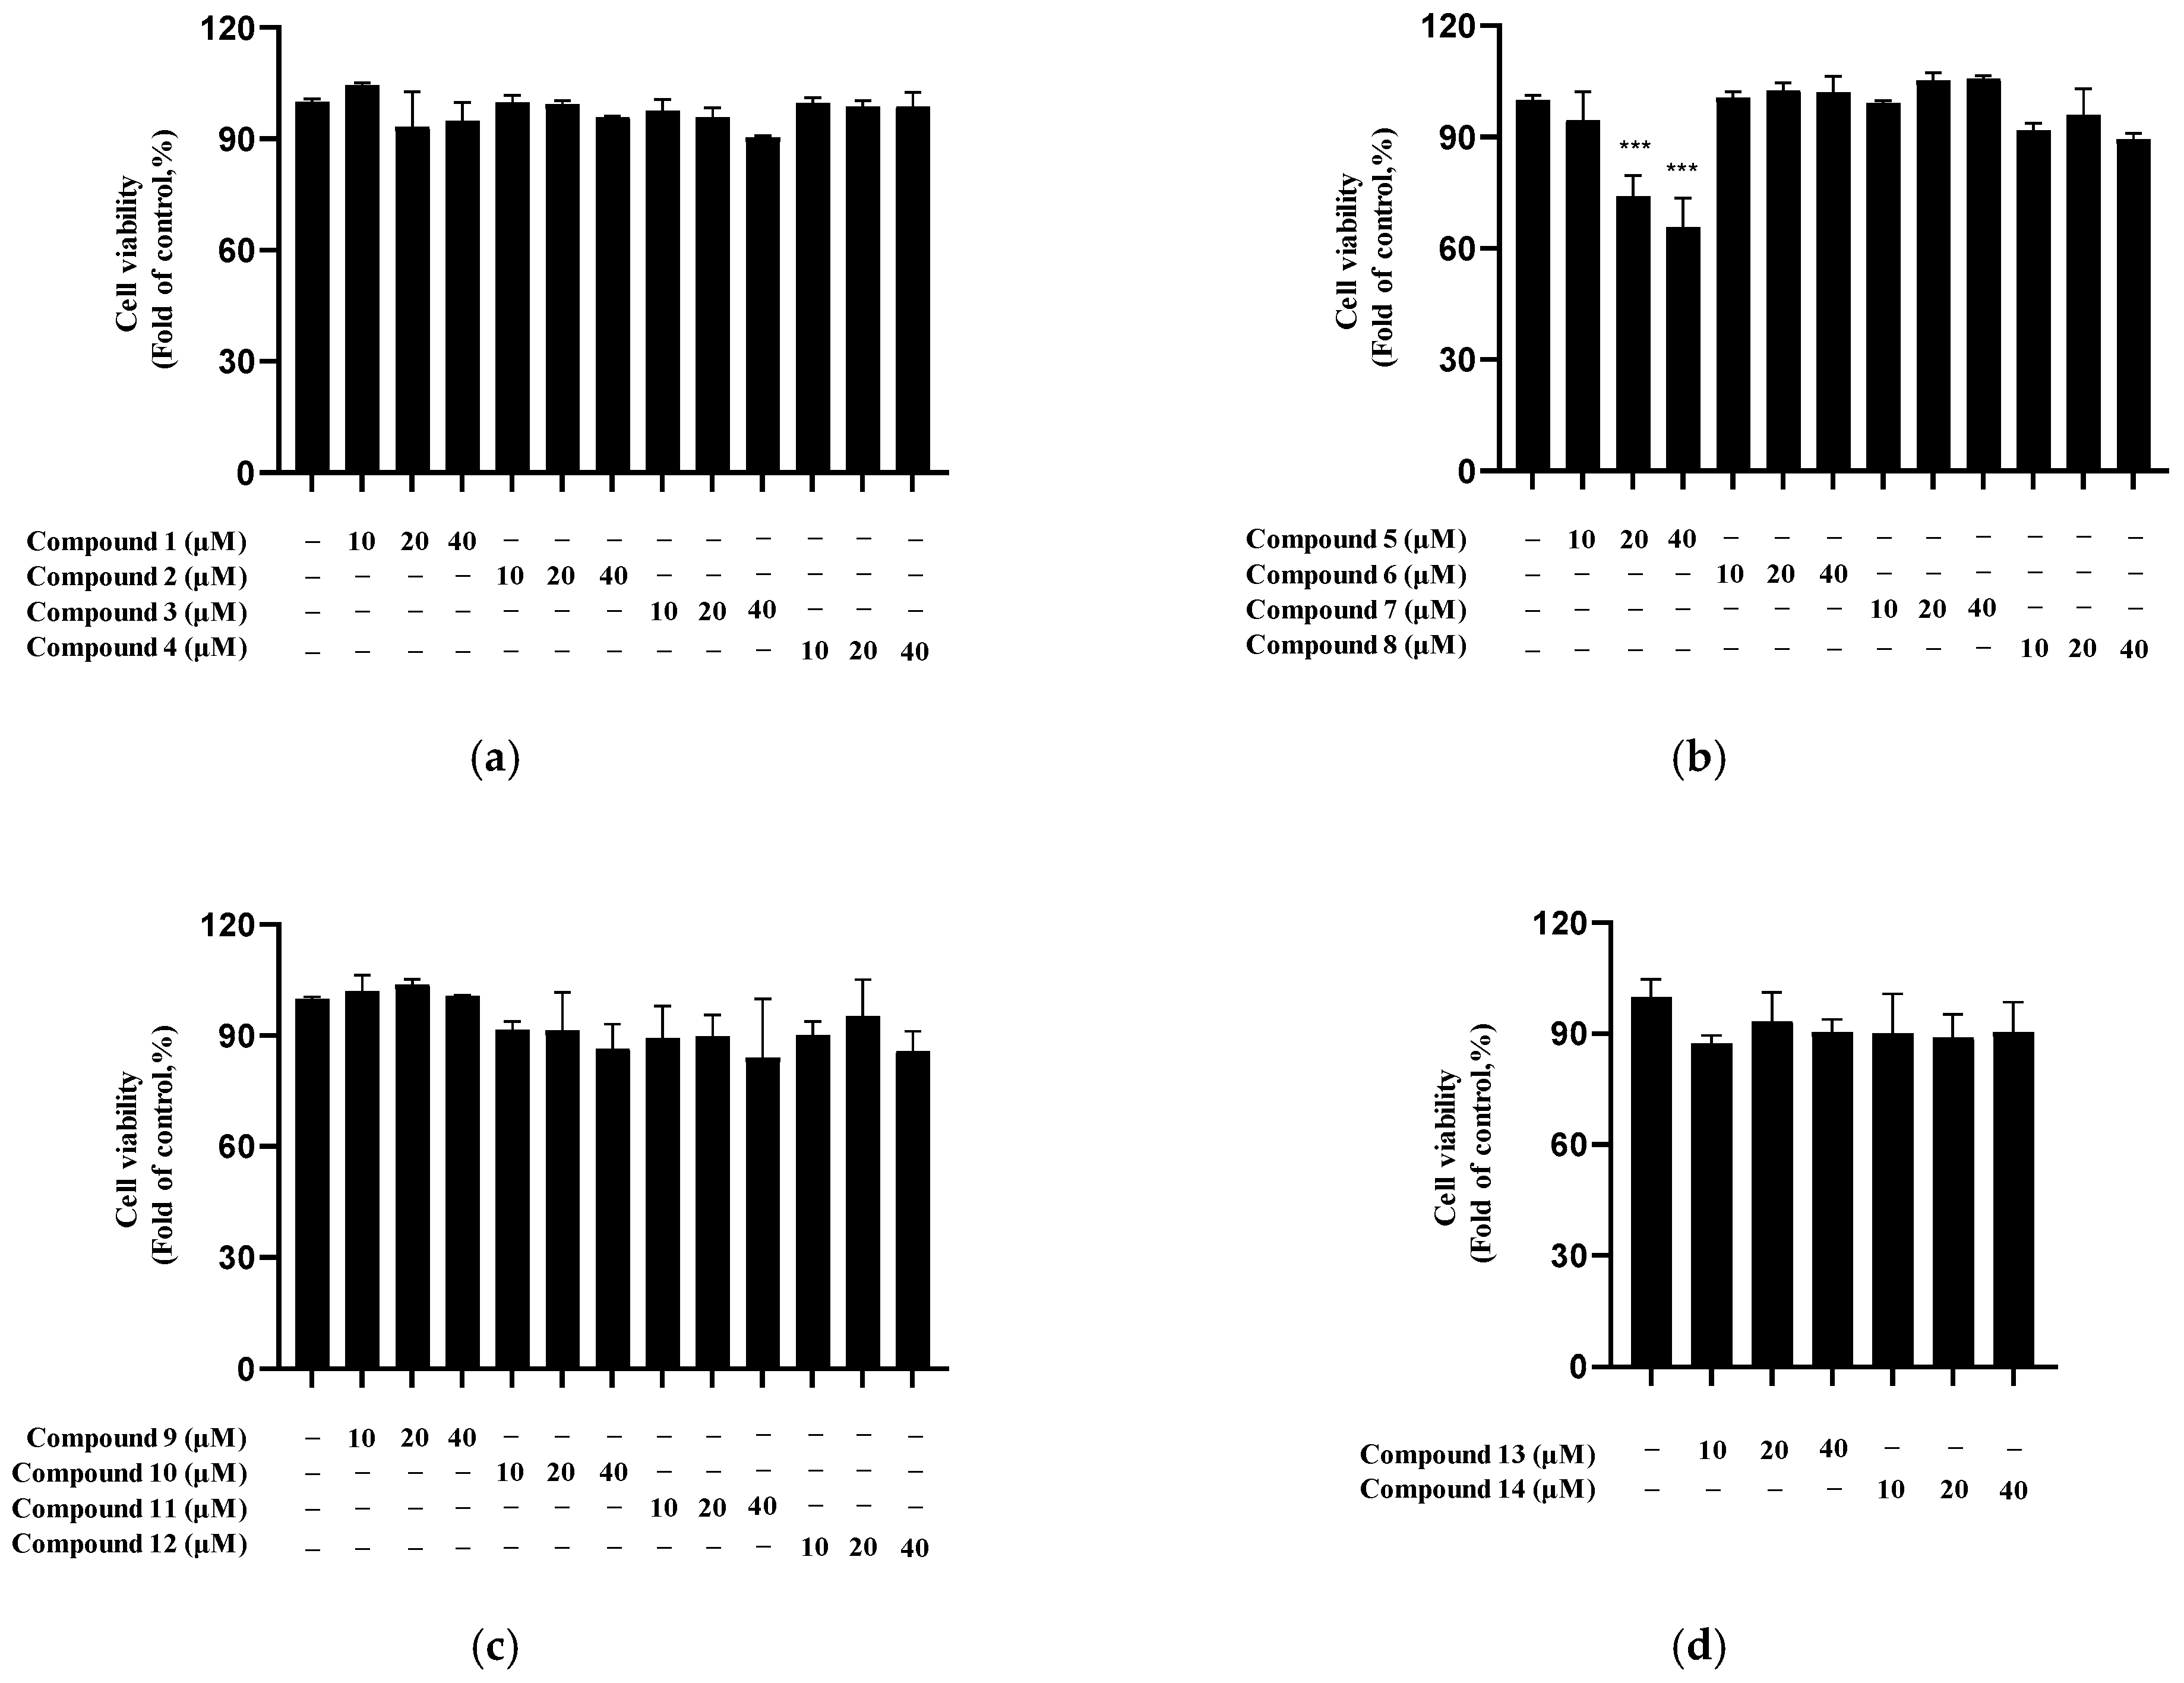
The cytotoxicity of the 14 isolated compounds was evaluated in BV2 microglia at concentrations up to 40 μM (Figure 6). Among the tested compounds, only compound 5 exhibited cytotoxicity at 20 and 40 μM, whereas the other compounds showed no significant toxicity under the experimental conditions.
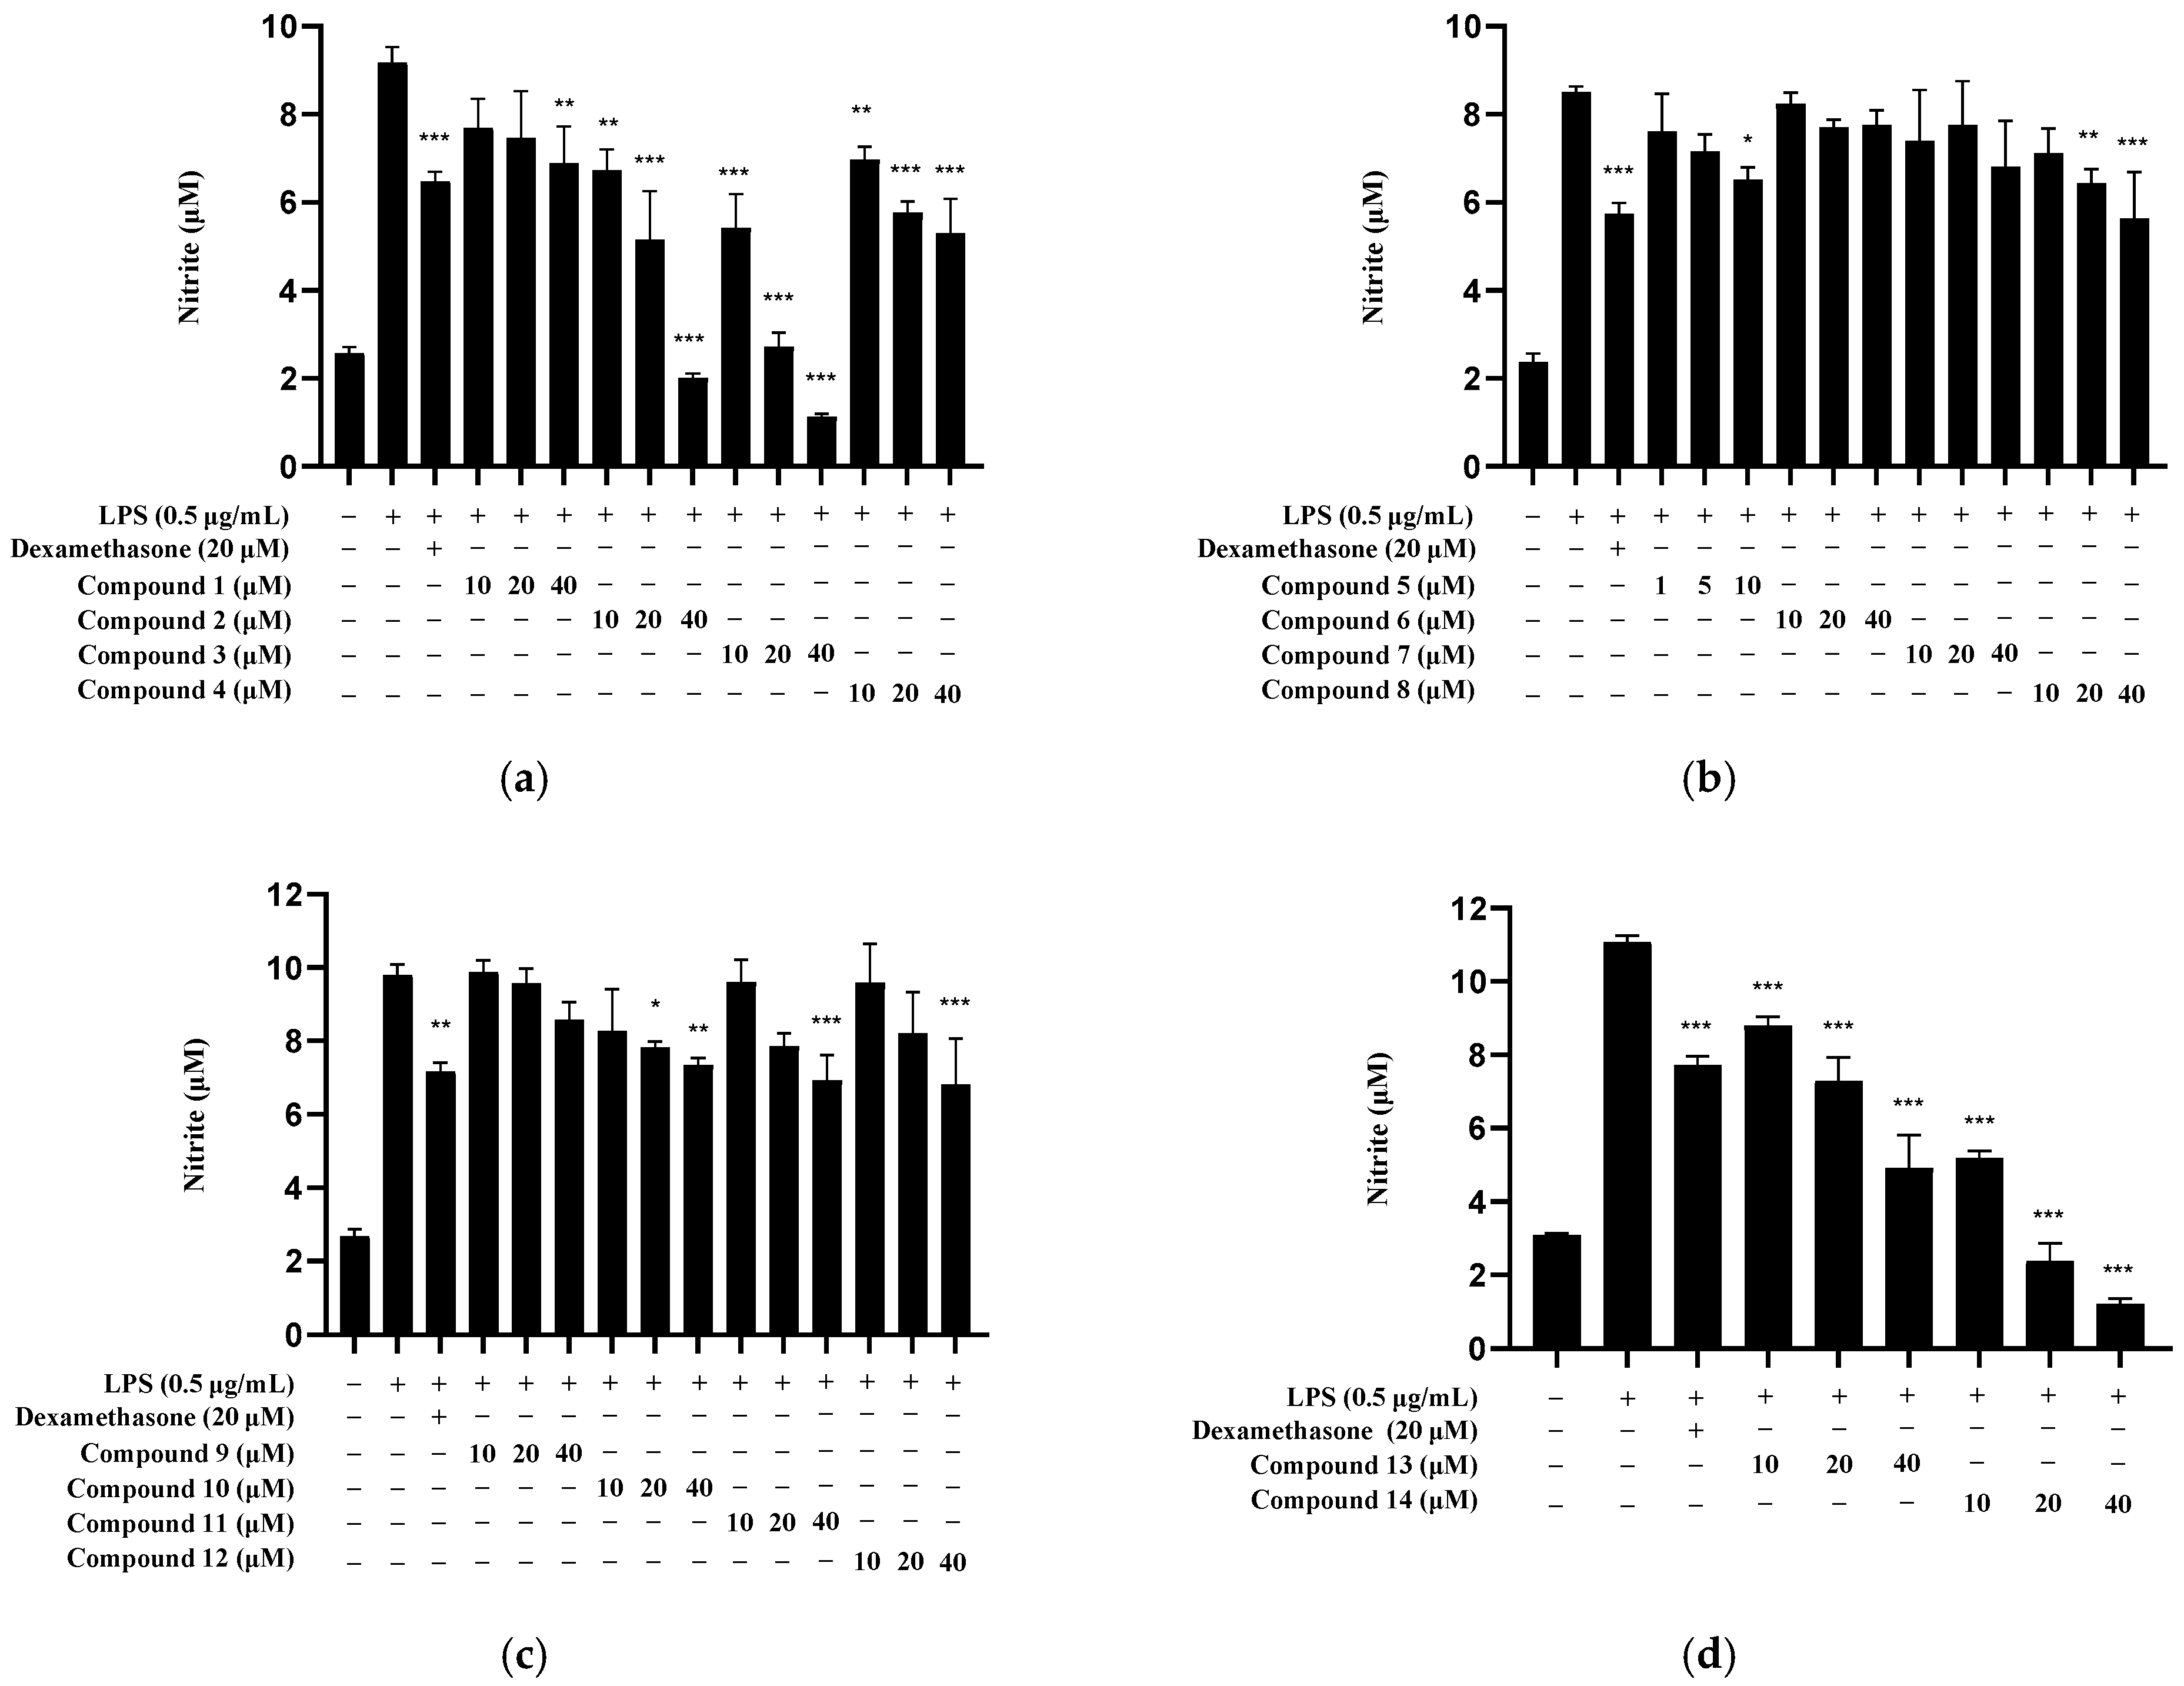
Based on the cytotoxicity results, the maximum concentration for further testing was set at 10 μM for compound 5 (1, 5, and 10 μM) and at 40 μM for all other compounds (10, 20, and 40 μM). Each compound was used at three different concentrations to evaluate its inhibitory effect on nitrite production in LPS-induced BV2 microglia (Figure 7). Among the active compounds, compounds 2, 3, 4, 13, and 14 exhibited IC50 values within the non-toxic concentration (Table 2). These IC50 values were 13.68 ± 2.38 μM for compound 2, 9.96 ± 3.03 μM for compound 3, 22.55 ± 0.77 μM for compound 4, 19.60 ± 1.53 μM for compound 13, and 7.41 ± 1.40 μM for compound 14.

2.6. Inhibitory Effect of Compounds 4 and 16 on Inflammatory Cytokine Production

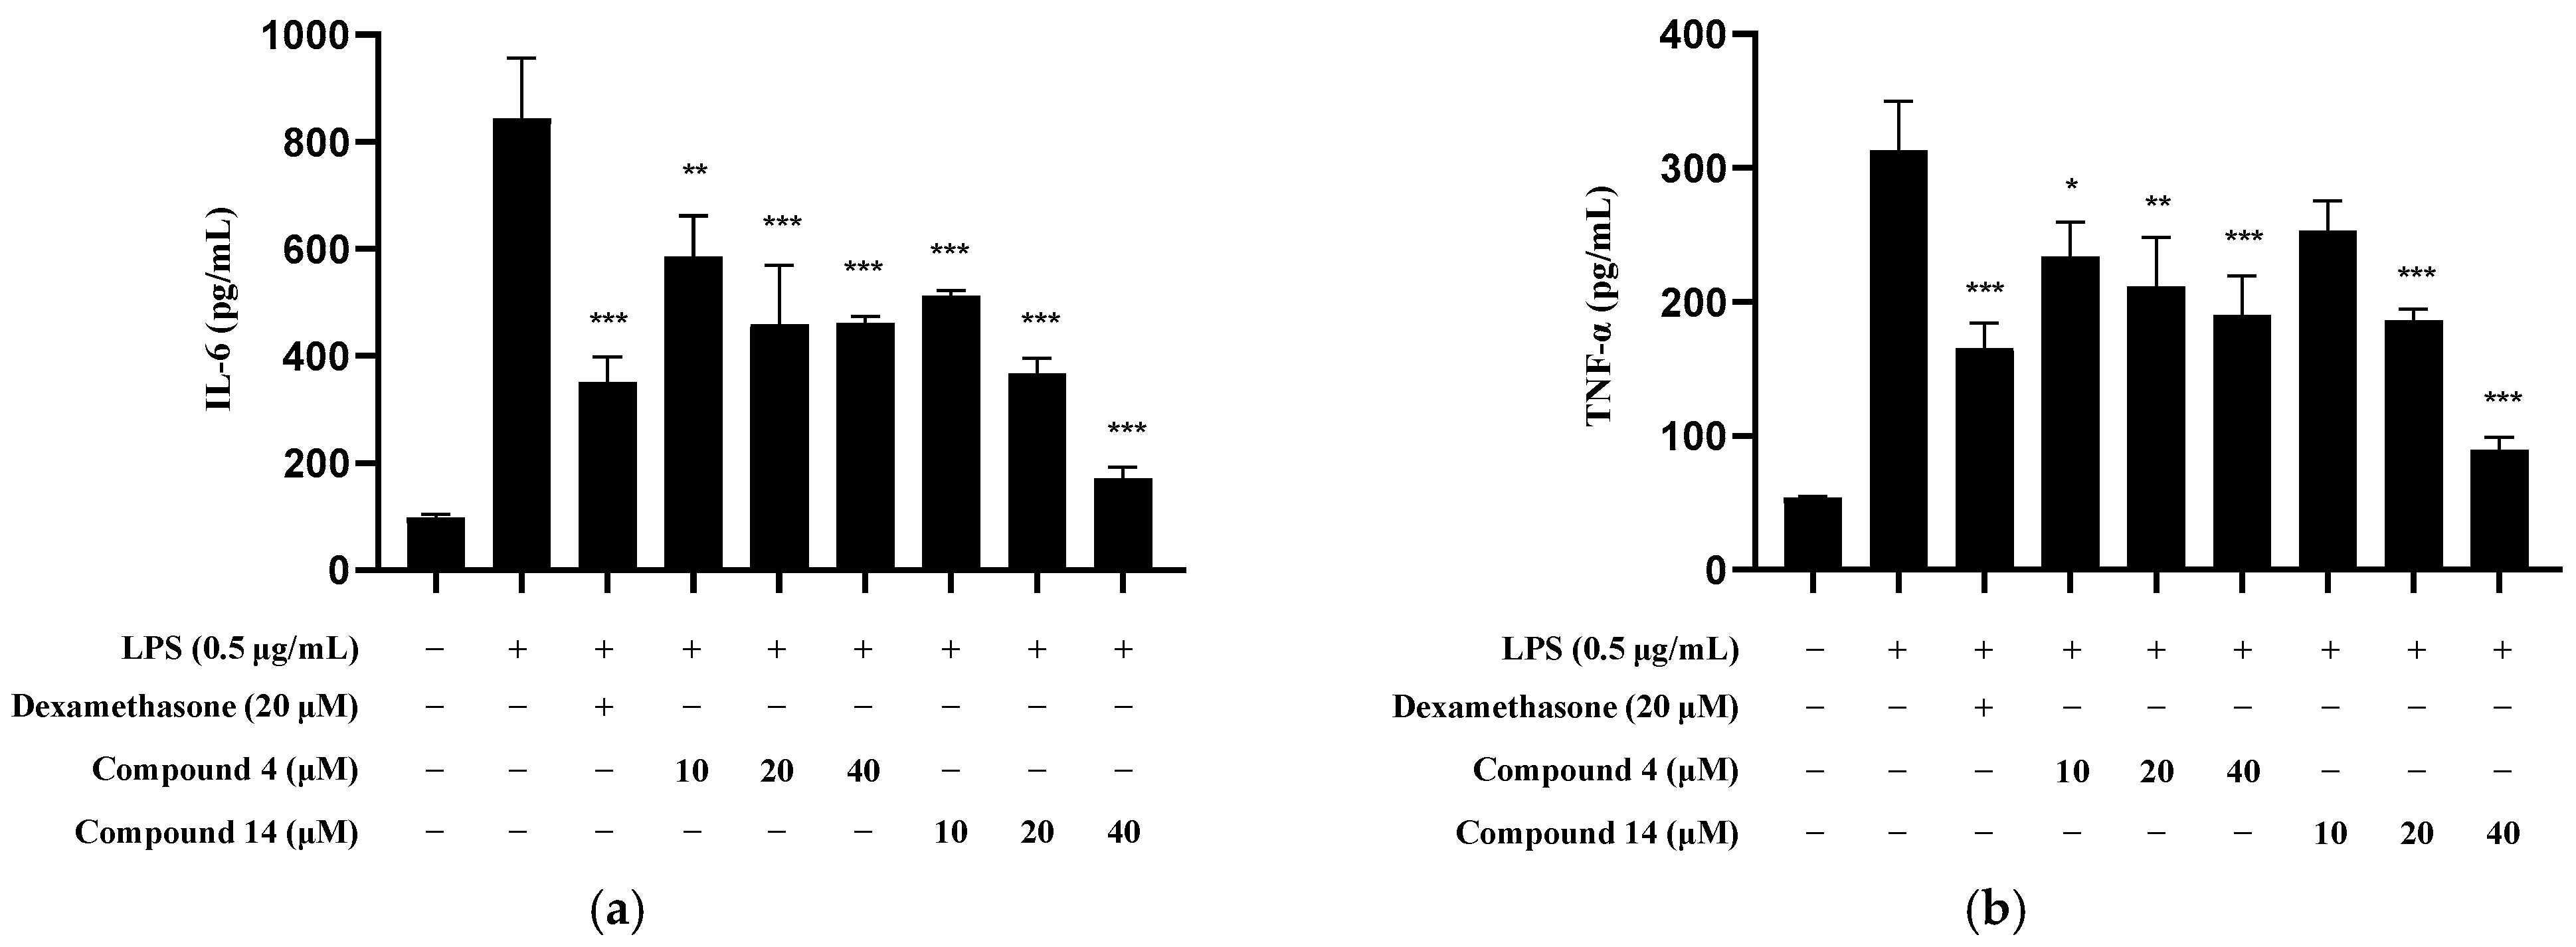
Among the five compounds that showed IC50 values under non-toxic conditions, compounds 2, 3, and 13 were previously reported to exhibit anti-neuroinflammatory effects [3,4,5,15]. Therefore, compounds 4 (Figure 8a) and 14 (Figure 8b) were selected for further investigation. Our results showed that both compounds inhibited the production of IL-6 and TNF-α in LPS-induced BV2 microglia in a concentration-dependent manner.

2.7. Inhibition of iNOS and COX-2 Expression

To further investigate the mechanisms underlying the anti-neuroinflammatory effects of compounds 4 and 14, the expression levels of iNOS and COX-2 proteins were evaluated by Western blot analysis. LPS induction markedly increased the expression of both iNOS and COX-2 in BV2 microglia compared with that in untreated controls. Treatment with compounds 4 (Figure 9a–c) and 14 (Figure 9d–f) significantly reduced the LPS-induced upregulation of these enzymes. These findings indicate that both compounds attenuate the production of NO and prostaglandins by downregulating their key biosynthetic enzymes.

2.8. Inhibition of NF-κB Activation

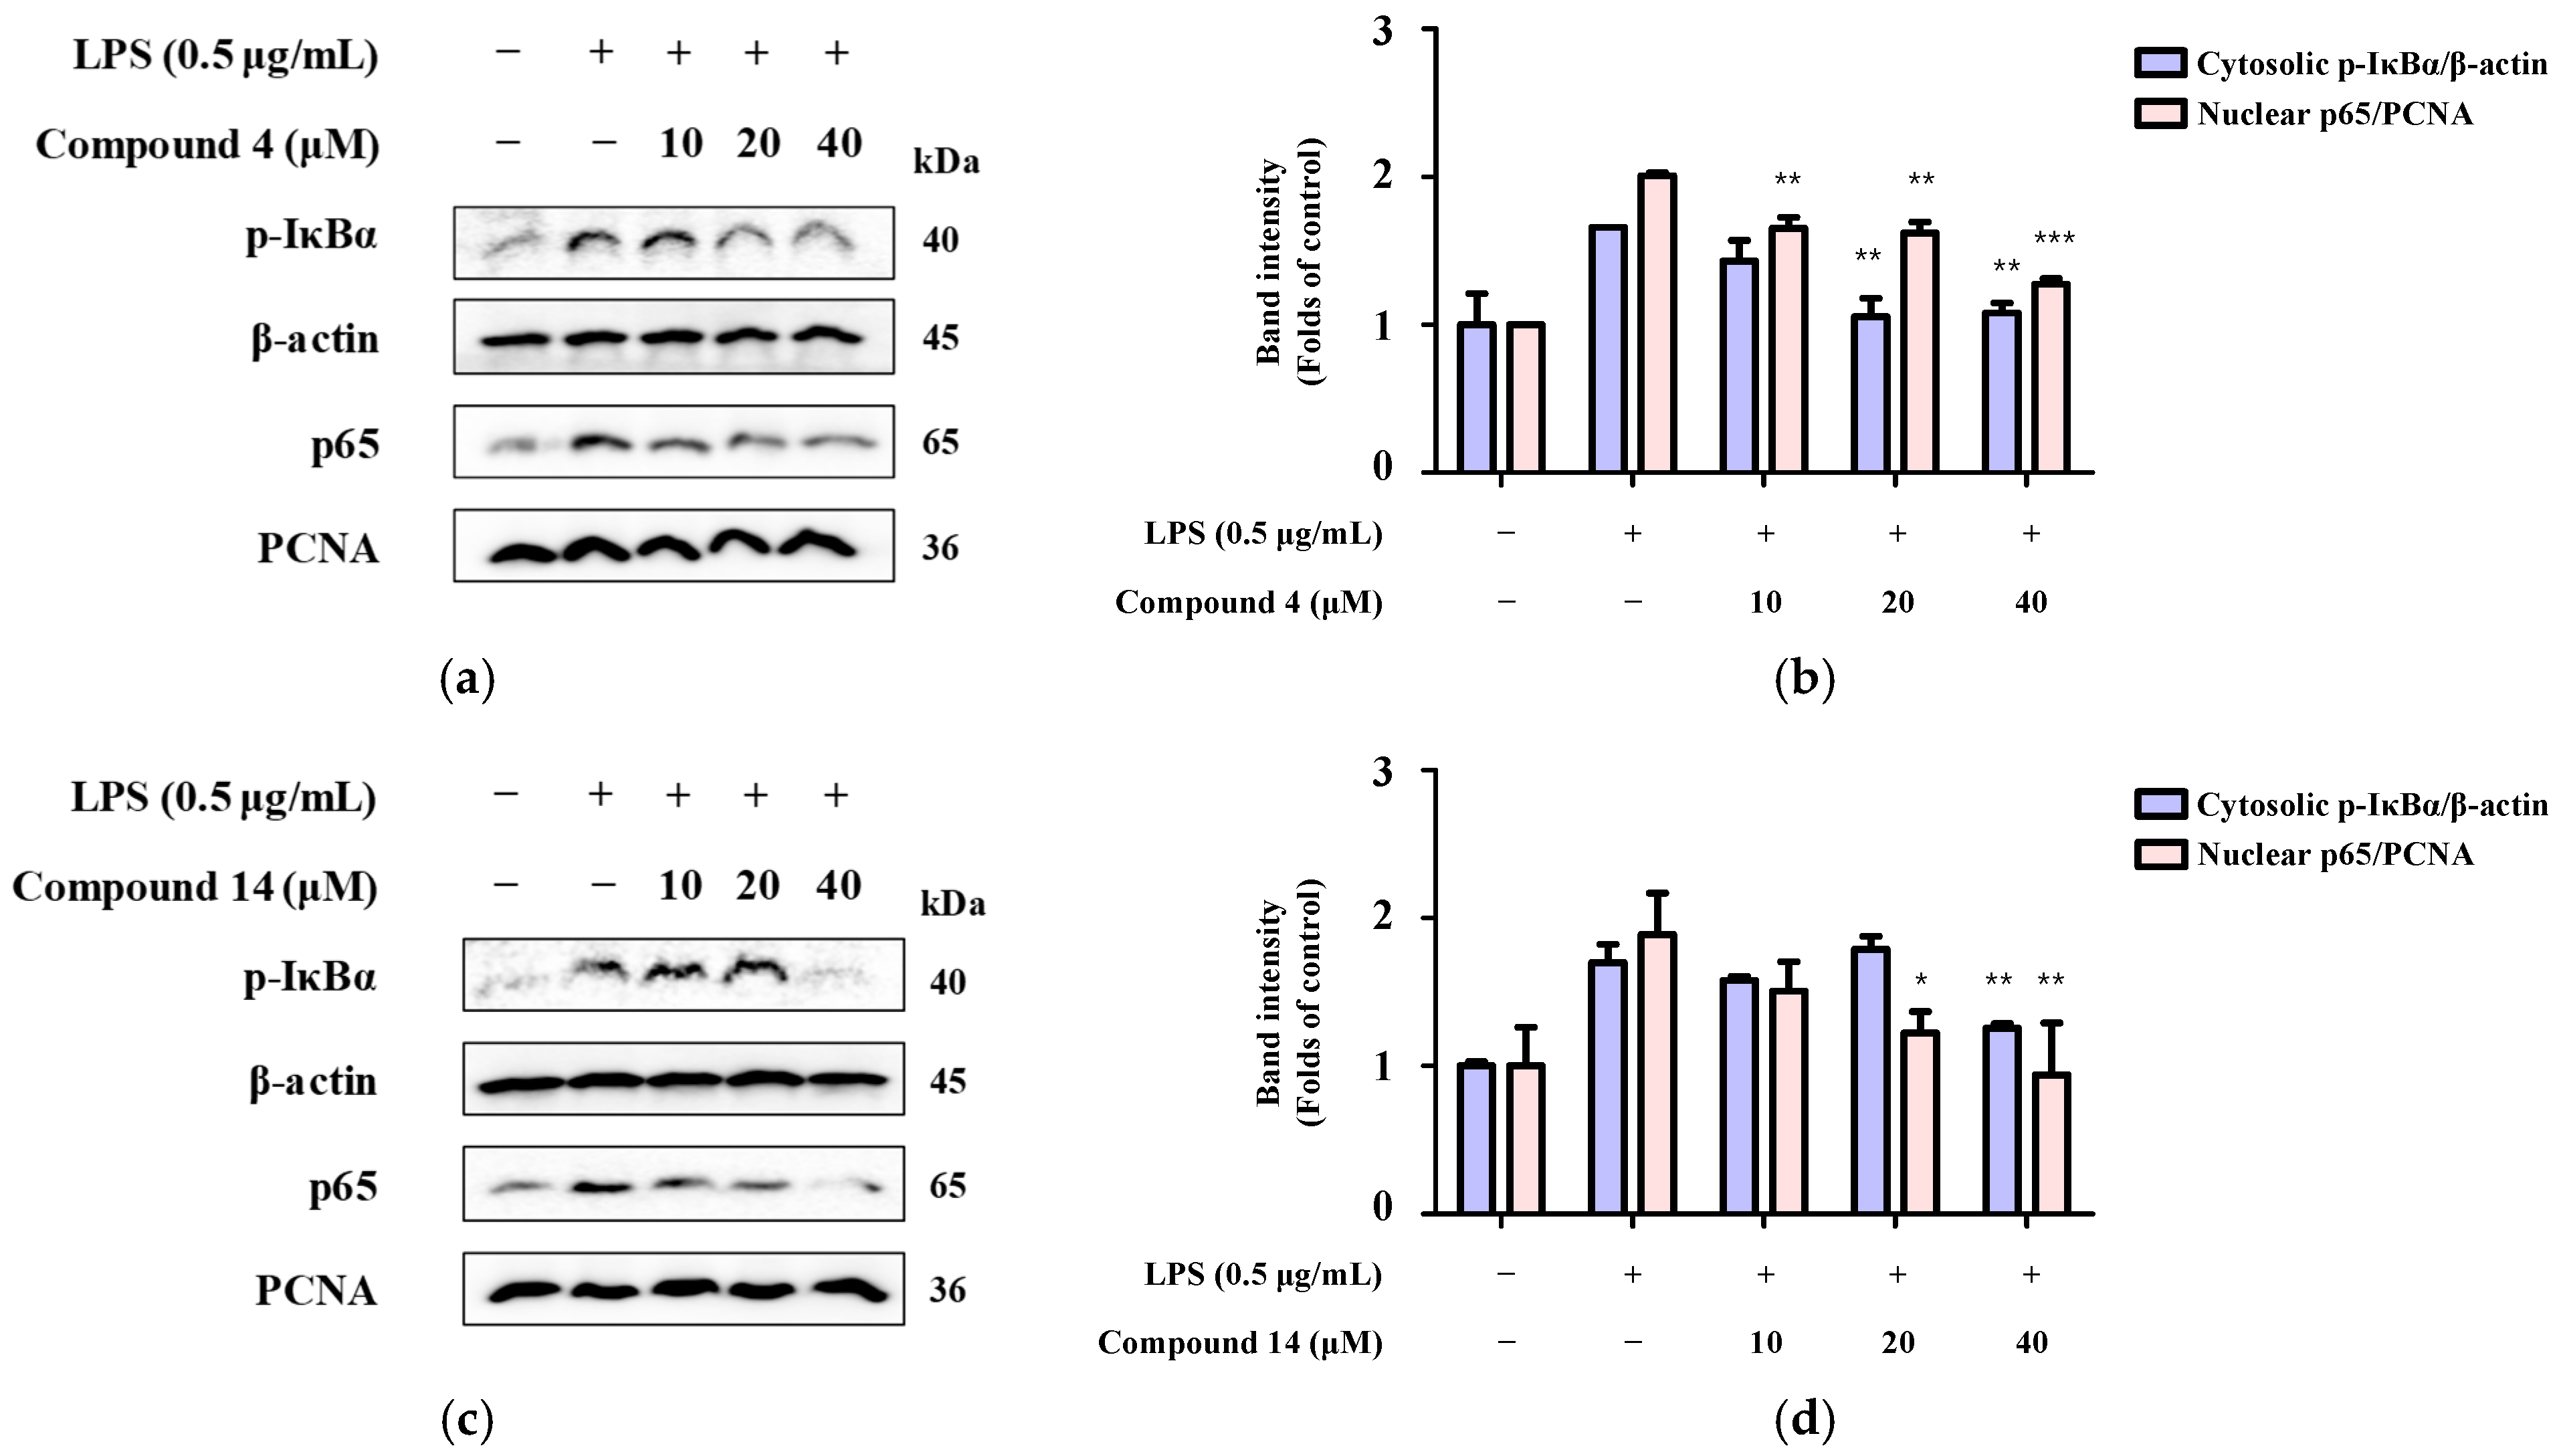
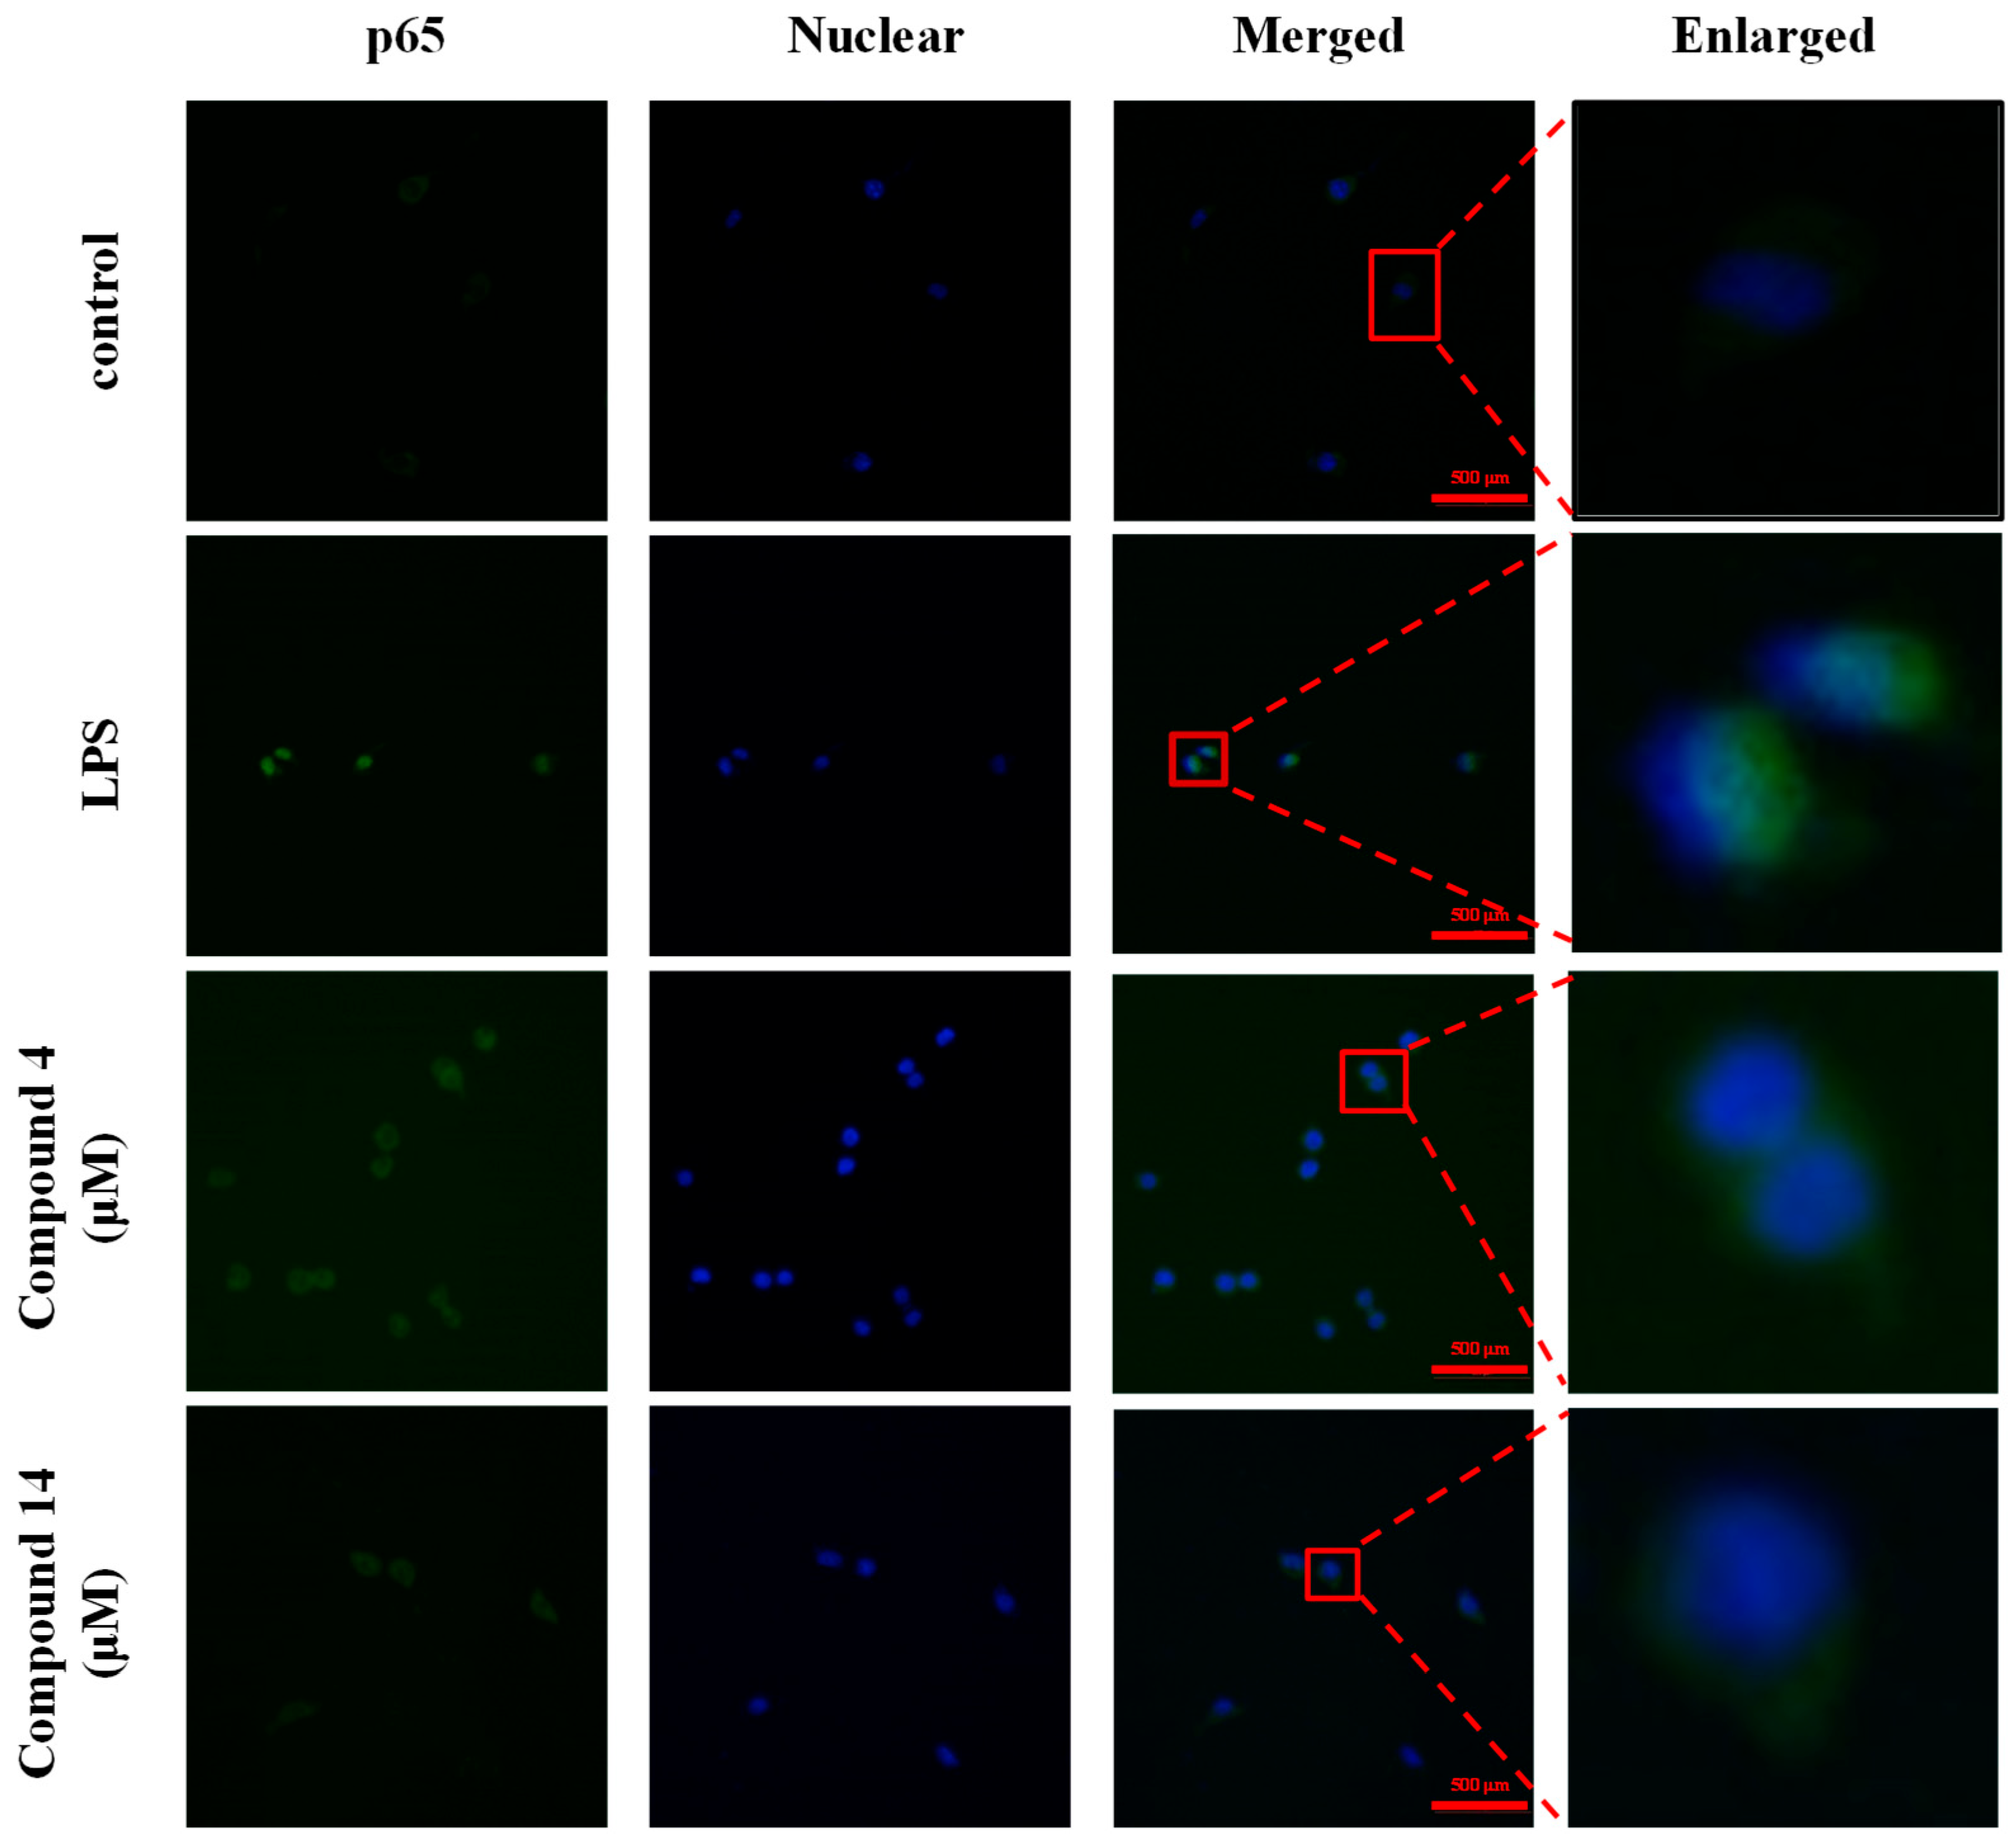
Given that NF-κB signaling plays a pivotal role in the induction of proinflammatory mediators, we examined whether compounds 4 and 14 influenced NF-κB activation. Our results showed that LPS induction markedly enhanced NF-κB activity, as demonstrated by the nuclear translocation of the p65 subunit, which was confirmed by Western blot analysis of cytoplasmic and nuclear protein fractions, and that cell treatment with compounds 4 (Figure 10a,b) and 14 (Figure 10c,d) inhibited this LPS-induced nuclear translocation of p65 in a concentration-dependent manner. In addition, we detected the nuclear translocation of p65 using immunofluorescence, which further demonstrated the inhibitory effects of compounds 4 and 14 on p65 translocation into the nucleus (Figure 11). These results indicate that both compounds exert anti-neuroinflammatory effects, at least in part, through the inhibition of NF-κB activation.

3. Discussion

The genus Quercus has long been recognized for its pharmacological potential, particularly with respect to anti-inflammatory, antioxidant, and antimicrobial activities. Previous phytochemical studies of Q. acuta, a species native to East Asia, have primarily focused on leaves, stem, and bark, with tannins and galloyl derivatives identified as important contributors to the biological activity of these plant organs. In contrast, the fruits of Q. acuta have remained largely unexplored in terms of chemical composition and pharmacological efficacy. To our knowledge, this study provides the first evidence that compounds isolated from Q. acuta fruits possess anti-neuroinflammatory activity.
Metabolite profiling using UHPLC-HR-MS/MS revealed that the extract was particularly rich in phenolic compounds. This result suggested that solvent-solvent partitioning, rather than size exclusion, had to be used as a separation method, as phenolic compounds are readily fractionated based on polarity. Similar to the profiling results, most of the isolated compounds belonged to the phenolic family. We then conducted a literature search of previously identified anti-neuroinflammatory effects of the isolated compounds. As expected, some compounds had previously been reported to have anti-neuroinflammatory effects (Table 3).
Subsequently, those isolated compounds that inhibited nitrite production and had not previously been reported to exhibit anti-neuroinflammatory effects were selected for further activity evaluation. Notably, 3,5,7,2′,6′-pentahydroxyflavanone and 2,5-dihydroxybenzaldehyde emerged as the most active constituents. Both compounds significantly suppressed nitrite accumulation in LPS-induced BV2 microglia, indicating their potential as novel anti-neuroinflammatory agents. Further mechanistic analysis revealed that these compounds attenuated the expression of iNOS and COX-2 and reduced the production of inflammatory mediators, including IL-6 and TNF-α. Importantly, both metabolites inhibited NF-κB activation by blocking the nuclear translocation of the p65 subunit, indicating that their anti-neuroinflammatory effects are at least partly mediated through suppression of NF-κB-dependent signaling. While additional upstream regulators (e.g., MAPK pathways or ROS-dependent mechanisms) may also be involved, this remains to be clarified in future studies. Therefore, it is expected to be necessary to employ a specific NF-κB inhibitor and MAPK/ROS-related assays in future studies to clarify the precise upstream mechanisms underlying these anti-neuroinflammatory effects. Although this study was conducted using the BV2 microglial cell model, future validation in primary or human-derived microglia would further strengthen these findings.
In summary, this study demonstrates that Q. acuta fruit is a source of 3,5,7,2′,6′-pentahydroxyflavanone and 2,5-dihydroxybenzaldehyde, compounds with previously unknown anti-neuroinflammatory effects. These results demonstrate the potential of Q. acuta fruit as a sustainable natural resource for the development of preventative or therapeutic agents for age-related neuro-inflammatory diseases and may contribute to a broader understanding of the pharmacological properties of the genus Quercus.

4. Materials and Methods

4.1. Chemicals, Solvents, and Instruments

Reagent-grade solvents were employed for extractions and column chromatography (CC). LiChroprep® RP-18 resin and silica gel (Merck, Darmstadt, Germany) were used for CC. UHPLC-HR-MS/MS analyses were conducted on a Thermo Vanquish system coupled to a Thermo Q-Exactive mass spectrometer (Thermo Dionex, Sunnyvale, CA, USA). NMR spectra were recorded on a JEOL JNM ECP-400 spectrometer (400 MHz for 1H, 100 MHz for 13C; JEOL Ltd., Akishima, Japan) using chloroform-d, acetone-d6, DMSO-d6, and methanol-d4 (Cambridge Isotope Laboratories, Andover, MA, USA). HPLC purification was performed on a Waters e2695 system with a semiprep-C18 column (10 × 250 mm, 5 μm) at 2 mL/min.

4.2. Plant Materials

Fruits of Q. acuta Thunb. were collected from Wando County, Jeollanam-do, Republic of Korea, and preserved at the Natural Resources Laboratory of the Jeonnam Bio Foundation (JBF), Republic of Korea (voucher specimen: JBF1201). The plant material was taxonomically identified by Dr. Yonguk Kim, an expert in plant identification at the JBF.

4.3. Cell Culture and Reagents

BV2 microglia were routinely cultured in RPMI-1640 medium supplemented with 10% heat-inactivated fetal bovine serum (FBS) and an antibiotic–antimycotic solution (Thermo Fisher Scientific, Waltham, MA, USA) under standard conditions (37 °C, 5% CO2, humidified incubator). Culture plates were obtained from Corning (Amsterdam, The Netherlands), and unless otherwise stated, all other reagents were purchased from Sigma-Aldrich (St. Louis, MO, USA).
Cytotoxicity was assessed by the MTT assay. BV2 cells were seeded in 48-well plates at a density of 5 × 10⁴ cells per well and allowed to adhere overnight. The next day, cells were treated with different concentrations of the test compounds for 24 h. Subsequently, MTT solution (5 mg/mL) was added, and cells were further incubated for 4 h to allow the formation of formazan crystals. After carefully discarding the supernatant, the crystals were solubilized with dimethyl sulfoxide (DMSO), and absorbance was determined at 540 nm using a microplate reader (Molecular Devices, San Jose, CA, USA). Dexamethasone served as positive control.

4.4. Metabolite Profiling Analysis

Metabolite profiling was performed using a Thermo Vanquish UHPLC system (Thermo Fisher Scientific, Sunnyvale, CA, USA) equipped with a CORTECS T3 column (2.1 × 150 mm, 1.6 μm; Waters Technologies, Milford, MA, USA); it was maintained at 45 °C. The mobile phases consisted of solvent A (0.1% formic acid in water, v/v) and solvent B (0.1% formic acid in acetonitrile, v/v). The gradient program was as follows: 0–0.5 min, 3% B; 0.5–15 min, 15% B; 15–40 min, 75% B; 40–41 min, 100% B; 41–45 min, 100% B; 45–45.1 min, 3% B; and 45.1–50 min, 3% B. The flow rate was 0.25 mL/min, the injection volume was 3 μL, and the sample was prepared by dissolving Q. acuta extract in ethanol at 20 mg/mL.
High-resolution mass spectrometry (HRMS) was performed on a Thermo Q Exactive mass spectrometer (Thermo Fisher Scientific, Bremen, Germany) equipped with a heated electrospray ionization (H-ESI) source, operated in both positive and negative ion modes. The MS source parameters were as follows: spray voltage, 3500 V (positive mode) and 3000 V (negative mode); sheath gas, 50 (arbitrary units); auxiliary gas, 10 (arbitrary units); sweep gas, 1 (arbitrary unit); and ion transfer tube temperature, 320 °C. Full MS scans were acquired at a resolution of 35,000 (m/z 200) over a mass range of m/z 100–1500. Data-dependent MS/MS spectra were acquired at a resolution of 17,500 with a TopN of 10 and stepped normalized collision energies (NCE) of 10, 30, and 50 eV. Data acquisition and processing were performed using Elements Viewer version 2.1.

4.5. Compound Extraction and Isolation

Dried fruits of Q. acuta (9 kg) were extracted with 70% EtOH (9 L) at 100 °C for 3 h. The extract was filtered and evaporated under reduced pressure to yield a crude extract (600 g) that was dissolved in distilled water (1.5 L). The solution was then partitioned successively with n-hexane (1.5 L × 2), chloroform (1.5 L × 2), ethyl acetate (1.5 L × 2), and n-butanol (1.5 L × 2). Each organic layer was evaporated under reduced pressure to obtain n-hexane (QA-Hx, 11.5 g), chloroform (QA-CF, 7.2 g), ethyl acetate (QA-EA, 24.4 g), n-butanol (QA-Bu, 28.6 g), and an aqueous fraction (QA-H2O, 218.7 g).
First, 5 g of the QA-CF fraction was fractionated by C18 CC (MeOH:H2O, 1:1–1:0) using a bioassay guidance to obtain five subfractions (QA-CF-1–5). Among these, QA-CF-1 was purified to yield compound 1 (QA-CF-1, 51.7 mg, purity 97.84%). Next, the QA-CF-2 fraction, which showed purification potential using UV at 254 nm as determined by TLC analysis, was fractionated using C18 CC under isocratic system (MeOH:H2O, 1:2), yielding three subfractions (QA-CF-2-1–3). Among them, QA-CF-2-1 was purified to obtain compound 2 (QA-CF-2-1, 21.5 mg, purity 96.29%), whereas QA-CF-2-2 was purified to obtain compound 3 (QA-CF-2-2-1, 12.2 mg, purity 96.81%).
The QA-EA fraction (10 g) was then fractionated by C18 CC (MeOH:H2O, 1:4–1:0) to obtain five subfractions (QA-EA-1–5). Among these subfractions, QA-EA-2 and QA-EA-3 were confirmed to have anti-inflammatory properties through bioassay guidance. Therefore, QA-EA-2 was further separated into five subfractions (QA-EA-2-1–5) using MPLC with a C18 column (MeOH:H2O, 0.05:0.95–1:0). QA-EA-2-2 was further divided into five subfractions (QA-EA-2-2-1–5), among which QA-EA-2-2-3 was purified by preparative HPLC (MeOH:H2O, 1:4–1:0) to yield compound 4 (QA-EA-2-2-3-3, 6.9 mg, purity 95.57%). Subsequently, QA-EA-2-5 was purified by C18 CC (MeOH:H2O, 1:9–1:1) to yield compound 5 (QA-EA-2-5-1, 80.0 mg, purity 95.04%). QA-EA-3 was fractionated by SiO2 CC (CHCl3:80% MeOH, 3:1–1:1) to obtain eight subfractions (QA-EA-3-1–8). Among these subfractions, QA-EA-3 was purified by C18 preparative HPLC to yield compound 6 (QA-EA-3-1-1, 6.1 mg, purity 97.97%) and compound 7 (QA-EA-3-1-2, 7.2 mg, purity 99.54%). Fractions QA-EA-3-6 and QA-EA-3-7, which were readily detectable under UV at 254 nm in TLC analysis, were purified by C18 preparative LC to yield compound 8 (QA-EA-3-6-3, 11.0 mg, purity 98.31%) and compound 9 (QA-EA-3-7-2, 51.5 mg, purity 95.48%). In addition, QA-EA-8 was purified by SiO2 CC (EtOAc:50% MeOH, 3:1–1:1) to yield compound 10 (QA-EA-3-8-1, 7.1 mg, purity 96.79%) and QA-EA-5 was purified by C18 preparative LC to yield compound 11 (QA-EA-5-1, 4.7 mg, purity 98.79%).
The QA-Bu fraction (20 g) was then purified by C18 CC (MeOH:H2O, 1:4–1:0), yielding five subfractions (QA-Bu-1–5). QA-Bu-1 was further purified by MPLC with a C18 column (MeOH:H2O, 0.1:0.9–1:0) to obtain six subfractions (QA-Bu-1-1–6). Among these subfractions, QA-Bu-1-6 was purified by C18 preparative HPLC to yield compound 12 (QA-Bu-1-6-1, 6.1 mg, purity 97.92%), while QA-Bu-2 was purified by MPLC (C18 column) to obtain three subfractions (QA-Bu-2-1–3), and QA-Bu-2-3 was further purified by C18 preparative LC to yield compound 13 (QA-Bu-2-3-2, 10.1 mg, purity 96.83%). Next, QA-Bu-4 was purified by SiO2 CC (EtOAc:50% MeOH, 4:1–1:1) under gradient systems to yield seven subfractions (QA-Bu-4-1–7). Among them, QA-Bu-4-5 was further separated by SiO2 CC (EtOAc:50% MeOH, 4:12:1) to yield four subfractions (QA-Bu-4-5-1–4), and QA-Bu-4-5-2 was purified by C18 preparative HPLC to yield compound 14 (QA-Bu-4-5-2-2, 5.8 mg, purity 96.07%). Overall, all purified compounds reached a final purity of ≥95%, as confirmed by HPLC (Figures S44 and S45).
Isolated compounds were further identified through NMR as follows. NMR spectra were recorded in CDCl3, CD3OD, acetone-d6, or DMSO-d6 depending on the solubility and spectral quality of each compound.
Gallic acid (compound 1): 1H NMR (400 MHz, methanol-d4) δ 7.05 (2H, s, H-2, H-6). 13C NMR (100 MHz, methanol-d4) δ 170.7 (C-7), 146.5 (C-3, C-5), 139.4 (C-4), 122.9 (C-1), 110.4 (C-2, C-6) [50] (Figures S2–S5).
Sinapaldehyde (compound 2): 1H NMR (400 MHz, acetone-d6) δ 9.62 (1H, d, J = 7.6 Hz, H-9), 7.94 (1H, s, Ar–OH), 7.55 (1H, d, J = 15.6 Hz, H-7), 7.06 (2H, s, H-2, H-6), 6.69 (1H, dd, J = 15.6, 7.6 Hz, H-8), 3.88 (6H, s, 2xOCH3). 13C NMR (100 MHz, acetone-d6) δ 193.0 (C-9), 153.6 (C-7), 148.2 (C-3, C-5), 139.4 (C-4), 126.5 (C-8), 125.3 (C-1), 106.5 (C-2, C-6), 55.9 (10-OCH3, 11-OCH3) [51] (Figures S6 and S7).
Coniferaldehyde (compound 3): 1H NMR (400 MHz, chloroform-d) δ 9.65 (1H, d, J = 7.6 Hz, H-9), 7.42 (1H, d, J = 16.0 Hz, H-7), 7.13 (1H, m, H-6), 6.97 (1H, d, J = 8.4 Hz, H-5), 6.62 (1H, dd, J = 15.6, 7.6 Hz, H-8), 3.94 (3H, s, OCH3). 13C NMR (100 MHz, chloroform-d) δ: 193.8 (C-9), 153.3 (C-7), 149.0 (C-3), 147.0 (C-5), 126.5 (C-1), 124.2 (C-6), 115.0 (C-5), 109.5 (C-2), 56.1 (OCH3) [50] (Figures S8 and S9).
3,5,7,2′,6′-Pentahydroxyflavanone (compound 4): 1H NMR (400 MHz, acetone-d6) δ 11.83 (1H, s, 5-OH), 9.63 (1H, s, 3-OH), 8.57 (1H, s, 2′-OH, 6′-OH), 7.02 (1H, t, J = 8.4 Hz, H-4′), 6.45 (2H, d, J = 8.0 Hz, H-3′, H-5′), 5.95 (1H, d, J = 2.0 Hz, H-8), 5.90 (1H, d, J = 2.4 Hz, H-6), 5.81 (1H, d, J = 12.0 Hz, H-2), 5.51 (1H, dd, J = 12.4, 4.0 Hz, H-3). 13C NMR (100 MHz, acetone-d6) δ 198.9 (C-4), 166.6 (C-7), 164.4 (C-5), 164.3 (C-9), 158.1 (C-2′, C-6′), 130.3 (C-4′), 109.8 (C-1′), 107.4 (C-3′, C-5′), 100.8 (C-10), 95.9 (C-6), 95.0 (C-8), 76.0 (C-2), 69.5 (C-3) [52] (Figures S10 and S11).
1,2,3,6-Tetrakis-O-galloyl-β-D-glucose (compound 5): 1H NMR (400 MHz, methanol-d4) δ 7.11 (2H, s, H-2, 6 of galloyl-O-6), 7.02 (2H, s, H-2, 6 of galloyl-O-2&3), 7.01 (2H, s, 2H, s, H-2, 6 of galloyl-O-2&3), 6.92 (2H, s, 2H, s, H-2, 6 of galloyl-O-1), 6.09 (1H, d, J = 7.6 Hz, H-1), 5.59–5.55 (1H, m, H-5), 5.45–5.41 (1H, m, H-2), 4.61 (1H, dd, J = 12.4, 2.0 Hz, H-6α), 4.53 (1H, dd, J = 12.0, 4.0 Hz, H-6β), 4.02 (1H, dd, J = 7.6, 1.6 Hz, H-3), 3.97–3.93 (1H, m, H-4), 2.60 (3H, s). 13C NMR (100 MHz, methanol-d4) 166.9 (C-7 of galloyl-O-6), 166.4 (C-7 of galloyl-O-3), 165.9 (C-7 of galloyl-O-2), 165.0 (C-7 of galloyl-O-1), 145.2 (C-3, 5 of galloyl-O-1&2), 145.0 (C-3, 5 of galloyl-O-1&2), 139.4 (C-4 of galloyl-O-1), 138.9 (C-4 of galloyl-O-2), 138.6 (C-4 of galloyl-O-3&6), 119.9 (C-1 of galloyl-O-6), 119.6 (C-1 of galloyl-O-1), 119.1 (C-1 of galloyl-O-2), 118.5 (C-1 of galloyl-O-3), 109.2 (C-2, 6 of galloyl-O-1), 109.1 (C-2, 6 of galloyl-O-2&3), 109.0 (C-2, 6 of galloyl-O-2&3), 108.7 (C-2, 6 of galloyl O-6), 92.6 (C-1), 75.3 (C-5), 75.1 (C-3), 71.0 (C-2), 68.3 (C-4), 62.7 (C-6) [53] (Figures S12–S17).
Phlorizin (compound 6): 1H NMR (400 MHz, methanol-d4) δ 7.06 (2H, d, J = 8.8 Hz, H-3′, H-5′), 6.67 (2H, d, J = 8.8 Hz, H-2′, H-6′), 6.16 (1H, d, J = 2.4 Hz, H-3), 5.94 (1H, d, J = 2.4 Hz, H-5), 5.03 (1H, d, J = 7.2 Hz, H-1″), 3.91 (1H, dd, J = 12.0, 2.0 Hz, H-6″α), 3.72 (1H, dd, J = 12.0, 5.6 Hz, H-6″β), 3.45 (2H, m, H-8), 3.17 (1H, m, H-3″), 3.15 (1H, m, H-2″), 3.12 (1H, m, H-5″), 2.86 (2H, t, J = 7.6 Hz, H-9). 13C NMR (100 MHz, methanol-d4) δ 205.2 (C-7), 166.3 (C-2), 164.7 (C-6), 161.0 (C-4), 155.0 (C-4′), 132.5 (C-1′), 129.1 (C-3′, C-5′), 114.7 (C-2′, C-6′), 105.4 (C-1), 100.7 (C-1″), 97.0 (C-3), 94.1 (C-5), 77.1 (C-3″), 77.1 (C-5″), 73.4 (C-2″), 69.7 (C-4″), 61.1 (C-6″), 45.7 (C-8), 29.5 (C-9) [54] (Figures S18 and S19).
3,4-Dimethoxycinnamic acid (compound 7): 1H NMR (400 MHz, DMSO-d6) δ 12.2 (1H, s, H-1), 7.51 (1H, d, J = 16.0 Hz, H-8), 7.28 (1H, d, J = 2.0 Hz, H-2′), 7.18 (1H, dd, J = 8.8, 2.0 Hz, H-6′), 6.95 (1H, d, J = 8.4 Hz, H-5′), 6.43 (1H, d, J = 16.0 Hz, H-7), 3.77 (3H, s, 3′-OCH3), 3.75 (3H, s, 4′-OCH3). 13C NMR (100 MHz, DMSO-d6) δ 168.5 (C-1), 151.3 (C-3′), 149.5 (C-4′), 144.7 (C-8), 127.6 (C-1′), 123.2 (C-6′), 117.2 (C-5′), 112.0 (C-7), 110.7 (C-2′), 56.1 (3′-OCH3), 56.1 (4′-OCH3) [55] (Figures S20 and S21).
Ferulic acid (compound 8): 1H NMR (400 MHz, chloroform-d) δ 7.73 (1H, d, J = 15.6 Hz, H-1′), 7.11 (1H, dd, J = 8.4, 2.0 Hz, H-5), 7.05 (1H, d, J = 2.0 Hz, H-3), 6.94 (1H, d, J = 8.0 Hz, H-6), 6.31 (1H, d, J = 16.0 Hz, H-2′), 3.98 (3H, s, OCH3). 13C NMR (100 MHz, chloroform-d) δ 171.5 (C-3′), 148.5 (C-1), 147.3 (C-6), 146.9 (C-1′), 126.7 (C-4), 123.7 (C-3), 114.9 (C-2′), 114.3 (C-2), 109.6 (C-5), 56.1 (OCH3) [56] (Figures S22 and S23).
Taxifolin (compound 9): 1H NMR (400 MHz, methanol-d4) δ 6.95 (1H, d, J = 2.0 Hz, H-2′), 6.84 (1H, dd, J = 8.4, 2.0 Hz, H-6′), 6.79 (1H, d, J = 8.0 Hz, H-5′), 5.90 (1H, d, J = 2.0 Hz, H-8), 5.87 (1H, d, J = 2.4 Hz, H-6), 4.91 (1H, d, J = 11.6 Hz, H-2), 4.50 (1H, d, J = 11.6 Hz, H-3). 13C NMR (100 MHz, methanol-d4) δ 197.1 (C-4), 167.4 (C-7), 164.0 (C-5), 163.2 (C-8a), 145.8 (C-4′), 145.0 (C-3′), 128.5 (C-1′), 119.6 (C-6′), 114.7 (C-2′), 114.5 (C-5′), 100.5 (C-4a), 96.0 (C-6), 94.9 (C-8), 83.8 (C-2), 72.3 (C-3) [57] (Figures S24 and S25).
Catechin (compound 10): 1H NMR (400 MHz, DMSO-d6) δ 9.13 (1H, s, 5-OH), 8.89 (1H, s, 7-OH), 8.82 (1H, s, 4′-OH), 8.82 (1H, s, 3′-OH), 6.69 (1H, d, J = 2.0 Hz, H-2′), 6.66 (1H, d, J = 8.0 Hz, H-5′), 6.57 (1H, dd, J = 8.4, 2.0 Hz, H-6′), 5.85 (1H, d, J = 2.0 Hz, H-8), 5.65 (1H, d, J = 2.4 Hz, H-6), 4.45 (1H, d, J = 7.6 Hz, H-2), 3.79 (1H, m, H-3), 2.65 (1H, dd, J = 3.6, 2.0 Hz, H-4α), 2.61 (1H, d, J = 8.0 Hz, H-4β). 13C NMR (100 MHz, DMSO-d6) δ 157.0 (C-5), 156.7 (C-7), 155.9 (C-8a), 145.4 (C-3′, C-4′), 131.1 (C-1′), 118.9 (C-6′), 115.6 (C-5′), 115.0 (C-2′), 99.6 (C-4a), 95.6 (C-6), 94.3 (C-8), 81.5 (C-2), 66.8 (C-3), 28.4 (C-4) [58] (Figures S26 and S27).
Ellagic acid (compound 11): 1H NMR (400 MHz, DMSO-d6) δ 10.67 (1H, br, s, OH), 7.43 (2H, s, H-2, H-2′). 13C NMR (100 MHz, DMSO-d6) δ 159.7 (C-7, C-7′), 148.7 (C-4, C-4′), 140.1 (C-2, C-2′), 136.9 (C-3, C-3′), 112.9 (C-6, C-6′), 110.8 (C-5, C-5′), 108.2 (C-1, C-1′) [59] (Figures S28–S31).
Protocatechuic acid (compound 12): 1H NMR (400 MHz, methanol-d4) δ 7.42 (1H, s, H-5), 7.40 (1H, d, J = 2.0 Hz, H-2), 6.79 (1H, d, J = 8.4 Hz, H-6). 13C NMR (100 MHz, methanol-d4) δ 168.9 (C-7), 150.2 (C-4), 144.7 (C-3), 122.5 (C-1), 121.8 (C-5), 116.4 (C-6), 114.4 (C-2) [60] (Figures S32–S36).
Corilagin (compound 13): 1H NMR (400 MHz, acetone-d6) δ 7.10 (2H, s, Galloyl H-2, H-6), 6.82 (1H, s, HHDPa-H), 6.67 (1H, s, HHDPb-H), 6.35 (1H, s, H-1), 4.97 (1H, t, H-6a), 4.82 (1H, m, H-3), 4.52 (1H, m, H-5), 4.47 (1H, m, H-4), 4.10 (2H, m, H-2, H-6b). 13C NMR (100 MHz, acetone-d6) δ 167.8 (galloyl-C-7), 166.4 (HHDPa-C-7), 164.2 (HHDPb-C-7), 145.1 (Galloyl-C-3, C-4), 144.6 (HHPDb-C-3, C-4), 144.1 (HHPDa-C-3), 144.0 (HHPDa-C-4), 138.4 (Galloyl-C-1), 136.4 (HHPDa-C-1), 135.9 (HHPDb-C-1), 125.0 (HHPDa-C-2, HHPDb-C-2), 124.8 (HHPDa-C-5, HHPDb-C-5), 120.0 (HHDPa-C-6, HHDPb-C-6), 115.7 (HHDP-bridge C-1), 115.0 (HHDP-bridge C-2), 110.0 (Galloyl-C-2, C-6), 109.1 (HHDPa-CH), 107.3 (HHDPb-CH), 93.3 (C-1), 74.9 (C-5), 69.9 (C-3), 68.2 (C-2), 63.5 (C-6), 61.5 (C-4) [61] (Figures S37–S41).
2,5-Dihydroxybenzaldehyde (compound 14): 1H NMR (400 MHz, acetone-d6) δ 10.38 (1H, s, OH), 9.92 (1H, s, H-1), 8.36 (1H, s, 5-OH), 7.15 (1H, d, J = 0.4 Hz, H-6), 7.14 (1H, dd, J = 8.8, 3.2 Hz, H-4), 7.10 (1H, d, J = 3.2 Hz, H-3). 13C NMR (100 MHz, acetone-d6) δ 196.7 (C-1), 154.8 (C-2), 150.4 (C-5), 125.2 (C-1′), 121.0 (C-6), 118.0 (C-4), 117.5 (C-3) [62] (Figures S42 and S43).

4.6. Measurement of Nitrite Production

To induce inflammation in BV2 cells, we treated the cells with LPS (0.5 µg/mL) for 24 h, following conditions commonly used in previous studies, and then performed the subsequent experiments [63,64,65]. NO, a representative proinflammatory mediator, was quantified in LPS-induced BV2 microglia using the Griess reaction. This assay is based on the principle that nitrite (NO2), a stable metabolite of NO, reacts with sulfanilamide to generate a diazonium intermediate, which subsequently couples with N-(1-naphthyl) ethylenediamine to form a red azo dye [63,66]. The intensity of the color produced reflects the concentration of NO present in the sample. After BV2 cells were treated with the test extract, its fractions, or the isolated compounds under inflammatory conditions, culture supernatants were collected and mixed with an equal volume of Griess reagent (1:1). The absorbance of the resulting solution was measured at 570 nm using a microplate reader. Dexamethasone (20 μM), a well-known inhibitor of inflammatory responses, was employed as the positive control. The 50% inhibitory concentration (IC50) values were calculated using GraphPad Prism 9.5.0 software (GraphPad Software Inc., San Diego, CA, USA).

4.7. IL-6 and TNF-α Analysis

The secretion of the proinflammatory cytokines IL-6 and TNF-α was quantified in BV2 culture supernatants using ELISA kits obtained from BioLegend (San Diego, CA, USA), according to the supplier’s protocols. After exposure of BV2 cells to the test compounds under inflammatory conditions, culture media were harvested and assayed at 450 nm. The cytokine-suppressive effect of dexamethasone was used as the positive control.

4.8. Western Blot Analysis

The expression of inflammation-related proteins, including iNOS, COX-2, nuclear p65, and phosphorylated IκBα, was evaluated by Western blotting. LPS-induced BV2 cells were harvested and lysed in 20 mM Tris-HCl buffer (pH 7.4) supplemented with a protease inhibitor cocktail (0.1 mM phenylmethanesulfonyl fluoride, 5 μg/mL aprotinin, 5 μg/mL pepstatin A, and 1 μg/mL chymostatin). Protein concentrations were quantified using a protein assay dye reagent concentrate (#5000006; Bio-Rad Laboratories, Hercules, CA, USA). Equal amounts of protein (30 μg) were separated on 7.5–12% SDS-polyacrylamide gels and transferred to nitrocellulose membranes (Hybond ECL; Bio-Rad Laboratories). After blocking with 5% skim milk, membranes were sequentially incubated with specific primary antibodies followed by horseradish peroxidase (HRP)-conjugated secondary antibodies. Target proteins were visualized using enhanced chemiluminescence reagents (Pierce Biotechnology, Rockford, IL, USA) according to the manufacturer’s instructions.

4.9. NF-κB Localization and Immunofluorescence

To examine the intracellular localization of NF-κB, BV2 cells were seeded onto Lab-Tek II chamber slides (Thermo Fisher Scientific, Waltham, MA, USA). After 24 h of attachment, cells were pretreated with the test compound for 3 h and subsequently induced with LPS (0.5 μg/mL) for 30 min. The cells were then fixed with 4% paraformaldehyde, permeabilized with 0.1% Triton X-100, and blocked with 5% bovine serum albumin. Slides were incubated with a primary antibody against NF-κB p65, followed by a fluorophore-conjugated secondary antibody. Nuclei were counterstained with 4′,6-diamidino-2-phenylindole (DAPI). The stained cells were observed using a fluorescence microscope (Zeiss, Oberkochen, Germany), and images were captured for analysis of NF-κB nuclear translocation.

4.10. Statistical Analysis

All experimental results are expressed as the mean ± standard deviation (S.D.) of at least three independent replicates. Statistical significance was determined using one-way analysis of variance (ANOVA) followed by Tukey’s multiple comparison test. Data processing and graph generation were carried out with GraphPad Prism software, version 9.5.0.

5. Conclusions

In this study, 14 compounds from an ethanol extract of Quercus acuta fruits—which were chemically underexplored—were successfully isolated and structurally characterized. Among them, compound 4 (identified as 3,5,7,2′,6′-pentahydroxyflavanone) and compound 14 (identified as 2,5-dihydroxybenzaldehyde) were identified for the first time as inhibitors of neuro-inflammatory responses in BV2 microglia. Both compounds significantly reduced the production of NO and proinflammatory cytokines, downregulated iNOS and COX-2 expression, and suppressed NF-κB activation, indicating that their anti-neuroinflammatory effects are mediated, at least in part, through NF-κB-dependent pathways.
Collectively, our findings provide the first comprehensive account of bioactive constituents from the Q. acuta fruit and demonstrate the potential of this fruit as a promising natural resource for the development of novel therapeutic agents against neuro-inflammation and neurodegenerative diseases.

Supplementary Materials

The following supporting information can be downloaded at: https://www.mdpi.com/article/10.3390/molecules30234514/s1, Figures S1–S45: HPLC chromatograms of the ethanol extract and solvent fractions of Quercus acuta fruits are shown in Figure S1. The 1H, 13C, HSQC, and HMBC NMR spectra of gallic acid (1) in methanol-d4 are presented in Figures S2–S5. The 1H and 13C NMR spectra of sinapaldehyde (2) in acetone-d6 are shown in Figures S6 and S7, and those of coniferaldehyde (3) in chloroform-d are displayed in Figures S8 and S9. Figures S10 and S11 present the 1H and 13C NMR spectra of 3,5,7,2′,6′-pentahydroxyflavanone (4) in acetone-d6. Figures S12–S17 include the 1H, 13C, HMQC, HMBC, DEPT, and COSY spectra of 1,2,3,6-tetrakis-O-galloyl-β-D-glucose (5) in methanol-d4. The 1H and 13C NMR spectra of phlorizin (6) in methanol-d4 are provided in Figures S18 and S19. Figures S20 and S21 show the 1H and 13C NMR spectra of 3,4-dimethoxycinnamic acid (7) in DMSO-d6, and Figures S22 and S23 display those of ferulic acid (8) in chloroform-d. Figures S24 and S25 present the 1H and 13C NMR spectra of taxifolin (9) in methanol-d4, while Figures S26 and S27 show those of catechin (10) in DMSO-d6. Figures S28–S31 contain the 1H, 13C, HMQC, and HMBC spectra of ellagic acid (11) in DMSO-d6. The 1H, 13C, HMQC, HMBC, and COSY spectra of protocatechuic acid (12) in methanol-d4 are presented in Figures S32–S36. Figures S37–S41 display the 1H, 13C, HMQC, HMBC, and COSY spectra of corilagin (13) in acetone-d6. Figures S42 and S43 show the 1H and 13C NMR spectra of 2,5-dihydroxybenzaldehyde (14) in acetone-d6. Figures S44 and S45 provide the HPLC chromatograms of the isolated compounds, with S44 shown for compounds 17 and S45 shown for compounds 814.

Author Contributions

Conceptualization: D.B. and D.-S.L.; investigation: H.L., Y.J., J.-A.H., C.B., G.L., S.W., and C.-S.Y.; resources: J.-A.H., C.B., G.L. and S.W.; data curation: H.L., Y.J. and C.B.; writing—original draft: H.L., Y.J., D.B. and D.-S.L.; writing—review and editing: H.L., Y.J., D.B. and D.-S.L.; supervision: D.B. and D.-S.L.; project administration: D.B. and D.-S.L.; funding acquisition: D.B. All authors have read and agreed to the published version of the manuscript.

Funding

This study was conducted with the support of the R&D program for Forest Science Technology (project no. RS-2023-KF002467) provided by Korea Forest Service (Korea Forestry Promotion Institute).

Institutional Review Board Statement

Not applicable.

Informed Consent Statement

Not applicable.

Data Availability Statement

The data presented in this study are available upon request from the corresponding author.

Conflicts of Interest

The authors declare no conflicts of interest.

Abbreviations

The following abbreviations are used in this manuscript:
Bun-butanol
CCColumn chromatography
CFChloroform
COX-2Cyclooxygenase-2
DAPI4′,6-diamidino-2-phenylindole
DMSODimethyl sulfoxide
DWDeionized H2O
EAEthyl acetate
ELISAEnzyme-linked immunosorbent assay
FBSFetal bovine serum
H-ESIHeated electrospray ionization
HPLCHigh-Performance Liquid Chromatography
HRPhorseradish peroxidase
Hxn-hexane
iNOSInducible nitric oxide synthase
IL-6Interleukin-6
LPSLipopolysaccharide
MPLCMedium-pressure liquid chromatography
NF-κBNuclear factor kappa-light-chain-enhancer of activated B cells
NMRNuclear magnetic resonance
NONitric oxide
Q. acutaQuercus acuta Thunb.
RPMI-1640Roswell Park Memorial Institute 1640 medium
RP-18Reversed-phase C18
SiO2Silica gel
TICTotal ion current (chromatogram)
TNF-αTumor necrosis factor-alpha
HR-MS/MSHigh resolution tandem mass spectrometry

References

  1. Heneka, M.T.; Golenbock, D.T.; Latz, E. Innate immunity in Alzheimer’s disease. Nat. Immunol. 2015, 16, 229–236. [Google Scholar] [CrossRef]
  2. Perry, V.H.; Holmes, C. Microglial priming in neurodegenerative disease. Nat. Rev. Neurol. 2014, 10, 217–224. [Google Scholar] [CrossRef]
  3. Block, M.L.; Zecca, L.; Hong, J.S. Microglia-mediated neurotoxicity: Uncovering the molecular mechanisms. Nat. Rev. Neurosci. 2007, 8, 57–69. [Google Scholar] [CrossRef]
  4. Glass, C.K.; Saijo, K.; Winner, B.; Marchetto, M.C.; Gage, F.H. Mechanisms underlying inflammation in neurodegeneration. Cell 2010, 140, 918–934. [Google Scholar] [CrossRef]
  5. Qin, J.; Ma, Z.; Chen, X.; Shu, S. Microglia activation in central nervous system disorders: A review of recent mechanistic investigations and development efforts. Front. Neurol. 2023, 14, 1103416. [Google Scholar] [CrossRef] [PubMed]
  6. Henn, A.; Lund, S.; Hedtjärn, M.; Schrattenholz, A.; Pörzgen, P.; Leist, M. The suitability of BV2 cells for microglia studies. ALTEX 2009, 26, 83–94. [Google Scholar] [CrossRef]
  7. Stansley, B.; Post, J.; Hensley, K. A comparative review of cell culture systems for the study of microglial biology in Alzheimer’s disease. J. Neuroinflamm. 2012, 9, 71. [Google Scholar] [CrossRef] [PubMed]
  8. Lehnardt, S. Innate immunity and neuroinflammation in the CNS: The role of microglia in Toll-like receptor-mediated neuronal injury. Glia 2010, 58, 253–263. [Google Scholar] [CrossRef] [PubMed]
  9. Gao, C.; Jiang, J.; Tan, Y.; Chen, S. Microglia in neurodegenerative diseases: Mechanism and potential therapeutic targets. Signal Transduct. Target. Ther. 2023, 8, 359. [Google Scholar] [CrossRef]
  10. Ko, W.; Baek, J.S.; Liu, Z.; Dong, L.; Kim, N.; Lee, H.; Yoon, C.S.; Kim, N.Y.; Kim, S.C.; Lee, D.S. Anti-Inflammatory Activity of 1,6,7-Trihydroxy-2-(1,1-dimethyl-2-propenyl)-3-methoxyxanthone Isolated from Cudrania tricuspidata via NF-kappaB, MAPK, and HO-1 Signaling Pathways in Lipopolysaccharide-Stimulated RAW 264.7 and BV2 Cells. Molecules 2023, 28, 7299. [Google Scholar] [CrossRef]
  11. Lee, H.; Liu, Z.; Dong, L.; Lee, D.Y.; Yoon, D.; Oh, H.; Kim, Y.C.; An, R.B.; Lee, D.S. Anti-Neuroinflammatory and Neuroprotective Effect of Intermedin B Isolated from the Curcuma longa L. via NF-kappaB and ROS Inhibition in BV2 Microglia and HT22 Hippocampal Cells. Int. J. Mol. Sci. 2023, 24, 7390. [Google Scholar] [CrossRef] [PubMed]
  12. Liu, Z.; Lee, H.; Dong, L.; Cheong, S.H.; Lee, D.S. Fatsia japonica extract exerts antioxidant and anti-neuroinflammatory effects on neuronal cells and a zebrafish model. J. Ethnopharmacol. 2024, 324, 117813. [Google Scholar] [CrossRef]
  13. Kim, H.J.; Lee, S.H. Estimating carbon storage and CO2 absorption by developing allometric equations for Quercus acuta in South Korea. For. Sci. Technol. 2017, 13, 55–60. [Google Scholar] [CrossRef]
  14. Kim, J.K.; Yang, H.J.; Go, Y. Quercus acuta Thunb. Suppresses LPS-Induced Neuroinflammation in BV2 Microglial Cells via Regulating MAPK/NF-kappaB and Nrf2/HO-1 Pathway. Antioxidants 2022, 11, 1851. [Google Scholar] [CrossRef]
  15. Kim, B.; Kim, Y.S.; Hwang, Y.H.; Yang, H.J.; Li, W.; Kwon, E.B.; Kim, T.I.; Go, Y.; Choi, J.G. Quercus acuta Thunb. (Fagaceae) and Its Component, Isoquercitrin, Inhibit HSV-1 Replication by Suppressing Virus-Induced ROS Production and NF-kappaB Activation. Antioxidants 2021, 10, 1638. [Google Scholar] [CrossRef] [PubMed]
  16. Kim, M.H.; Park, D.H.; Bae, M.S.; Song, S.H.; Seo, H.J.; Han, D.G.; Oh, D.S.; Jung, S.T.; Cho, Y.C.; Park, K.M.; et al. Analysis of the Active Constituents and Evaluation of the Biological Effects of Quercus acuta Thunb. (Fagaceae) Extracts. Molecules 2018, 23, 1772. [Google Scholar] [CrossRef]
  17. Yoon, I.S.; Park, D.H.; Bae, M.S.; Oh, D.S.; Kwon, N.H.; Kim, J.E.; Choi, C.Y.; Cho, S.S. In Vitro and In Vivo Studies on Quercus acuta Thunb. (Fagaceae) Extract: Active Constituents, Serum Uric Acid Suppression, and Xanthine Oxidase Inhibitory Activity. Evid. Based Complement. Alternat. Med. 2017, 2017, 4097195. [Google Scholar] [CrossRef]
  18. Hong, J.A.; Bae, D.; Oh, K.N.; Oh, D.R.; Kim, Y.; Kim, Y.; Im, S.J.; Choi, E.J.; Lee, S.G.; Kim, M.; et al. Protective effects of Quercus acuta Thunb. fruit extract against UVB-induced photoaging through ERK/AP-1 signaling modulation in human keratinocytes. BMC Complement. Med. Ther. 2022, 22, 6. [Google Scholar] [CrossRef]
  19. Ferrario, G.; Baron, G.; Gado, F.; Della, V.L.; Bombardelli, E.; Carini, M.; D’Amato, A.; Aldini, G.; Altomare, A. Polyphenols from Thinned Young Apples: HPLC-HRMS Profile and Evaluation of Their Anti-Oxidant and Anti-Inflammatory Activities by Proteomic Studies. Antioxidants 2022, 11, 1577. [Google Scholar] [CrossRef]
  20. He, F.; Du, Y.; Pan, Z.; Zeng, H.; Luo, H.; Wang, J.; Sun, Y.; Li, M. The composition of phenolic compounds in Chinese olive (Canarium album L.) cultivars and their contribution to the anti-inflammatory properties of the cultivars. Front. Nutr. 2024, 11, 1334077. [Google Scholar] [CrossRef]
  21. Gorjanović, S.; Micić, D.; Pastor, F.; Tosti, T.; Kalušević, A.; Ristić, S.; Zlatanović, S. Evaluation of Apple Pomace Flour Obtained Industrially by Dehydration as a Source of Biomolecules with Antioxidant, Antidiabetic and Antiobesity Effects. Antioxidants 2020, 9, 413. [Google Scholar] [CrossRef]
  22. Sun, J.; Chen, P.; Lin, L.Z.; Harnly, J.M. A non-targeted approach to chemical discrimination between green tea dietary supplements and green tea leaves by HPLC/MS. J. AOAC Int. 2011, 94, 487–497. [Google Scholar] [CrossRef]
  23. Chang, J.B.; Lane, M.E.; Yang, M.; Heinrich, M. Disentangling the Complexity of a Hexa-Herbal Chinese Medicine Used for Inflammatory Skin Conditions-Predicting the Active Components by Combining LC-MS-Based Metabolite Profiles and in vitro Pharmacology. Front. Pharmacol. 2018, 9, 1091. [Google Scholar] [CrossRef]
  24. Gómez, J.; Simirgiotis, M.J.; Lima, B.; Gamarra-Luques, C.; Bórquez, J.; Caballero, D.; Feresin, G.E.; Tapia, A. UHPLC-Q/Orbitrap/MS/MS Fingerprinting, Free Radical Scavenging, and Antimicrobial Activity of Tessaria absinthiodes (Hook. & Arn.) DC. (Asteraceae) Lyophilized Decoction from Argentina and Chile. Antioxidants 2019, 8, 593. [Google Scholar] [PubMed]
  25. Burico, M.; Fodaroni, G.; Flamini, E.; Ascani, N.; Proietti, G.; Tamimi, S.; Quintiero, C.M.; Massa, L.; Gianni, M.; Mattoli, L. Metabolomic Fingerprint of Hamamelis virginiana L. Gallotannins by Suspect Screening Analysis with UHPLC-qToF and Their Semiquantitative Evaluation. J. Mass Spectrom. 2022, 57, e4878. [Google Scholar] [CrossRef]
  26. Sanz, M.; Cadahía, E.; Esteruelas, E.; Muñoz, A.M.; Fernández de Simón, B.; Hernández, T.; Estrella, I. Phenolic Compounds in Chestnut (Castanea sativa Mill.) Heartwood. Effect of Toasting at Cooperage. J. Agric. Food Chem. 2010, 58, 9631–9640. [Google Scholar] [CrossRef] [PubMed]
  27. Shah, Z.A.; Khan, K.; Iqbal, Z.; Masood, T.; Hemeg, H.A.; Rauf, A. Metabolic and Pharmacological Profiling of Penicillium claviforme by a Combination of Experimental and Bioinformatic Approaches. Ann. Med. 2022, 54, 2102–2114. [Google Scholar] [CrossRef]
  28. Nagy, K.; Redeuil, K.; Williamson, G.; Rezzi, S.; Dionisi, F.; Longet, K.; Destaillats, F.; Renouf, M. First Identification of Dimethoxycinnamic Acids in Human Plasma after Coffee Intake by Liquid Chromatography–Mass Spectrometry. J. Chromatogr. A 2011, 1218, 491–497. [Google Scholar] [CrossRef] [PubMed]
  29. Mirali, M.; Purves, R.W.; Stonehouse, R.; Song, R.; Bett, K.; Vandenberg, A. Genetics and Biochemistry of Zero-Tannin Lentils. PLoS ONE 2016, 11, e0164624. [Google Scholar] [CrossRef]
  30. Slighoua, M.; Mahdi, I.; Moussaid, F.Z.; Al Kamaly, O.; Amrati, F.E.-Z.; Conte, R.; Drioiche, A.; Saleh, A.; Housseini, A.I.; Bari, A.; et al. LC-MS/MS and GC/MS Profiling of Petroselinum sativum Hoffm. and Its Topical Application on Burn Wound Healing and Related Analgesic Potential in Rats. Metabolites 2023, 13, 260. [Google Scholar] [CrossRef]
  31. Zhang, Q.-F.; Guo, Y.-X.; Zheng, G.; Wang, W.-J. Chemical Constituents Comparison between Rhizoma Smilacis Glabrae and Rhizoma Smilacis Chinae by HPLC-DAD-MS/MS. Nat. Prod. Res. 2013, 27, 277–281. [Google Scholar] [CrossRef]
  32. Buamard, N.; Singh, A.; Zhang, B.; Hong, H.; Singh, P.; Benjakul, S. Ethanolic Extract of Duea Ching Fruit: Extraction, Characterization and Its Effect on the Properties and Storage Stability of Sardine Surimi Gel. Foods 2023, 12, 1635. [Google Scholar] [CrossRef]
  33. Fanzone, M.; González-Manzano, S.; Pérez-Alonso, J.; Escribano-Bailón, M.T.; Jofré, V.; Assof, M.; Santos-Buelga, C. Evaluation of Dihydroquercetin-3-O-Glucoside from Malbec Grapes as Copigment of Malvidin-3-O-Glucoside. Food Chem. 2015, 175, 166–173. [Google Scholar] [CrossRef]
  34. Plirat, W.; Chaniad, P.; Phuwajaroanpong, A.; Septama, A.W.; Punsawad, C. Phytochemical, Antimalarial, and Acute Oral Toxicity Properties of Selected Crude Extracts of Prabchompoothaweep Remedy in Plasmodium berghei-Infected Mice. Trop. Med. Infect. Dis. 2022, 7, 395. [Google Scholar] [CrossRef]
  35. Liu, Y.L.; Hsu, C.C.; Huang, H.J.; Chang, C.J.; Sun, S.H.; Lin, A.M. Gallic Acid Attenuated LPS-Induced Neuroinflammation: Protein Aggregation and Necroptosis. Mol. Neurobiol. 2020, 57, 96–104. [Google Scholar] [CrossRef] [PubMed]
  36. Olajide, O.A.; Kumar, A.; Velagapudi, R.; Okorji, U.P.; Fiebich, B.L. Punicalagin inhibits neuroinflammation in LPS-activated rat primary microglia. Mol. Nutr. Food Res. 2014, 58, 1843–1851. [Google Scholar] [CrossRef] [PubMed]
  37. Han, R.; Yuan, T.; Yang, Z.; Zhang, Q.; Wang, W.W.; Lin, L.B.; Zhu, M.Q.; Gao, J.M. Ulmoidol, an unusual nortriterpenoid from Eucommia ulmoides Oliv. leaves prevents neuroinflammation by targeting the PU.1 transcriptional signaling pathway. Bioorg. Chem. 2021, 116, 105345. [Google Scholar] [CrossRef]
  38. Park, J.M.; Park, J.E.; Park, J.S.; Leem, Y.H.; Kim, D.Y.; Hyun, J.W.; Kim, H.S. Anti-Inflammatory and Antioxidant Mechanisms of Coniferaldehyde in Lipopolysaccharide-Induced Neuroinflammation: Involvement of AMPK/Nrf2 and TAK1/MAPK/NF-κB Signaling Pathways. Eur. J. Pharmacol. 2024, 979, 176850. [Google Scholar] [CrossRef] [PubMed]
  39. Wang, Y.; Gao, Y.; Li, X.; Sun, X.; Wang, Z.; Wang, H.; Nie, R.; Yu, W.; Zhou, Y. Coniferyl Aldehyde Inhibits the Inflammatory Effects of Leptomeningeal Cells by Suppressing the JAK2 Signaling. BioMed Res. Int. 2020, 2020, 4616308. [Google Scholar] [CrossRef]
  40. Kamdi, S.P.; Raval, A.; Nakhate, K.T. Phloridzin attenuates lipopolysaccharide-induced cognitive impairment via antioxidant, anti-inflammatory and neuromodulatory activities. Cytokine 2021, 139, 155408. [Google Scholar] [CrossRef]
  41. Zhang, B.; Zhao, J.; Wang, Z.; Guo, P.; Liu, A.; Du, G. Identification of Multi-Target Anti-AD Chemical Constituents from Traditional Chinese Medicine Formulae by Integrating Virtual Screening and In Vitro Validation. Front. Pharmacol. 2021, 12, 709607. [Google Scholar] [CrossRef]
  42. Chen, X.; Zhou, X.; Cheng, X.; Lin, L.; Wang, Q.; Zhan, R.; Wu, Q.; Liu, S. Protective Effect of Ferulic Acid on Lipopolysaccharide-Induced BV2 Microglia Inflammation via AMPK/mTOR Signaling Pathway. Molecules 2023, 28, 3482. [Google Scholar] [CrossRef]
  43. Zhang, D.; Jing, B.; Chen, Z.-N.; Li, X.; Shi, H.-M.; Zheng, Y.C.; Chang, S.Q.; Gao, L.; Zhao, G.P. Ferulic Acid Alleviates Sciatica by Inhibiting Neuroinflammation and Promoting Nerve Repair via the TLR4/NF-κB Pathway. CNS Neurosci. Ther. 2023, 29, 1000–1011. [Google Scholar] [CrossRef] [PubMed]
  44. Liu, G.; Nie, Y.; Huang, C.; Zhu, G.; Zhang, X.; Hu, C.; Li, Z.; Gao, Y.; Ma, Z. Ferulic Acid Produces Neuroprotection against Radiation-Induced Neuroinflammation by Affecting NLRP3 Inflammasome Activation. Int. J. Radiat. Biol. 2022, 98, 1442–1451. [Google Scholar] [CrossRef]
  45. Hu, Z.; Xuan, L.; Wu, T.; Jiang, N.; Liu, X.; Chang, J.; Wang, T.; Han, N.; Tian, X. Taxifolin attenuates neuroinflammation and microglial pyroptosis via the PI3K/Akt signaling pathway after spinal cord injury. Int. Immunopharmacol. 2023, 114, 109616. [Google Scholar] [CrossRef] [PubMed]
  46. Farkhondeh, T.; Pourbagher-Shahri, A.M.; Ashrafizadeh, M.; Llorens Folgado, S.; Rajabpour-Sanati, A.; Khazdair, M.R.; Samarghandian, S. Green tea catechins inhibit microglial activation which prevents the development of neurological disorders. Neural Regen. Res. 2020, 15, 1792–1798. [Google Scholar] [CrossRef] [PubMed]
  47. Dornelles, G.L.; de Oliveira, J.S.; de Almeida, E.J.R.; Mello, C.B.E.; Rodrigues, B.R.E.; da Silva, C.B.; Petry, L.D.S.; Pillat, M.M.; Palma, T.V.; de Andrade, C.M. Ellagic Acid Inhibits Neuroinflammation and Cognitive Impairment Induced by Lipopolysaccharides. Neurochem. Res. 2020, 45, 2456–2473. [Google Scholar] [CrossRef]
  48. Kim, Y.; Cho, M.; Jeon, C.J.; Goh, G.; Kim, M. Neuroinflammatory suppression with protocatechuic acid attenuates Alzheimer’s disease phenotypes in 5 FAD transgenic mice. Biomed. Pharmacother. 2025, 192, 118598. [Google Scholar] [CrossRef]
  49. Guan, S.; Miao, F.; Wang, D.; Hu, J.; Wang, H. Corilagin Attenuates Morphine-Induced BV2 Microglial Activation and Inflammation via Regulating TLR2-Mediated Endoplasmic Reticulum Stress. J. Toxicol. Sci. 2023, 48, 387–398. [Google Scholar] [CrossRef]
  50. Kim, H.; Ralph, J.; Lu, F.; Ralph, S.A.; Boudet, A.M.; MacKay, J.J.; Sederoff, R.R.; Ito, T.; Kawai, S.; Ohashi, H.; et al. NMR analysis of lignins in CAD-deficient plants. Part 1. Incorporation of hydroxycinnamaldehydes and hydroxybenzaldehydes into lignins. Org. Biomol. Chem. 2003, 1, 268–281. [Google Scholar] [CrossRef]
  51. Jiang, W.J.; Ishiuchi, K.; Furukawa, M.; Takamiya, T.; Kitanaka, S.; Iijima, H. Stereospecific inhibition of nitric oxide production in macrophage cells by flavanonols: Synthesis and the structure-activity relationship. Bioorg. Med. Chem. 2015, 23, 6922–6929. [Google Scholar] [CrossRef]
  52. Sudjaroen, Y.; Hull, W.E.; Erben, G.; Würtele, G.; Changbumrung, S.; Ulrich, C.M.; Owen, R.W. Isolation and characterization of ellagitannins as the major polyphenolic components of Longan (Dimocarpus longan Lour) seeds. Phytochemistry 2012, 77, 226–237. [Google Scholar] [CrossRef] [PubMed]
  53. Hashida, K.; Tabata, M.; Kuroda, K.; Otsuka, Y.; Kubo, S.; Makino, R.; Kubojima, Y.; Tonosaki, M.; Ohara, S. Phenolic extractives in the trunk of Toxicodendron vernicifluum: Chemical characteristics, contents and radial distribution. J. Wood Sci. 2014, 60, 160–168. [Google Scholar] [CrossRef]
  54. Choi, H.-R.; Nam, K.-M.; Lee, H.-S.; Yang, S.-H.; Kim, Y.-S.; Lee, J.; Date, A.; Toyama, K.; Park, K.-C. Phlorizin, an Active Ingredient of Eleutherococcus senticosus, Increases Proliferative Potential of Keratinocytes with Inhibition of MiR135b and Increased Expression of Type IV Collagen. Oxid. Med. Cell. Longev. 2016, 2016, 3859721. [Google Scholar] [CrossRef]
  55. Saeed, A.; Qasim, M. An efficient total synthesis of trilepisiumic acid. Nat. Prod. Res. 2014, 28, 1121–1126. [Google Scholar] [CrossRef]
  56. Sajjadi, S.E.; Shokoohinia, Y.; Moayedi, N.-S. Isolation and Identification of Ferulic Acid from Aerial Parts of Kelussia odoratissima Mozaff. Jundishapur J. Nat. Pharm. Prod. 2012, 7, 159–162. [Google Scholar] [CrossRef] [PubMed]
  57. Joo, S.J.; Park, H.J.; Park, J.H.; Cho, J.G.; Kang, J.H.; Jeong, T.S.; Kang, H.C.; Lee, D.Y.; Kim, H.S.; Byun, S.Y.; et al. Flavonoids from Machilus japonica Stems and Their Inhibitory Effects on LDL Oxidation. Int. J. Mol. Sci. 2014, 15, 16418–16429. [Google Scholar] [CrossRef]
  58. Zhang, H.M.; Wang, C.F.; Shen, S.M.; Wang, G.L.; Liu, P.; Liu, Z.M.; Wang, Y.Y.; Du, S.S.; Liu, Z.L.; Deng, Z.W. Antioxidant Phenolic Compounds from Pu-erh Tea. Molecules 2012, 17, 14037–14045. [Google Scholar] [CrossRef]
  59. Orabi, M.A.A.; Orabi, E.A.; Al Awadh, A.A.; Alshahrani, M.M.; Abdel-Wahab, B.A.; Sakagami, H.; Hatano, T. New Megastigmane and Polyphenolic Components of Henna Leaves and Their Tumor-Specific Cytotoxicity on Human Oral Squamous Carcinoma Cell Lines. Antioxidants 2023, 12, 1951. [Google Scholar] [CrossRef]
  60. Teethaisong, Y.; Win, H.H.; Thummavongsa, T.; Eumkeb, G.; Dunkhunthod, B.; Posoongnoen, S.; Santhi, M.; Gorantla, J.N.; Ketudat-Cairns, M.; Ketudat-Cairns, J.R. Identification of Protocatechuic Acid as an Anti-Acne Component in Extracts of Black Rice Bran. Sci. Rep. 2025, 15, 21151. [Google Scholar] [CrossRef]
  61. Adesina, S.K.; Idowu, O.; Ogundaini, A.O.; Oladimeji, H.; Olugbade, T.A.; Onawunmi, G.O.; Pais, M. Antimicrobial Constituents of the Leaves of Acalypha wilkesiana and Acalypha hispida. Phytother. Res. 2000, 14, 371–374. [Google Scholar] [CrossRef] [PubMed]
  62. Ahmad, A.; Iqbal, E.Y.; Siddiqui, P.J.A.; Sattar, M.A.; Faizi, S. Nematicidal Potential of Ceriops tagal Extracts and Authentic Compounds against Cyst Nematode Heterodera zeae. J. Agric. Food Chem. 2025, 73, 17550–17564. [Google Scholar] [CrossRef]
  63. Liu, Z.; Yoon, C.S.; Lee, H.; Kim, E.; Yim, J.H.; Kim, T.K.; Oh, H.; Lee, D.S. The neuroprotective and anti-neuroinflammatory effects of ramalin synthetic derivatives in BV2 and HT22 cells. Biochem. Pharmacol. 2025, 231, 116654. [Google Scholar] [CrossRef]
  64. She, Y.; Shao, C.Y.; Liu, Y.F.; Huang, Y.; Yang, J.; Wan, H.T. Catalpol reduced LPS induced BV2 immunoreactivity through NF-κB/NLRP3 pathways: An in Vitro and in silico study. Front. Pharmacol. 2024, 15, 1415445. [Google Scholar] [CrossRef]
  65. Jia, Y.; Zhang, D.; Yin, H.; Li, H.; Du, J.; Bao, H. Ganoderic acid A attenuates LPS-induced neuroinflammation in BV2 microglia by activating farnesoid X receptor. Neurochem. Res. 2021, 46, 1725–1736. [Google Scholar] [CrossRef] [PubMed]
  66. Liu, Z.; Vinh, L.B.; Tuan, N.Q.; Lee, H.; Kim, E.; Kim, Y.C.; Sohn, J.H.; Yim, J.H.; Lee, H.J.; Lee, D.S.; et al. Macrosphelides from Antarctic fungus Pseudogymnoascus sp. (strain SF-7351) and their neuroprotective effects on BV2 and HT22 cells. Chem. Biol. Interact. 2023, 385, 110718. [Google Scholar] [CrossRef] [PubMed]
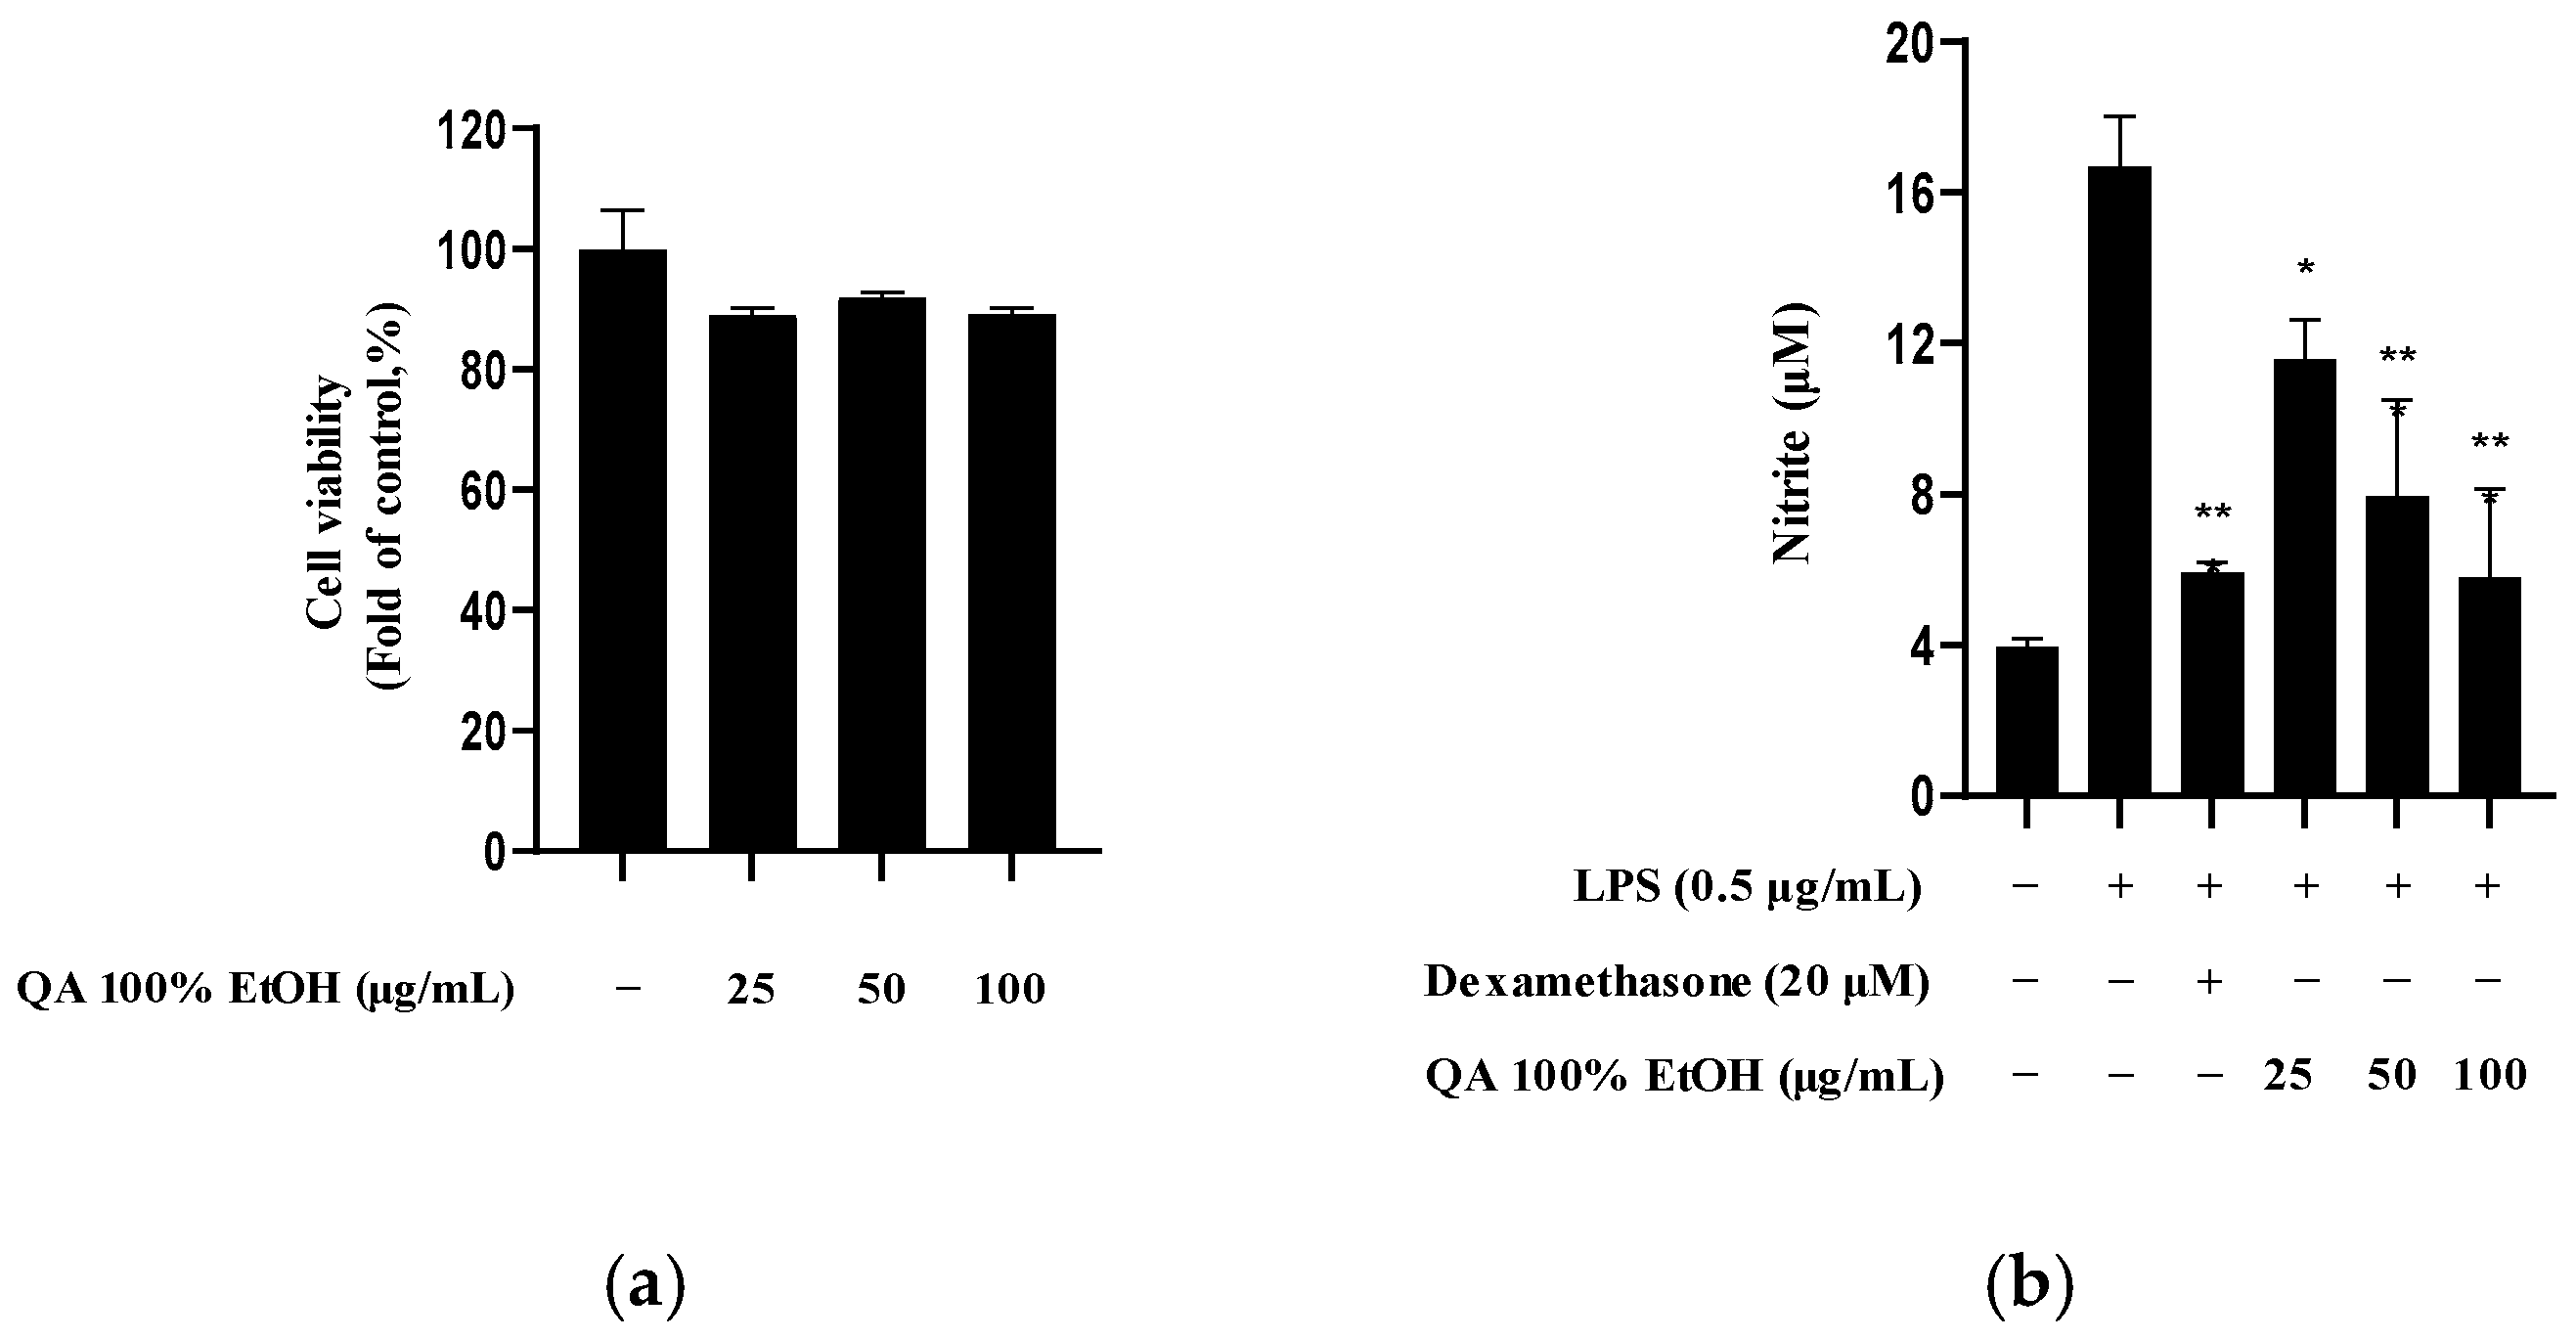
Figure 1. Effect of Q. acuta fruit EtOH extract on (a) cell viability and (b) inhibition of nitrite production in BV2 cells. (a) Cell viability was measured using the MTT assay after incubating cells with the indicated concentrations of Q. acuta fruit EtOH extract for 24 h. (b) The inhibitory effect on nitrite production was measured 3 h after Q. acuta fruit EtOH extract treatment and 24 h after LPS (0.5 μg/mL) stimulation; 20 μM dexamethasone was used as the positive control. Data are presented as the mean ± S.D. of three independent experiments (n = 3). * p < 0.05, and ** p < 0.01 vs. LPS-treated cells.
Molecules 30 04514 g001
Figure 2. Total ion current (TIC) UPHLC-HR-MS/MS chromatograms of an EtOH extract of Q. acuta fruits obtained in both (a) positive and (b) negative ion modes. Identified peaks were sequentially numbered by retention time using “Elements viewer” (the identity or presumed identity of each peak is presented in Table 1, along with the experimental mass, MS/MS fragment, and identification reference).
Molecules 30 04514 g002
Figure 3. Cell viability and LPS-induced nitrite production in BV2 microglia in the presence of solvent fractions and subfractions of a Q. acuta fruit extract. (a,c,e) Cell viability of BV2 microglia treated with five solvent fractions (n-hexane, chloroform, ethyl acetate, n-butanol, and H2O) and ethyl acetate (QA-EA-1–4) and n-butanol (QA-Bu-1–4) subfractions was assessed by the MTT assay after 24 h of treatment. (b,d,f) Inhibitory effects of five solvent fractions (n-hexane, chloroform, ethyl acetate, n-butanol, and H2O) and ethyl acetate (QA-EA-1–4) and n-butanol (QA-Bu-1–4) subfractions on LPS-induced nitrite production in BV2 microglia after a 3 h treatment with the fractions and subfractions followed by 24 h of LPS (0.5 μg/mL) stimulation. Dexamethasone (20 μM) was used as the positive control. Data are presented as the mean ± S.D. of three independent experiments (n = 3). * p < 0.05, ** p < 0.01, and *** p < 0.001 vs. the control. # p < 0.05, ## p < 0.01, and ### p < 0.001 vs. the LPS-treated group.
Molecules 30 04514 g003aMolecules 30 04514 g003b
Figure 4. Schematic representation of the pathway followed for compound isolation from a Q. acuta fruits.
Molecules 30 04514 g004
Figure 5. Chemical structures of the compounds isolated from a Q. acuta fruit EtOH extract.
Molecules 30 04514 g005
Figure 6. Viability of BV2 microglial cells treated with Q. acuta fruit compounds 114. The subfigures represent the following groups: compounds 14 (a), 58 (b), 912 (c), and 13, 14 (d). Cells were incubated with the indicated concentrations of Q. acuta fruit compounds for 24 h. Cell viability was determined by MTT assay. Data are presented as the mean ± S.D of three independent experiments (n = 3). *** p < 0.001 vs. the control.
Molecules 30 04514 g006
Figure 7. Effect of Q. acuta fruit compounds 114 on nitrite production in LPS-induced BV2 cells. The subfigures represent the following groups: compounds 14 (a), 58 (b), 912 (c), and 13, 14 (d). Cells were treated with compounds 114 at the indicated concentrations for 3 h and then induced with LPS for 24 h. Dexamethasone was used as the positive control. Data are presented as the mean ± S.D. of three independent experiments (n = 3). * p < 0.05, ** p < 0.01, and *** p < 0.001 compared to the LPS-stimulated group.
Molecules 30 04514 g007
Figure 8. Effect of compound 4 and 14 treatments on the expression of (a) IL-6 and (b) TNF-α in LPS-induced BV2 cells. Cells were pretreated with the indicated concentrations of either compound 4 or 14 for 3 h and then stimulated with LPS (0.5 μg/mL) for 24 h. Enzyme-linked immunosorbent assays (ELISAs) were performed for protein quantification. Bars represent the mean ± standard deviation of three independent experiments (n = 3). * p < 0.05, ** p < 0.01, and *** p < 0.001 vs. the LPS-treated group.
Molecules 30 04514 g008
Figure 9. Western blot analysis showing the expression levels of iNOS and COX-2 in BV2 microglia treated with three concentrations (10–40 µM) of compounds (ac) 4 and (df) 14 in the presence of 0.5 µg/mL LPS. β-Actin was used as the loading control. Densitometry analyses of COX-2 and iNOS protein levels normalized to β-Actin demonstrated a dose-dependent decrease in protein expression. Data are expressed as the mean ± SEM (n ≥ 3). * p < 0.05 and ** p < 0.01 compared to the LPS-only treated group.
Molecules 30 04514 g009aMolecules 30 04514 g009b
Figure 10. Effects of compounds (a,b) 4 and (c,d) 14 on NF-κB activation in BV2 microglia. Cells were pretreated with the indicated concentrations of the compounds for 3 h and then stimulated with LPS for 1 h. Proteins were analyzed by Western blotting and quantified using the ImageJ software (imageJ 1.54g). Band intensities were normalized to those of β-actin. Data represent the average of three independent experiments. Untreated control groups are included (n ≥ 3). * p < 0.05, ** p < 0.01, and *** p < 0.001 compared with the LPS-treated group.
Molecules 30 04514 g010
Figure 11. Immunofluorescence analysis of NF-κB signaling activation and p65 nuclear translocation in BV2 microglia treated with compounds 4 or 14. Immunofluorescence staining was conducted to visualize NF-κB p65 (green) and nuclei (DAPI, blue) in BV2 microglia. Merged images indicate that LPS-induced nuclear translocation of p65 was reduced by compound 4 and 14 treatments. Scale bars are indicated in red.
Molecules 30 04514 g011
Table 1. Tentative identification of the chemical compounds obtained from the UPLC-HR-MS/MS analysis of a Q. acuta fruit EtOH extract.
R.T. (min)M.F.M.W.AdductMS2 Ion Fragments (m/z)I.D.M.A.S.ClassI.D. ref.
2.01C13H16O10332.1[M − H]125.023, 169.011Gallic acid hexoside1Phenol[20]
2.46C7H6O5170.0[M + H]+81.034, 107.013, 127.039, 153.018Gallic acid1Phenol[20,21]
3.70C20H20O13126.0[M + H]+53.039, 81.034, 109.029Pyrogallol0.97Phenol[23]
4.00C13H16O10468.1[M + H]+111.044, 125.024, 153.018, 299.076Ginnalin A1Phenol[24]
4.56C20H20O14484.1[M − H]85.028, 95.012, 113.023, 125.023, 169.013,
313.057
Hamamelitannin1Tannin[25]
4.74C7H6O4154.0[M − H]81.033, 108.020, 109.028Protocatechuic acid0.81Phenol[19,21]
6.96C7H6O3138.0[M − H]81.033, 108.020, 109.028, 136.015 Protocatechuic
aldehyde
0.77Phenol[26]
9.20C30H26O12578.1[M − H]109.028, 125.023, 161.024, 289.072, 339.086,
407.077, 425.089
Procyanidin B11Flavonoid[20,25]
9.68C7H6O3138.0[M + H]+55.019, 65.039, 69.034, 111.0442,5-Dihydroxybenzaldehyde1Phenol[32]
9.68C15H14O6290.1[M − H]57.033, 97.028, 109.028, 125.023, 151.039,
203.070, 245.082
Catechin1Flavonoid[22,23]
11.12C27H22O18634.1[M − H]123.008, 125.023, 169.013, 173.024, 185.024,
275.021, 300.999
Corilagin0.98Tannin[20]
12.19C27H24O18636.1[M − H]65.853, 75.418, 85.028, 95.012, 125.023,
169.013, 313.057, 465.067
1,3,6-tri-O-galloyl glucose0.98Tannin[22,25]
13.28C15H14O6290.1[M − H]109.028, 123.044, 151.039, 179.034, 203.071,
245.082, 289.072
Epicatechin0.97Flavonoid[20,25]
13.37C16H18O8338.1[M + H]+-1-Coumaroylquinic acid1Phenol[19]
13.76C10H8O5208.0[M + H]+107.049, 135.044, 153.055, 163.039, 194.021Fraxetin0.99Coumarin[27]
14.53C15H12O7304.1[M + H]+123.044, 149.023, 153.018, 195.029, 231.065,
259.060, 287.055
(2R,3R)-2-(2,6-dihydroxyphenyl)-3,5,7-trihydroxy-2,3-dihydrochromen-4-one0.99Flavonoid[23]
15.51C21H22O12466.1[M − H]107.012, 151.003, 151.039, 178.997, 285.041,
303.003, 339.073
(2R,3R)-2-(3,4-dihydroxyphenyl)-5,7-dihydroxy-3-[(2S,3R,4S,5S,6R)-3,4,5-trihydroxy-6-(hydroxymethyl)oxan-2-yl]oxy-2,3-dihydrochromen-4-one1Flavonoid[33]
16.65C10H8O4192.0[M + H]+133.029, 149.060, 150.031, 178.026Scopoletin0.98Coumarin[26]
16.90C10H10O4194.1[M − H]-Ferulic acid0.91Phenol[20]
17.91C15H12O7304.1[M + H]+123.044, 149.023, 153.018, 231.065, 259.060Taxifolin1Flavonoid[21]
18.12C11H10O5222.1[M + H]+107.050, 134.036, 162.031, 190.026, 208.037Fraxidin1Coumarin[31]
18.78C14H6O8302.0[M + H]+173.024, 201.018, 229.013, 257.008, 285.003Ellagic acid1Tannin[20,21]
18.86C25H32O13540.2[M − H]59.012, 89.025, 101.025, 123.008, 163.111Oleuropein1Phenol[30]
19.23C22H18O10442.1[M − H]-Epicatechin gallate1Flavonoid[22]
19.38C15H12O8320.1[M − H]102.288, 133.029, 145.028, 173.024, 189.019Dihydromyricetin1Flavonoid[29]
19.41C10H10O3178.1[M + H]+55.019, 119.049, 133.065, 147.044, 161.060Coniferaldehyde1Phenol[26]
20.18C11H12O4208.1[M + H]+-Sinapoyl aldehyde1Phenol[26]
21.17C21H24O10436.1[M + H]+81.034, 109.029, 125.022, 143.034, 171.029Phloretin-2′-O-glucoside1Phenol[19]
22.55C11H12O4208.1[M + H]+133.065, 148.052, 163.075, 191.071Dimethylcaffeic acid1Phenol[28]
22.76C19H22O5330.1[M + H]+137.060, 151.075, 189.091, 227.107, 255.102,
285.112, 287.128, 313.144, 331.202
Tetrahydrosappanone A
Trimethyl Ether
0.99Phenol[34]
23.82C15H10O7302.0[M − H]-Quercetin0.99Flavonoid[19,20]
I.D., identification; I.D. ref., reference used for identification; M.A.S., MS Accuracy score; M.F., Molecular formula; M.W., Molecular weight; R.T., Retention time.
Table 2. IC50 (µM a) values of isolated compounds that suppress nitrite production in LPS-induced BV2 microglia.
CompoundNameIC50 ± S.D.
Compound 1Gallic acid-
Compound 2Sinapaldehyde13.68 ± 2.38
Compound 3Coniferaldehyde9.96 ± 3.03
Compound 43,5,7,2′,6′-pentahydroxyflavanone22.55 ± 0.77
Compound 51,2,3,6-Tetrakis-O-galloyl-beta-D-glucose-
Compound 6Phlorizin-
Compound 73,4-Dimethoxycinnamic acid-
Compound 8Ferulic acid-
Compound 9Taxifolin-
Compound 10Catechin-
Compound 11Ellagic acid-
Compound 12Protocatechuic acid-
Compound 13Corilagin19.60 ± 1.53
Compound 142,5-Dihydroxybenzaldehyde7.41 ± 1.40
S.D., standard deviation. IC50, the IC50 value was defined as the concentration of the isolated compounds that reduced the LPS-induced response by 50% relative to the difference between the control and LPS-treated group. a Data represent the mean ± SD of three independent experiments.
Table 3. Studies on the anti-neuroinflammatory effects of the compounds isolated from Q. acuta fruits.
Compound Name (I.D. Number)Neuro-Inflammation Activity Determination ModelRef.
Gallic acid (1)BV2 microglial cells,
rat primary microglia
[35,36]
Sinapaldehyde (2)BV2 microglial cells[37]
Coniferaldehyde (3)BV2 microglial cells,
leptomeningeal cells
[38,39]
3,5,7,2′,6′-Pentahydroxyflavanone (4)--
1,2,3,6-Tetrakis-O-galloyl-β-D-glucose (5)--
Phlorizin (6)Mice[40]
3,4-Dimethoxycinnamic acid (7)BV2 microglial cells[41]
Ferulic acid (8)BV2 microglial cells,
rats, mice
[42,43,44]
Taxifolin (9)BV2 microglial cells[45]
Catechin (10)BV2 microglial cells[46]
Ellagic acid (11)Rats[47]
Protocatechuic acid (12)Mice[48]
Corilagin (13)BV2 microglial cells[49]
2,5-Dihydroxybenzaldehyde (14)--
I.D., identification; Ref., reference.
Disclaimer/Publisher’s Note: The statements, opinions and data contained in all publications are solely those of the individual author(s) and contributor(s) and not of MDPI and/or the editor(s). MDPI and/or the editor(s) disclaim responsibility for any injury to people or property resulting from any ideas, methods, instructions or products referred to in the content.