Article

Conformational Evolution of Bicalutamide in Chloroform: A Comprehensive NMR Study

by
Konstantin V. Belov
1 and
Ilya A. Khodov
1,2,*
1
G.A. Krestov Institute of Solution Chemistry of the Russian Academy of Sciences, Ivanovo 153045, Russia
2
N.N. Semenov Federal Research Center for Chemical Physics Russian Academy of Sciences, 4 Kosygin Street, Moscow 119991, Russia
*
Author to whom correspondence should be addressed.
Molecules 2025, 30(22), 4479; https://doi.org/10.3390/molecules30224479
Submission received: 17 October 2025 / Revised: 17 November 2025 / Accepted: 18 November 2025 / Published: 20 November 2025

Abstract

This study presents new findings on the conformational mobility of the nonsteroidal antiandrogen blocker, bicalutamide, in deuterated chloroform. Based on NOE NMR spectral analysis, quantitative information was obtained regarding the distribution of «open» and «closed» conformer groups in four systems: one with a solid phase (16.7%/83.3%), one without the solid phase (19.7%/80.3%), and two diluted solutions at different concentrations (16.1%/83.9% and 85.3%/14.7%). It was shown that the preparation of molecules for nucleation and the transition to the «closed» conformation occurs at low concentrations and is maintained as the concentration increases until the solid phase is formed. This behavior of conformational evolution contrasts previous understandings of the solid phase’s influence on molecular conformation in solution. The results obtained will offer deeper insights into the conformational evolution of small molecules during nucleation, using bicalutamide as a model.

1. Introduction

The conformational changes in small molecules in biologically active compounds within solutions have become a key subject of contemporary research [1,2,3,4]. A primary motivation for studying the conformational evolution during desolvation and nucleation is the strong correlation between the conformation of a molecule in a saturated solution and the polymorphic form obtained, particularly in the case of conformation-determined polymorphism [5,6,7,8]. For instance, the polymorphism and solvatomorphism of fluconazole, a flexible molecule, were shown to depend heavily on solvent and desolvation pathways, with careful crystallization techniques allowing for the formation of different polymorphs [9,10]. The ability to manipulate the conformational state of molecules in solution opens up new avenues for developing novel solid forms of active pharmaceutical ingredients [11]. This area of research has gained considerable momentum, particularly with the recent development and integration of the pre-nucleation cluster theory [12,13,14], which provides an alternative to classical nucleation theory. Recent theories, such as pre-nucleation cluster theory, emphasize the role of spatial structure and solvation in nucleation, challenging traditional models that focus on crystallization from a single solute molecule [15]. This new perspective on nucleation suggests significant influence from spatial structure and solvation processes, though the mechanisms behind these effects remain insufficiently understood. Previous studies have identified key factors that affect the predominant conformation of molecules in solution, including the presence or absence of a solid phase [16], state parameters (pressure and temperature) [17,18], and solvent type [19,20].
In the present study, we investigate the conformational evolution of bicalutamide (BCL), a non-steroidal anti-androgenic blocker (testosterone and 5α-dihydrotestosterone), marketed as Casodex®, in deuterated chloroform (CDCl3) solutions using Overhauser effect nuclear magnetic resonance (NOESY) spectroscopy. BCL exhibits conformation-determined polymorphism and solvatomorphism [21,22,23], with molecules in various crystalline forms existing as «open» and «closed» conformers (see Figure 1), which are characterized and documented in the Cambridge Crystallographic Data Center (CCDC) [23,24,25,26,27].
Despite this, the molecular mechanisms stabilizing these different BCL structures have remained unknown until recently. Our recent study [28] examines BCL conformational polymorphism and solid forms, focusing on how different molecular structures affect stability, solubility, and bioavailability. It explores the role of non-covalent interactions, including hydrogen bonds [29] and π–π stacking [30], in stabilizing polymorphs [7]. Solvent effects, including those from chloroform, are crucial for understanding BCL’s conformational behavior and improving drug formulations. In a series of previous studies, thoroughly outlined in the review [28], a DFT analysis was conducted to optimize and comprehensively characterize the structure and geometric parameters of the «open» and «closed» conformers of BCL, which formed the basis for the present study. However, earlier studies conducted in DMSO did not reveal the concentration-dependent effects of dimerization, as the solution was too supersaturated, and the presence of associates in the solution skewed the results. Further, the high solubility of BCL in DMSO-d6 allowed us to evaluate the distribution of «open» and «closed» conformers over a wide concentration range (from 0.86 M to 2.16 M). The observed transition from «open» to «closed» conformers, as seen in stable crystalline forms, is consistent with the increasing concentration over time, which leads to the formation of a solid phase. However, with the exceptionally high BCL concentrations in DMSO-d6 (>150 mg/mL) [31], this system renders quantitative interpretation challenging and does not allow for the selective identification stabilizing factors for the «open» and «closed» structures.
Studying BCL conformers in chloroform, both in the presence and absence of a solid phase (undissolved material), as well as in diluted solutions, is crucial for understanding nucleation processes in compounds with conformational polymorphism. The solid phase influences nucleation and polymorph formation, while without it, BCL molecules transition freely. Solvent conditions and concentration affect conformer dominance, which is crucial for crystallization and controlling polymorph formation in pharmaceuticals [1,18,32]. The results of this work will, for the first time, provide a detailed mechanistic picture of conformational changes in BCL in solutions of varying concentrations, based on experimental data, as well as allow for the clear identification of patterns that stabilize the spatial structure.

2. Results and Discussion

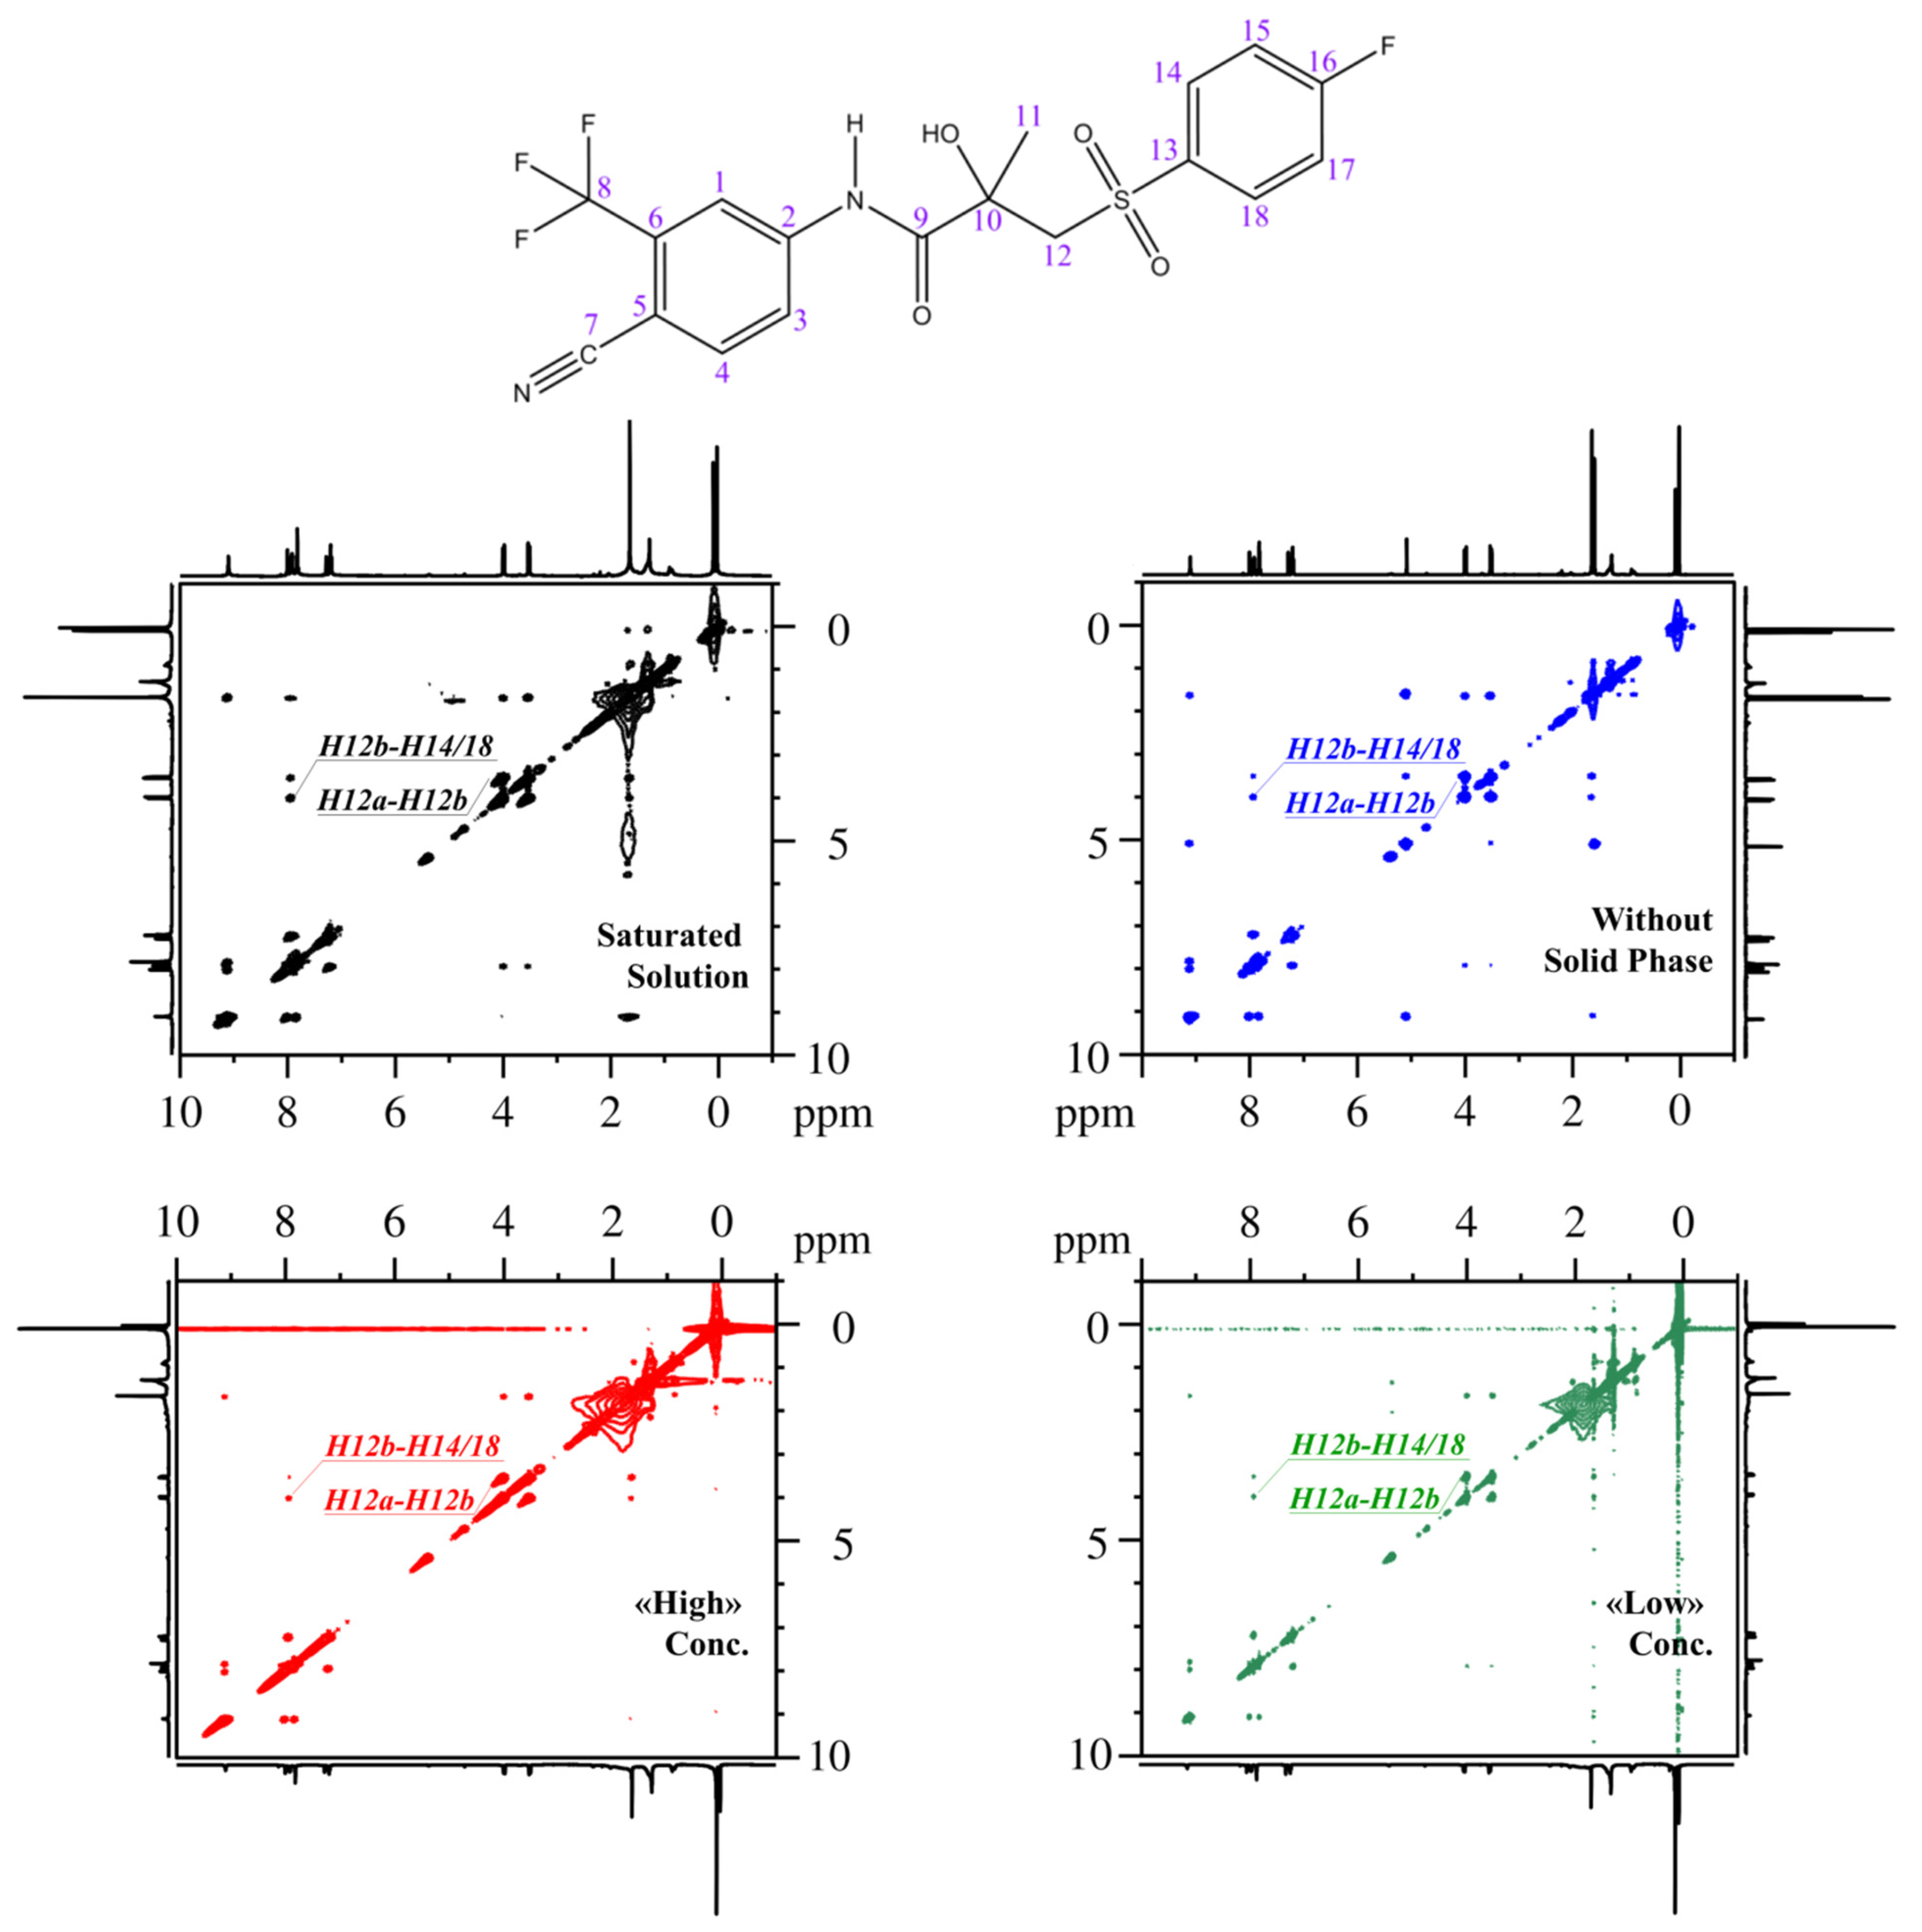
A comprehensive analysis of the 1H NMR spectra for the four studied systems (see Figure 2a–d) was performed, and the resonance signals were assigned based on data from the literature [31]. This allowed for the identification of corresponding hydrogen-containing atom groups in the molecular structure of BCL.
The analysis of the obtained data, compared with the literature, showed that resonance signals corresponding to the para-fluorinated cyclic fragment of the BCL molecules (H14/18, H15/17), as well as the trifluoromethyl-substituted ring (H1, H3/4), and NH groups, appear in the weak-field region. The hydrogen signals from the aliphatic fragment of the molecules predominantly fall in the strong-field region (H12a, H12b, H11). It should be noted that all the studied systems exhibit a water signal originating from the non-anhydrous solvent, as well as a small amount of impurities likely present in the commercial BCL sample. These signals in the 1H spectra of BCL have been previously observed when using various solvents [33] and are not discussed further in this work. The OH group hydrogen atom signal is visible in solution of BCL in CDCl3 without the solid phase (see Figure 2b). In other cases, this signal was absent due to exchange processes and aggregation at high concentrations [33]. For instance, the OH signal was observed in saturated solution immediately after the sample was prepared and sealed in an ampoule. Experiments were conducted on the same sample after 2, 4, and 18 days, revealing that the OH signal broadens over time (see Figure S1) and becomes indistinguishable at the given scale.
The signal assignment data obtained in this study served as the basis for analyzing NOESY spectra and calculating the proportions of «closed» and «open» BCL conformers in CDCl3, both in the presence and absence of a solid phase and at various concentrations (see Figure 3). NOESY spectroscopy is a powerful and unique tool for quantitatively analyzing the spatial structure of molecules in solution [34,35,36,37], supercritical fluids [17,38,39,40], biocompatible environments [41,42], and other settings.
The potential of the NOESY method arises from the strong correlation between the cross-relaxation rate (σ, s−1)—a parameter directly determined from the experiment—and the corresponding inter-nuclear distance (r, Å)—σ ~ 1/r6 [43,44,45]. The value of σ is a weighted average over all conformers in the system—σ = Σσi × xi [46,47] ]. The value of σ can be obtained within the initial rate approximation (IRA) framework [48,49,50], as the slope of the fitted line in a graph of the averaged integral intensities of cross-peaks [37,51,52,53] as a function of mixing time. By determining the cross-relaxation rates from the NOESY data, the desired inter-nuclear distances can be obtained using the isolated spin pair model (ISPA) [47,54,55,56]—rexp = r0 × (σ0exp)1/6 (where rexp and σexp are the unknown inter-nuclear distance and the corresponding cross-relaxation rate; r0 and σ0 are the reference distance and the corresponding cross-relaxation rate, which remain constant for all studied conformers) [37,57].
For the proper comparison and interpretation of the data obtained in this work, we used the characteristic conformer-defined distance (rexp—H12b-H14/18) and the reference distance (r0—H12a-H12b) proposed in a previous study [33]. The averaged values [58] of the conformer-defined distances for «closed» and «open» BCL conformers are: rClose = 4.28 ± 0.18 Å; rOpen = 3.46 ± 0.49 Å. The reference distance (r0) is 1.78 ± 0.49 Å for all examined conformers. The cross-relaxation rates and experimentally determined H12b-H14/18 distances for the four studied systems are listed in Table 1. The graphs of the averaged integral intensities as a function of mixing time, used for cross-relaxation rate calculations, are shown in Figure S2. The data required to reproduce the experimental results are provided in Table S1.
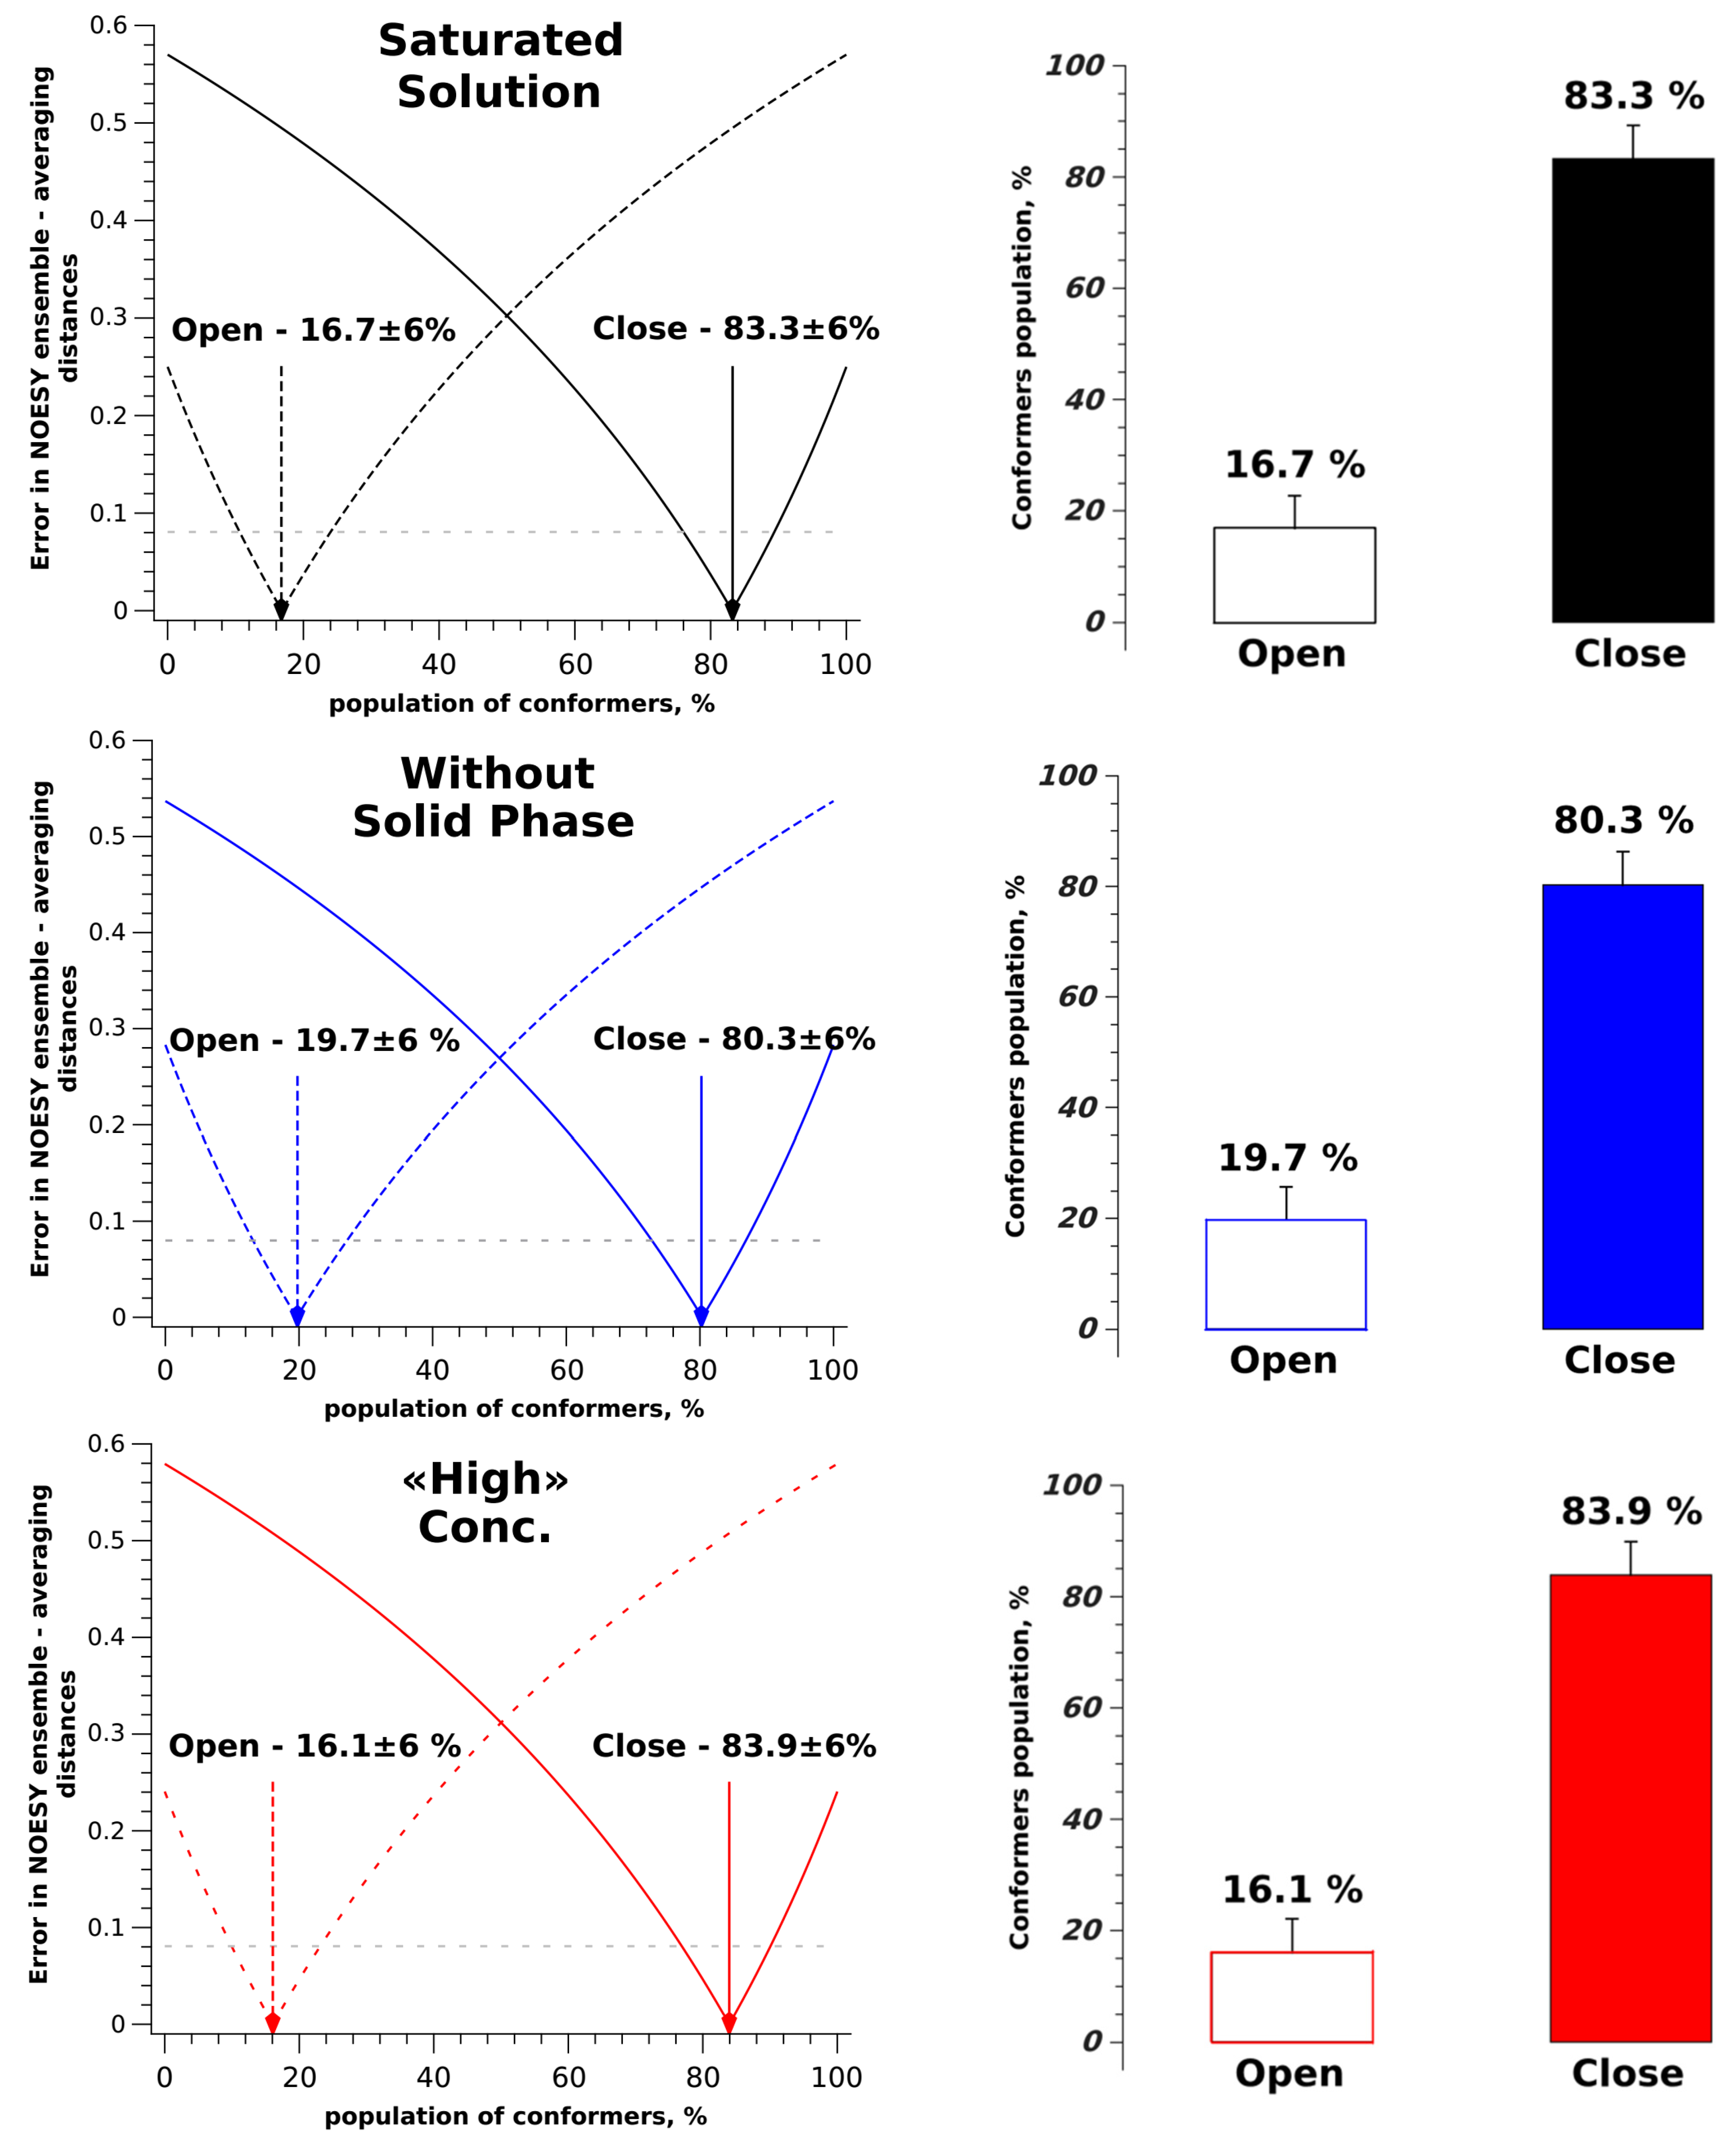
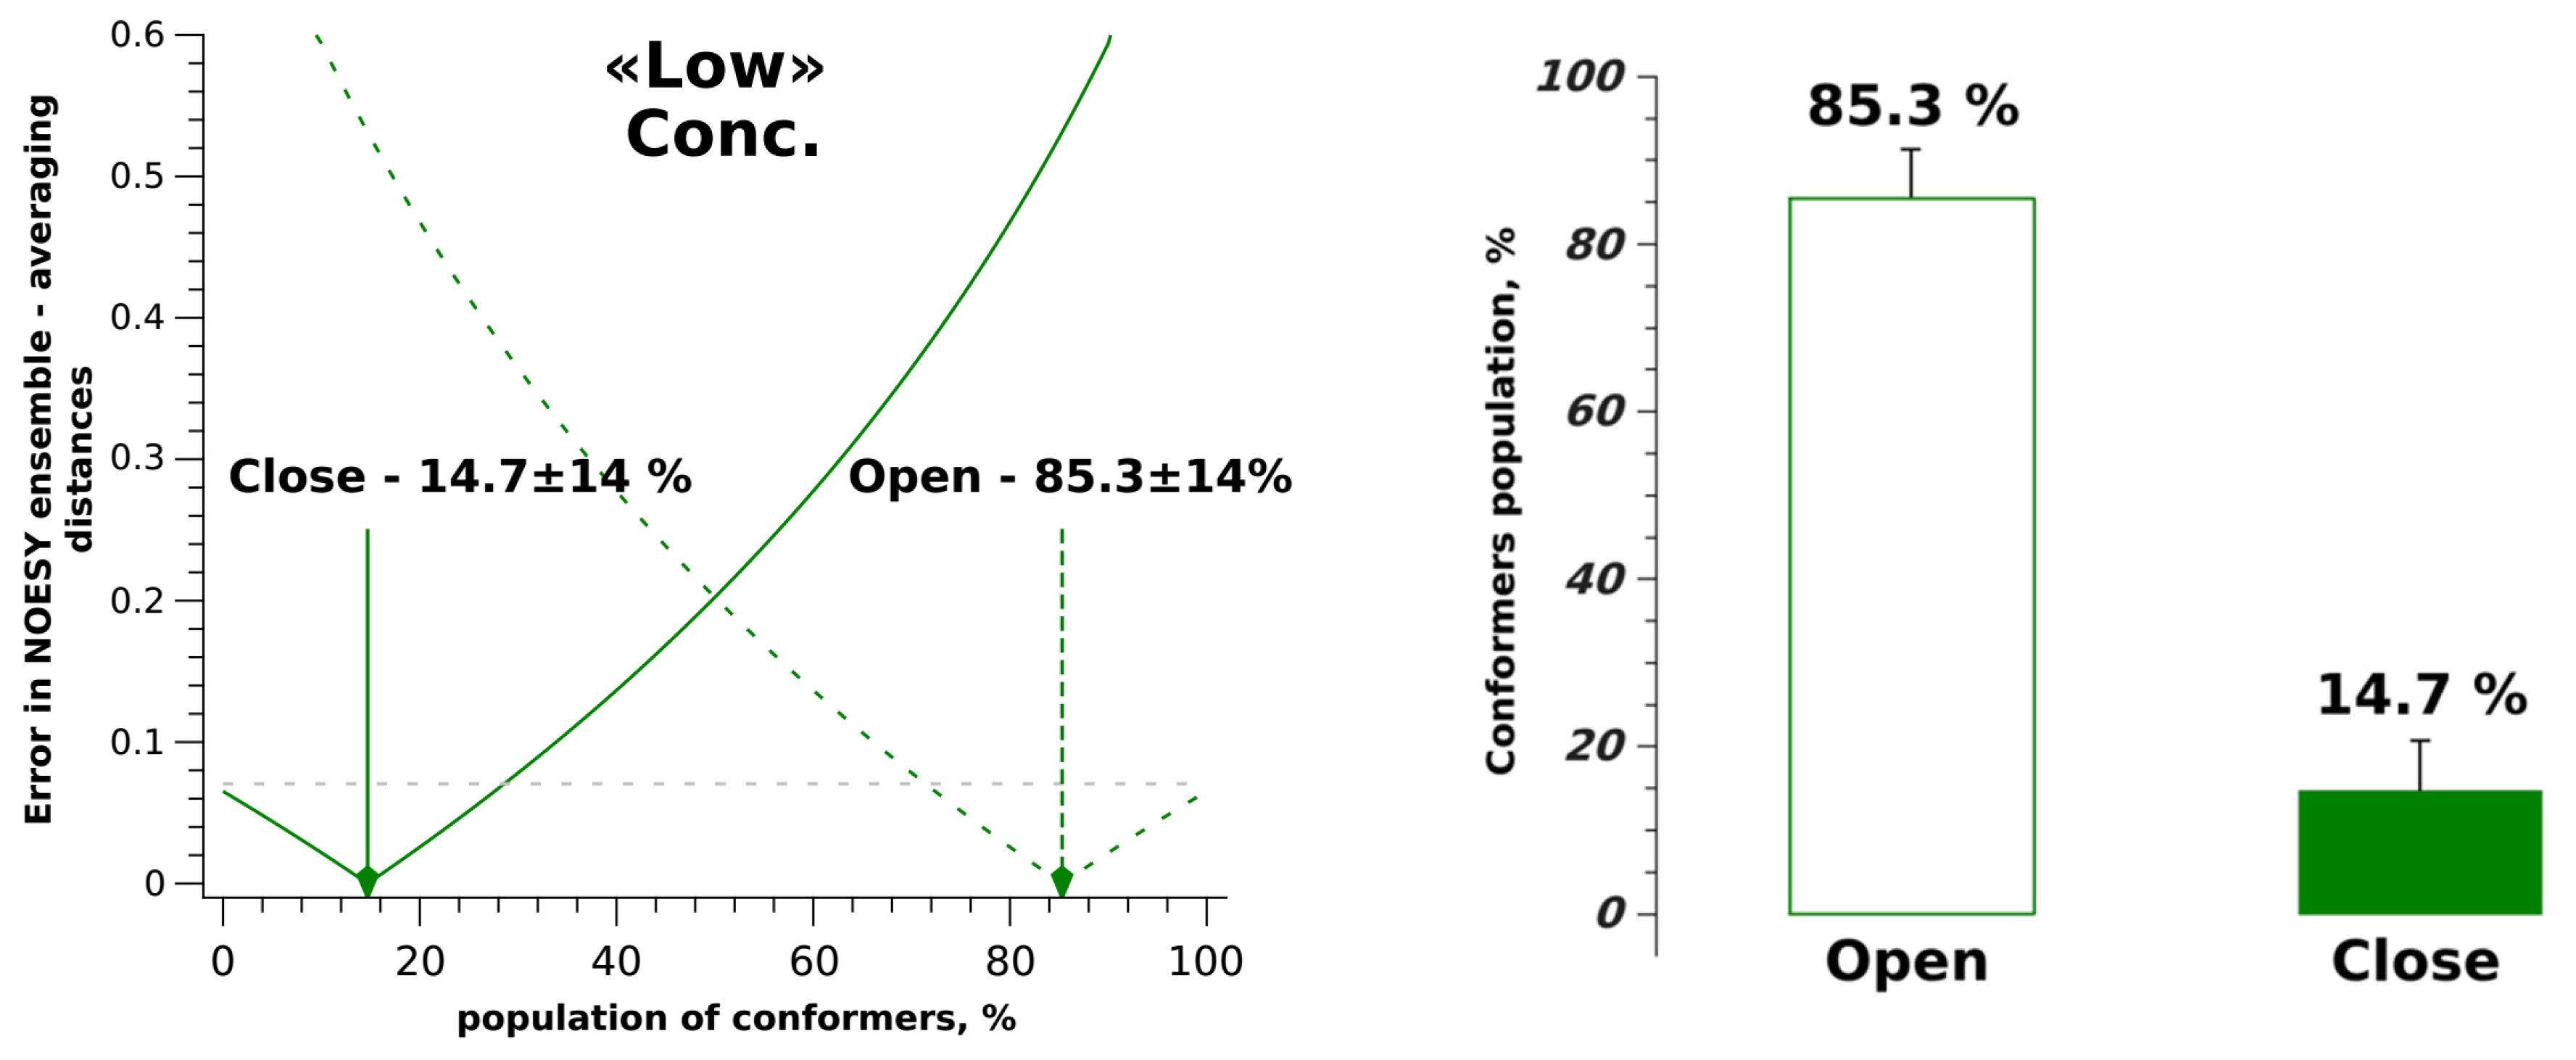
For all the studied systems, the cross-relaxation rate σ0 remains unchanged, as the distance between the CH2 protons (H12a-H12b) does not change significantly across the conformers. However, the value of σexp for «low» concentration differs markedly for the remaining systems. This trend is reflected in the experimentally determined inter-nuclear distances (rexp). The obtained experimental distances were used to calculate the proportions of conformer groups within a two-position exchange model [48,59]. A graphical approach was used to visualize the model and determine the error in the proportions of the conformer groups (see Figure 4), as previously described [60].
The results of the calculation of the proportions of «open» and «closed» conformer groups show that in saturated solution, system without the solid phase and «high» concentration solution, the desired values remain unchanged within the error, with the proportion of «open» conformers at 17% and «closed» conformers at 83%. This indicates that for BCL, the presence or absence of the solid phase does not significantly influence the observation of specific molecular conformations in solution. Instead, solvation processes play a crucial role, especially when the concentration of BCL in CDCl3 is significantly reduced, as in the case of a system with «low» concentration. This shift suggests that solvent interactions play a crucial role in stabilizing specific conformers. These observations are consistent with previous studies that reported solvent polarity influencing the conformer ratio of BCL, with non-polar solvents favoring the «closed» form and polar solvents promoting the «open» form [28]. Figure 4 shows the transition from «high» to «low» concentration results in a sharp change in conformation from «closed»—83.9% to «open»—85.3%. This transition occurs due to the addition of 0.15 mL of solvent. At the same time, the lack of changes in the distribution of conformers when transitioning from a system without the solid phase to a «high» concentration system suggests that there is a broad concentration range where BCL molecules are stabilized in the «closed» conformation.
Our approach to analyzing the obtained results and identifying patterns in the stabilization of «open» and «closed» BCL conformers in CDCl3 solutions of varying concentrations involved a series of additional experiments. ROESY spectra were recorded for a saturated solution of BCL in CDCl3 (see Figure S3). The joint NOESY and ROESY spectral data analysis, a well-known method for characterizing magnetization transfer types, detecting spin diffusion effects, and intermolecular interactions, was conducted with utmost care [61]. The comparison of NOESY and ROESY spectra, which revealed all characteristic cross-peaks in phase, further instills confidence in the direct magnetization transfer between the nuclei of interest and the absence of spin diffusion effects. The interactions of interest (H12a-H12b and H12b-H14/18) predominantly appear in the 1D NOESY spectrum (see Figure S4), further supporting the relevance of the selected reference and conformation-dependent distances.
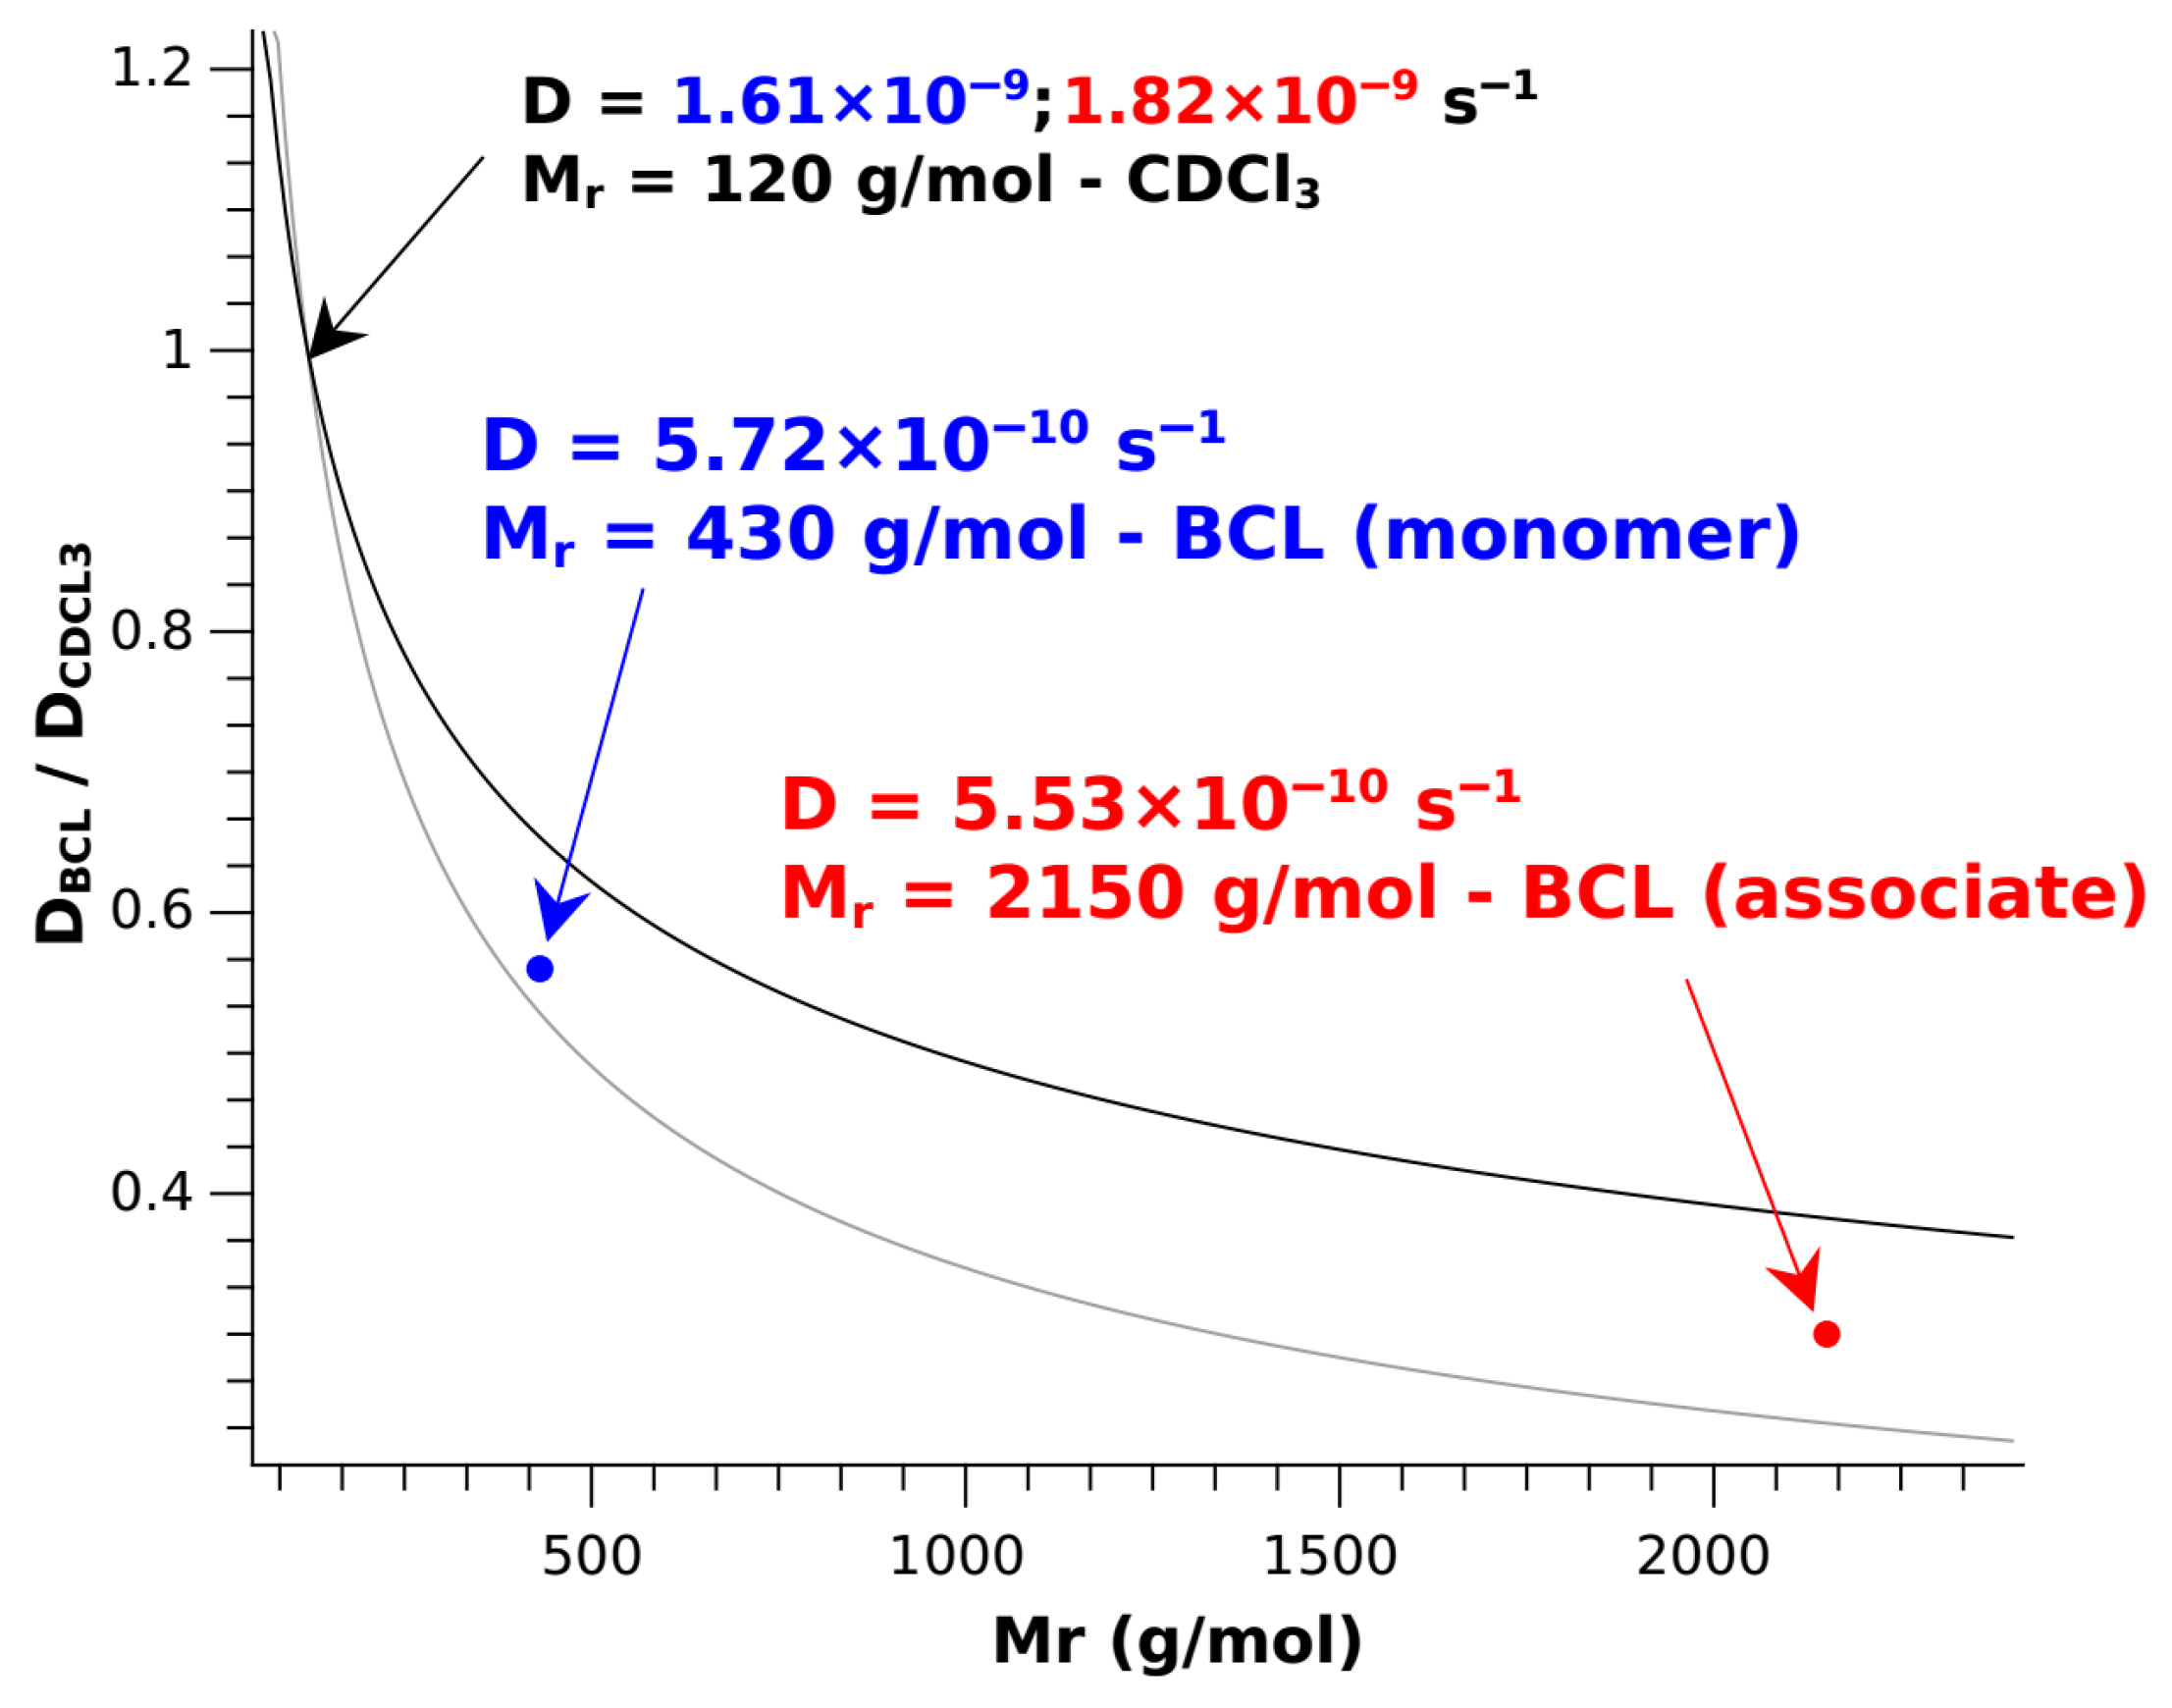
The 1H NMR spectra, recorded at temperatures of 20, 30, 40, and 50 °C (see Figure S5), underwent a comprehensive analysis. While such an analysis can provide a deeper understanding of conformational characteristics for small molecules [62,63,64], in our case, no significant changes were observed that would indicate exchange processes or conformational changes with increasing temperature. However, to identify possible dimerization effects in the saturated solution, which could also drive conformational changes, we compared DOSY spectra obtained for the saturated solution and the «low» concentration solution (see Figure S6). The data were analyzed in detail, and it was found that in the saturated solution, all proton signals of the molecules allow for the determination of the self-diffusion coefficient as DBCL = (5.52 ± 0.33) × 10−10 s−1. In contrast, the residual solvent proton signal gives DCDCl3 = 1.82 × 10⁻¹⁰ s−1. For the «low» concentration solution, the values are (5.72 ± 0.36) × 10−10 s−1 and 1.61 × 10⁻¹⁰ s−1, respectively. A direct comparison of values obtained for BCL is not always straightforward; however, qualitatively, it demonstrates a decrease in magnitude when transitioning from a low-concentration solution to a saturated solution, which is a reliable indicator of association processes. For the quantitative analysis of the obtained data, a graphical approach was employed to examine the experimentally determined DBCL values as a function of the molecular weight of the complex. DCDCl3 values were used as a reference [65]. It is well known that the ratio of DBCL/DCDCl3 lies within the square and cubic root values of the molecular mass ratio of the reference compound (CDCl3) and the formed associate [66,67,68,69,70,71] (see Equation (1)):
M C D C L 3 M B C L D B C L D C D C L 3 M C D C L 3 M B C L 3
where MCDCL3 and MBCL are the molecular weights of the reference compound and the BCL-based associate, and DBCL and DCDCL3 are the diffusion coefficients of the reference compound and the formed associate, respectively.
In accordance with Equation (1) and the square and cubic root values of the molecular mass ratios, the theoretical range of D values for the expected associates was determined (see Figure 5—gray and black lines).
As shown in Figure 5, the obtained D values for the two investigated systems fall within the range of theoretical values, underscoring the significance of our findings. Moreover, it can be stated that in the saturated solution with a solid phase, the predominant associates consist of 4–6 BCL molecules (with a molecular weight over 2000 g/mol). In contrast, in the low-concentration solution, predominantly monomeric BCL molecules are present. These results are in good agreement with the spatial structure data for BCL in the studied systems. Apparently, when existing as associates (at high concentrations and in a saturated solution), BCL forms a «closed» conformation. However, when transitioning to low-concentration solutions, BCL molecules, which exist in a monomeric form, adopt an «open» conformation. Thus, the driving force behind the conformational changes in BCL is not the presence or absence of a solid phase but rather the associative processes, accompanied by the formation and dissociation of various non-covalent interactions. These findings are presented and definitively proven for BCL for the first time, significantly complementing the overall mechanistic picture of previously conducted studies [28].
These unique findings not only underscore the validity of previous notions regarding the stabilization of the spatial structure of BCL molecules through a complex system of intra- and intermolecular non-covalent interactions [24,33], but also provide a strong confirmation. It has been previously noted that CDCl3 molecules may potentially disrupt weak π⋯π interactions and influence the redistribution of intra- and intermolecular hydrogen bonds, causing the «opening» of the structure as the concentration decreases.
Previous studies [33,72] show that association processes can stabilize BCL conformers. They suggest that intramolecular and intermolecular interactions influence the formation of these conformers. This study supports the idea that solvents indirectly influence conformational preferences by influencing the ability to associate and thereby shifting conformational equilibria.
In line with this hypothesis, a detailed analysis was conducted on the energetic and geometric characteristics of noncovalent interactions, both in the monomeric structures of BCL and in the associated structures (using dimers as a model). The study found that dimers of «closed» BCL conformers have the lowest interaction energy at −134.47 kJ/mol, compared to −102.02 and −109.08 kJ/mol for dimers of «open» conformers. The stabilization of the «closed» BCL dimers is attributed to the redistribution of multiple intra- and intermolecular interactions, as well as other weak noncovalent interactions, which are primarily responsible for stabilizing BCL associates. The study [33] reveals that «closed» BCL conformers exhibit a wider range of noncovalent interactions due to the close arrangement of their cycles, including N–H···O(H), C–H···O(C), and others. In contrast, «open» structures primarily exhibit interactions such as N–H···O(H) and C–H···O(C).
In the present work, based on DOSY data, we obtained explicit quantitative confirmation of the previously suggested hypotheses, which were based on quantum-chemical calculations and calculations of solvation and deformation energies of the BCL structure in the presence of CDCl3 [28]. The trends in the conformational changes in BCL in CDCl3 are similar to those previously observed for the BCL–DMSO-d6 system [31]. Thus, the results of the present work firm and reassuring conclusion to a series of previously conducted studies, offering a definitive experimental interpretation of the patterns of BCL spatial structure stabilization. Previous research has suggested that solvents affect conformational preferences. This study confirmed that idea, demonstrating that the solvent’s influence is indirect, impacting the ability to form specific associates.

3. Materials and Methods

The study used commercially available compounds from BLD Pharmatech (Hyderabad, India) and Sigma-Aldrich (St. Louis, MO, USA): Bicalutamide (BCL) (N-[4-cyano-3-(trifluoromethyl)phenyl]-3-[(4-fluoro-phenyl)sulfinyl]-2-hydroxy-2-methyl-propanamide; CAS No: 90357-06-5) and deuterated chloroform (CDCl3; chloroform-d1; CAS No: 865-49-6). The substances were used without further purification. NMR data were acquired using a Bruker Avance III 500 MHz spectrometer and a Bruker TBI probe (5 mm, Billerica, MA, USA). Throughout all NMR experiments, the temperature was maintained at a constant value (297 K) using a BVT 3000 (Bruker, Billerica, MA, USA)and BCU 05 (Bruker, Billerica, MA, USA) control unit. In this study, NMR spectra were recorded for four systems: a saturated solution (with a solid phase) of BCL in CDCl3, a solution without the solid phase, a solution at «high» concentration, and a solution at «low» concentration.
To prepare a saturated solution, a BCL sample (5.5 mg) was placed in an NMR tube (Wilmad, Vineland, NJ, USA), followed by the addition of CDCl3 (1 mL). The tube was immediately sealed to prevent the loss of volatile solvent. The sealed tube was placed in a laboratory air thermostat and incubated for 24 h at 297 K. After incubation, a solid phase was observed, and the tube was immediately transferred to the NMR spectrometer probe (Bruker, Billerica, MA, USA), where the temperature was maintained at 297 K, and NMR spectra were recorded. Following the analysis of the saturated solution, the NMR tube was removed from the spectrometer, placed in the thermostat, and opened. A 0.6 mL aliquot of the liquid phase was transferred to a new NMR tube, with filtration performed using a syringe filter equipped with a nylon membrane (NY) with a pore diameter of 0.45 μm. To remove any residual crystalline BCL phase and to investigate the solution without the solid phase, an additional 20 μL of solvent was added to the tube. The tube was sealed and thermally stabilized; the spectra were then recorded.
To prepare a solution at «high» concentration and conduct further analysis of the conformational behavior of BCL in CDCl3, 0.15 mL of solvent was added to the previously prepared sample, and for a solution at «low» concentration, another 0.15 mL of solvent was added.
1H NMR spectra were recorded using the «zg» pulse sequence implemented in the TopSpin 3.6.1 software package. The spectral range was 14.3 ppm, with 32 scans, a relaxation delay of 1 s, and 32,768 FID data points. NOESY 2D spectra were recorded using the «noesygpphpp» pulse sequence, with a spectral range of 14.3 ppm in both dimensions, 16 scans (2 cycles (TD) of 8 scans (NS)). The mixing time (τm) for the pulse sequence was 0.9, 0.8, 0.6, and 0.4 s. Detailed information about the structure of BCL molecules, as well as calculated data for the likely «closed» and «open» conformers, can be found in previous studies [33,73]. Details of sample preparation and additional experiments (DOSY, 1D NOESY, ROESY and VT-NMR (1H) data) can be found in the Supporting Information Section. Data were obtained using density functional theory with the Gabedit V. 2.5.2 software package [74].

4. Conclusions

Based on the data from NMR spectroscopy, a quantitative analysis of the proportions of «open» and «closed» conformer groups for four BCL systems in CDCl3 at different concentrations, as well as in the presence and absence of a solid phase, was conducted. Despite the extremely low solubility of BCL in CDCl3 for NMR analysis, it was established that conformational changes in BCL molecules are not dependent on the presence or absence of the solid phase. The primary driving force behind these changes is solvation effects, which result from concentration variations and disrupt multiple non-covalent interactions, causing the «opening» of the structure.
Conformational transitions occur within a narrow concentration range. As the concentration of the substance increases, the «closed» structure of BCL, observed in the most stable polymorphic form, is stabilized. The results of this study extend the understanding of the conformational evolution of small molecules in solution by showing, using bicalutamide as an example, that solvation effects, rather than the solid phase, primarily drive conformational changes.

Supplementary Materials

The following supporting information can be downloaded at https://www.mdpi.com/article/10.3390/molecules30224479/s1: Figure S1: Fragment of the 1H NMR spectra for a saturated solution of BCL in CDCl3, showing the OH group signal of BCL molecules at different time intervals; Figure S2: Dependence of averaged integral intensities on mixing time for the reference and conformer-defined distances from NOESY spectra analysis; Table S1: Values of integral intensities, cross-relaxation rates, and errors from 2D NOESY spectra for the four studied systems, BCL in CDCl3; Figure S3: Comparison of NOESY and ROESY spectra of a saturated solution of BCL in CDCl3; Figure S4: 1D NOESY spectrum of a saturated solution of BCL in CDCl3 with H12b selected as the “irradiated” signal; Figure S5: 1H NMR spectra of the saturated solution of BCL in CDCl3 at different temperatures; Figure S6: DOSY NMR spectra of the saturated and “low” concentration solutions of BCL in CDCl3.

Author Contributions

Conceptualization, I.A.K.; methodology, I.A.K.; software, I.A.K.; validation, I.A.K. and K.V.B.; formal analysis, I.A.K. and K.V.B.; investigation, I.A.K. and K.V.B.; resources, I.A.K.; data curation, I.A.K.; writing—original draft preparation, K.V.B.; writing—review and editing, I.A.K.; visualization, K.V.B.; supervision, I.A.K.; project administration, I.A.K.; funding acquisition, I.A.K. All authors have read and agreed to the published version of the manuscript.

Funding

The research was supported by a grant of the Russian Science Foundation (project no. 24-23-00318).

Institutional Review Board Statement

Not applicable.

Informed Consent Statement

Not applicable.

Data Availability Statement

The original contributions presented in this study are included in the article and Supplementary Materials. Further inquiries can be directed to the corresponding author.

Conflicts of Interest

The authors declare no conflicts of interest.

References

  1. Peng, R.; Qin, X.; Lin, J.; Wang, L.; Wu, S.; Gong, J. Discovery and Selective Nucleation of Polymorphs of Flexible GABA Molecules: Solvation Effects and Conformational Rearrangement. Cryst. Growth Des. 2024, 24, 8505–8515. [Google Scholar] [CrossRef]
  2. Liu, Y.; Wang, Y.; Huang, X.; Li, X.; Zong, S.; Wang, N.; Hao, H. Conformational Selectivity and Evolution Affected by the Desolvation Process. Cryst. Growth Des. 2022, 22, 1283–1291, Erratum in Cryst. Growth Des. 2023, 23, 2011–2012 https://doi.org/10.1021/ACS.CGD.3C00061. [Google Scholar] [CrossRef]
  3. Tian, B.; Hao, H.; Huang, X.; Wang, T.; Wang, J.; Yang, J.; Li, X.; Li, W.; Zhou, L.; Wang, N. Solvent Effect on Molecular Conformational Evolution and Polymorphic Manipulation of Cimetidine. Cryst. Growth Des. 2023, 23, 7266–7275. [Google Scholar] [CrossRef]
  4. Shi, P.; Xu, S.; Ma, Y.; Tang, W.; Zhang, F.; Wang, J.; Gong, J. Probing the Structural Pathway of Conformational Polymorph Nucleation by Comparing a Series of a,x-Alkanedicarboxylic Acids. IUCrJ 2020, 7, 422–433. [Google Scholar] [CrossRef]
  5. Tiruveedi, V.; Prasad, S.R.; Swain, D.; Nechipadappu, S.K.; Balasubramanian, S. Third Polymorph and Salt Complexes of Teriflunomide-A Multiple Sclerosis Drug. J. Mol. Struct. 2025, 1347, 143371. [Google Scholar] [CrossRef]
  6. Cruz-Cabeza, A.J.; Bernstein, J. Conformational Polymorphism. Chem. Rev. 2014, 114, 2170–2191. [Google Scholar] [CrossRef]
  7. Shi, P.; Han, Y.; Zhu, Z.; Gong, J. Research Progress on the Molecular Mechanism of Polymorph Nucleation in Solution: A Perspective from Research Mentality and Technique. Crystals 2023, 13, 1206. [Google Scholar] [CrossRef]
  8. Nangia, A. Conformational Polymorphism in Organic Crystals. Acc. Chem. Res. 2008, 41, 595–604. [Google Scholar] [CrossRef] [PubMed]
  9. Nowak, M.; Dyba, A.J.; Janczak, J.; Morritt, A.; Fábián, L.; Karolewicz, B.; Khimyak, Y.Z.; Braun, D.E.; Nartowski, K.P. Directing Crystallization Outcomes of Conformationally Flexible Molecules: Polymorphs, Solvates, and Desolvation Pathways of Fluconazole. Mol. Pharm. 2022, 19, 456–471. [Google Scholar] [CrossRef]
  10. Wu, D.; Li, S.; Feng, Y.; Chen, C.; Fu, L.; Chen, G.; Wang, N.; Wang, T.; Huang, X.; Hao, H. Unveiling the Conformational Landscape of Tizanidine and Its Effects on Selective Nucleation: Enabling Controlled Manipulation of Polymorphs and Solvates. Sep. Purif. Technol. 2025, 354, 128827. [Google Scholar] [CrossRef]
  11. Zeglinski, J.; Kuhs, M.; Khamar, D.; Hegarty, A.C.; Devi, R.K.; Rasmuson, Å.C. Crystal Nucleation of Tolbutamide in Solution: Relationship to Solvent, Solute Conformation, and Solution Structure. Chem.—A Eur. J. 2018, 24, 4916–4926. [Google Scholar] [CrossRef]
  12. Pons Siepermann, C.A.; Myerson, A.S. Inhibition of Nucleation Using a Dilute, Weakly Hydrogen-Bonding Molecular Additive. Cryst. Growth Des. 2018, 18, 3584–3595. [Google Scholar] [CrossRef]
  13. Gebauer, D.; Kellermeier, M.; Gale, J.D.; Bergström, L.; Cölfen, H. Pre-Nucleation Clusters as Solute Precursors in Crystallisation. Chem. Soc. Rev. 2014, 43, 2348–2371. [Google Scholar] [CrossRef]
  14. Carpenter, J.E.; Grünwald, M. Pre-Nucleation Clusters Predict Crystal Structures in Models of Chiral Molecules. J. Am. Chem. Soc. 2021, 143, 21580–21593. [Google Scholar] [CrossRef]
  15. Dighe, A.V.; Coliaie, P.; Podupu, P.K.R.; Singh, M.R. Selective Desolvation in Two-Step Nucleation Mechanism Steers Crystal Structure Formation. Nanoscale 2022, 14, 1723–1732. [Google Scholar] [CrossRef] [PubMed]
  16. Oparin, R.D.; Krestyaninov, M.A.; Ivlev, D.V.; Kiselev, M.G. Molecular Mechanism of Conformational Crossover of Mefenamic Acid Molecules in ScCO2. Materials 2023, 16, 1403. [Google Scholar] [CrossRef] [PubMed]
  17. Khodov, I.A.; Belov, K.V.; Dyshin, A.A.; Krestyaninov, M.A.; Kiselev, M.G. Pressure Effect on Lidocaine Conformational Equilibria in ScCO2: A Study by 2D NOESY. J. Mol. Liq. 2022, 367, 120525. [Google Scholar] [CrossRef]
  18. Koperwas, K.; Tu, W.; Affouard, F.; Adrjanowicz, K.; Kaskosz, F.; Paluch, M. Pressure Dependence of the Crystallization Rate for the S-Enantiomer and a Racemic Mixture of Ibuprofen. Cryst. Growth Des. 2021, 21, 7075–7086. [Google Scholar] [CrossRef] [PubMed]
  19. Wright, S.E.; Cole, J.C.; Cruz-Cabeza, A.J. Conformational Change in Molecular Crystals: Impact of Solvate Formation and Importance of Conformational Free Energies. Cryst. Growth Des. 2021, 21, 6924–6936. [Google Scholar] [CrossRef]
  20. Cordova, I.W.; Teixeira, G.; Ribeiro-Claro, P.J.A.; Abranches, D.O.; Pinho, S.P.; Ferreira, O.; Coutinho, J.A.P. Using Molecular Conformers in COSMO-RS to Predict Drug Solubility in Mixed Solvents. Ind. Eng. Chem. Res. 2024, 63, 9565–9575. [Google Scholar] [CrossRef]
  21. Szczurek, J.; Rams-Baron, M.; Knapik-Kowalczuk, J.; Antosik, A.; Szafraniec, J.; Jamróz, W.; Dulski, M.; Jachowicz, R.; Paluch, M. Molecular Dynamics, Recrystallization Behavior, and Water Solubility of the Amorphous Anticancer Agent Bicalutamide and Its Polyvinylpyrrolidone Mixtures. Mol. Pharm. 2017, 14, 1071–1081. [Google Scholar] [CrossRef]
  22. Szafraniec, J.; Antosik, A.; Knapik-Kowalczuk, J.; Gawlak, K.; Kurek, M.; Szlęk, J.; Jamróz, W.; Paluch, M.; Jachowicz, R. Molecular Disorder of Bicalutamide—Amorphous Solid Dispersions Obtained by Solvent Methods. Pharmaceutics 2018, 10, 194. [Google Scholar] [CrossRef]
  23. Perlovich, G.L.; Blokhina, S.V.; Manin, N.G.; Volkova, T.V.; Tkachev, V.V. Polymorphism and Solvatomorphism of Bicalutamide: Thermophysical Study and Solubility. J. Therm. Anal. Calorim. 2013, 111, 655–662. [Google Scholar] [CrossRef]
  24. Vega, D.R.; Polla, G.; Martinez, A.; Mendioroz, E.; Reinoso, M. Conformational Polymorphism in Bicalutamide. Int. J. Pharm. 2007, 328, 112–118. [Google Scholar] [CrossRef] [PubMed]
  25. Bis, J.A.; Vishweshwar, P.; Weyna, D.; Zaworotko, M.J. Hierarchy of Supramolecular Synthons: Persistent Hydroxyl···Pyridine Hydrogen Bonds in Cocrystals That Contain a Cyano Acceptor. Mol. Pharm. 2007, 4, 401–416. [Google Scholar] [CrossRef]
  26. Bohl, C.E.; Gao, W.; Miller, D.D.; Bell, C.E.; Dalton, J.T. Structural Basis for Antagonism and Resistance of Bicalutamide in Prostate Cancer. Proc. Natl. Acad. Sci. USA 2005, 102, 6201–6206. [Google Scholar] [CrossRef] [PubMed]
  27. Hu, X.R.; Gu, J.M. N-[4-Cyano-3-(Trifluoromethyl)Phenyl]-3-(4-Fluorophenylsulfonyl) -2-Hydroxy-2-Methylpropionamide. Acta Crystallogr. Sect. E Struct. Rep. Online 2005, 61, o3897–o3898. [Google Scholar] [CrossRef]
  28. Belov, K.V.; Khodov, I.A. Conformational Landscape, Polymorphism, and Solid Forms Design of Bicalutamide: A Review. Molecules 2025, 30, 3793. [Google Scholar] [CrossRef]
  29. Borrego-Munõz, P.; Becerra, L.D.; Ospina, F.; Coy-Barrera, E.; Quiroga, D. Synthesis (Z) vs (E) Selectivity, Antifungal Activity against Fusarium Oxysporum, and Structure-Based Virtual Screening of Novel Schiff Bases Derived from l-Tryptophan. ACS Omega 2022, 7, 24714–24726. [Google Scholar] [CrossRef] [PubMed]
  30. Ulutürk, M.; Karabacak Atay, Ç.; Tilki, T.; Dede, B. Structural Properties, Molecular Modeling Studies and Antioxidant Activities of Novel Benzoic Acid-Based Azo Molecules: A Combined in Vitro and in Silico Study. J. Mol. Struct. 2025, 1344, 142990. [Google Scholar] [CrossRef]
  31. Belov, K.V.; Khodov, I.A. NOESY Investigation of Bicalutamide Conformational Changes in DMSO: Role of Solution Concentration in Polymorph Formation. J. Mol. Liq. 2025, 422, 126896. [Google Scholar] [CrossRef]
  32. Yamasaki, R.; Tanatani, A.; Azumaya, I.; Masu, H.; Yamaguchi, K.; Kagechika, H. Solvent-Dependent Conformational Switching of N-Phenylhydroxamic Acid and Its Application in Crystal Engineering. Cryst. Growth Des. 2006, 6, 2007–2010. [Google Scholar] [CrossRef]
  33. Mololina, A.A.; Sobornova, V.V.; Belov, K.V.; Krestyaninov, M.A.; Khodov, I.A. Role of Non-Covalent Interactions in the Conformational Stability of Bicalutamide in Different Solvent Environments: Insights from Quantum-Chemical Calculations and NMR Spectroscopy. J. Mol. Liq. 2025, 423, 126921. [Google Scholar] [CrossRef]
  34. Pronina, Y.A.; Stepakov, A.V.; Berezhnaya, E.V.; Boitsov, V.M.; Baichurin, R.I.; Selivanov, S.I. The Applicability of NMR Spectroscopy in the Determination of Structures Containing a Fragment of Spiro[1-Azabicyclo[3.3.0]Octane]. Appl. Magn. Reson. 2025, 56, 937–953. [Google Scholar] [CrossRef]
  35. Klochkov, V.V.; Karatayeva, F.K.; Shaikhutdinov, R.A.; Khairutdinov, B.I.; Molins, M.A.; Pons, M. Separation of Cross-Relaxation and Exchange in Two-Site Spin Systems without Resolved Couplings. Appl. Magn. Reson. 2002, 22, 431–438. [Google Scholar] [CrossRef]
  36. Gadiev, T.A.; Khairutdinov, B.I.; Shaikhutdinov, R.A.; Karatayeva, F.K.; Aganov, A.V.; Klochkov, V.V. Spatial Structure of Dimeric Capsules of Tetraurea Calix[4]Arenes in Solutions According to 2-D NMR (NOESY) Spectroscopy. Appl. Magn. Reson. 2003, 25, 347–352. [Google Scholar] [CrossRef]
  37. Butts, C.P.; Jones, C.R.; Towers, E.C.; Flynn, J.L.; Appleby, L.; Barron, N.J.; Barrona, N.J. Interproton Distance Determinations by NOE—Surprising Accuracy and Precision in a Rigid Organic Molecule. Org. Biomol. Chem. 2011, 9, 177–184. [Google Scholar] [CrossRef]
  38. Belov, K.V.; Batista de Carvalho, L.A.E.; Dyshin, A.A.; Efimov, S.V.; Khodov, I.A. The Role of Hidden Conformers in Determination of Conformational Preferences of Mefenamic Acid by NOESY Spectroscopy. Pharmaceutics 2022, 14, 2276. [Google Scholar] [CrossRef]
  39. Khodov, I.A.; Belov, K.V.; Krestyaninov, M.A.; Sobornova, V.V.; Dyshin, A.A.; Kiselev, M.G. Does DMSO Affect the Conformational Changes of Drug Molecules in Supercritical CO2 Media? J. Mol. Liq. 2023, 384, 122230. [Google Scholar] [CrossRef]
  40. Belov, K.V.; Dyshin, A.A.; Krestyaninov, M.A.; Efimov, S.V.; Khodov, I.A.; Kiselev, M.G. Conformational Preferences of Tolfenamic Acid in DMSO-CO2 Solvent System by 2D NOESY. J. Mol. Liq. 2022, 367, 120481. [Google Scholar] [CrossRef]
  41. Scheidt, H.A.; Huster, D. The Interaction of Small Molecules with Phospholipid Membranes Studied by 1H NOESY NMR under Magic-Angle Spinning. Acta Pharmacol. Sin. 2008, 29, 35–49. [Google Scholar] [CrossRef]
  42. Scheidt, H.A.; Flasche, W.; Cismas, C.; Rost, M.; Herrmann, A.; Liebscher, J.; Huster, D. Design and Application of Lipophilic Nucleosides as Building Blocks to Obtain Highly Functional Biological Surfaces. J. Phys. Chem. B 2004, 108, 16279–16287. [Google Scholar] [CrossRef]
  43. Ma, T.; Chen, S.; Zhuang, Y.; Xiao, F.; Wei, J.; Wan, Z.; Qin, M.; Sun, T.; Chen, J. Experimental Crystal Structure, Conformational and Spectroscopic Studies of Allisartan Isoproxil Accomplished with DFT Calculations. J. Mol. Struct. 2025, 1347, 143289. [Google Scholar] [CrossRef]
  44. Dewis, L.; Crouch, R.; Russell, D.; Butts, C. Improving the Accuracy of 1H–19F Internuclear Distance Measurement Using 2D 1H–19F HOESY. Magn. Reson. Chem. 2019, 57, 1143–1149. [Google Scholar] [CrossRef]
  45. Yemloul, M.; Bouguet-Bonnet, S.; Ba, L.A.C.; Kirsch, G.; Canet, D. Selective HOESY Experiments for Stereochemical Determinations. Magn. Reson. Chem. 2008, 46, 939–942. [Google Scholar] [CrossRef] [PubMed]
  46. Lee, W.; Krishna, N.R. Influence of Conformational Exchange on the 2D NOESY Spectra of Biomolecules Existing in Multiple Conformations. J. Magn. Reson. 1992, 98, 36–48. [Google Scholar] [CrossRef]
  47. Butts, C.P.; Jones, C.R.; Song, Z.; Simpson, T.J. Accurate NOE-Distance Determination Enables the Stereochemical Assignment of a Flexible Molecule—Arugosin C. Chem. Commun. 2012, 48, 9023–9025. [Google Scholar] [CrossRef]
  48. Novikova, D.; Al Mustafa, A.; Grigoreva, T.; Vorona, S.; Selivanov, S.; Tribulovich, V. NMR-Verified Dearomatization of 5,7-Substituted Pyrazolo[1,5-a]Pyrimidines. Molecules 2023, 28, 6584. [Google Scholar] [CrossRef] [PubMed]
  49. Hu, H.; Krishnamurthy, K. Revisiting the Initial Rate Approximation in Kinetic NOE Measurements. J. Magn. Reson. 2006, 182, 173–177. [Google Scholar] [CrossRef]
  50. Borgias, B.A.; Gochin, M.; Kerwood, D.J.; James, T.L. Relaxation Matrix Analysis of 2D NMR Data. Prog. Nucl. Magn. Reson. Spectrosc. 1990, 22, 83–100. [Google Scholar] [CrossRef]
  51. Bame, J.; Hoeck, C.; Carrington, M.J.; Butts, C.P.; Jäger, C.M.; Croft, A.K. Improved NOE Fitting for Flexible Molecules Based on Molecular Mechanics Data—A Case Study with S-Adenosylmethionine. Phys. Chem. Chem. Phys. 2018, 20, 7523–7531. [Google Scholar] [CrossRef]
  52. Macur, S.; Farmer, B.T.; Brown, L.R. An Improved Method for the Determination of Cross-Relaxation Rates from NOE Data. J. Magn. Reson. 1986, 70, 493–499. [Google Scholar] [CrossRef]
  53. Esposito, G.; Pastore, A. An Alternative Method for Distance Evaluation from NOESY Spectra. J. Magn. Reson. 1988, 76, 331–336. [Google Scholar] [CrossRef]
  54. Klochkov, V.V.; Khairutdinov, B.I.; Shaikhutdinov, R.A.; Findaisen, M.; Berger, S. Geometric Structure of 2-Phenyl-1,3-Dithia-5,6-Benzocycloheptene 1-Oxide. Russ. J. Gen. Chem. 2001, 71, 1266–1268. [Google Scholar] [CrossRef]
  55. Efimov, S.V.; Khodov, I.A.; Ratkova, E.L.; Kiselev, M.G.; Berger, S.; Klochkov, V.V. Detailed NOESY/T-ROESY Analysis as an Effective Method for Eliminating Spin Diffusion from 2D NOE Spectra of Small Flexible Molecules. J. Mol. Struct. 2016, 1104, 63–69. [Google Scholar] [CrossRef]
  56. Kolmer, A.; Edwards, L.J.; Kuprov, I.; Thiele, C.M. Conformational Analysis of Small Organic Molecules Using NOE and RDC Data: A Discussion of Strychnine and α-Methylene-γ-Butyrolactone. J. Magn. Reson. 2015, 261, 101–109. [Google Scholar] [CrossRef]
  57. Butts, C.P.; Jones, C.R.; Harvey, J.N. High Precision NOEs as a Probe for Low Level Conformers—A Second Conformation of Strychnine. Chem. Commun. 2011, 47, 1193–1195. [Google Scholar] [CrossRef]
  58. Sternberg, U.; Witter, R. Structures Controlled by Entropy: The Flexibility of Strychnine as Example. Molecules 2022, 27, 7987. [Google Scholar] [CrossRef] [PubMed]
  59. Pronina, Y.A.; Stepakov, A.V.; Popova, E.A.; Boitsov, V.M.; Baichurin, R.I.; Selivanov, S.I. Diastereomers of Cyclopropa[a]Pyrrolizine Spiro-Fused with a Benzo[4,5]Imidazo[1,2-a]Indole Fragment: Structure Determinations Using NMR Methods. Appl. Magn. Reson. 2023, 54, 999–1014. [Google Scholar] [CrossRef]
  60. Khodov, I.; Dyshin, A.; Efimov, S.; Ivlev, D.; Kiselev, M. High-Pressure NMR Spectroscopy in Studies of the Conformational Composition of Small Molecules in Supercritical Carbon Dioxide. J. Mol. Liq. 2020, 309, 113113. [Google Scholar] [CrossRef]
  61. Bauer, C.J.; Frenkiel, T.A.; Lane, A.N. A Comparison of the ROESY and NOESY Experiments for Large Molecules, with Application to Nucleic Acids. J. Magn. Reson. 1990, 87, 144–152. [Google Scholar] [CrossRef]
  62. Rakhmatullin, I.Z.; Galiullina, L.F.; Balandina, A.A.; Garipov, M.R.; Strelnik, A.D.; Galiullina, A.S.; Shtyrlin, Y.G.; Klochkov, V.V. Stereodynamics of Some Pyridoxine Derivatives. Magn. Reson. Chem. 2017, 55, 304–311. [Google Scholar] [CrossRef] [PubMed]
  63. Rakhmatullin, I.Z.; Galiullina, L.F.; Garipov, M.R.; Strel’Nik, A.D.; Shtyrlin, Y.G.; Klochkov, V.V. Dynamic NMR Study of Cyclic Derivatives of Pyridoxine. Magn. Reson. Chem. 2014, 52, 769–778. [Google Scholar] [CrossRef]
  64. Jones, C.R.; Greenhalgh, M.D.; Bame, J.R.; Simpson, T.J.; Cox, R.J.; Marshall, J.W.; Butts, C.P. Subtle Temperature-Induced Changes in Small Molecule Conformer Dynamics—Observed and Quantified by NOE Spectroscopy. Chem. Commun. 2016, 52, 2920–2923. [Google Scholar] [CrossRef]
  65. Oliva, A.I.; Gómez, K.; González, G.; Ballester, P. Diffusion-Ordered Spectroscopy (1H-DOSY) of Zn-Porphyrin Assemblies Induced by Coordination with DABCO. New J. Chem. 2008, 32, 2159–2163. [Google Scholar] [CrossRef]
  66. Efimov, S.V.; Zgadzay, Y.O.; Tarasova, N.B.; Klochkov, V.V. Evidence of Oligomerization of Bovine Insulin in Solution given by NMR. Eur. Biophys. J. 2018, 47, 881–889. [Google Scholar] [CrossRef] [PubMed]
  67. Cabrita, E.J.E.J.; Berger, S. HR-DOSY as a New Tool for the Study of Chemical Exchange Phenomena. Magn. Reson. Chem. 2002, 40, S122–S127. [Google Scholar] [CrossRef]
  68. Mamardashvili, G.M.; Maltceva, O.V.; Lazovskiy, D.A.; Khodov, I.A.; Borovkov, V.; Mamardashvili, N.Z.; Koifman, O.I. Medium Viscosity Effect on Fluorescent Properties of Sn(IV)-Tetra(4-Sulfonatophenyl)Porphyrin Complexes in Buffer Solutions. J. Mol. Liq. 2019, 277, 1047–1053. [Google Scholar] [CrossRef]
  69. Volostnykh, M.V.; Kirakosyan, G.A.; Sinelshchikova, A.A.; Loboda, P.A.; Dorovatovskii, P.V.; Mikhaylov, M.A.; Tsivadze, A.Y.; Sokolov, M.N.; Gorbunova, Y.G. Supramolecular Hybrids Based on Ru(II) Porphyrin and Octahedral Mo(II) Iodide Cluster. Dalt. Trans. 2023, 52, 5354–5365. [Google Scholar] [CrossRef] [PubMed]
  70. Waldeck, A.R.; Kuchel, P.W.; Lennon, A.J.; Chapman, B.E. NMR Diffusion Measurements to Characterise Membrane Transport and Solute Binding. Prog. Nucl. Magn. Reson. Spectrosc. 1997, 30, 39–68. [Google Scholar] [CrossRef]
  71. Holz, M.; Mao, X.A.; Seiferling, D.; Sacco, A. Experimental Study of Dynamic Isotope Effects in Molecular Liquids: Detection of Translation-Rotation Coupling. J. Chem. Phys. 1996, 104, 669–679. [Google Scholar] [CrossRef]
  72. Dhaked, D.K.; Jain, V.; Kasetti, Y.; Bharatam, P.V. Conformational Polymorphism in Bicalutamide: A Quantum Chemical Study. Struct. Chem. 2012, 23, 1857–1866. [Google Scholar] [CrossRef]
  73. Sobornova, V.V.; Belov, K.V.; Krestyaninov, M.A.; Khodov, I.A. Influence of Solvent Polarity on the Conformer Ratio of Bicalutamide in Saturated Solutions: Insights from NOESY NMR Analysis and Quantum-Chemical Calculations. Int. J. Mol. Sci. 2024, 25, 8254. [Google Scholar] [CrossRef]
  74. Allouche, A.R. Gabedita—A Graphical User Interface for Computational Chemistry Softwares. J. Comput. Chem. 2011, 32, 174–182. [Google Scholar] [CrossRef] [PubMed]
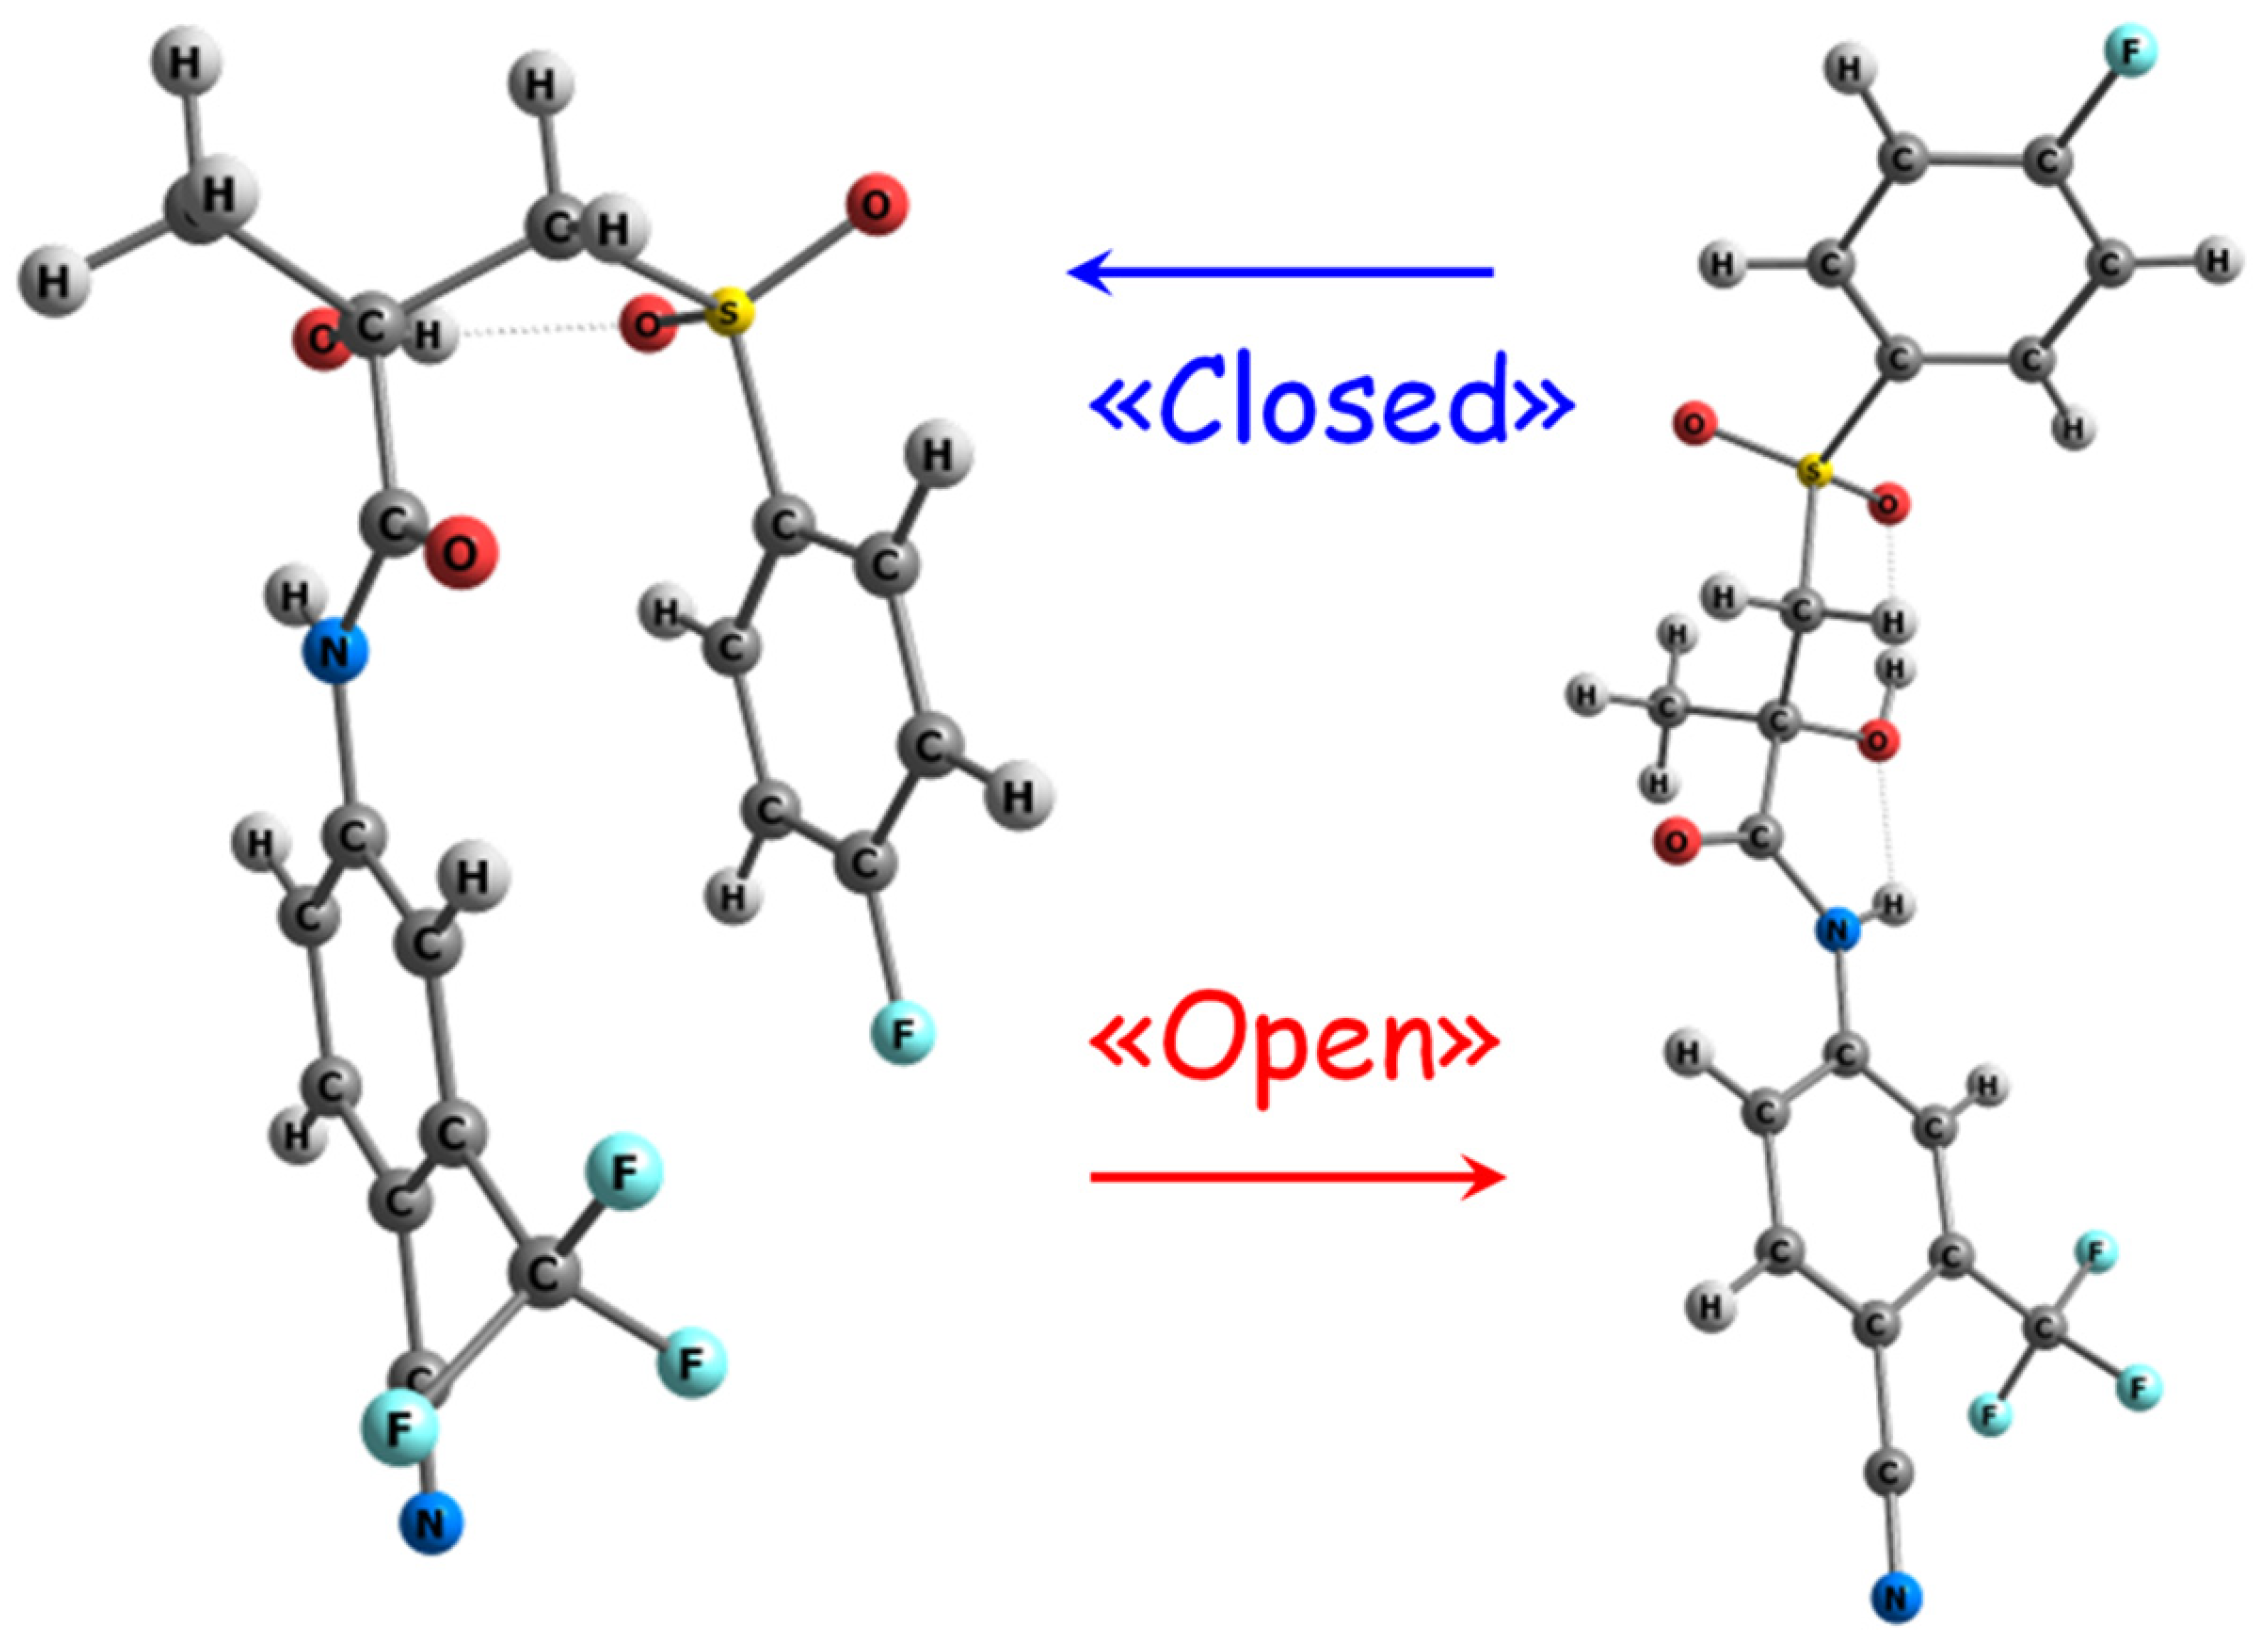
Figure 1. Examples of structures of «closed» (left) and «open» (right) conformers of BCL.
Molecules 30 04479 g001
Figure 2. On the (left)—1H NMR spectra of BCL in saturated solution (a), solution without solid phase (b), «high» concentration solution (c), and «low» concentration solution (d). On the (right)—structure of bicalutamide with atom labels corresponding to the signal assignments in the spectra shown.
Molecules 30 04479 g002
Figure 3. NOESY NMR spectra recorded for a saturated solution (black), solution without the solid phase (blue), solution at «high» concentration (red), and at «low» concentration (green).
Molecules 30 04479 g003
Figure 4. (Left column)—graphs of the difference between calculated and experimental values of the H12b-H14/18 distance as a function of the conformer population. The gray dashed line indicates the error limit in determining the conformer-defined distance from NOESY data. (Right column)—bar charts showing the distribution of «open» and «closed» conformers obtained from NOESY data and the H12b-H14/18 distance as conformer-defined.
Molecules 30 04479 g004aMolecules 30 04479 g004b
Figure 5. Graphical analysis of self-diffusion coefficients versus molecular weight from DOSY NMR spectroscopy. The blue dot represents the monomeric structure of BCL, the red dot represents the structure of an associate of five BCL molecules, and the black dot represents the reference compound (CDCl3).
Molecules 30 04479 g005
Table 1. Cross-relaxation rates, experimental and calculated distances for the four studied BCL systems in CDCl3.
Systemσexp×10−3, s−1σ0×10−1, s−1rexp, ÅrClose, ÅrOpen, År0, Å
Saturated solution1.87 ± 0.212.52 ± 0.994.03 ± 0.084.28 ± 0.183.46 ± 0.491.78 ± 0.01
Without the solid phase1.96 ± 0.112.51 ± 0.113.99 ± 0.08
«High» concentration1.85 ± 0.232.47 ± 0.144.04 ± 0.08
«Low» concentration4.16 ± 0.372.51 ± 0.163.53 ± 0.07
Disclaimer/Publisher’s Note: The statements, opinions and data contained in all publications are solely those of the individual author(s) and contributor(s) and not of MDPI and/or the editor(s). MDPI and/or the editor(s) disclaim responsibility for any injury to people or property resulting from any ideas, methods, instructions or products referred to in the content.