2.1. Structural and Functional Analysis
The synthesized SDC after slow cooling in air has a stoichiometry of Sr
0.8Dy
0.2CoO
2.65. The PXRD pattern of the SDC sample is presented in
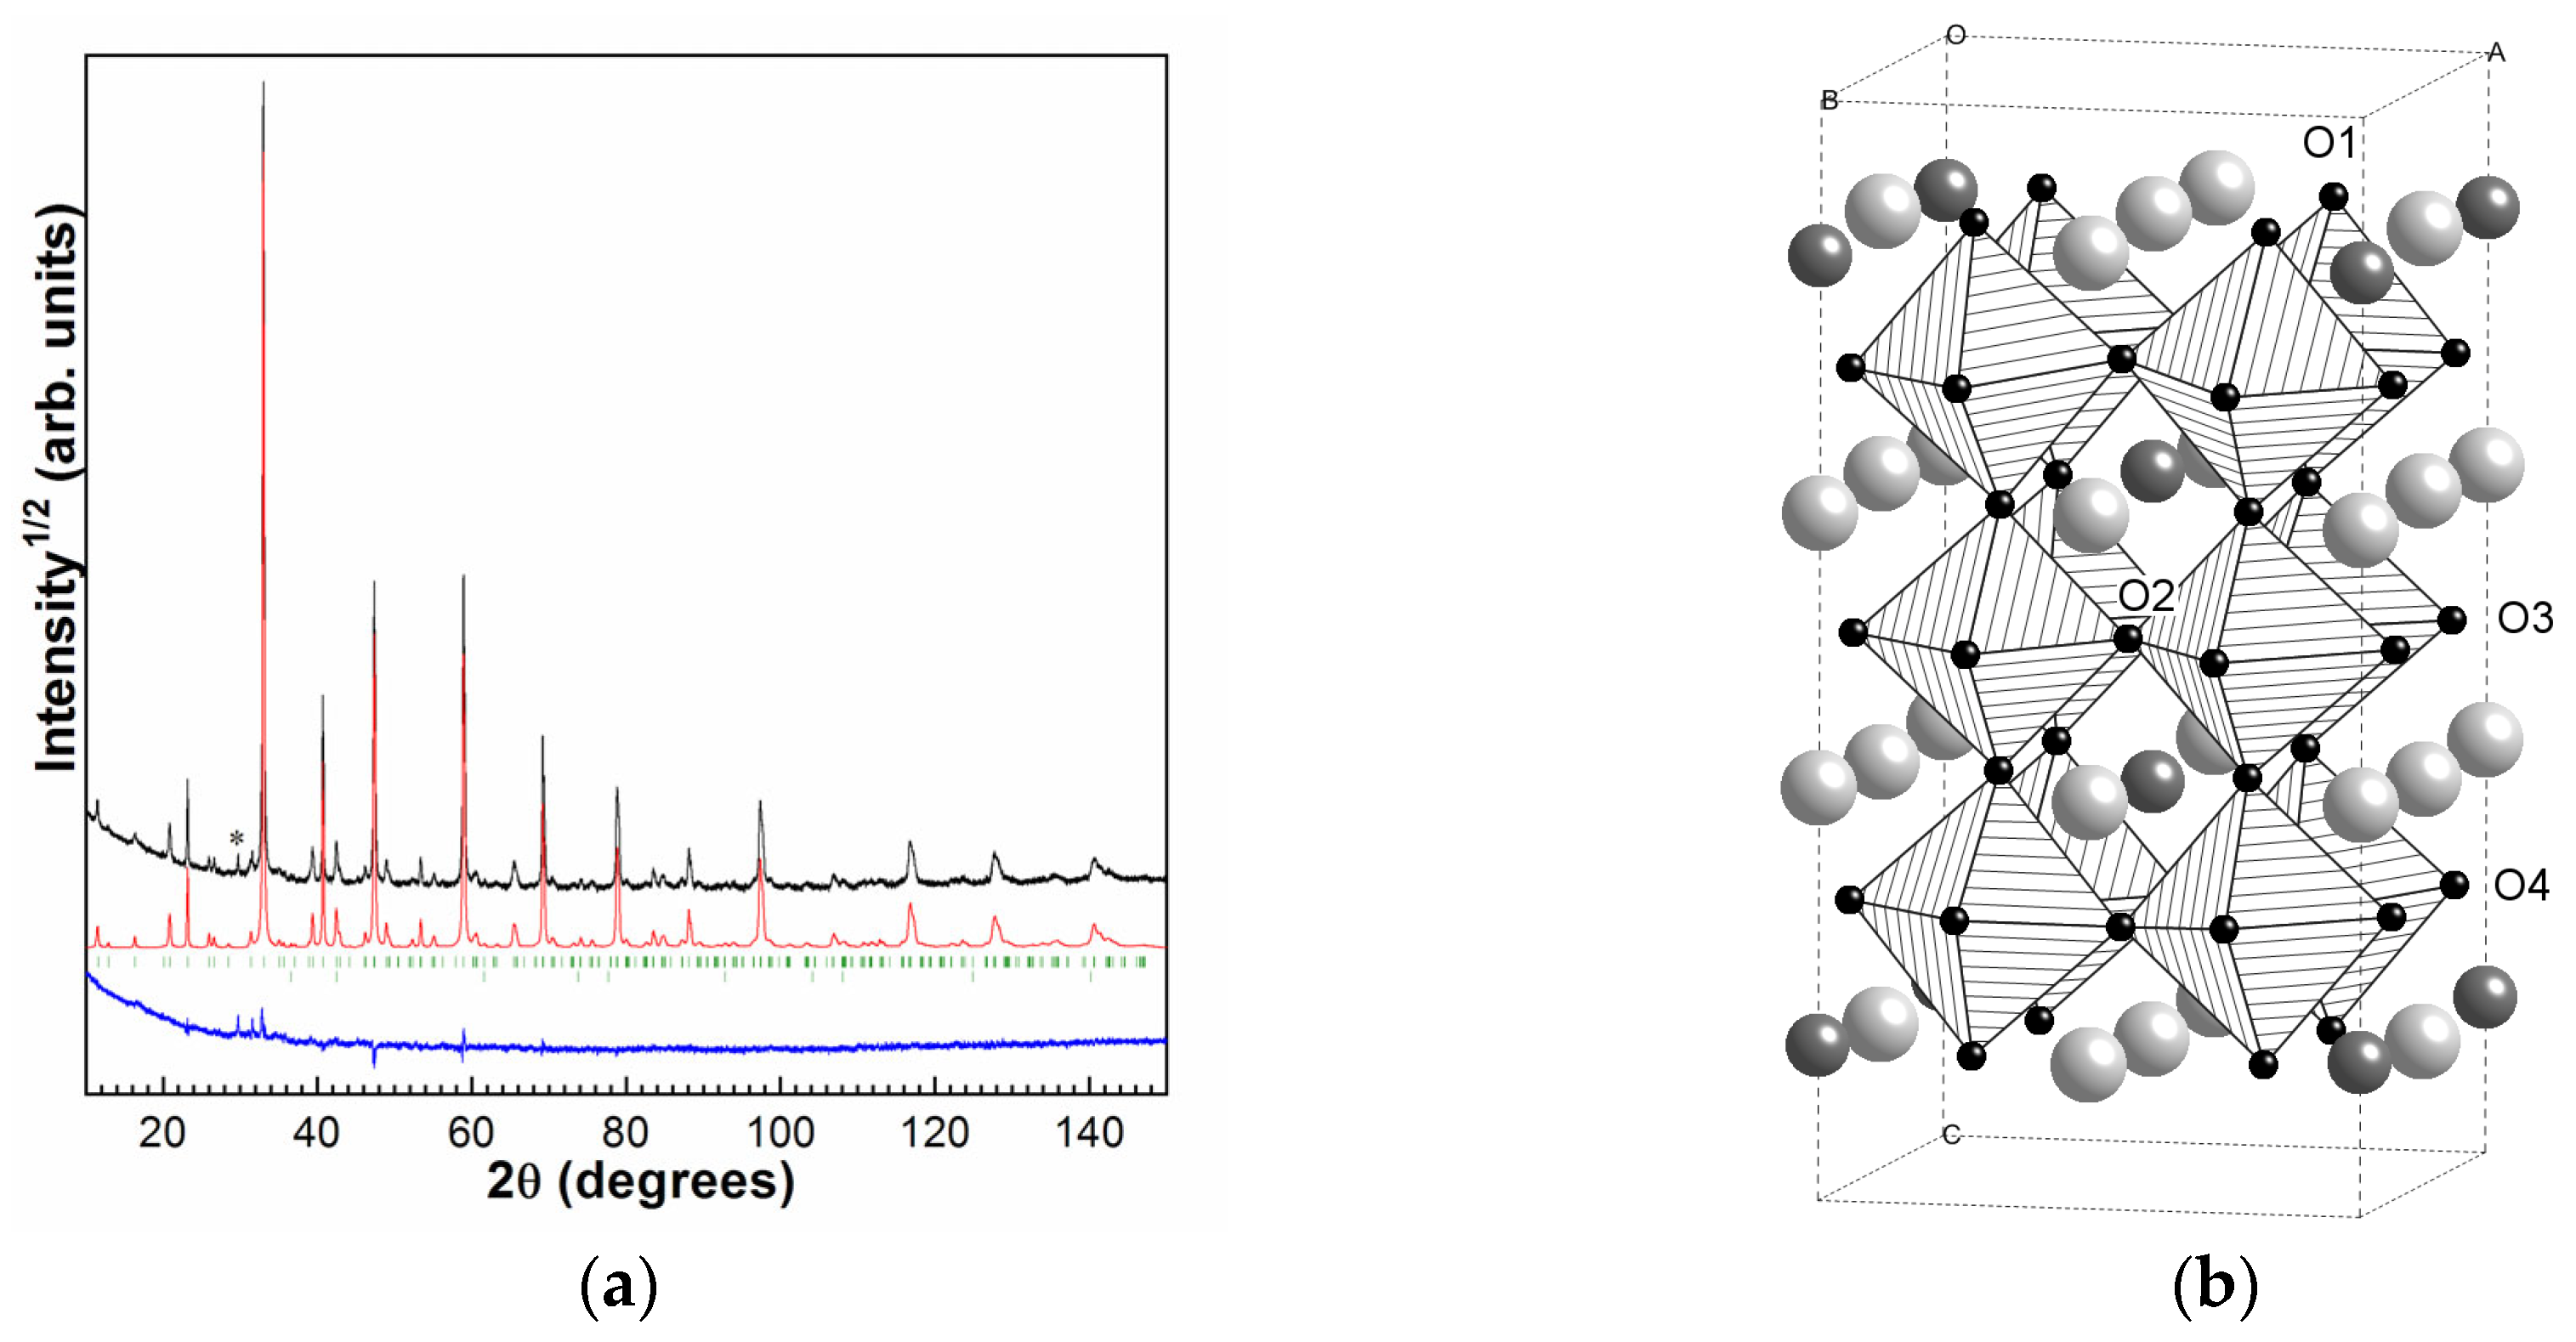
Figure 1a. In addition to the main tetragonal phase of SDC, about 0.5% of cobalt oxide was found in the synthesized ceramics. According to the full-profile structure refinement, the structure of SDC corresponds to the tetragonal
I4/mmm superstructure (
a = 7.6716(3) Å,
c = 15.3659(9) Å) with ordered anion vacancies and Dy
3+/Sr
2+ cations. The structure is identical to that described in [
15], observed earlier by us for Sr
0.8Gd
0.2CoO
3−δ [
16] and for Sr
0.8Dy
0.2CoO
3−δ [
17]. The most important feature of the structure is that in addition to the Dy
3+/Sr
2+ cations ordering in three distinct crystallographic A-positions, it accommodates four positions for O
2− anions which is also the sites for anion vacancies. The regular arrangement of Sr
2+/Dy
3+ positions are accompanied by orderliness in the oxygen vacancies’ location (which are situated mostly in O2 sites) [
15],
Figure 1b.
As noted in the introduction, the presence of oxygen vacancies can favorably affect the system’s ability to realize intercalation pseudocapacity. In the tetragonal and cubic phases of Sr
xLa
(1−x)CoO
3−δ, the presence of anion vacancies is related to the nonstoichiometry coefficient δ, and their number can be controlled by oxygen addition/abstraction processes. It has been established that under conditions of heating, strontium cobaltites doped with rare earth cations exhibit the reversible loss of oxygen [
18,
19] according to Equations (1) and (2), written as follows:
The amount of oxygen removed and the rate of the process depend on temperature, oxygen partial pressure, composition x, and the initial value of the non-stoichiometry
coefficient δ of cobaltite Sr
xLn
(1−x)CoO
3−δ. The onset of this process is typically observed at temperatures in the range of 550–600 K. The oxygen evolution can be monitored by TG analysis (
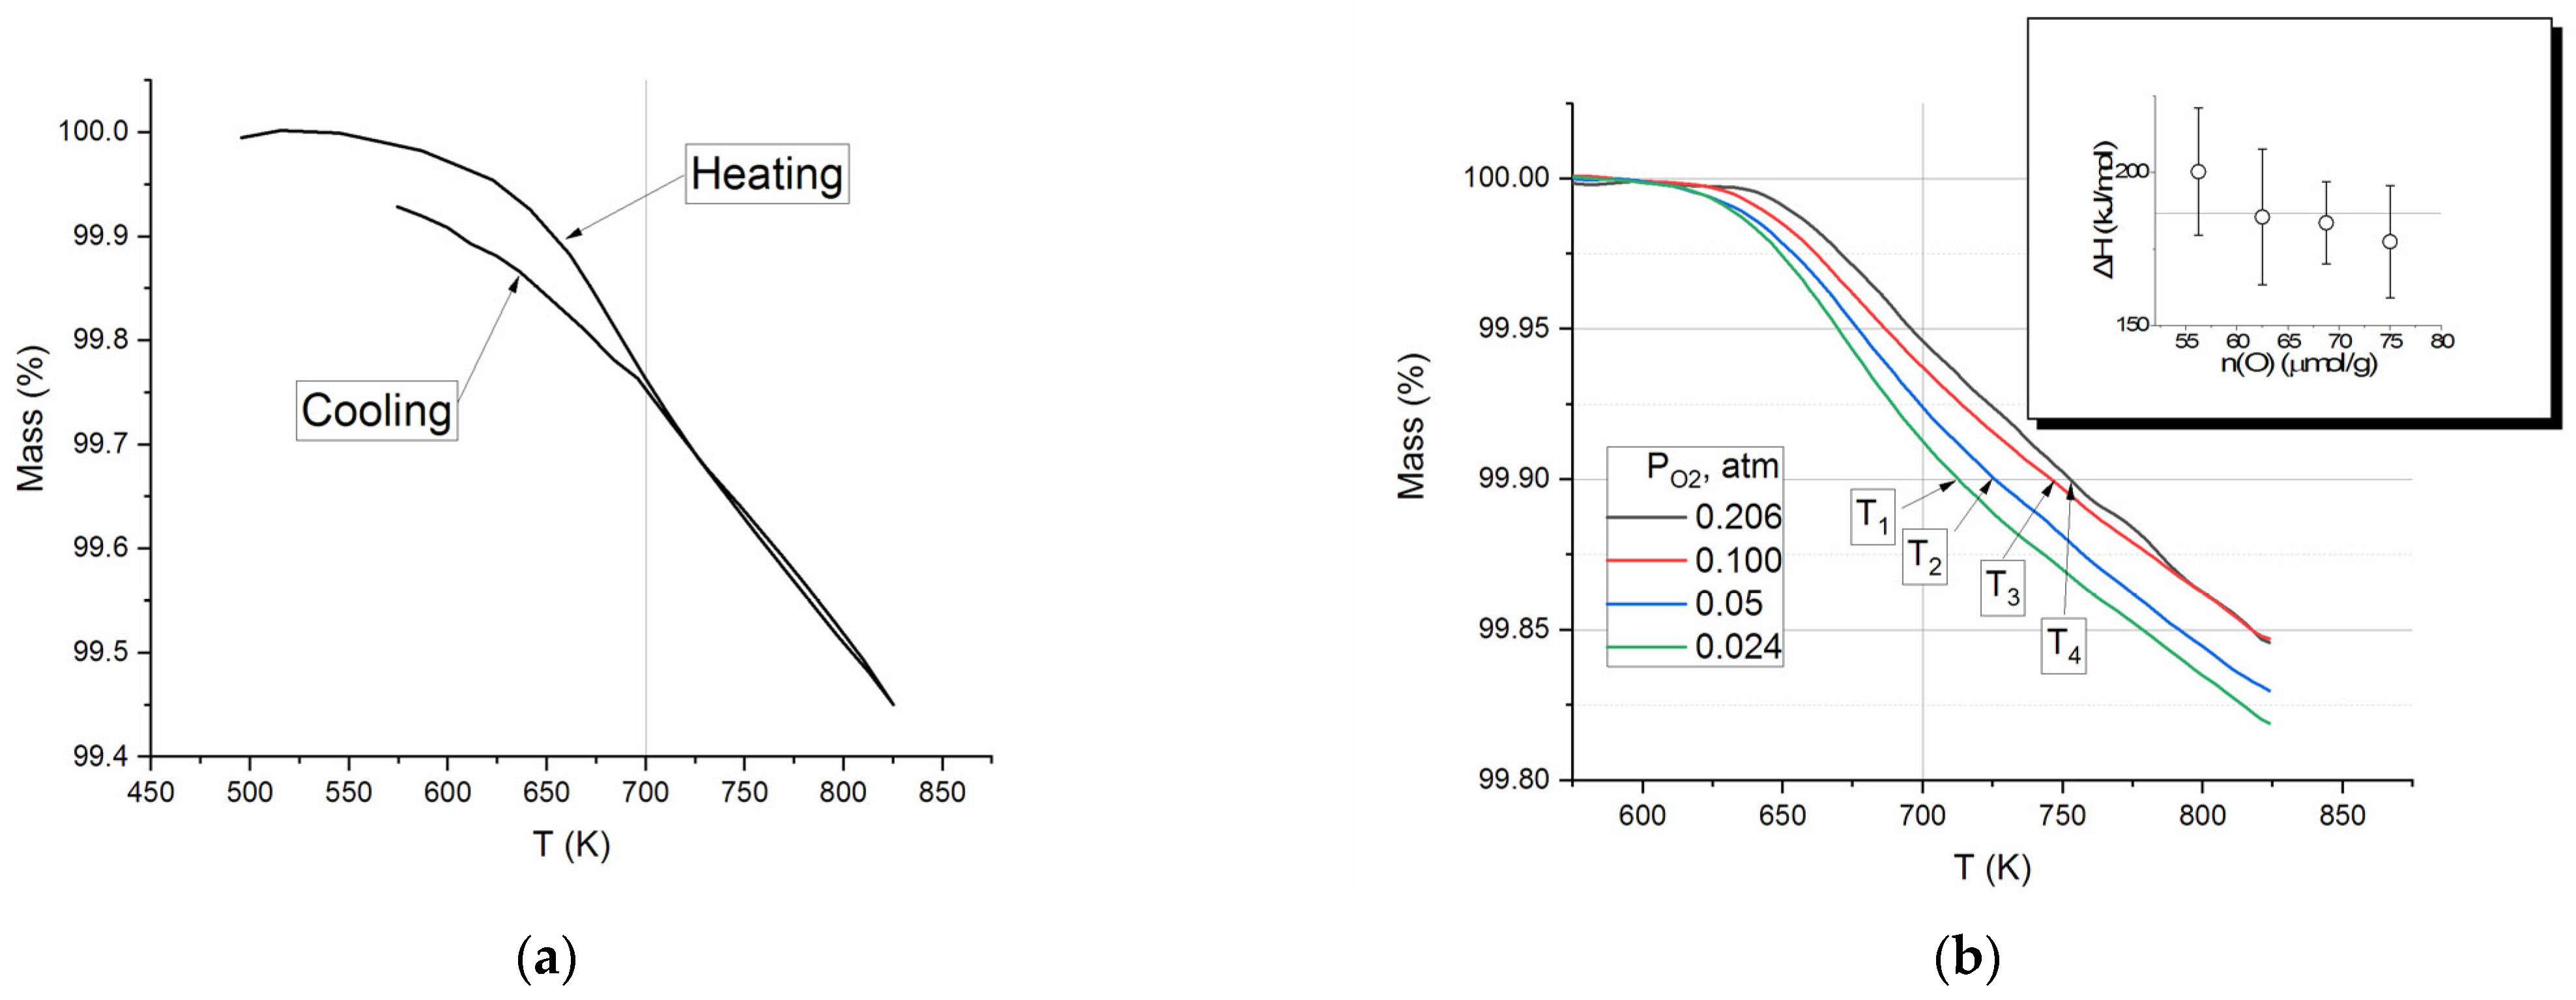
Figure 2a), which involves measuring mass loss during heating and cooling cycles.
Figure 2a shows mass variation in a single cycle of the SDC heating–cooling loop. The substantial decrease in mass begins at approximately 525 K and declines at T > 650 K almost linearly with increasing temperature up to 825 K. The cooling curve indicates an increase in mass; the reverse line corresponds to the heating line up to 700 K and deviates from it at temperatures below that threshold.
The TG experiments demonstrate distinctly that at temperatures exceeding 700 K (under the given conditions: temperature ramp rate of 10°/min, thin layer of SDC particles with a size of less than 0.16 mm) the process of oxygen removal/addition can be considered quasi-equilibrium. Assuming that at T > 700 K there is an equilibrium of gas-phase oxygen and the solid phase, one can estimate the enthalpy of O
2 removal.
Figure 2b shows the TG curves for SDC heated under different partial pressures of O
2. According to the Equation (3), the enthalpy ΔH of O
2 removal is a slope of a line in coordinates ln(P) −
ln P 1/T1/T.
where P is
P0, P1 the oxygen partial pressure; T is the temperature of constant mass loss ∆m; and
R R is the ideal gas constant.
The inset in
Figure 2b shows the result of calculation for P
O2 = 0.024, 0.05, 0.10, 0.206 atm and values of ∆m = 0.09, 0.10, 0.11, 0.12%, which corresponds to 56–75 μmol O removal. The values obtained were found to be consistent with the established error limits, with an average value of 186 ± 9 kJ/mol.
2.2. Morphological Analysis of an SDC Surface
Figure 3a,b illustrates images of the SDC electrode surface under an optical microscope and SEM, respectively. The initial surface is composed of particles measuring between 3 and 50 µm in diameter, which appear monochrome under unpolarized white light. As illustrated in
Figure 3c, the image of the electrode cleavage suggests that the material is a monolithic ceramic. This ceramic is characterized by the absence of open porosity and the presence of a minimal number of individual submicron closed pores. Subsequent to the electrochemical treatment, there is a substantial alteration of the electrode surface. The appearance of colored zones on the treated part under unpolarized white light is observable through an optical microscope, corresponding to areas of varying contrast in the SEM image. The color range exhibited by the stained regions traverses a spectrum from blue to yellow, exhibiting an uneven distribution across the surface. However, the location of color areas displaying a single color tone (or contrast in SEM) corresponds with the location of grains on the original surface (
Figure 3a,b). The manifestation of colored zones on the surface is most likely associated with the formation of thin surface layers (films) during processing. These layers serve as a medium for interference of white light, resulting in the creation of colorful reflections. The variation in coloration is attributed to the differential thickness of these regions. The broad distribution of colors is indicative of the corresponding distribution of film thickness around the surface.
An analysis of the electrode’s surface identified the presence of two distinct surface layer types, which were formed as a result of extended electrochemical exposure (
Figure 4a). The globular type (see
Figure 4b) was formed by globules of chain-organized round grains measuring 200–300 nm). These grains were composed of smaller nanosized particles); the estimated layer thickness was approximately 500 nm (several grains in height). The second type of film was characterized by its thin, smooth, and translucent nature, with an approximate thickness of 90 nm (
Figure 4c).
The formation of layers of varying thickness and morphology, as well as their precise mapping to the grains of the solid, may be due to uneven current distribution on the surface of the ceramic tablet. In such instances, regions exhibiting elevated conductivity undergo more profound etching, resulting in accelerated coating formation in these areas. Consequently, it can be inferred that the initial stage of coating formation is the formation of a flat film, followed by the growth of individual particles and their enlargement into globules (
Figure 4b).
The elemental composition of the electrode interior at the fracture (
Figure 3c) and its untreated surface, studied by EDS, despite significant statistical dispersion, approximately corresponded to non-stoichiometric Sr
0.8Dy
0.2CoO
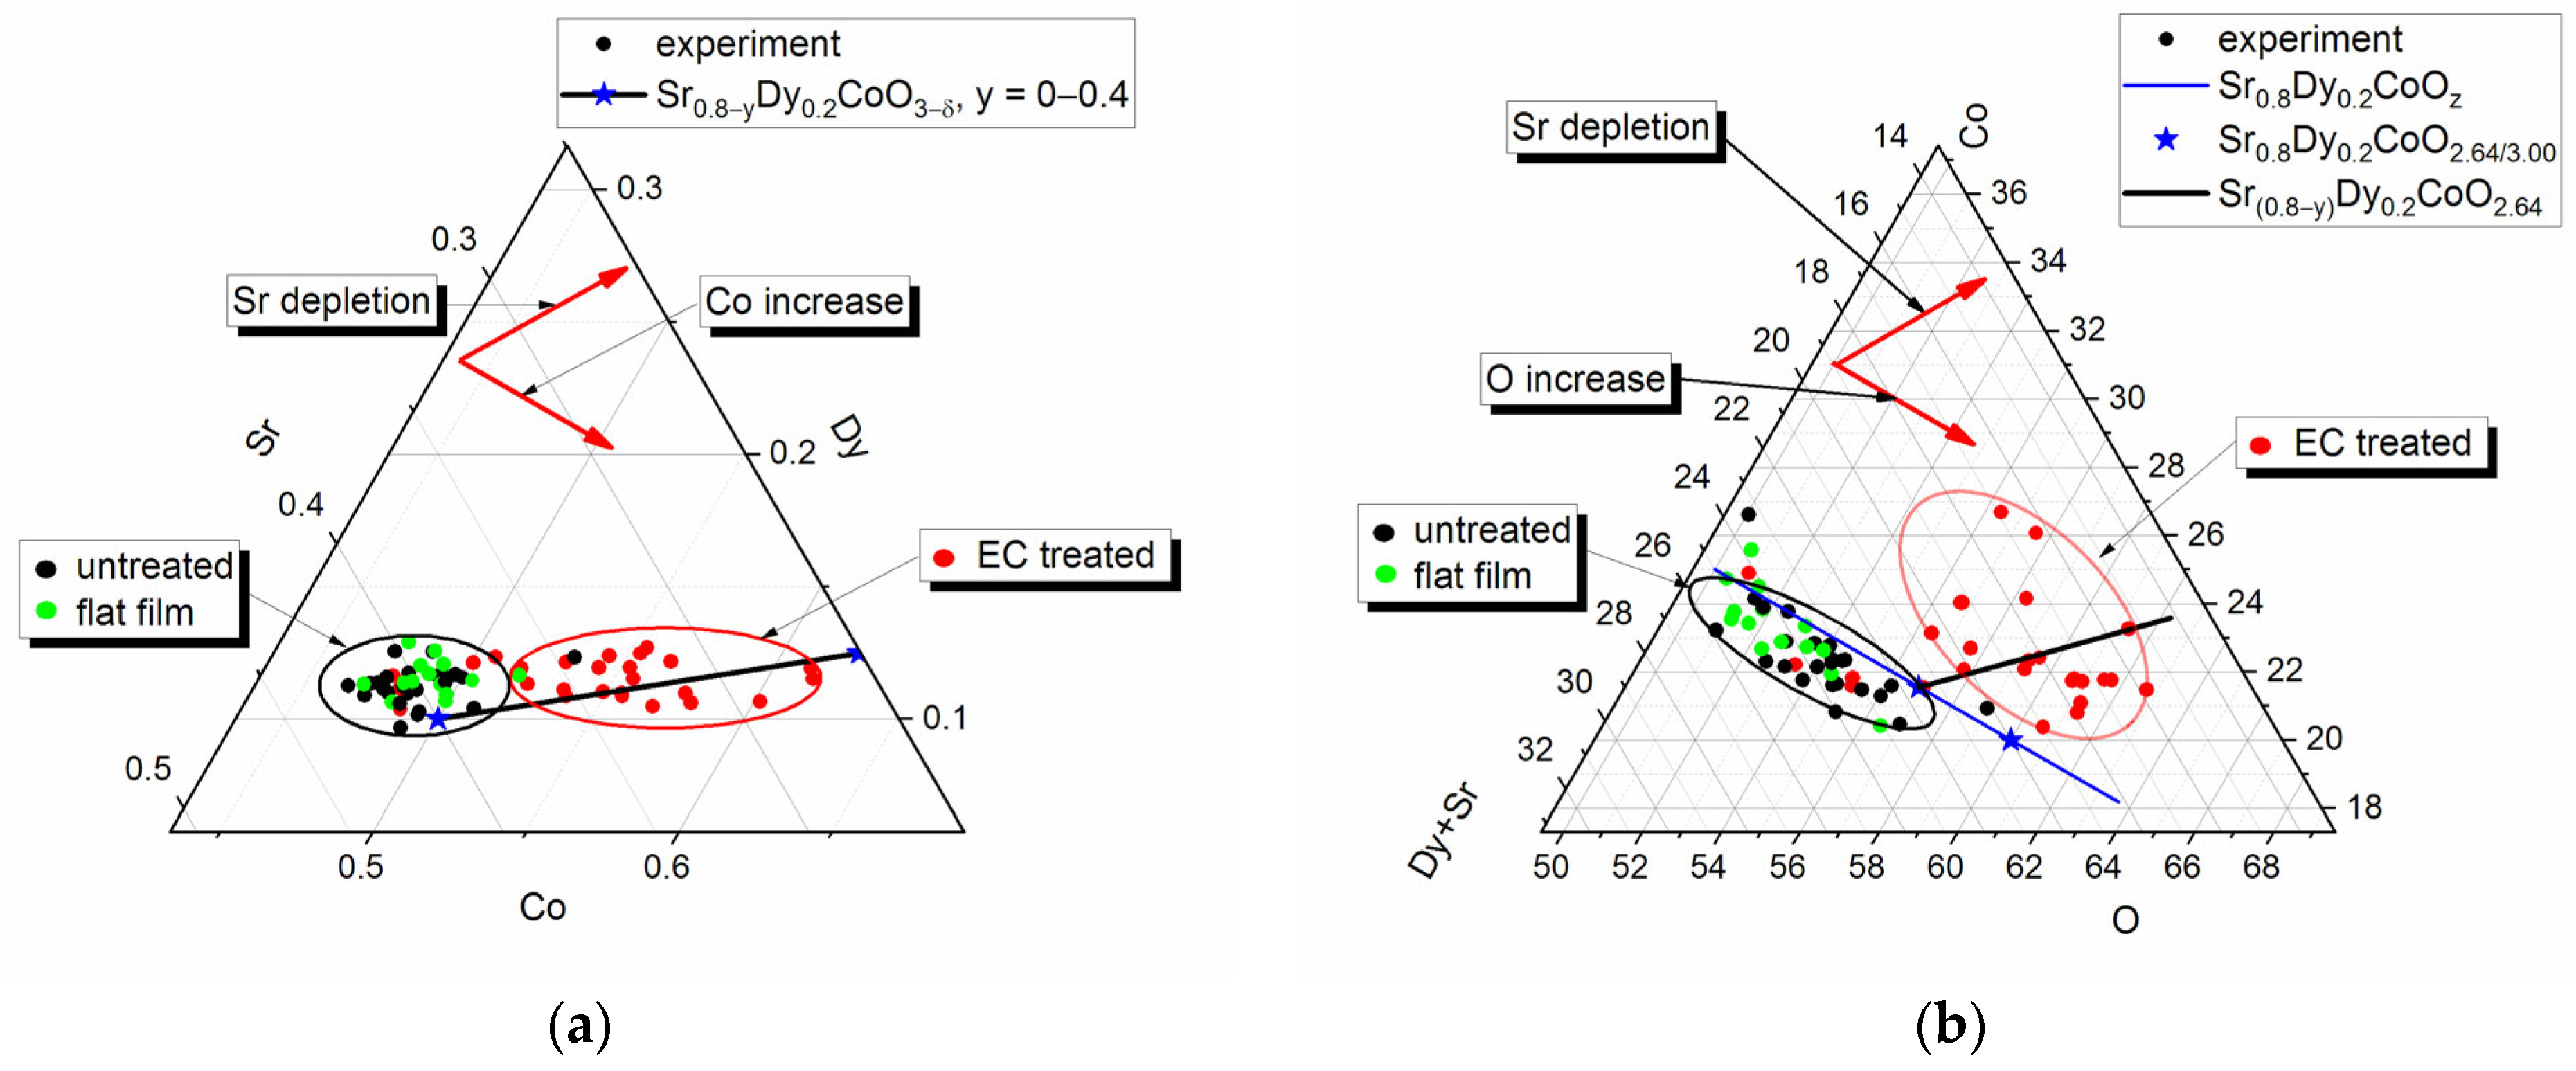
3−δ. The same Sr/Dy/Co/O ratio was observed for flat film domains. Statistically significant depletion in strontium and enrichment in oxygen were observed for surface areas covered by the globular layer (
Figure 5a,b).
Irrespective of the nature of the surface layer, a relatively straightforward explanation for this phenomenon can be proposed. Among the three cations present (Sr
2+, Dy
3+, and Co
3+), only the hydroxide Sr(OH)
2 had limited but notable solubility in water (1.77 g/100 mL at 298 K, [
20]). Consequently, only the Sr
2+ cation can dissolve during the process of electrochemical etching. The curves (black lines) displayed in
Figure 5a,b illustrate the alteration in surface composition following the extraction of Sr from the system, comprising the gross composition Sr
(0.8−y)Dy
0.2CoO
3−δ within the range of y = 0 to 0.4. These curves demonstrate a satisfactory agreement with the observed experimental trends. Similar effects were observed in the process of selective removal of Sr
2+ by etching the surface of SrCoO
3 while maintaining the stability of the crystal structure [
21]; the selective leaching of Sr
2+ ions into the electrolyte was also observed for a series of Ni- and Fe-containing Ruddlesden–Popper-type perovskites (La
0.125S
r0.875)
n+1(Ni
0.25Fe
0.75)
nO
3n+1 (n = 1, 2, 3) under conditions of oxygen evolution reaction in water electrolysis [
22].
Consequently, scanning electron microscopy analyses have revealed that during the electrochemical processing, the SDC surface undergoes transformation with the formation of a surface coating that exhibits either a smooth or a pronounced globular morphology. The surface coating features a reduced strontium content and exhibits a significantly non-uniform distribution of smooth/globular morphology. This phenomenon is likely attributable to the non-uniform distribution of electrochemical properties within the electrode volume, as well as the preferential release of strontium into the solution during the charge–discharge cycles.
2.3. Electrochemical Performance Analysis
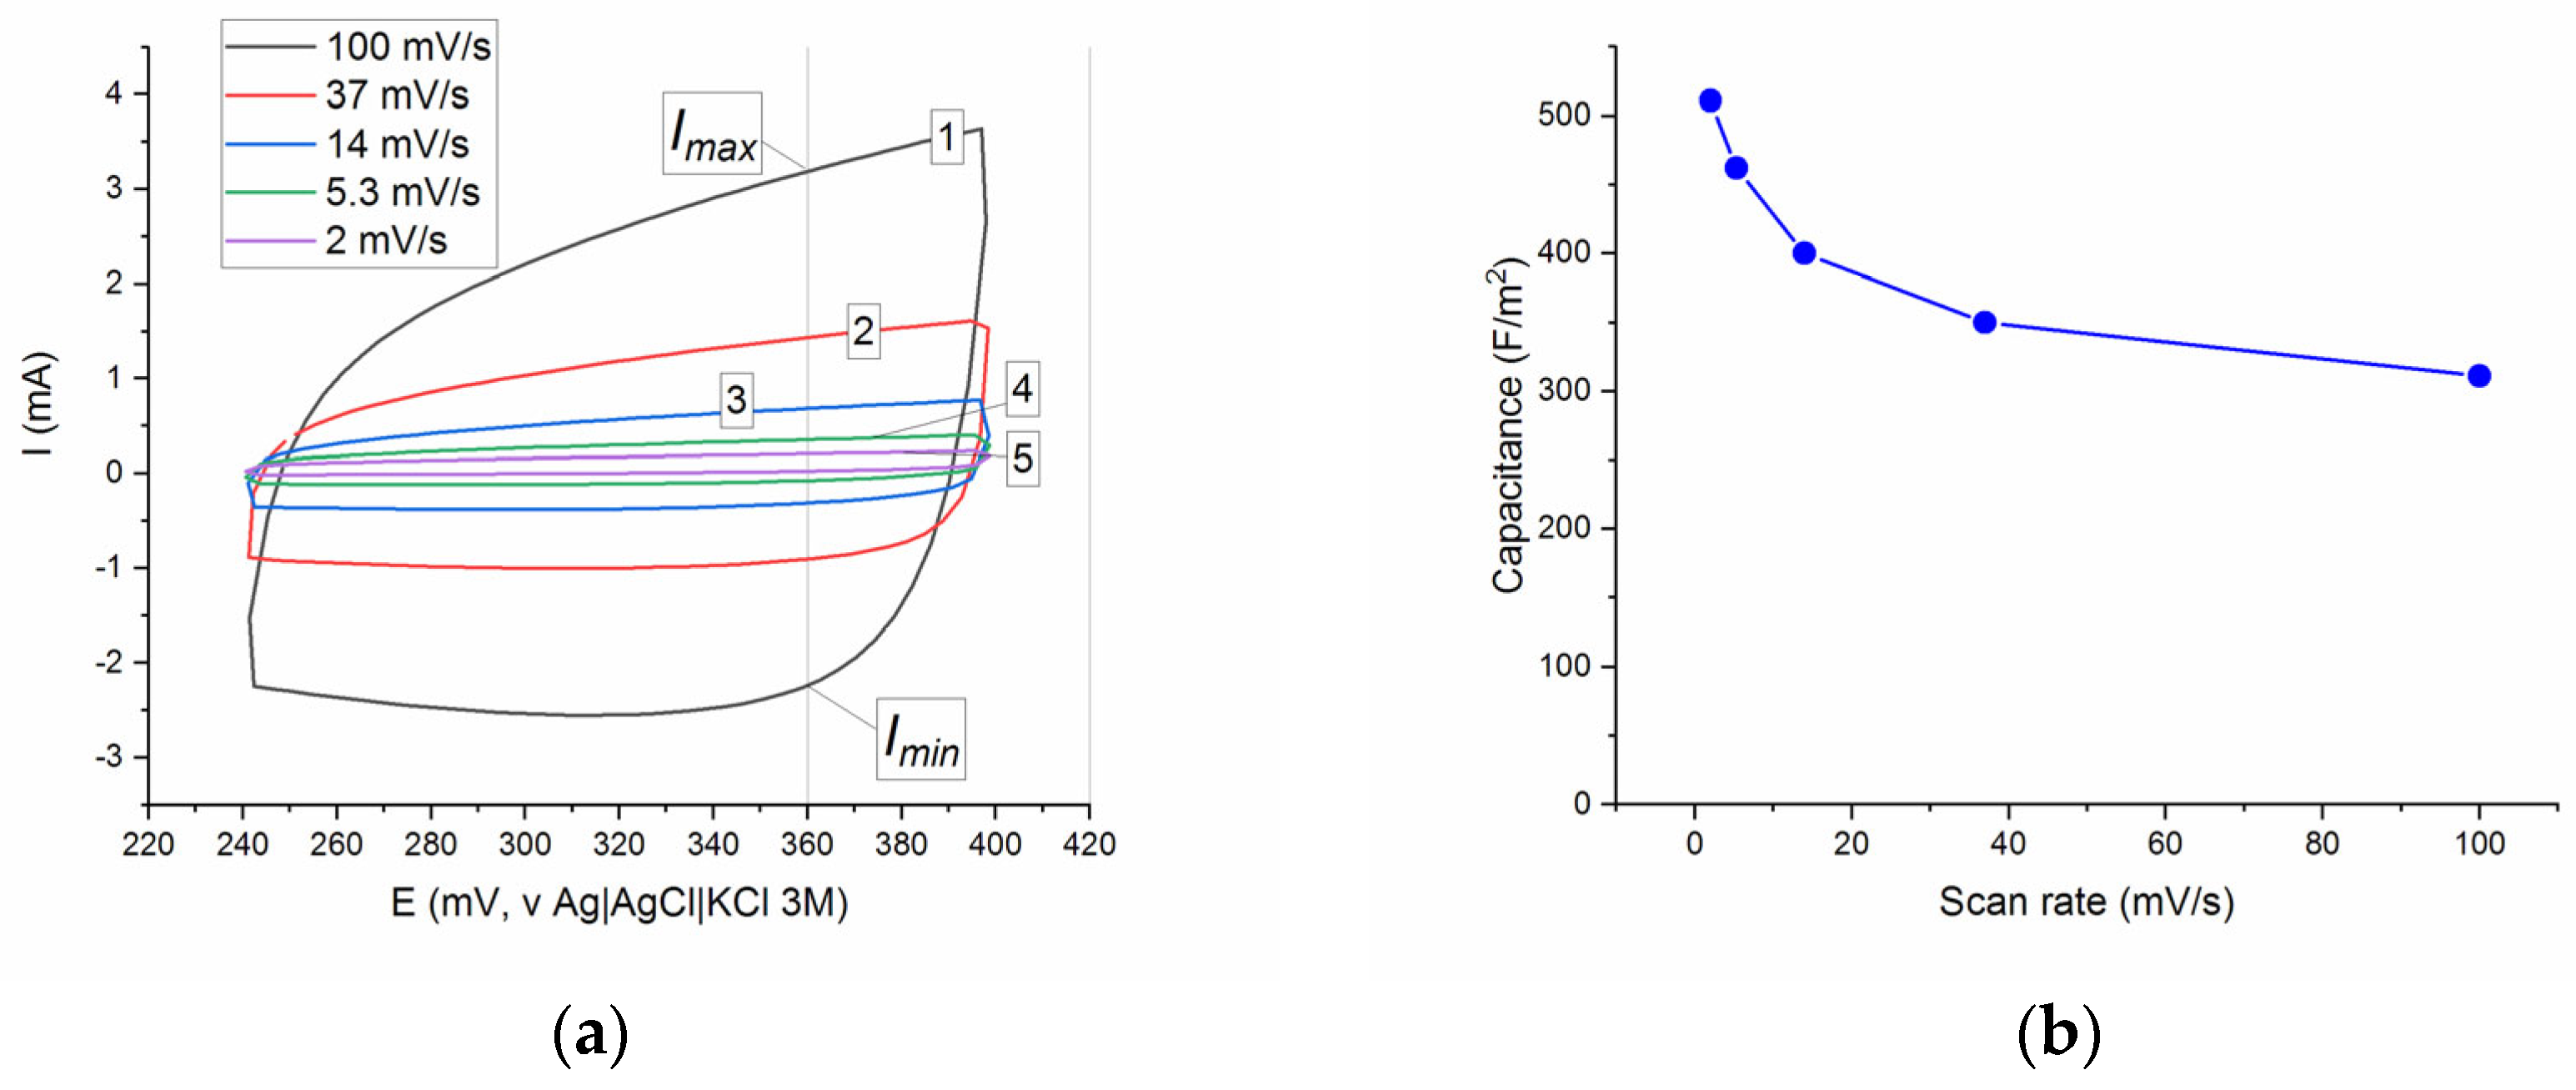
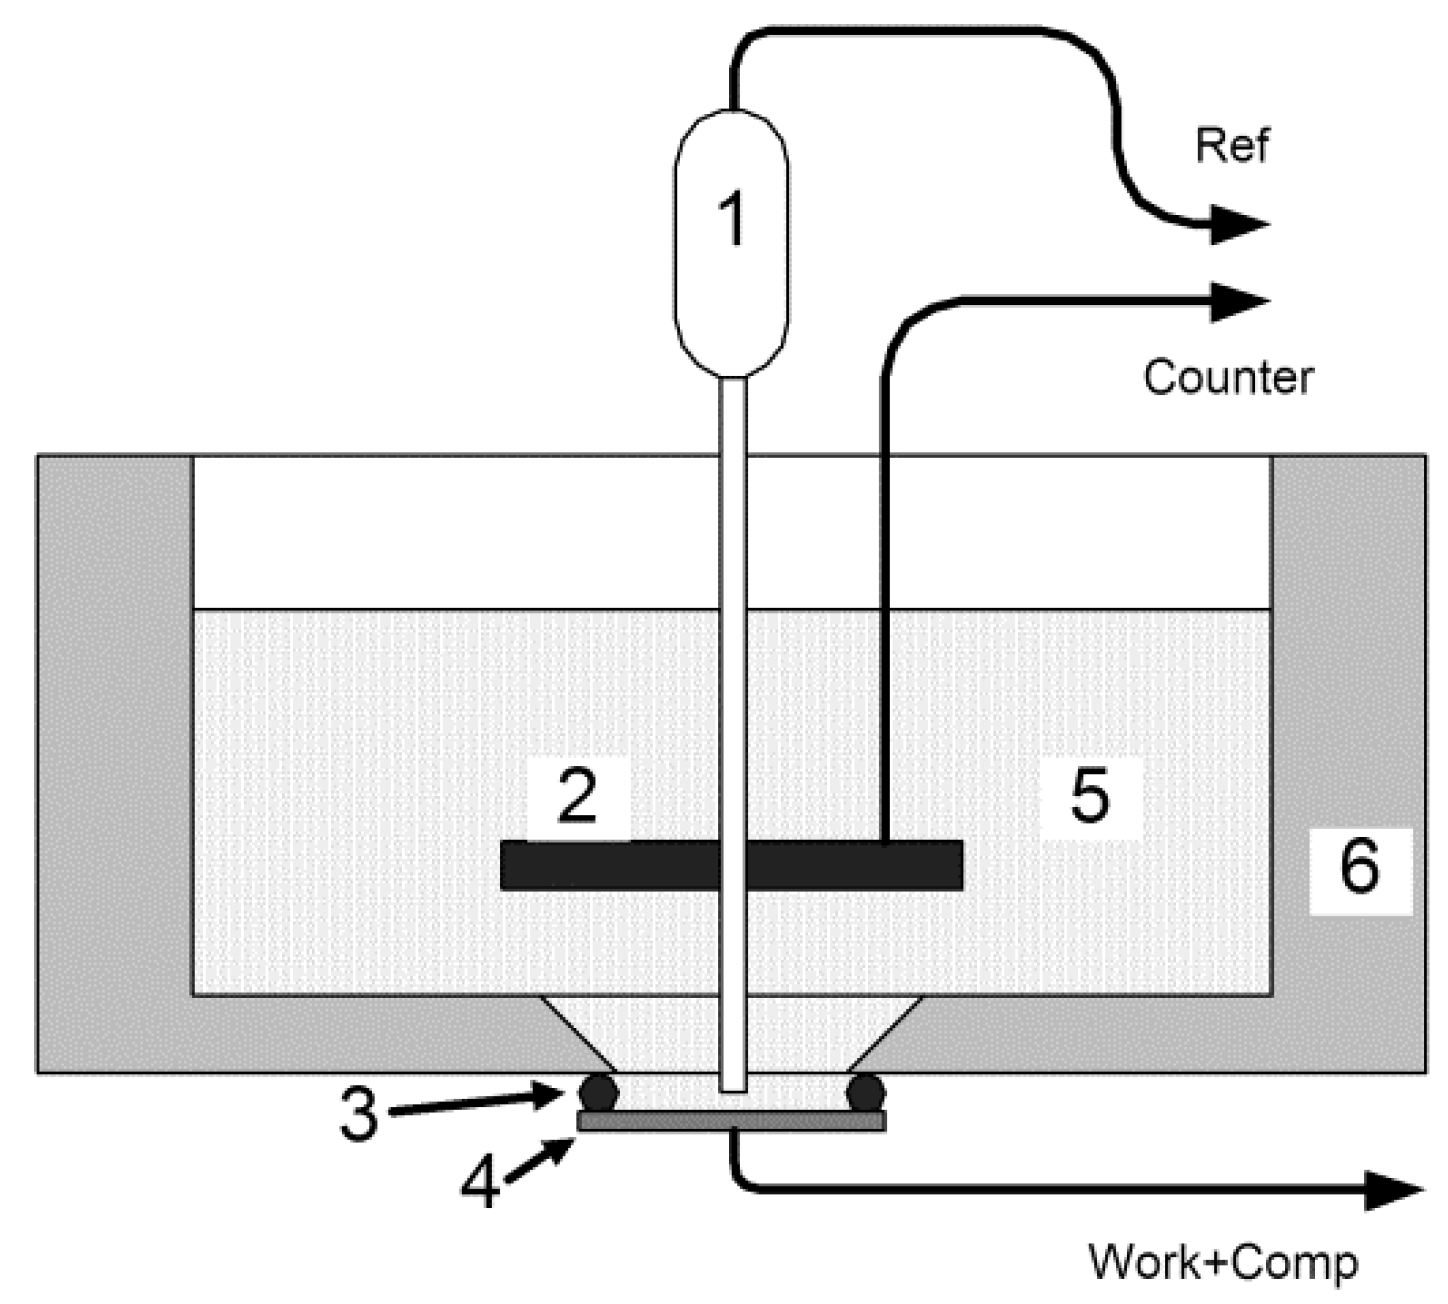
Figure 6a illustrates the CV curves of the SDC electrode at the scan rates ν of 2, 5.3, 14, 37, and 100 mV/s in the potential range of 0.24–0.4 V using a standard three-electrode cell system at ambient temperature. All curves had the appearance of a distorted rectangle without visible redox peaks reflecting the occurrence of oxidation–reduction processes, in contrast, in particular, to the La
0.8Sr
1.2Fe
0.9Co
0.1O
4 system, for which extremes were observed on the anodic and cathodic CV curves, attributed to the oxidation–reduction reactions Co
2+/Co
3+/Co
4+ and Fe
2+/Fe
3+ [
11].
Since the CV curves did not show pronounced redox patterns, the values of specific capacitance C
sp of the SDC sample were estimated from the CV curves using simple Equation (6), as for a conventional capacitor. The C
sp values were calculated at E = 360 mV (vs. Ag/AgCl), and the capacity values at different scan rates are presented in
Figure 6. The values of C
sp are in the interval of 311–511 F/m
2, and the observed trend of C
sp vs. ν shows the usual gradual decrease in the specific capacity with an increase in the scan rate.
Because the values of specific capacitance published in the literature usually have the dimension of F/g, in order to compare C
sp obtained by us with the literature data, we converted F/m
2 to F/g using the geometric surface area of 1 g of cubic particles with a size of 1 μm and a density of 6.13 g/cm
3 (Sr
0.75Dy
0.25CoO
2.62, ICDD # 00-056-0181). The estimated specific surface area of such particles will be 0.9788 m
2/g. Taking into account the visible surface area of the SDC electrode (8.17 × 10
−5 m
2), the maximum obtained value of 500 F/g (C
sp = 511 F/m
2 for scan rate ν = 2 mV/s), although inferior to the best perovskite systems [
4], significantly exceeds the maximum theoretical non-Faraday capacitance of 18 μF/cm
2 predicted in [
23], which corresponds to the assumption of the participation of Faradaic processes in the formation of pseudocapacitance.
According to the classification given in [
24], the observed shape of the CV curves is characteristic of materials in which the energy storage mechanism based on the formation of a double electric layer or on the reduction of surface-active components is implemented. The absence of peaks associated with the Co
2+/Co
3+/Co
4+ redox transition in the studied potential range can be explained by the possibility of a monotonic change in stoichiometry in the perovskites Sr
0.8Ln
0.2CoO
3−δ or perovskite-like RP phases Sr
2.4Ln
0.6CoO
7−δ (Ln = Sm, Gd, Dy) [
14]. Additional information on the nature of the processes at the electrode can be obtained from the analysis of the dependence of the current on the scan rate, expressed by Equation (4).
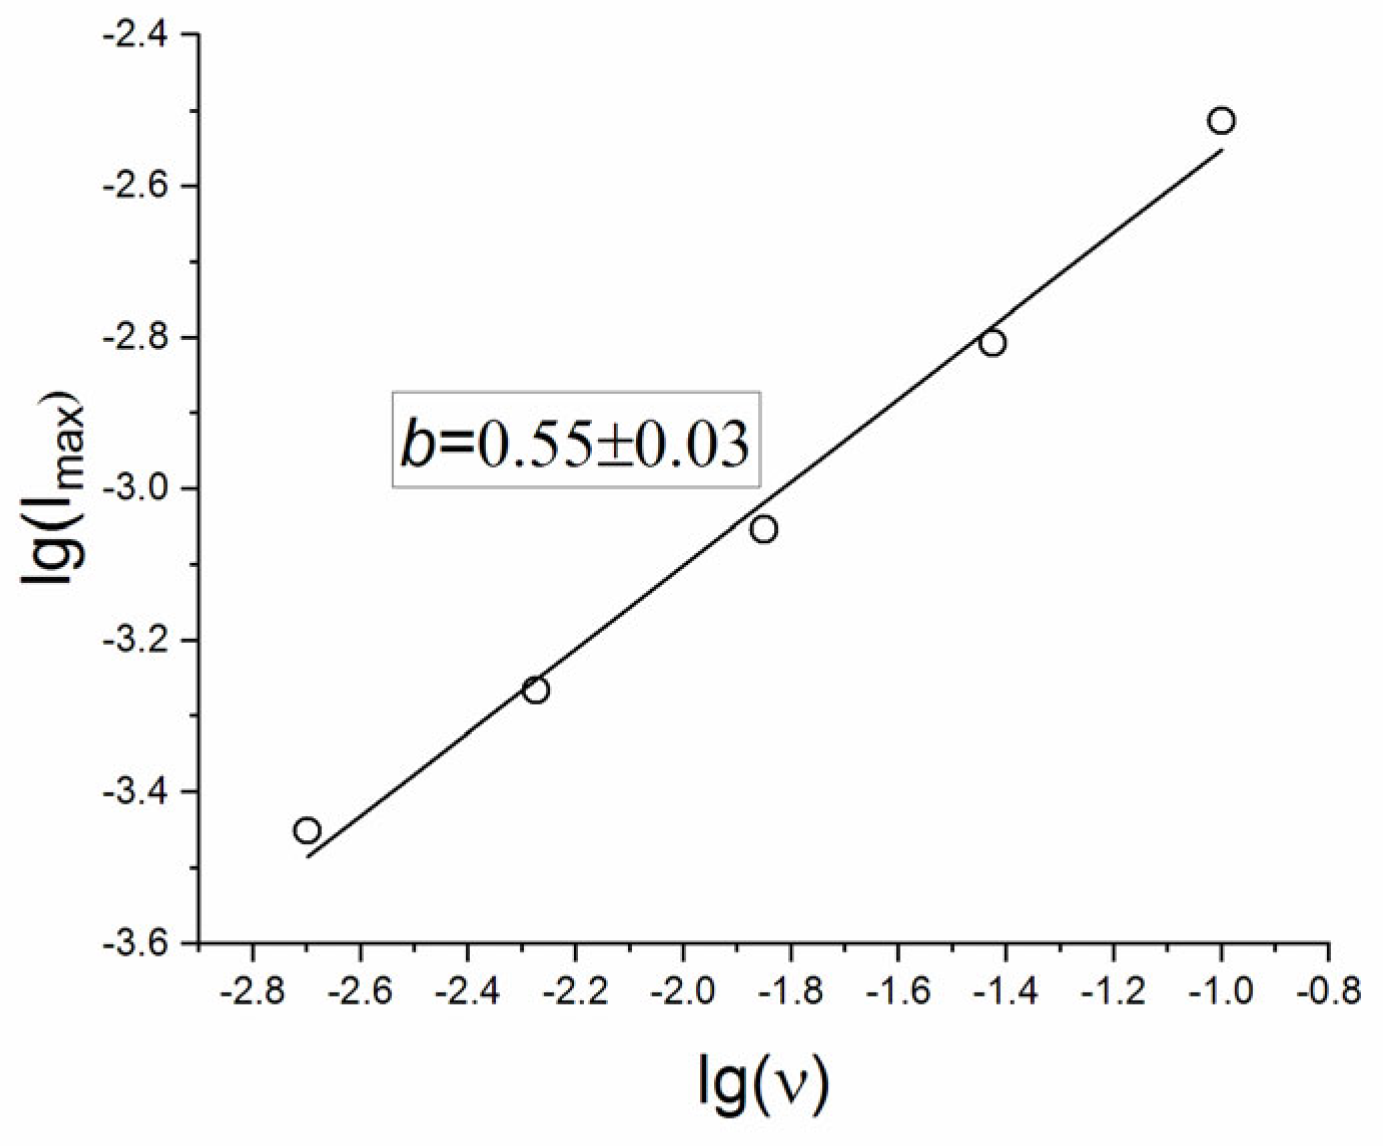
Discrimination of the contributions of surface phenomena and diffusion within the lattice is based on an analysis of the value of b in Equation (4). The value of b in this equation is considered as an indicator of the contribution from semi-infinite linear diffusion (b = 0.5) and surface-capacitive mechanisms (b = 1).
The graph of the dependence of lg(Imax) on lg(ν) for the anodic part of the CV curve (
Figure 7) shows that for SDC the b value is 0.55 ± 0.03, and therefore, one can conclude that the kinetics predominantly follows a semi-infinite linear diffusion process.
It is believed that during the intercalation process, OH
− anions on the perovskite surface interact with an oxygen vacancy to form water (reaction (5–7)), followed by diffusion of O
2− into the bulk of the electrode material; a schematic illustration of the mechanism of this oxygen–anion intercalation process using LaMnO
3 as an example is given in [
8]. It is noteworthy that the equations describing the interaction of gas-phase oxygen (1, 2) with non-stoichiometric perovskite are similar to Equations (5)–(7) in terms of the requirements for the defect structure of the solid. In both cases, the process is described as the interaction of an oxygen-containing species (O
2/OH
−) with an oxygen vacancy V
••O with the participation of cobalt cations Co
2+/Co
3+, resulting in the formation of lattice oxygen O
2−. This similarity of the processes suggests that, despite significant differences in the process conditions (temperature range, gas/liquid phases), the presence of mobile oxygen in the system may indicate a certain potential for the emergence of pseudocapacitance based on oxygen intercalation.
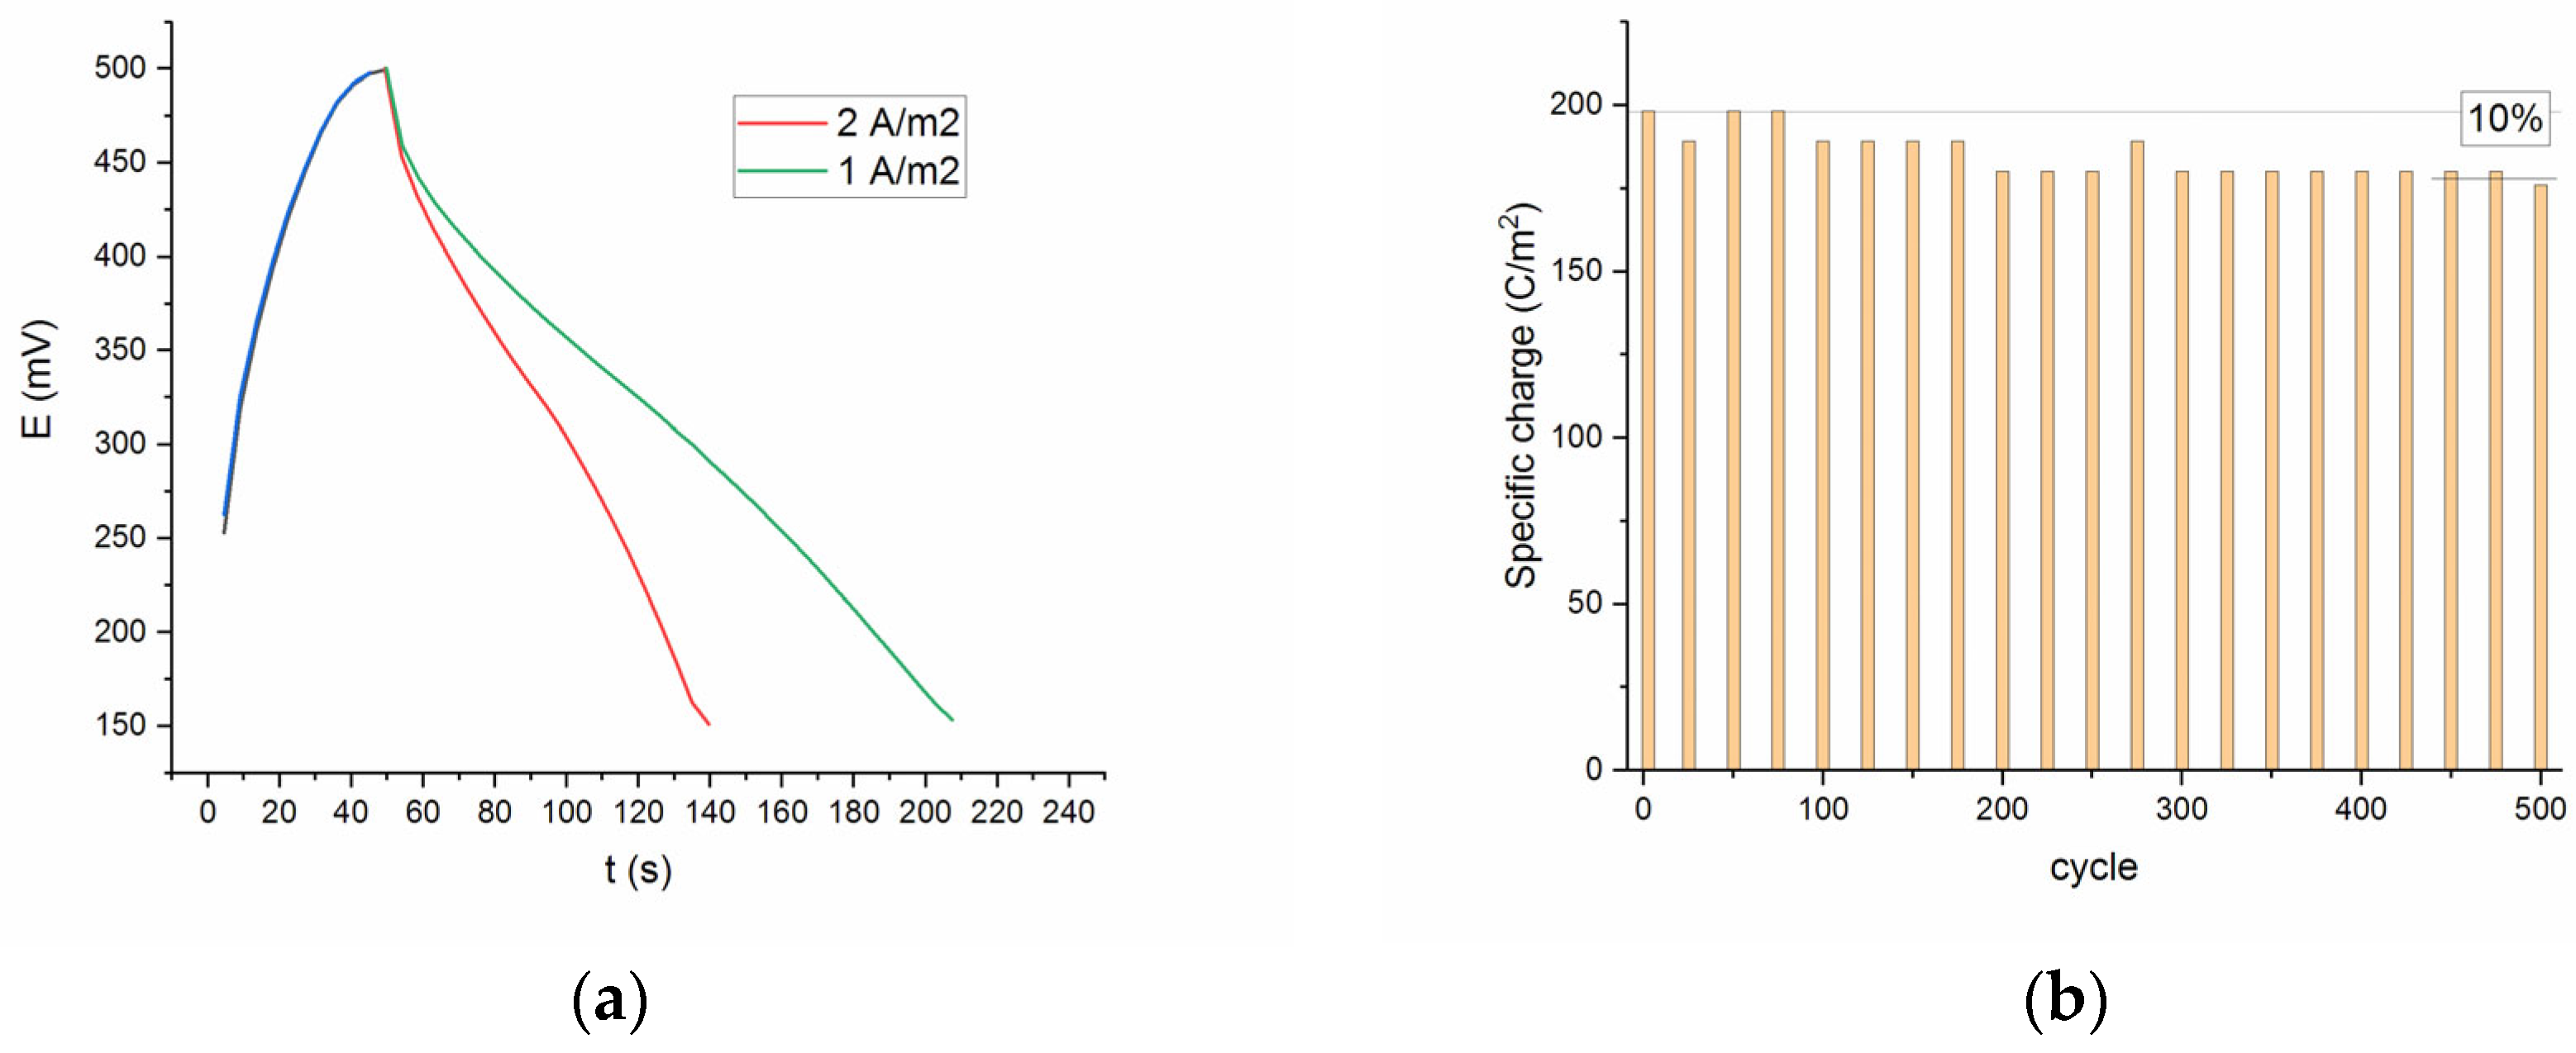
Figure 8a represents the discharge curves of the SDC electrode at current densities 1 and 2 A/m
2. The discharge curves obtained for all current densities were slightly non-linear, which demonstrates the intercalation-type or intercalation-type materials showing broad but electrochemically reversible redox peaks [
24]. From the discharge curve, the specific capacity
Qsp was calculated using Equation (8), where the symbols
I, Δt, and
S represent the discharge current (A), discharge time (s) and visible surface of the electrode (m
2), respectively.
The specific capacity gradually decreases to approximately 90% after 500 cycles, which may be due to the leaching of strontium and the formation of a surface globular layer during electrochemical processing in an alkaline solution. As shown in
Figure 8b, only about 10% capacitance loss occurred at the end of the test, indicating a satisfactory cycling performance.
To better understand the electrochemical performance and dynamics of the SDC electrode, the EIS was carried out in a frequency range of 0.01–10
5 Hz by applying an AC voltage with 10 mV amplitude.
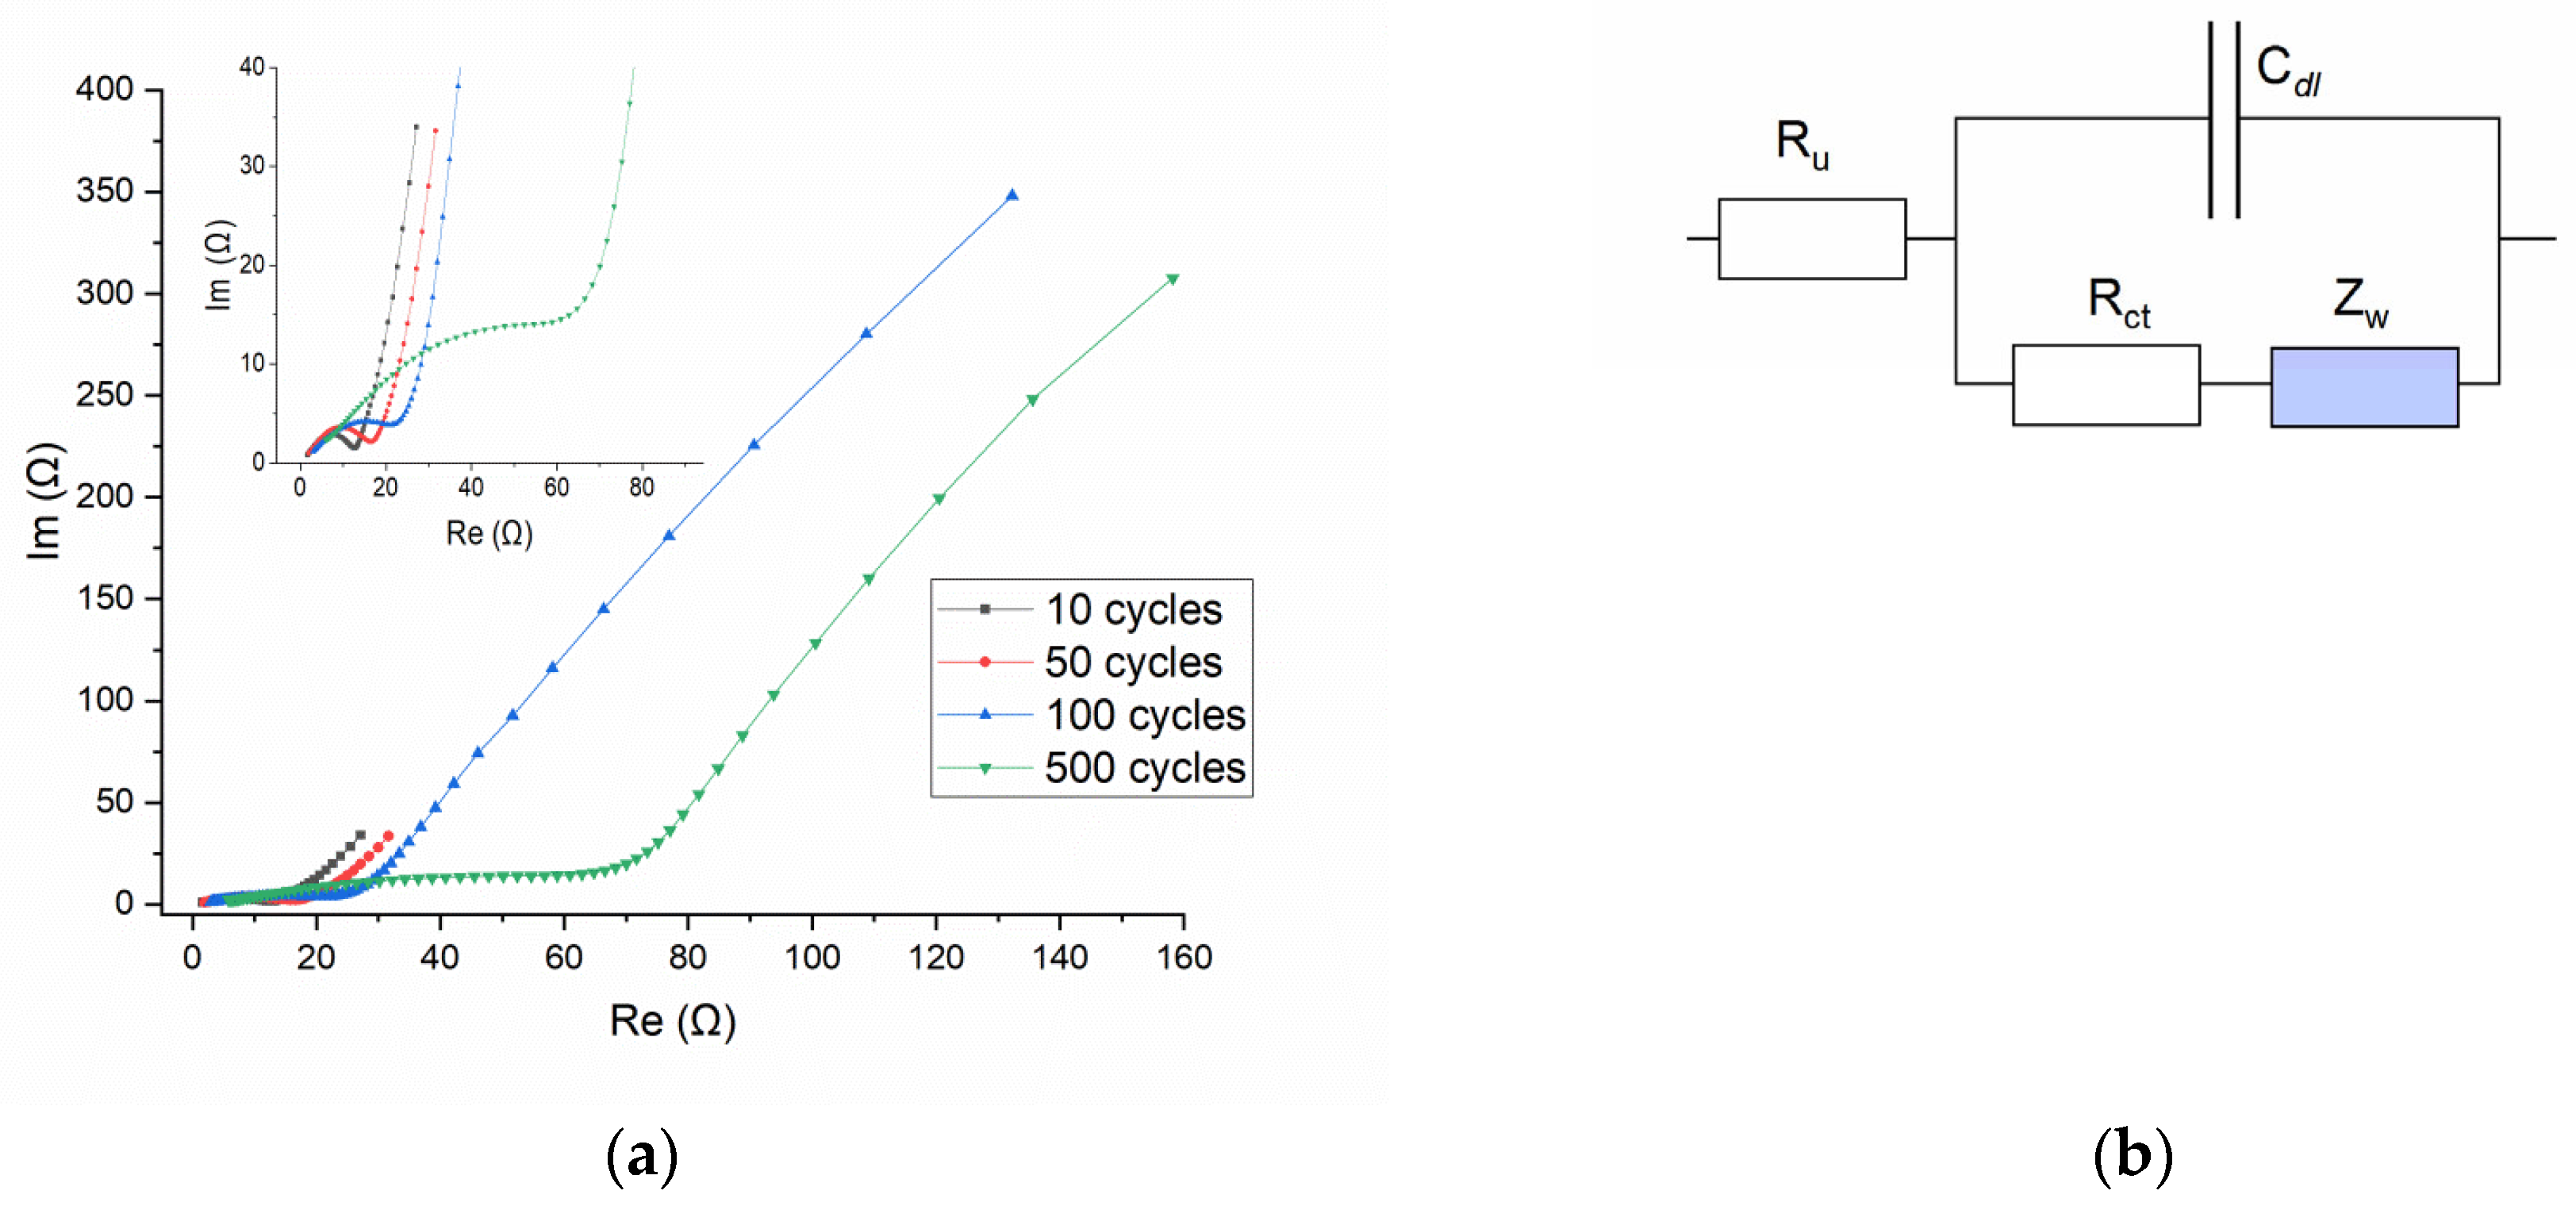
Figure 9a shows the Nyquist plots for the SDC electrode after different numbers of charge–discharge cycles, namely after 10, 50, 100, and 500 cycles; the inset is the expanded plots at the high-frequency domain. All four lines show EIS, which is typical for the so-called Randles equivalent circuit (
Figure 9b) [
25]. The patterns comprise the semicircle at the high-frequency region, where the electrochemical process is controlled by charge transfer phenomena, and the almost straight line at the low-frequency domain, where the electrochemical process is controlled by mass transfer phenomena. In this circuit the total current, which passes through the R
u (the ohmic resistance of the electrolyte between the reference and the working electrode), is a sum of the current to charge/discharge the electrical double layer (C
dl) and the parallel current of the faradaic process. The general impedance of the faradaic process is represented by two components: the charge-transfer resistance, R
ct, which is related to the kinetics of the heterogeneous electrochemical process, and the Warburg impedance, Z
W, which accounts for the mass transport of the redox species to the electrode surface. Warburg impedance assumes a semi-infinite linear diffusion and is represented on the Nyquist plot by a straight line with slope 1 (φ = 45°). It is obvious that a simple Randles circuit cannot quantitatively describe the course of the EIS curves, since the slope of the low-frequency line is different from unity. But this circuit can still be used to follow the main peculiarities of the process.
From the data presented in
Figure 9a, several features emerge that characterize changes in the appearance of the EIS with an increase in the number of charge–discharge cycles.
(1) The straight line at the low-frequency domain inclines at an angle considerably higher than 45°, which is indicative of deviation from ideal Warburg behavior. To model a tilted line in the low-frequency domain, a constant phase element (CPE) is used instead of an ideal capacitor. The CPE impedance includes two parameters: Y
o, which contains information about the capacitance, and an exponent n (in the range from 0 to 1), which determines the deviation from the ideal behavior. For n = 1 CPE functions as an ideal capacitor; for n = 0 the CPE behaves as a resistor. The divergence of the impedimetric line from vertical (the angle θ; °) related to n as θ = 90°(1−n). A rough estimation of n for lines in
Figure 9a gives a value of about 0.8. The physical meaning of CPE has been widely ascribed to the surface roughness of solid electrodes, which causes an uneven arrangement of interfacial capacitances, current densities, etc., across the electrode surface [
26]. This is consistent with the observed variety in the morphology and thickness of the surface layer formed during electrochemical processing. Another possible explanation of non-ideal Warburg behavior is the finite regime of diffusion within surface film (layer). Depending on the conditions (whether the finite-diffusion region is permeable/impermeable to the diffusing species), a transmissive or reflective boundary is established with the time, and as a consequence, EIS will exhibit a second semicircle or result in a (purely) capacitive behavior [
27].
(2) The semicircle at high-frequency region is well pronounced for curves after 10 or 50 charge–discharge cycles. An increase in the time of electrochemical treatment eventually results in an almost complete disappearance of the semicircle at 500 cycles. It is known that the probability of the separation of the semicircle and Warburg straight line depends on the relationship between the R
ct, Z
W, and C
dl [
27]. The model simulation shows that increasing C
dl while keeping R
ct and Z
W constant ultimately leads to the complete disappearance of the semicircle. In our case, etching the surface, leading to an increase in its specific area and the formation of layers on the surface, may well be the basis for a significant increase in the capacity C
dl and, accordingly, for the merging of the semicircle and Warburg straight line in the EIS curves.
(3) The point of expected intersection of the semicircle of the EIS plot with the real axis, which is defined by the sum of Ru + Rct, shifts substantially to the higher values with the number of cycles. This fact clearly indicates an increase in the charge-transfer resistance, Rct (which is related to the kinetics of the heterogeneous electrochemical process). The nature of this effect remains unclear, but it can be assumed to be related to surface modification due to strontium leaching.
