2. Results and Discussion
In the experimental studies, the relative rate method was utilized to determine the rate constants for the abstraction of H/D-atoms from the C3H8/C3D8 molecule by atomic chlorine.
The overall rate constant of the reaction was determined using the relative rate method based on the monitoring of substrate decay. In contrast, the relative rate method based on the detection of specific reaction products was employed to determine the rate constants for hydrogen or deuterium atom abstraction from individual carbon atoms in the propane molecule. The following text provides a concise description of both measurement methods.
In the relative rate method based on substrate decay, the reaction rate constant is determined relative to a reference reaction, for which the rate constant value is known and well-documented. The following derivation of the formula used in the relative rate method based on substrate decay is demonstrated using the reaction of C
3H
8 + Cl (the studied reaction) and C
2H
6 + Cl (the reference reaction) as an example. The studied and reference reactions can be represented as follows:
For fully deuterated propane, an analogous expression can be written as follows:
From the above scheme of the reactions, it follows that both reactions must share a common substrate (Cl), and the reverse reactions are negligible.
The rate equations for reactions (1) and (2) are expressed as follows:
Dividing Equation (3) by Equation (4) side by side and separating the variables, we arrive at the following equation:
Integrating Equation (5) from the initial concentrations of the substrates [C
3H
8]
0 and [C
2H
6]
0 to the concentrations at time
t, [C
3H
8]
t and [C
2H
6]
t, we obtain:
From Equation (6), it follows that the relationship between ln([C3H8]0/[C3H8]t) and ln([C2H6]0/[C2H6]t) is linear, with a slope of kH/k2. Repeating the experiment with varying degrees of conversion for C3H8 and C2H6 allows for determining a linear relationship between ln([C3H8]0/[C3H8]t) and ln([C2H6]0/[C2H6]t), from which the slope kH/k2 can be derived. Multiplying this slope by the absolute rate constant of C2H6 + Cl yields the absolute value of kH.
In the case of deuterated propane, Equation (6) takes on an analogous form:
During the determination of the overall rate constant for the reaction C3D8 + Cl, the reaction C2H6 + Cl was also utilized as a reference reaction.
The relative rate method, based on monitoring the formation of reaction products, was employed to determine the rate constants for the abstraction of H or D atoms from specific carbon atoms in propane. The following derivation of the formula is conducted for the abstraction of a H atom from a primary carbon in the propane molecule. The reference reaction is C
2H
6 with Cl. After the abstraction of a H atom, the resulting radicals react immediately with Cl
2, which is present in large excess in the reaction system. This is described by the reactions below:
Based on the reaction scheme above, the following equations for the reaction rates of 1-chloropropane and chloroethane formation can be written:
Both equations above include the concentrations of propyl and ethyl radicals. These concentrations can be eliminated by using the rate equations for these radicals and considering that their concentrations reach a steady state, i.e., they remain constant over time:
By calculating the concentrations of propyl radicals from Equation (13) and ethyl radicals from Equation (14), and substituting them into Equations (11) and (12), we obtain:
Dividing Equation (15) by Equation (16) on both sides and separating the variables, we obtain:
In the method of relative reaction rates based on monitoring product formation, the degree of substrate conversion must remain very low to prevent the formation of secondary reaction products. Under such experimental conditions, we can assume that [C3H8]/[C2H6] is, to a good approximation, equal to [C3H8]0/[C2H6]0.
In that case, after integration, Equation (17) takes the form:
By transforming Equation (18), a final formula is obtained, allowing the calculation of the ratio of reaction rate constants based on the determination of the final concentrations of reaction products:
The reaction of hydrogen abstraction from the secondary carbon in the propane molecule is represented by Equation (20), while the abstraction of deuterium from the primary and secondary carbons in the fully deuterated propane molecule is described by Equations (21) and (22), respectively:
The final formulas derived for the above reactions are represented by Equations (23)–(25), respectively:
The reference reaction (2) was also employed in the determination of rate constants for deuterium atom abstraction.
It must be ensured that, in the relative rate method based on the determination of concentrations of respective reaction products, the experiment is conducted to avoid the formation of secondary reaction products. If such products are formed, the corresponding experimental data must be disregarded.
All experiments were performed in the temperature range of 298 to 387 K and at a total pressure of 100 Torr, using the C
2H
6 + Cl reaction as the reference. There is a wealth of experimental data, computational studies, and literature reviews available on the C
2H
6 + Cl reaction. In our study, we utilized the latest experimental data combined with a focused literature review by Hickson et al. [
19]. In the temperature range of 48 to 800 K, the authors determined the following temperature dependence for the rate constant of hydrogen atom abstraction from ethane by a chlorine atom:
The experimentally determined total rate constants and the rate constants for the abstraction of a hydrogen atom from the primary and secondary carbon atoms in the propane molecule by a chlorine atom at 298, 334, and 387 K are presented in
Table 1.
Figure 1 shows the plot of relationship (6) obtained at different degrees of substrate conversion at a temperature of 298 K and a total pressure of 100 Torr. The slope coefficients obtained for the hydrogen atom abstraction reaction, as described by Equation (6), together with the calculated total reaction rate constants at 298, 334, and 387 K, are summarized in
Table 1 (columns 2 and 3).
Kinetic parameters for the deuterium abstraction from fully deuterated propane (C
3D
8) were determined under the same experimental conditions and at the same temperatures as those used for the hydrogen abstraction from propane (C
3H
8); the results are summarized in
Table 2. As shown in
Figure 2, a linear correlation was observed between ln([C
3D
8]
0/[C
3D
8]ₜ) and ln([C
2H
6]
0/[C
2H
6]ₜ), obtained over a range of substrate conversions at 298 K and a total pressure of 100 Torr.
The relative rates of H/D atom abstraction determined at 298, 334, and 387 K for C
3H
8 and C
3D
8 enabled a reliable evaluation of the kinetic isotope effect (KIE) for the investigated reaction. The calculated KIE values are summarized in
Table 3.
It is instructive to compare the total rate constants for hydrogen/deuterium atom abstraction, determined using Equations (6) and (7), with those calculated as the sum of the individual rate constants for abstraction from primary and secondary carbon atoms in propane (i.e., kH,1 + kH,2 and kD,1 + kD,2, respectively).
A comparison of the overall rate constants (column 3 in
Table 1) with the summed values for hydrogen abstraction from primary and secondary sites (column 8 in
Table 1) shows differences of about 4%, 0%, and 3% at 298, 334, and 387 K, respectively. For deuterium abstraction (columns 3 and 8 in
Table 2), the corresponding differences are approximately 5%, 5%, and 3% at the same temperatures.
These results indicate that only hydrogen or deuterium atom abstraction occurs within the reaction system. Notably, the total rate constants obtained as the sum of the individual abstraction steps are consistently lower than those derived from Equations (6) and (7), likely due to experimental factors associated with Equations (19)–(22).
In the relative rate method, which relies on quantifying primary reaction products, the formation of secondary products should ideally be avoided. However, this is not always achievable. The presence of secondary products below the detection limit of the employed thermal conductivity detector (TCD) cannot be entirely excluded. Such undetected products may slightly alter the measured concentrations of the primary products, introducing small deviations in the rate constant ratios derived.
Overall, these observations demonstrate that, for determining total reaction rate constants, the relative rate method based on monitoring substrate concentrations (Equations (6) and (7)) provides more reliable and internally consistent results.
Figure 3 presents the Arrhenius plots for the hydrogen atom abstraction reaction from propane by a chlorine atom. The top panel shows the Arrhenius dependence of the overall rate constant determined using Equation (6). The second panel depicts the Arrhenius plot obtained by summing the rate constants for hydrogen abstraction from both primary and secondary carbon atoms. The third and fourth panels correspond to abstraction from secondary and primary carbon atoms, respectively.
The corresponding Arrhenius relationships for deuterium abstraction from fully deuterated propane (C
3D
8) are presented in
Figure 4.
The kinetics of hydrogen atom abstraction from the primary and secondary carbon sites in propane by chlorine atoms were previously investigated by one of the present authors [
20]. Here, we compare our relative rate constants with those earlier results. Both studies employed the C
2H
6 + Cl reaction as a reference and were performed at 298 K using the same apparatus. The previously reported relative rate constants—1.06 ± 0.03 for the primary site and 1.31 ± 0.03 for the secondary—are in excellent agreement with the present values of 1.09 ± 0.03 and 1.32 ± 0.04, differing by less than 3% and 1%, respectively. Measurements of the C
3D
8 + Cl reaction under identical conditions further confirm the consistency and reproducibility of our approach.
Earlier experimental data for the C
3H
8 + Cl reaction were consistent with measurements reported up to 2002; therefore, our discussion focuses on studies published thereafter. In 2006, Choi and co-workers employed laser photolysis combined with infrared detection of HCl to determine a total rate constant of (1.22 ± 0.03) × 10
−10 cm
3 molecule
−1 s
−1 at 298 K [
21]. This value is approximately 16% lower than that obtained from our substrate-decay experiment and about 11% lower than the sum of the site-specific rate constants for hydrogen abstraction from the primary and secondary carbon atoms (
Table 1). In contrast, the branching ratio for abstraction from the primary carbon site shows excellent agreement: Choi et al. reported (48 ± 3)%, whereas our corresponding value is 45% (
Table 1).
The site-specific rate constants obtained in this work (
Table 1) also agree closely with the recommended values reported in Chemical Kinetics and Photochemical Data for Use in Atmospheric Studies, Evaluation No. 15 [
22]. Our k
H,1 is approximately 2% higher and k
H,2 about 7% lower than the recommended values. The recommended total rate constant, 1.40 × 10
−10 cm
3 molecule
−1 s
−1, is only 1.5% lower than that measured here from substrate decay and roughly 3% higher than the sum of k
H,1 and k
H,2 at 298 K.
Furthermore, the most recent Chemical Kinetics and Photochemical Data for Use in Atmospheric Studies, Evaluation No. 19 [
23] recommends the same total and site-specific rate constants for the C
3H
8 + Cl reaction as those reported in Evaluation No. 15.
The only study we found concerning the reaction of C
3D
8 with Cl atoms is that by Hitsuda et al. [
18]. The values reported by Hitsuda et al. are in very good agreement with our corresponding data (
Table 1 and
Table 2). The difference in the total rate constant is only about 1%, while the deviation in the KIE (298 K) value does not exceed 8%.
The excellent agreement between our experimental data and previously reported kinetic parameters for the reactions of Cl atoms with C3H8 and C3D8 clearly demonstrates the reliability and accuracy of the present measurements. This consistency provides strong evidence that the experimental procedures were carefully executed and that the results obtained are robust. Consequently, we conclude that the rate constants for D-atom abstraction from C3D8, determined here for the first time over the temperature range 298–387 K, are reliable and experimentally well-founded.
From the perspective of theoretical chemistry, the overall process of hydrogen atom abstraction from the propane molecule (1) consists of three parallel reactions:
and for the deuterated system:
In this notation, transformations (27) and (29), as well as (28) and (30), correspond to the abstraction of the lateral and central H/D atoms, respectively, from the carbon atom of the –CH3 group. Conversely, the transformations involving the abstraction of the H/D atom from the –CH2– group of propane remained unchanged, and therefore the same numbering as in the experimental section of this paper is used.
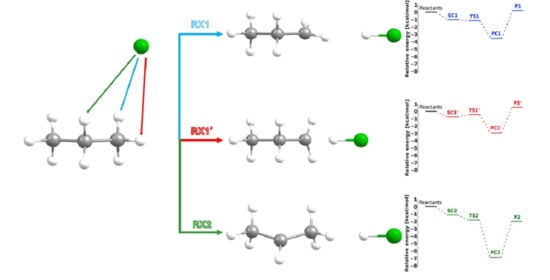
This situation arises directly from the geometric structure of the propane molecule and its symmetry with respect to the carbon backbone plane. As illustrated in
Figure 5, three elementary reactions must be considered in the computational analysis of the system, rather than two, as might be inferred from experimental studies. These studies, due to the free rotation of the methyl group, assume the equivalence of all hydrogen atoms within the group, without accounting for their spatial orientation relative to the plane in the C1–C2–C3 bond axis at the precise moment of the Cl radical attack. To reflect these differences, the notation used in
Figure 5 distinguishes between the individual reactions: RX1 denotes the abstraction of the lateral hydrogen atom from the methyl group, RX1′ refers to the central hydrogen atom of the same group, and RX2 corresponds to the abstraction from the –CH
2– group. The symbol X represents either a protium (H) or a deuterium (D) atom. This notation will be consistently applied throughout the present work.
The fully optimized geometrical structures of all systems for this reaction are shown in
Figure 6. The SC, PC, and TS designations refer to the pre- and post-reactive complexes and the transition state, respectively.
The prereactive complex for reactions RX1 and RX2 corresponds to the same structure, denoted as SC1 = SC2. This results from very slight differences in the distances between atoms H3 and H5 and the attacking chlorine atom, which leads to stabilization of the system. This effect is further enhanced by the presence of an H7···Cl interaction, which can be considered equivalent to the H3···Cl interaction. The resulting highly symmetrical arrangement, stabilized by a triple non-covalent interaction, exhibits, as expected, the lowest possible energy.
In the PC2 structure, the H―Cl bond length is increased (ca. 1.30 Å) compared to that in an isolated HCl molecule (1.288 Å). This elongation is attributed to the persisting interaction between the hydrogen atom and the remaining propyl radical.
A shortening of the carbon–carbon bond is also observed as a result of the reaction. For processes RX1 and RX1′, this effect concerns the C1―C2 distance, whereas in RX2, due to the symmetry of the TS2 and PC2 structures, both C―C bonds shorten by an equal amount. These changes, however, are minimal and fall within the range of a few hundredths of an angstrom.
Among the analyzed transition state structures, TS2 stands out as the most distinctive. Compared to TS1 and TS1′, it exhibits the shortest C···H distance (1.144 Å), which is shorter by 0.185 Å and 0.189 Å, respectively. In contrast, the H···Cl distance in TS2 reaches 1.853 Å, representing an elongation of 0.355 Å and 0.362 Å relative to TS1 and TS1′, respectively. It is highly probable that TS2 displays reactivity features different from those of the other transition states, which will be discussed in detail in a subsequent section of the manuscript.
Table S2 in the Supplementary Materials accompanying this manuscript presents, in addition to the fundamental geometrical parameters, the values of the imaginary frequencies, which confirm the correctness of the identified transition state structures.
A quantity that describes the character of a transition state, based solely on appropriately selected bond lengths (distances), is known as the
L-parameter. It was defined in reference [
24] as the following expression:
The numerator refers to the relative elongation of the C―H (D) bond in the transition state (TS) with respect to its typical length in the reactant molecule prior to the onset of the reaction. The denominator, in turn, reflects the change in the length of the H(D)―Cl bond in the TS structure compared to its length in the free H(D)Cl molecule. The
L-parameter is a dimensionless quantity characterizing the nature of the TS. If its value is less than 1, the transition state is considered reactant-like; for values greater than 1, it is regarded as product-like. According to the Hammond postulate [
25], transition states in exothermic reactions tend to resemble the reactants, whereas in endothermic reactions, they are structurally closer to the products.
The values of the
L-parameter for the transition states of the investigated elementary reactions are summarized in
Table 4. Substituting the TS2 bond lengths into expression (31) yields
This low value indicates a reactant-like character for TS2, which, according to the Hammond postulate, suggests that the associated process (RX2) is more exergonic. All relationships concerning the geometrical parameters remain identical for the deuterated and non-deuterated systems.
The next step involves analyzing the energy profiles of all three elementary reactions. The energy diagrams for the systems containing deuterium and protium atoms are presented in
Figure 7 and
Figure 8, respectively.
The overall energetic profiles of all components of the studied reactions are generally similar for both isotopic forms. The same (vertical) ordering of the energy levels of SCs, PCs, and Ps is observed (where Ps denote the products, i.e., the propyl radical and hydrogen chloride molecule). However, differences arise in the case of the transition states.
For the deuterated system, the energetic ordering is TS1′ > TS1 > TS2, whereas in the non-deuterated system, TS2 is located between TS1′ and TS1. Moreover, the energy differences between all transition states (TSs) are significantly smaller in the non-deuterated system compared to the D-atomic system. This is particularly evident for TS1 and TS2, where ΔE
(TS2–TS1) amounts to only 0.19 kcal/mol, while in
Figure 7 it reaches 0.66 kcal/mol. Additionally, the distribution of TS energy levels is more uniform in the deuterated system.
Let us consider the activation barriers and their associated implications. In the classical approach, the difference between the energy of the transition state and the sum of the energies of the reactants is defined as the activation energy barrier of the reaction. In this context, all examined processes (RXN, N = 1, 1′, 2) are barrierless, since the energy levels of the transition states (TSs) lie below the total energy of the reactants.
However, the situation changes in the deuterated system when analyzing the energy diagrams by considering the SCs as the initial states for the actual H/D-atom abstraction step and their corresponding transition structures. For the RD1′ transformation, the activation barrier is small but positive, amounting to 0.32 kcal/mol. In all other cases, regardless of the isotopic substitution, the individual reaction steps remain barrierless.
The absence of an activation barrier has significant consequences that are reflected in the kinetics of the chemical process. In such cases, an inverse temperature dependence of the reaction rate constants is typically observed [
26,
27].
Establishing a clear correlation between the values of the L-parameter and the energy diagrams representing the course of the studied processes is not a straightforward task. It should be noted that the L-parameter is based solely on structural features, in essence, only on differences in bond lengths (or interatomic interaction distances). There is no doubt that the energies of the individual stationary states, which correspond to specific points on the potential energy surface (PES), provide a much deeper and more comprehensive insight into the nature of the processes under investigation.
Among all the considered reaction pathways, only RX2 was classified, based on L-parameter, as an exergonic process, due to the reactant-like character of its transition state. Despite the absence of classical activation barriers, it can be stated that the largest energy difference occurs between PC2 (or P2, depending on the convention adopted) and SC2 (or the total energy of the reactants), which indeed makes RX2 the most exergonic of the processes analyzed.
Considering the energy levels of the final products (Ps), especially as shown in
Figure 7 (where the values are positive), both RX1 and RX1′ appear to follow a significantly more endergonic course. In the case of energy differences between the SC and corresponding PC states within the same transformation, predicting the energetic character becomes less straightforward. Nonetheless, the energy differences between PC1 and PC1′ and SC1 = SC2 are clearly smaller than those between PC2 and SC1 = SC2, which further supports the lower exergonic character of RX1 and RX1′ compared to RX2.
Thus, although the correlation between L-parameter and the energetic profile is not direct, a consistent reflection of the structural relationships captured by the L-parameter can nevertheless be observed in the energetic characteristics of the individual reaction pathways involved in the interaction of the propane molecule with atomic chlorine.
It should be noted that the presented energy diagrams correspond to an absolute zero temperature. The described energy levels of each isotopic form refer to the vibrational zero-point energy (VZPE), and the energy differences between PCs and SCs (or between the sum of products and reactants) represent the reaction enthalpies (ΔrH°) at T = 0 K. The barrier heights, ΔETS-SC (ΔETS-reactants), correspond to activation enthalpies (Δ‡H°(0 K)
To assess the impact of temperature on the mechanism, it is essential to consider thermodynamic functions, specifically the reaction enthalpy (ΔrH°) and Gibbs free energy (ΔrG°).
Table 5 summarizes the thermodynamic functions for all parallel channels at six temperatures (298.15–550 K). In accordance with the kinetic model used in this work, the reported reaction enthalpies and Gibbs free energies are defined for the microscopic step SC→PC (entrance complex to product complex). Both pre-reactive (SC) and post-reactive (PC) complexes are explicitly included in these definitions.
All analyzed values of ΔrH° and ΔrG° are negative. For the reaction enthalpy, this indicates an exergonic nature of the processes investigated. As the temperature increases, the value of ΔrH° systematically decreases across all transformations. In the deuterated system, this function assumes higher values at a given temperature than in the corresponding protiated ones. The order of decreasing exergonicity of the individual processes is as follows: RX2 > RX1 > RX1′ at all analyzed temperatures.
Although all reactions exhibit an exergonic character, the observed sequence is fully consistent, in qualitative terms, with the trends indicated by the L-parameter and the corresponding energy diagrams.
Gibbs free energy provides insight not only into the spontaneity but also the feasibility of a chemical reaction. The negative values of Δ
rG° compiled in
Table 5 indicate that each individual process proceeds spontaneously, and therefore so does the overall abstraction reaction.
As the temperature increases, the value of ΔrG° becomes less negative, which is fully expected, as the activation barrier simultaneously decreases. Unlike enthalpy, Gibbs free energy is lower in the protiated systems compared to their deuterated counterparts at the same temperature for a given process.
Based on the ΔrG° values, the most favorable reaction pathway proceeds via TS2. The next most feasible channels are the transformations RX1 and RX1′. This sequence is fully consistent with the previously discussed geometric and energetic characteristics. Undoubtedly, the formation of pre-reaction complexes is a key factor influencing the rate of the chemical reactions investigated. Expression (35), used to determine the rate constant, accounts for the contribution of these structures as stable starting complexes in the hydrogen atom abstraction step of each individual process.
For clarity, the Eyring–TST values reported here pertain to the SC→PC unimolecular step (first order) and are used for mechanistic diagnosis; second-order units and quantitative comparisons are reserved for experimental kinetics or for future treatments that include Kassoc(T)/VTST.
For the gas-phase reaction between Cl atoms and propane (Cl + C3H8), long-range induction/dispersion interactions define a variational outer bottleneck; therefore, Eyring–TST referenced to the entrance complex (SC) provides an upper bound with respect to capture-limited kinetics unless that outer TS is included.
Table 6 reports first-order rate constants (10
11 ×
k (SC→PC); units remain s
−1) for all parallel channels and for the overall H/D-abstraction at six specified temperatures. These values are intended for qualitative use only (mechanism, channel ordering, temperature trends).
As expected, the rate constants (k) in the deuterated system are generally lower than in the non-deuterated one, and their variation with temperature is significantly reduced. For a given temperature, the highest values of k are observed for process RX2, followed by RX1, with RX1′ exhibiting the lowest rates. This trend is fully consistent with the reaction feasibility order, the degree of exoergicity, and the behavior of the L-parameter, which accounts for structural changes during the reaction pathway.
Another feature reflected in
k is the disappearance of the activation barrier, previously discussed in the context of the energy diagrams of the studied process. For RD1′ (measured relative to the SC1′ complex), a positive activation energy was obtained (
Figure 7), which results in a proportional dependence of
kRD1′ on temperature.
Although for RD1 the corresponding difference is −0.12 kcal/mol, this value appears too small to reverse the observed temperature dependence of
kRD1. In all other cases, the rate clearly decreases with increasing temperature. This trend is highlighted in red in
Table 6 and also applies to the overall rate constant of the reaction. It may indicate that process RX2 contributes most significantly to the total abstraction process.
This can be verified using the concept of the
branching ratio (
BR). Following Cleaves et al. [
28], the branching ratio (BR) is taken as the ratio of the rate constant for a given product channel to the total rate over all possible products. This operational definition is fully consistent with the IUPAC usage of “branching ratio” as the fractional contribution of an alternative product channel to the overall outcome [
29]. The following formula can express the mathematical definition of BR for every individual reaction investigated:
where
X is the proper isotopic form, and
N is the number of parallel reactions (
N = 1, 1′, 2).
is a weighting factor assigned to the reaction
in the denominator of the general expression for the fractional contribution of reaction
.
is changeable and depends on
N and
i. Hence, this parameter can take on the values:
Both plots clearly indicate that RX2 is the most favored reaction channel. The next most probable pathway is RX1, while the contribution of RX1′ to the overall rate constant is less than 10%.
As the temperature increases, the contribution of
kRD2 to the overall rate constant,
kD, decreases to approximately 65%, which is consistent with the inverse temperature dependence for this transformation, as shown in
Table 6. A similar trend is observed for RX1 and RX1′, whose
BR plots exhibit positive slopes, indicating a proportional increase in their contributions with rising temperature.
Notably, the plots of kRH2/kH and kRH1/kH exhibit nonlinear behavior, in contrast to the nearly linear dependence of kRH1′/kH. At T = 298.15 K, both RH2 and RH1 contribute equally (approximately 46%), but their temperature-dependent trends evolve almost symmetrically: kRH2/kH initially increases sharply and stabilizes around 49%, whereas kRH1/kH decreases in a manner closely resembling the BR curve of RH2, reaching a plateau near 41%.
Thus, the plot of kRH2/kH does not directly reflect the inverse temperature dependence expected from the rate constant of RH2. A similar pattern is seen for kRH1/kH. This can be attributed to two factors: first, the temperature dependence of the rate constants in the protiated system is significantly nonlinear; second, the overall rate constant kH includes contributions from all parallel processes at a given temperature. Therefore, although the individual k values decrease with temperature, the ratio defining the branching ratio does not necessarily follow the same trend, as it represents the relative contribution of a given pathway to the total reaction rate rather than the absolute value of its rate constant.
The theoretical results referring to the reaction rate constants presented in this study show very good qualitative agreement with the previously reported experimental data. Although experimental measurements do not distinguish between individual reaction pathways within the methyl group, treating all hydrogen atoms as chemically equivalent, and cover only three temperatures (298 K, 334 K, and 387 K), a meaningful qualitative comparison is still possible.
The data presented in
Table 1 and
Table 2 clearly indicate an inverse temperature dependence of the rate constant, both for the individual reaction channels and for the overall process. This effect is particularly pronounced in the non-deuterated system and is consistent with the predictions of quantum chemical calculations, where the decrease in k is attributed to the absence of a classical activation barrier.
In the deuterated systems, the decline in k is less pronounced or tends to level off at higher temperatures (T = 334 K and 387 K), especially for reactions involving the methyl group. The agreement between these experimental observations and the mechanistic insight from theoretical modeling further supports the proposed interpretation of the temperature dependence.
In our gas-phase experiments, collisions are effectively isolated with respect to third-body effects. The residual discrepancy between experiment and theory primarily reflects the kinetic model: conventional Eyring–TST referenced to the entrance complex (SC) does not include the variational outer transition state that governs long-range capture and therefore yields upper-bound rate constants; further differences stem from the absence of variational/recrossing and tunneling corrections, anharmonic/hindered-rotor effects, and level-of-theory limitations.


