Abstract
Background: Obesity is a disease with high prevalence worldwide, and the accumulation of visceral fat is related to increased cardiovascular risk. The inclusion of polyunsaturated fatty acids (PUFAs) in the diet has been shown to be a promising nutritional strategy. We aimed to examine the associations between PUFAs consumption and visceral adiposity dysfunction, assessed by the visceral adiposity index (VAI). Methods: This cross-sectional study included 697 adults from the SHIP-Brazil cohort. Structured interviews collected sociodemographic, lifestyle, and dietary data. The intake of omega-3, omega-6, EPA, DHA, and EPA + DHA intake assessed through an adapted food frequency questionnaire (FFQ) was categorized into tertiles. Serum lipids were analyzed using the Cobas system, and VAI was calculated by a sex-specific formula and categorized into two groups (low and high VAI, p50), according to sex. Results: Among men, a higher VAI was associated with greater energy intake and higher carbohydrate and fat consumption. Among women, EPA + DHA intake (β = −0.396, 95% CI: −0.639; −0.152, p = 0.001), EPA (β = −0.679, 95% CI: −1.220; −0.138, p = 0.014), and DHA (β = −0.780, 95% CI: −1.207; −0.352, p < 0.001) were negatively associated with VAI, while omega-6 (β = 0.015, 95% CI: 0.003; 0.028, p = 0.017) showed a positive association. No associations were found between saturated and monounsaturated fatty acids and VAI. Conclusions: The EPA + DHA intake, EPA, and DHA intake were inversely associated with VAI in women, but not in men. Omega-6 intake was negatively associated with VAI in men and positively associated with VAI in women. It is important to highlight that, given the cross-sectional design, these associations do not establish temporality or causality.
1. Introduction
Obesity and overweight are global health priorities across all life stages, sexes, and most countries [1]. Obesity results from complex and multifactorial determinants, such as lifestyle, biological, and genetic traits [2]. Obesity is often classified by body mass index (BMI) ≥ 30 Kg/m2, which shows the imbalance between food intake and energy expenditure [2]. Abnormal and excessive fat accumulation impairs health. It currently affects more than 890 million individuals worldwide [3].
Although obesity involves metabolic, molecular, and genetic events that favor fat accumulation [4,5], the obesogenic environment appears to exert a relevant role [6]. Despite that, not all individuals under an unfavorable environment develop obesity, reinforcing that metabolic response and genetic variations act on individual predisposition to obesity [7]. If not prevented or controlled, obesity induces many comorbidities, such as type 2 diabetes, dyslipidemia, hypertension, chronic kidney disease, non-alcoholic fatty liver disease, and metabolic syndrome, which, when isolated or combined, increase the cardiovascular disease (CVD) risk [7].
Given the serious impact of obesity-related illnesses, adequate monitoring of body weight is crucial. This helps detect overweight and obesity early so treatment can begin. Three-dimensional tomography and magnetic resonance imaging are gold-standard methods for assessing body composition and abdominal obesity. However, due to radiation and high cost, these methods have limited use in clinical practice [8]. Visceral fat accumulation can also be estimated using indirect methods like waist circumference (WC) and its ratios with hip (waist-to-hip ratio—WHR) or height (waist-to-height ratio—WHtR). These measures are now often combined with metabolic parameters to improve sensitivity and specificity. Currently, lipid accumulation product (LAP), Chinese visceral adiposity index (CVAI), BMI metabolic score (BMIm), and visceral adiposity index (VAI) are validated, low-cost tools widely used to monitor obesity and related diseases [8].
VAI is a validated method used to assess visceral adipose tissue and its function according to sex and anthropometric and biochemical parameters, including WC, BMI, triglyceride levels, and high-density lipoprotein cholesterol (HDL-c) [9]. VAI demonstrates greater accuracy compared to the predictive power of WC, BMI, and isolated lipid markers [9]. Over the past decades, several studies have shown that VAI is capable of predicting dysfunctional adipose tissue and also increased cardiometabolic risk in different populations [10,11,12]. Additionally, VAI is also correlated with several adipocytokines, including resistin, leptin, soluble leptin receptors, adiponectin, ghrelin, vascular endothelial growth factor (VEGF), hepatocyte growth factor, tumor necrosis factor alpha (TNF-α), high-sensitivity C-reactive protein (hs-CRP), interleukin (IL)-6, and IL-18, according to Amato et al., in patients with type 2 diabetes [13].
Moreover, visceral adipose tissue dysfunction goes beyond fat accumulation, characterized by impaired insulin signaling and a reduced antilipolytic effect of insulin, leading to increased release of free fatty acids and glycerol into the portal circulation. This continuous flow of free fatty acids contributes to hepatic gluconeogenesis, dyslipidemia, and systemic insulin resistance. In parallel, dysfunctional visceral adipose tissue exhibits increased adrenergic sensitivity, promoting further lipolysis and altered expression of genes related to insulin signaling pathways, such as IRS-2. Furthermore, visceral adipose tissue dysfunction involves increased secretion of proinflammatory cytokines, chemokines, and growth factors, along with reduced adiponectin and increased leptin, chemerin, and resistin, favoring a state of chronic low-grade inflammation. Elevated liver enzymes may also reflect hepatic steatosis secondary to visceral obesity [14].
Diet plays a fundamental role in the prevention and treatment of obesity and CVD, with omega-3 fatty acids being an important target for research [15]. Omega-3 fatty acids are robustly related to improvement in metabolic syndrome, obesity, hypertension, and dyslipidemia, through the reduction in plasma triglycerides (TG) [16], anorexigenic mechanisms [17], and anti-inflammatory and antioxidant roles [18]. Conversely, omega-6 is associated with inflammatory stimulus, with activation of cyclooxygenases and lipoxygenases and consequent generation of prostaglandins, weight gain, and accumulation of visceral fat [19].
Although several benefits have been attributed to omega-3 fatty acids, growing evidence indicates differential effects among their subclasses, with alpha-linolenic acid (ALA) showing weaker associations with cardiovascular risk factors compared with eicosapentaenoic acid (EPA) and docosahexaenoic acid (DHA) [20]. In fact, ALA had no significant effect on inflammatory markers and lipid profile in individuals with obesity or overweight. A prominent response was observed only when taking high doses (≥3.0 g/day) for ≥12 months, suggesting a response dependent on the time and doses [21]. In the insulin resistance mice model, the response to EPA and DHA (1%, 2% and 4%) identified a distinct profile, where DHA (4%) stimulated the browning process by up-regulating peroxisome proliferator-activated receptor gamma (PPAR-γ), while EPA (4%) showed an anti-obesity effect independent of PPAR-γ on obesity [22].
Furthermore, there is a gap in the literature regarding how PUFAs impact CVD-associated risk factors, including visceral adiposity, differently in men and women. In 2023, the Framingham Offspring Cohort study, for example, raised the question of whether divergent associations with cardiometabolic risk in women and men could be associated with differences in dietary fat sources [23]. Also in 2025, a literature review concluded that it is unclear whether there are sex differences in response to the consumption of oily fish or alternative sources of omega-3. However, it reinforces that, in general, the consumption of oily fish should be encouraged in recommendations for women [24].
Therefore, the hypothesis of this study is that dietary intake of omega-3 fatty acids is inversely associated with visceral fat deposition and dysfunction, and omega-6 is positively associated with these alterations in a large populational study. To assess this, we investigated whether habitual fatty acid intake is associated with visceral fat deposition and dysfunction, estimated by VAI in participants of a population-based cross-sectional study. Additionally, we tested whether these associations were dependent on the type and amount of fatty acid intake.
2. Results
A total of 697 individuals were included in the study, of whom 51.5% were women (n = 399). The participants had a mean age of 43.6 ± 14.5 years and a mean BMI of 28.76 ± 5.58 kg/m2, consistent with overweight. High VAI was associated with older individuals and high prevalence of smokers (p < 0.001 for all) in both sexes. However, the prevalence of sedentary individuals was lower in those with higher VAI. Regarding current diseases, the group with high VAI had high prevalence of hypertension, diabetes mellitus, dyslipidemia, resulting in increased CVD risk, also for both sexes (p < 0.05 for all) (Table 1).

Table 1.
Sociodemographic, lifestyle, and clinical characteristics of individuals, according to sex and visceral adiposity index (VAI) cut-off points (p50).
As expected, individuals with high VAI presented elevate BMI values (Men: 27.29 ± 4.45 vs. 30.37 ± 4.81 kg/m2, p < 0.001; Women: 26.77 ± 5.35 vs. 30.74 ± 6.33 kg/m2, p < 0.001), WC (Men: 91.17 ± 10.83 vs. 98.82 ± 11.34 cm, p < 0.001; Women: 80.85 ± 11.29 vs. 91.30 ± 13.21 cm, p < 0.001), and fat mass (Men: 21.64 ± 5.85 vs. 25.10 ± 6.71%, p < 0.001; Women: 33.53 ± 7.17 vs. 39.35 ± 8.51%, p < 0.001), evidencing increased total body adiposity (Figure S1).
As shown in Table 2, individuals with higher VAI values presented an overall more adverse metabolic profile, independent of sex. Men and women in the high VAI groups had significantly higher levels of total cholesterol (TC), low-density lipoprotein cholesterol (LDL-c), TG, glucose, and liver enzymes compared with those in the low VAI groups (p < 0.05 for all). Conversely, HDL-c concentrations were markedly lower among participants with high VAI.
Table 2.
Biochemical data according to sex and visceral adiposity index (VAI) cut-off points (p50).
Table 3 shows the dietary intake of men and women according to VAI categories. Among men, those with higher VAI values had higher total energy intake and higher proportions and absolute amounts of carbohydrates, total lipids, and fatty acids, including SFA, MUFA, PUFA, and their subclasses. Higher mean values of omega-3, EPA, DHA, and the EPA + DHA intake were also observed in this group. Among women, those in the higher VAI category had higher carbohydrate intake and lower intake of protein, total lipids, and their subclasses. Lower mean intakes of SFA, MUFA, PUFA, omega-3, EPA, DHA, and a lower EPA + DHA intake were observed in women with higher VAI.
Table 3.
Food consumption, according to sex and visceral adiposity index (VAI) cut-off points (p50).
The linear regression model (Table 4) showed associations between VAI and dietary intake of polyunsaturated fatty acids. In adjusted models (model 2), omega-6 intake was inversely associated with VAI in men. In women, the EPA + DHA intake, EPA, and DHA were negatively associated with VAI, while omega-6 showed a positive association.
Table 4.
Association between visceral adiposity index (VAI) and dietary consumption of polyunsaturated fatty acids.
Additional analyses were performed to examine the links between VAI and other dietary fatty acid subclasses (Table S1), including SFA and MUFA. No associations were observed between the consumption of SFA, MUFA, and VAI.
3. Discussion
In this population-based study with a strong emphasis on the preservation of Germanic culture, our results show that omega-6 intakes were inversely associated with VAI values in men. Furthermore, omega-3, EPA, and DHA were negatively associated with VAI, while omega-6 showed a modest positive association in women. In general, the observed inverse associations between omega-3 fatty acids and VAI are in line with previous evidence suggesting favorable metabolic profiles associated with omega-3 consumption or supplementation [25,26,27,28].
These associations between omega-3 fatty acids and VAI may result from their lipid-lowering effects, as previously described in the literature. Omega-3 fatty acids stimulate β-oxidation, modulating the synthesis and clearance of TG from very low-density lipoprotein (VLDL) particles, in addition to increasing the activity of lipoprotein lipase [29]. Furthermore, omega-3 fatty acids can reduce TG synthesis by modulating the expression of the Sterol Regulatory Element-binding Protein 1c (SREBP-1) and Carbohydrate Response Element-binding Protein (ChREBP) pathways [30]. This issue was investigated by Hao et al. [31], testing the omega-3-to-omega-6 ratio (0.3:1) for 10 weeks. This intervention promoted a significant reduction in body weight and fat mass in obese mice, but when the omega-6 to omega-3 ratio was higher (20:1), a further increase in the body weight of the mice was observed [31]. In another study, it was demonstrated that the administration for 21 weeks of a high-fat diet (45% kcal from fat) containing 7% (w/w) menhaden oil, providing 4.82% EPA and 3.77% DHA of total fatty acids, decreased adipocyte hypertrophy and reduced TG content. In contrast, a flaxseed oil diet containing 20.81% ALA did not elicit the same effects [20].
In addition, experimental evidence indicates that EPA and DHA can attenuate inflammation through down-regulation of transcription factors, such as nuclear factor kappa B (NF-κB), c-Jun N-terminal kinase (JNK), and NLR family pyrin domain containing 3 (NLRP3), resulting in reduced production of proinflammatory cytokines, including IL-6, IL-1β, IL-18, and TNF-α [32]. Activation of free fatty acid receptors (FFAR1/4) by omega-3 fatty acids contributes to the suppression of these inflammatory pathways and may increase postprandial satiety and reduce food intake [33,34]. Regulation of adipokines, such as leptin and adiponectin, as well as the activation of PPAR-γ, have also been implicated in the improvement of lipid metabolism and energy homeostasis [35,36].
Furthermore, we found divergent sex-related associations between dietary PUFAs intake and VAI. In fact, there is a clear gap in the literature and inconclusive evidence regarding the distinct effects of habitual PUFA intake by sex [28,37,38]. However, existing data indicate that the metabolism and physiological roles of PUFAs differ between men and women, in part due to hormonal regulation and variations in body fat distribution [24]. Women tend to have higher proportions of ALA and DHA and lower proportions of EPA compared to men, particularly before menopause, due to the stimulatory effects of estrogen on the enzymatic conversion of ALA to long-chain n-3 PUFAs through increased desaturase and elongase activity [24]. After menopause, however, the sharp decline in estrogen levels is associated with reduced endogenous synthesis of these fatty acids and unfavorable cardiometabolic changes, such as increased central adiposity, inflammation, and dyslipidemia [24]. Collectively, this evidence supports the hypothesis that hormonal status may explain, in part, the divergent associations observed between PUFA intake and visceral adiposity in men and women.
Another relevant point to consider is the influence of whole-food dietary patterns on visceral adiposity. Although our analysis focused on individual and grouped fatty acids, it is clear that other dietary components interact synergistically with adiposity and related anthropometric indicators. Several studies corroborate this view, including Ferguson et al. [39], who found an inverse association between adherence to the DASH diet and VAI among older adults; Xu et al. [40] using decision tree modeling based on NHANES data identified VAI risk, protein intake, and fiber intake as key predictors of cardiovascular disease; and Nazari et al. [41] observed a marginal inverse association between the Lifelines Diet Score and VAI in Iranian women. Furthermore, Moslehi et al. [42] highlighted the relevance of macronutrient substitution models in understanding the metabolic impact of dietary fat quality.
In addition, a dietary source of fatty acids can also influence the effects on lipid metabolism and fat accumulation. It is known that the Brazilian population consumes a high amount of red meat [43]. In particular, individuals living in the southern region of Brazil have high meat consumption (both processed and fresh), with men consuming more meat than women [44]. In this cohort, oleic acid likely derives predominantly from animal sources (e.g., meat—processed and unprocessed and dairy fats) and, to a lesser extent, from plant oils; source-specific effects should be considered when interpreting MUFA associations. Taken together, these findings suggest that the impact of fatty acids on visceral adiposity cannot be fully understood in isolation. Future studies should incorporate comprehensive analyses of dietary patterns to contextualize the role of fatty acids within the complexity of real-world eating behaviors. Regarding this issue, all fatty acids were adjusted by energy, and regression models considered the potential interaction with palmitic, stearic, and oleic fatty acids, besides other confounders.
The results of the present study should be interpreted, taking into account some limitations. First, this is a cross-sectional study, in which it is not possible to infer a causal relationship from the data presented. In addition, the FFQ used for dietary assessment presents inherent limitations. Because it relies on the participant’s memory and perception, FFQs are subject to recall bias and systematic underreporting or overreporting of food intake, particularly among overweight or obese individuals. Moreover, FFQs have limited precision for estimating the absolute intake of specific nutrients, particularly individual fatty acid subclasses. To minimize these potential biases, all interviews were conducted by trained dietitians, and questionnaires with incomplete or inconsistent responses were excluded from the analyses. Despite these limitations, the FFQ applied in this study was previously developed and validated for the Brazilian population [45] and adapted for the population enrolled [46]; however, it was not specifically validated for the estimation of fatty acid subclasses, which should be considered when interpreting the results. Additionally, we cannot discharge the influence of genetic factors not investigated here, but recent evidence shows that Caveolin-1 polymorphisms may interact with dietary fat quality to influence adiposity, suggesting gene-diet interactions play a role in metabolic responses [47].
Another limitation is that, although VAI is a validated and practical surrogate marker based on anthropometric and lipid parameters, it cannot fully capture the complex metabolic activity of visceral fat. Therefore, more accurate and sophisticated techniques, such as computed tomography or magnetic resonance imaging, provide direct quantification of visceral adipose tissue, but are expensive, time-consuming, and impractical in large-scale population studies. In this context, the inclusion of liver enzyme analyses in our results partially offsets this limitation, offering additional insights into metabolic disorders associated with visceral adipose tissue dysfunction. However, the lack of data on insulin resistance, lipokines, and inflammatory biomarkers limits a more comprehensive assessment of adipose tissue dysfunction and its systemic metabolic implications.
Overall, the findings indicate that the relationship between PUFAs and VAI is multifaceted and depends on both the quality and composition of dietary fats. The sex-related differences observed in these associations underscore the importance of considering biological and behavioral factors that modulate fatty acid metabolism. It is essential to note that the present study contributes to the current body of evidence by emphasizing the relevance of sex-specific recommendations regarding PUFA consumption and metabolism. Further prospective and interventional studies are warranted to confirm these observations and to clarify whether such variations stem from intrinsic biological mechanisms or are shaped by context-dependent dietary and lifestyle patterns.
4. Materials and Methods
4.1. Sample and Study Design
This is a cross-sectional study using baseline data from the SHIP-Brazil study. The sample size calculation is based on a 50% event prevalence and 5% precision, estimating a total of 3678 individuals from 21,795 inhabitants of Pomerode in 2010. Accounting for losses and refusals during the baseline data collection, the final sample was 2488 participants, of whom 697 individuals fulfilled all data for this study (Figure 1). Details of the sample size calculation and design study were previously described by Santa Helena et al. [48].
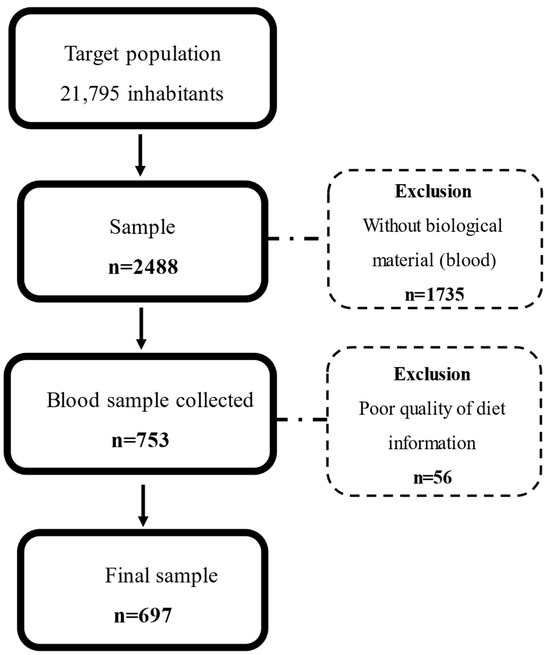
Figure 1.
Study flowchart.
This study included individuals of both sexes, aged between 20 and 79 years, residing in Pomerode, Santa Catarina, Brazil, for at least 6 months. This city is characterized by intense preservation of Germanic culture as a result of the migration movement to Brazil that started in the second half of the 19th century. Individuals with physical, cognitive, or mental disabilities that did not allow them to answer the questionnaires or move to the Research Center, individuals who did not speak Portuguese, as well as malnourished individuals, pregnant and lactating women, participants in clinical intervention protocols, and users of illicit drugs were excluded from this study [48].
This study was approved by the Ethics Committee for Research with Human (No. 8903924.0.0000.5421), and all data collection procedures are described in the protocols of the SHIP-Brazil cohort and can be accessed at https://www.estudoshipbrazil.com.br/pesquisadores (accessed on 1 July 2024).
4.2. Sociodemographic Characterizations
Information was collected with structured questionnaires through direct interviews on the following variables: age; sex; race; level of physical activity using the International Physical Activity Questionnaire (IPAQ) questionnaire and classified in walking, moderate/vigorous physical activity or sedentary [49]; smoking; risk of alcohol abuse was classified in low risk versus high risk—moderate/high/severe [50]; current diseases, including self-reported T2D and dyslipidemia. Hypertension was measured by proxy variable—Systolic blood pressure (SBP) ≥ 140 mmHg and/or diastolic (DBP) blood pressure ≥ 90 mmHg and/or use of antihypertensive medication and/or medical diagnosis. SBP and DBP blood pressure were measured with OMRON705-IT devices, validated according to the guidelines of the British Hypertension Society (BHS) [51].
4.3. Food Consumption Analysis
Data on food consumption were collected using an adapted food frequency questionnaire (FFQ), administered by trained and qualified interviewers. The FFQ consisted of 118 food items, and habitual consumption (quantitatively and qualitatively) was based on a previously validated questionnaire for the Brazilian population [45]. The nutritional composition and home measurements of regional recipes were obtained through technical sheets, with ingredients known and described by local residents [52]. This process included the following typical foods: bread fried in lard, bread with sardines and egg, apfelstrudel, cat ear, duck or stuffed duck, sweet potato gnocchi, meat dumpling, white black pudding (leberwurst) and dark (blutwurst), butter biscuit, homemade mayonnaise, colonial cheese, kochkäse, pork fat, colonial milk, bovine tongue, cuka cake, pork head jelly (sülse), cream, duck blood soup (schwarzsauer), loquat (plum), and draft beer. Traditional Brazilian foods, such as cajá, winged yam, yam, cooked plantain, cashew, small crab, crab, acarajé, Bahia food (vatapá, caruru, and fish moqueca), chicory, okra, pistachio, cottage cheese, buffalo mozzarella, polengui cheese, and flatbread, were excluded [52]. All data collected underwent quality control, with verification of missing data, duplication, and analysis of inconsistencies [44].
Total calories, carbohydrates, proteins, lipids, total SFA, palmitic acid, stearic acid, total monounsaturated fatty acids (MUFAs), oleic acid, total polyunsaturated fatty acids (PUFAs), omega-6 (linoleic, dihomo-γ-linolenic, and arachidonic acids), and omega-3 (ALA, stearidonic acid, EPA, DPA, DHA) were assessed using the Food Processor program, version 10.11.0 (ESHA Research, Salem, OR, USA). The dietary data were analyzed using the Food Processor Nutrition Analysis Software, version 10.11.0 (ESHA Research, Salem, OR, USA). Dietary data were analyzed using the USDA National Nutrient Database, available in the software. To add new processed foods, we used the manufacturer’s labels. For typical Brazilian and German recipes, we entered all ingredients and new foods into the software. Nutrients were adjusted for energy consumption based on the residual method [53]. Extreme consumption values, below the 1st percentile and above the 99th percentile, were considered outliers and not included in the analyses. From the content of EPA and DHA was calculated the EPA + DHA intake that consists of the sum of these fatty acids.
4.4. Anthropometric Assessment and Body Composition
Anthropometric measurements were obtained by trained evaluators following standardized protocols, https://www.estudoshipbrazil.com.br/pesquisadores (accessed on 1 July 2024). Height and weight were measured using a stadiometer coupled to an electronic scale (W300, WELMY®, Santa Bárbara d’Oeste, Brazil), with participants barefoot and standing upright. BMI was calculated as weight (kg) divided by height squared (m2) and classified according to the WHO criteria for adults [54] and the PAHO criteria for older adults [55]. WC was measured midway between the lowest rib and the iliac crest, using an inelastic tape, after normal expiration. Body fat percentage was estimated by bioelectrical impedance analysis (Biodynamics 450, TBW, São Paulo, Brazil) with electrodes placed on the dominant limb. Standard pre-assessment procedures were followed, including the removal of metal accessories.
The VAI was calculated using the validated sex-specific equation proposed by Amato et al. [9]:
Men VAI = (CC/39.68 + (1.88 × BMI)) × (TG/1.03) × (1.31/HDL-c)
Women VAI = (CC/36.58 + (1.89 × BMI)) × (TG/0.81) × (1.52/HDL-c)
4.5. Estimate of Cardiovascular Disease Risk
Cardiovascular disease risk was estimated using the predictive pooled cohort equations (PCE) proposed by the American College of Cardiology/American Heart of Cardiology (ACC/AHA). This equation considers the following variables: sex (men and women), age (40 to 79 years), race (white and African-American), SBP (90–200 mmHg), DBP (60–130 mmHg), HDL-c (20–100 mg/dL), total cholesterol (TC) (130–320 mg/dL), diagnosis of diabetes mellitus, use of antihypertensive drugs, and smoking (yes and no) [56]. Based on the equation, individuals are classified according to the chance to have a major cardiovascular (MACE) event in 10 years: low CVD risk (<5%); borderline CVD risk (≥5% to 7.4%); intermediate CVD risk (≥7.5% to 19.9%); and high CVD risk (≥20%), https://tools.acc.org/ascvd-risk-estimator-plus/#!/calculate/estimate/ (accessed on 15 October 2024). In this study, participants were grouped into low CVD risk (<7.5%) and high CVD risk (≥7.5%).
4.6. Biochemical Analyses
After a 10 to 12 h fasting, blood samples (20.0 mL) were collected using vacutainer tubes containing ethylenediaminetetraacetic acid (EDTA) (1.0 mg/mL) to obtain plasma (3000 rpm, 15 min, 4 °C). From plasma, TC, TG, and HDL-c concentrations were assessed using enzymatic and colorimetric reagents (Labtest, Lagoa Santa, Brazil). The low-density lipoprotein (LDL-c) was determined using the Friedewald formula [57], where LDL-c = TC−HDL-c−TG/5. Plasma glucose determination was performed according to the manufacturer’s instructions, using the commercial enzymatic and colorimetric kit Glucose PAP Liquiform (Labtest®, São Paulo, Brazil). All parameters were analyzed in the semi-automated Cobas Mira system (Randox Laboratories Ltd., Crumlin, UK). Liver enzymes, ALT, AST, and GGT, were analyzed using commercial kits according to the manufacturer’s instructions.
4.7. Statistical Analyses
All statistical analyses were performed using inverse probability weighting (IPW) to minimize potential selection bias arising from the complex sampling design, following established methodological recommendations [58,59]. This approach allows for participants with lower probabilities of selection to contribute proportionally more to the analyses, thereby reducing bias related to differential inclusion as described by Santa Helena et al. [48].
In this study, the diet variables (SFA, palmitic acid, stearic acid, MUFAs, oleic acid, and PUFAs, omega-6, linoleic, dihomo-γ-linolenic, arachidonic acids, omega-3, ALA, stearidonic acid, EPA, DPA, and DHA) were treated as continuous variables and also categorized into tertiles. In addition, the sample was stratified into two groups, considering the 50th percentile (VAI < p50) and the 50th percentile (VAI ≥ p50), for each sex. The normality of the distribution of continuous variables was assessed using the Kolmogorov–Smirnov test, allowing for the classification of variables as symmetric or asymmetric.
Quantitative variables were described by measures of central tendency (mean) and dispersion (standard deviation) or median (Interquartile Range), while qualitative variables were presented in absolute values (n) and relative frequencies (%). Student’s t-test was used to compare symmetric continuous variables, and the Mann–Whitney test was used for asymmetric variables. Differences between proportions were assessed using the chi-square test (χ2).
Linear regression models were used to examine the associations between VAI and continuous fat intake variables, stratified by sex. Two models were constructed for the analyses: Model 1 (crude) and Model 2, adjusted for potential confounders, including age, smoking, alcohol consumption, physical activity, Oleic, palmitic, and stearic acids. Regression coefficients (β) and 95% confidence intervals (CI) were estimated for the linear models. To define covariates to add linear regression model, we tested the correlation between EPA, DHA, and omega-3, as well as the EPA + DHA intake and omega-6 and macronutrients, MUFA, SFA, oleic acid, and palmitic acid (Table S2); also, using variance inflation factors (VIF), tolerance values, and the condition index, all lifestyle variables (age, smoking, alcohol consumption, and physical activity) showed VIF values close to 1.0 and low condition indices (<10), indicating no collinearity. Among the fatty acid variables, the condition index reached 24.4 and VIF values up to 10.1, with variance proportions above 0.9 shared among palmitic, stearic, and oleic acids, suggesting high collinearity. Only nutrients without collinearity were added to linear regression models. The level of statistical significance adopted was p < 0.05. The analyses were performed using SPSS 23.0 and GraphPad Prism 8.4 software.
5. Conclusions
The EPA + DHA intake, EPA, and DHA intake were inversely associated with VAI in women, but not in men. Omega-6 intake was negatively associated with VAI in men and positively associated with VAI in women. These findings highlight the importance of considering sex-specific patterns when evaluating the relationship between dietary fatty acids and visceral adiposity. Future longitudinal and interventional studies are needed to explore causal mechanisms and refine dietary recommendations according to sex-related metabolic responses.
Supplementary Materials
The following supporting information can be downloaded at https://www.mdpi.com/article/10.3390/molecules30214245/s1: Figure S1. Anthropometric data, according to sex and Visceral Adiposity Index (VAI); Table S1. Association between visceral adiposity index (VAI) and dietary intake of SAFA and MUFA; Table S2. Correlation table.
Author Contributions
L.A. contributed to the conceptualization; data curation; formal analysis, visualization; methodology; writing—original draft; writing—review and editing. R.A.M.B., J.G.d.S. and J.T.Y.I. contributed to writing—original draft; writing—review and editing. L.C.d.A. contributed to investigation; methodology; writing—review and editing. E.T.d.S.H. contributed to funding acquisition; investigation; methodology; project administration; validation; writing—review and editing. N.R.T.D. contributed to funding acquisition; investigation; methodology; project administration; supervision; validation; writing—review and editing. All authors have read and agreed to the published version of the manuscript.
Funding
This work was supported by the State of São Paulo Research Foundation (No 2022/09893-7 and No 2023/10413-2), and Higher Education Personnel Improvement Coordination (CAPES) (No 88887.924414/2023-00); NRTD are recipients of scholarships from National Council for Scientific and Technological Development (CNPq 303771/2023-2 and 309480/2021-3, respectively). NRTD was the recipient of a scholarship from Coordination for the Improvement of Higher Education Personnel (CAPES Proc 88887.937017/2024-00). SHIP-Brazil was supported by the Foundation for the Support of Scientific and Technological Research of the State of Santa Catarina (FAPESC-TO-20130578).
Institutional Review Board Statement
The study was conducted in accordance with the Declaration of Helsinki and approved by the Institutional Ethics Committee of the University of Blumenau (No. 99559118.0.0000.5370 on 18 October 2018) and the Faculty of Public Health (FSP-USP) (No. 8903924.0.0000.5421 on 16 May 2024).
Informed Consent Statement
Informed consent was obtained from all subjects involved in the study.
Data Availability Statement
The data presented in this study are available on request from the corresponding author due to ethical reasons.
Conflicts of Interest
The authors declare no conflicts of interest.
Abbreviations
| VAI | visceral adiposity index |
| BMI | body mass index |
| CVD | cardiovascular disease |
| WC | waist circumference |
| WHtR | waist-to-height |
| WHR | waist-to-hip ratio |
| LAP | lipid accumulation product |
| CVAI | Chinese visceral adiposity index |
| BMIm | BMI metabolic score |
| HDL-c | high-density lipoprotein cholesterol |
| LDL-c | low-density lipoprotein cholesterol |
| TG | plasma triglycerides |
| TC | total cholesterol |
| ALT | Alanine Aminotransferase |
| AST | Aspartate Aminotransferase |
| GTT | Gamma-Glutamyltransferase |
| MUFA | monounsaturated fatty acids |
| SFA | saturated fatty acids |
| ALA | alpha-linolenic acid |
| EPA | eicosapentaenoic acid |
References
- Phelps, N.H.; Singleton, R.K.; Zhou, B.; Heap, R.A.; Mishra, A.; Bennett, J.E.; Paciorek, C.J.; Lhoste, V.P.; Carrillo-Larco, R.M.; Stevens, G.A.; et al. Worldwide Trends in Underweight and Obesity from 1990 to 2022: A Pooled Analysis of 3663 Population-Representative Studies with 222 Million Children, Adolescents, and Adults. Lancet 2024, 403, 1027–1050. [Google Scholar] [CrossRef]
- Koskinas, K.C.; Van Craenenbroeck, E.M.; Antoniades, C.; Blüher, M.; Gorter, T.M.; Hanssen, H.; Marx, N.; McDonagh, T.A.; Mingrone, G.; Rosengren, A.; et al. Obesity and Cardiovascular Disease: An ESC Clinical Consensus Statement. Eur. J. Prev. Cardiol. 2025, 32, 184–220. [Google Scholar] [CrossRef]
- Lingvay, I.; Cohen, R.V.; Roux, C.W.L.; Sumithran, P. Obesity in Adults. Lancet 2024, 404, 972–987. [Google Scholar] [CrossRef]
- Chagas, C.L.; Da Silva, N.F.; Rodrigues, I.G.; Arcoverde, G.M.P.F.; Ferraz, V.D.; Sobral Filho, D.C.; Diniz, A.D.S.; Pinho, C.P.S.; Cabral, P.C.; De Arruda, I.K.G. Different Factors Modulate Visceral and Subcutaneous Fat Accumulation in Adults: A Single-Center Study in Brazil. Front. Nutr. 2025, 12, 1524389. [Google Scholar] [CrossRef] [PubMed]
- Blüher, M. Obesity: Global Epidemiology and Pathogenesis. Nat. Rev. Endocrinol. 2019, 15, 288–298. [Google Scholar] [CrossRef] [PubMed]
- Speakman, J.R.; Sørensen, T.I.A.; Hall, K.D.; Allison, D.B. Unanswered Questions about the Causes of Obesity. Science 2023, 381, 944–946. [Google Scholar] [CrossRef]
- Khera, A.V.; Cuchel, M.; De La Llera-Moya, M.; Rodrigues, A.; Burke, M.F.; Jafri, K.; French, B.C.; Phillips, J.A.; Mucksavage, M.L.; Wilensky, R.L.; et al. Cholesterol Efflux Capacity, High-Density Lipoprotein Function, and Atherosclerosis. N. Engl. J. Med. 2011, 364, 127–135. [Google Scholar] [CrossRef]
- Wang, H.; Qin, Y.; Niu, J.; Chen, H.; Lu, X.; Wang, R.; Han, J. Evolving Perspectives on Evaluating Obesity: From Traditional Methods to Cutting-Edge Techniques. Ann. Med. 2025, 57, 2472856. [Google Scholar] [CrossRef]
- Amato, M.C.; Giordano, C.; Galia, M.; Criscimanna, A.; Vitabile, S.; Midiri, M.; Galluzzo, A.; For the AlkaMeSy Study Group. Visceral Adiposity Index. Diabetes Care 2010, 33, 920–922. [Google Scholar] [CrossRef]
- Zheng, S.-H.; Li, X.-L. Visceral Adiposity Index as a Predictor of Clinical Severity and Therapeutic Outcome of PCOS. Gynecol. Endocrinol. 2016, 32, 177–183. [Google Scholar] [CrossRef] [PubMed]
- De Oliveira, C.M.; Ulbrich, A.Z.; Neves, F.S.; Dias, F.A.L.; Horimoto, A.R.V.R.; Krieger, J.E.; Alvim, R.D.O.; Pereira, A.D.C. Association between Anthropometric Indicators of Adiposity and Hypertension in a Brazilian Population: Baependi Heart Study. PLoS ONE 2017, 12, e0185225. [Google Scholar] [CrossRef]
- Braga, R.A.M.; Bezerra, I.N.; Nogueira, M.D.D.A.; Souza, A.D.M.; Martins, G.D.S.; Almondes, K.G.D.S.; Moreno, L.A.; Maia, C.S.C. Cardiometabolic Risk Assessment: A School-Based Study in Brazilian Adolescent. Nutr. Metab. Cardiovasc. Dis. 2024, 34, 1069–1079. [Google Scholar] [CrossRef]
- Amato, M.C.; Giordano, C. Visceral Adiposity Index: An Indicator of Adipose Tissue Dysfunction. Int. J. Endocrinol. 2014, 2014, 730827. [Google Scholar] [CrossRef]
- Shetty, S.; Suvarna, R.; Bhattacharya, S.; Seetharaman, K. Visceral Adiposity and Cardiometabolic Risk: Clinical Insights and Assessment. Cardiol. Rev. 2025, 2025, 10-1097. [Google Scholar] [CrossRef]
- Lorente-Cebrián, S.; Costa, A.G.V.; Navas-Carretero, S.; Zabala, M.; Martínez, J.A.; Moreno-Aliaga, M.J. Role of Omega-3 Fatty Acids in Obesity, Metabolic Syndrome, and Cardiovascular Diseases: A Review of the Evidence. J. Physiol. Biochem. 2013, 69, 633–651. [Google Scholar] [CrossRef]
- Capece, U.; Gugliandolo, S.; Morciano, C.; Avolio, A.; Splendore, A.; Di Giuseppe, G.; Ciccarelli, G.; Soldovieri, L.; Brunetti, M.; Mezza, T.; et al. Erythrocyte Membrane Fluidity and Omega-3 Fatty Acid Intake: Current Outlook and Perspectives for a Novel, Nutritionally Modifiable Cardiovascular Risk Factor. Nutrients 2024, 16, 4318. [Google Scholar] [CrossRef] [PubMed]
- Roy, J.; Larroquet, L.; Surget, A.; Lanuque, A.; Sandres, F.; Terrier, F.; Corraze, G.; Chung-Yung Lee, J.; Skiba-Cassy, S. Impact on Cerebral Function in Rainbow Trout Fed with Plant Based Omega-3 Long Chain Polyunsaturated Fatty Acids Enriched with DHA and EPA. Fish. Shellfish. Immunol. 2020, 103, 409–420. [Google Scholar] [CrossRef] [PubMed]
- Jerab, D.; Blangero, F.; Da Costa, P.C.T.; De Brito Alves, J.L.; Kefi, R.; Jamoussi, H.; Morio, B.; Eljaafari, A. Beneficial Effects of Omega-3 Fatty Acids on Obesity and Related Metabolic and Chronic Inflammatory Diseases. Nutrients 2025, 17, 1253. [Google Scholar] [CrossRef] [PubMed]
- Jeong, H.Y.; Moon, Y.S.; Cho, K.K. ω-6 and ω-3 Polyunsaturated Fatty Acids: Inflammation, Obesity and Foods of Animal Resources. Food Sci. Anim. Resour. 2024, 44, 988–1010. [Google Scholar] [CrossRef]
- Smorenburg, J.N.; Hodun, K.; McTavish, P.V.; Wang, C.; Pinheiro, M.A.; Wells, K.R.D.; Brunt, K.R.; Nakamura, M.T.; Chabowski, A.; Mutch, D.M. EPA/DHA but Not ALA Reduces Visceral Adiposity and Adipocyte Size in High Fat Diet-Induced Obese Delta-6 Desaturase Knockout Mice. Mol. Nutr. Food Res. 2025, 69, e202400721. [Google Scholar] [CrossRef]
- Yin, S.; Xu, H.; Xia, J.; Lu, Y.; Xu, D.; Sun, J.; Wang, Y.; Liao, W.; Sun, G. Effect of Alpha-Linolenic Acid Supplementation on Cardiovascular Disease Risk Profile in Individuals with Obesity or Overweight: A Systematic Review and Meta-Analysis of Randomized Controlled Trials. Adv. Nutr. 2023, 14, 1644–1655. [Google Scholar] [CrossRef] [PubMed]
- Borja-Magno, A.I.; Furuzawa-Carballeda, J.; Guevara-Cruz, M.; Arias, C.; Granados, J.; Bourges, H.; Tovar, A.R.; Sears, B.; Noriega, L.G.; Gómez, F.E. Supplementation with EPA and DHA Omega-3 Fatty Acids Improves Peripheral Immune Cell Mitochondrial Dysfunction and Inflammation in Subjects with Obesity. J. Nutr. Biochem. 2023, 120, 109415. [Google Scholar] [CrossRef]
- Yiannakou, I.; Yuan, M.; Zhou, X.; Singer, M.R.; Moore, L.L. Dietary Fat Intakes, Lipid Profiles, Adiposity, Inflammation, and Glucose in Women and Men in the Framingham Offspring Cohort. Front. Physiol. 2023, 14, 1144200. [Google Scholar] [CrossRef] [PubMed]
- Hall, W.L. Long Chain N-3 Polyunsaturated Fatty Acid Intake across the Life Span for Cardiovascular Disease Prevention in Women. Proc. Nutr. Soc. 2025, 84, 98–109. [Google Scholar] [CrossRef] [PubMed]
- Oshima, Y.; Rin, S.; Kita, H.; Hiramoto, Y.; Morimoto, S.; Okunaga, A.; Takami, H.; Nakamura, S.; Saito, H.; Izumi, M. The Frequency of Fish-Eating Could Negatively Associate with Visceral Adiposity in Those Who Eat Moderately. J. Nutr. Sci. Vitaminol. J. Nutr. Sci. Vitaminol. 2015, 61, 426–431. [Google Scholar] [CrossRef] [PubMed][Green Version]
- Yang, Z.; Lan, Y.; Yang, K.; Zhang, J.; Chen, L.; Meng, T.; Wu, M.; Lu, X. Omega-3 and Omega-6 Fatty Acids: Inverse Association with Body Fat Percentage and Obesity Risk. Nutr. Res. 2025, 135, 32–41. [Google Scholar] [CrossRef] [PubMed]
- Abbas Torki, S.; Roumi, Z.; Tahavorgar, A.; Salimi, Z.; Mohammadi, S.; Shekari, S.; Saeedirad, Z.; Amjadi, A.; Mirzaee, P.; Shafaei, H.; et al. Effect of Omega-3 Fatty Acids Supplementation on Muscle Mass, Fat Mass, and Visceral Fat of Hemodialysis Patients; A Randomized Clinical Trial. J. Basic. Clin. Physiol. Pharmacol. 2024, 35, 347–352. [Google Scholar] [CrossRef] [PubMed]
- Sangouni, A.A.; Orang, Z.; Mozaffari-Khosravi, H. Effect of Omega-3 Supplementation on Fatty Liver and Visceral Adiposity Indices in Diabetic Patients with Non-Alcoholic Fatty Liver Disease: A Randomized Controlled Trial. Clin. Nutr. ESPEN 2021, 44, 130–135. [Google Scholar] [CrossRef]
- Rundblad, A.; Sandoval, V.; Holven, K.B.; Ordovás, J.M.; Ulven, S.M. Omega-3 Fatty Acids and Individual Variability in Plasma Triglyceride Response: A Mini-Review. Redox Biol. 2023, 63, 102730. [Google Scholar] [CrossRef]
- Gnoni, A.; Giudetti, A.M. Dietary Long-Chain Unsaturated Fatty Acids Acutely and Differently Reduce the Activities of Lipogenic Enzymes and of Citrate Carrier in Rat Liver. J. Physiol. Biochem. 2016, 72, 485–494. [Google Scholar] [CrossRef]
- Hao, L.; Chen, C.-Y.; Nie, Y.-H.; Kaliannan, K.; Kang, J.X. Differential Interventional Effects of Omega-6 and Omega-3 Polyunsaturated Fatty Acids on High Fat Diet-Induced Obesity and Hepatic Pathology. Int. J. Mol. Sci. 2023, 24, 17261. [Google Scholar] [CrossRef]
- Gao, X.; Su, X.; Han, X.; Wen, H.; Cheng, C.; Zhang, S.; Li, W.; Cai, J.; Zheng, L.; Ma, J.; et al. Unsaturated Fatty Acids in Mental Disorders: An Umbrella Review of Meta-Analyses. Adv. Nutr. 2022, 13, 2217–2236. [Google Scholar] [CrossRef]
- Lamantia, V.; Bissonnette, S.; Beaudry, M.; Cyr, Y.; Rosiers, C.D.; Baass, A.; Faraj, M. EPA and DHA Inhibit LDL-Induced Upregulation of Human Adipose Tissue NLRP3 Inflammasome/IL-1β Pathway and Its Association with Diabetes Risk Factors. Sci. Rep. 2024, 14, 27146. [Google Scholar] [CrossRef]
- Albracht-Schulte, K.; Kalupahana, N.S.; Ramalingam, L.; Wang, S.; Rahman, S.M.; Robert-McComb, J.; Moustaid-Moussa, N. Omega-3 Fatty Acids in Obesity and Metabolic Syndrome: A Mechanistic Update. J. Nutr. Biochem. 2018, 58, 1–16. [Google Scholar] [CrossRef]
- Brown, L.H.; Mutch, D.M. Mechanisms Underlying N3-PUFA Regulation of White Adipose Tissue Endocrine Function. Curr. Opin. Pharmacol. 2020, 52, 40–46. [Google Scholar] [CrossRef]
- Ahmadi, A.R.; Shirani, F.; Abiri, B.; Siavash, M.; Haghighi, S.; Akbari, M. Impact of Omega-3 Fatty Acids Supplementation on the Gene Expression of Peroxisome Proliferator Activated Receptors-γ, α and Fibroblast Growth Factor-21 Serum Levels in Patients with Various Presentation of Metabolic Conditions: A GRADE Assessed Systematic Review and Dose–Response Meta-Analysis of Clinical Trials. Front. Nutr. 2023, 10, 1202688. [Google Scholar] [CrossRef]
- Delpino, F.M.; Figueiredo, L.M.; Da Silva, B.G.C. Effects of Omega-3 Supplementation on Body Weight and Body Fat Mass: A Systematic Review. Clin. Nutr. ESPEN 2021, 44, 122–129. [Google Scholar] [CrossRef] [PubMed]
- Jafari Salim, S.; Alizadeh, S.; Djalali, M.; Nematipour, E.; Hassan Javanbakht, M. Effect of Omega-3 Polyunsaturated Fatty Acids Supplementation on Body Composition and Circulating Levels of Follistatin-like 1 in Males with Coronary Artery Disease: A Randomized Double-Blind Clinical Trial. Am. J. Mens. Health 2017, 11, 1758–1764. [Google Scholar] [CrossRef] [PubMed]
- Ferguson, C.C.; Knol, L.L.; Ellis, A.C. Visceral Adiposity Index and Its Association with Dietary Approaches to Stop Hypertension (DASH) Diet Scores among Older Adults: National Health and Nutrition Examination Surveys 2011–2014. Clin. Nutr. 2021, 40, 4085–4089. [Google Scholar] [CrossRef]
- Xu, S.; Cai, Y.; Hu, H.; Zhai, C. Correlation of Visceral Adiposity Index and Dietary Profile with Cardiovascular Disease Based on Decision Tree Modeling: A Cross-Sectional Study of NHANES. Eur. J. Med. Res. 2025, 30, 123. [Google Scholar] [CrossRef]
- Nazari, M.; Mirzaie, K.; Keshavarz, S. Association between Lifelines Diet Score (LLDS) and Some Novel Anthropometric Indices, Including Body Roundness Index (BRI), A Body Shape Index (ABSI), Visceral Adiposity Index (VAI), and Body Adiposity Index (BAI), in Iranian Women: A Cross-Sectional Study. BMC Women’s Health 2024, 24, 172. [Google Scholar] [CrossRef]
- Moslehi, N.; Ehsani, B.; Mirmiran, P.; Hojjat, P.; Azizi, F. Association of Dietary Proportions of Macronutrients with Visceral Adiposity Index: Non-Substitution and Iso-Energetic Substitution Models in a Prospective Study. Nutrients 2015, 7, 8859–8870. [Google Scholar] [CrossRef]
- Bonfim, S.M.V.; Leite, M.J.S.; Camusso, I.G.; Marchioni, D.M.L.; Carvalho, A.M. Consumption of Meat in Brazil: A Perspective on Social Inequalities and Food and Nutrition Security. IJERPH 2024, 21, 1625. [Google Scholar] [CrossRef]
- Blank, J.T.; Helena, E.T.D.S.; Damasceno, N.R.T.; Santos, R.D.; Markus, M.R.P.; Azevedo, L.C.D. Consumo de Carnes Por Adultos e Idosos de Uma Cidade de Colonização Alemã Do Sul Do Brasil: Estudo de Base Populacional. Ciênc. Saúde Coletiva 2023, 28, 243–255. [Google Scholar] [CrossRef]
- Molina, M.D.C.B.; Benseñor, I.M.; Cardoso, L.d.O.; Velasquez-Melendez, G.; Drehmer, M.; Pereira, T.S.S.; de Faria, C.P.; Melere, C.; Manato, L.; Gomes, A.L.C.; et al. Reproducibility and relative validity of the Food Frequency Questionnaire used in the ELSA-Brasil. Cad. Saude Publica 2013, 29, 379–389. [Google Scholar] [PubMed]
- Da Rosa, A.C.; Schmitz, B.; Chiarelli, G.; Da Silveira, J.L.G.C.; Alves, M.U.; Campanella, L.C.D.A. Adaptação de Um Inquérito Alimentar a Ser Utilizado Em Um Estudo Longitudinal a Partir Do Contexto Sociocultural de Uma População de Colonização Alemã. Rev. Atenção Saúde 2016, 14, 34–41. [Google Scholar] [CrossRef]
- Ghaffarian-Ensaf, R.; Shiraseb, F.; Mirzababaei, A.; Clark, C.C.T.; Mirzaei, K. Interaction between Caveolin-1 Polymorphism and Dietary Fat Quality Indexes on Visceral Adiposity Index (VAI) and Body Adiposity Index (BAI) among Overweight and Obese Women: A Cross-Sectional Study. BMC Med. Genom. 2022, 15, 258. [Google Scholar] [CrossRef]
- Santa Helena, E.T.D.; Sousa, C.A.D.; Silveira, J.L.G.C.D.; Nunes, C.R.D.O.; Azevedo, L.C.D.; Nilson, L.G.; Valente, C.; Prado, R.L.D.; Cordova, C.M.M.D.; Batista, K.Z.S.; et al. Study of Health in Pomerode (SHIP-Brazil): Aims, Methodological Issues and Descriptive Results. arXiv 2023. [Google Scholar] [CrossRef]
- Craig, C.L.; Marshall, A.L.; Sjöström, M.; Bauman, A.E.; Booth, M.L.; Ainsworth, B.E.; Pratt, M.; Ekelund, U.; Yngve, A.; Sallis, J.F.; et al. International Physical Activity Questionnaire: 12-Country Reliability and Validity. Med. Sci. Sports Exerc. 2003, 35, 1381–1395. [Google Scholar] [CrossRef] [PubMed]
- Babor, T.F.; Kranzler, H.R.; Lauerman, R.J. Early Detection of Harmful Alcohol Consumption: Comparison of Clinical, Laboratory, and Self-Report Screening Procedures. Addict. Behav. 1989, 14, 139–157. [Google Scholar] [CrossRef] [PubMed]
- Williams, B.; Poulter, N.R.; Brown, M.J.; Davis, M.; McInnes, G.T.; Potter, J.F.; Sever, P.S.; Thom, S.M. British Hypertension Society Guidelines for Hypertension Management 2004 (BHS-IV): Summary. BMJ 2004, 328, 634–640. [Google Scholar] [CrossRef]
- Chiarelli, G.; Höfelmann, D.A.; Silveira, J.L.G.C.D.; Alves, M.U.; Azevedo, L.C.D. Validity and Reproducibility of a Food Frequency Questionnaire for German Descendants Living in Brazil. Rev. Nutr. 2021, 34, e200048. [Google Scholar] [CrossRef]
- Willett, W.; Howe, G.; Kushi, L. Adjustment for Total Energy Intake in Epidemiologic Studies. Am. J. Clin. Nutr. 1997, 65, 1220S–1228S. [Google Scholar] [CrossRef] [PubMed]
- Eveleth, P.B. Physical Status: The Use and Interpretation of Anthropometry. Report of a WHO Expert Committee. Am. J. Hum. Biol. 1996, 8, 786–787. [Google Scholar] [CrossRef]
- Pan American Health Organization. Multicenter Survey Aging, Health and Wellbeing in Latin America and the Caribbean (SABE): Preliminary Report; Pan American Health Organization: Washington, DC, USA, 2001. [Google Scholar]
- Goff, D.C.; Lloyd-Jones, D.M.; Bennett, G.; Coady, S.; D’Agostino, R.B.; Gibbons, R.; Greenland, P.; Lackland, D.T.; Levy, D.; O’Donnell, C.J.; et al. 2013 ACC/AHA Guideline on the Assessment of Cardiovascular Risk: A Report of the American College of Cardiology/American Heart Association Task Force on Practice Guidelines. Circulation 2014, 129 (Suppl. S2), S49–S73. [Google Scholar] [CrossRef] [PubMed]
- Friedewald, W.T.; Levy, R.I.; Fredrickson, D.S. Estimation of the Concentration of Low-Density Lipoprotein Cholesterol in Plasma, without Use of the Preparative Ultracentrifuge. Clin. Chem. 1972, 18, 499–502. [Google Scholar] [CrossRef]
- Hofler, M.; Pfister, H.; Lieb, R.; Wittchen, H.-U. The Use of Weights to Account for Non-Response and Drop-Out. Soc. Psychiat Epidemiol. 2005, 40, 291–299. [Google Scholar] [CrossRef]
- Nohr, E.A.; Liew, Z. How to Investigate and Adjust for Selection Bias in Cohort Studies. Acta Obstet. Gynecol. Scand. 2018, 97, 407–416. [Google Scholar] [CrossRef]

Disclaimer/Publisher’s Note: The statements, opinions and data contained in all publications are solely those of the individual author(s) and contributor(s) and not of MDPI and/or the editor(s). MDPI and/or the editor(s) disclaim responsibility for any injury to people or property resulting from any ideas, methods, instructions or products referred to in the content. |
© 2025 by the authors. Licensee MDPI, Basel, Switzerland. This article is an open access article distributed under the terms and conditions of the Creative Commons Attribution (CC BY) license (https://creativecommons.org/licenses/by/4.0/).