1. Introduction
Agricultural wastes such as peanut husks, wood sawdust, rice husks, and corn stover are commonly used as adsorbents for the removal of various pollutants from water. Coffee is a crop, and coffee waste is a promising green, low-cost, and renewable wastewater treatment matter that can be used as a bio-based adsorbent to remove pollutants [
1].
Coffee plants belong to the Rubiaceae family. The plant species
Coffea arabica (Arabica) and
Coffea canephora (Robusta) are the most popular and account for 75 and 25% of the world’s coffee production for drinking purposes, respectively [
2,
3].
According to the International Coffee Organization (ICO) statistics, the harvest of coffee beans reached 10.5 million tons in 2020–2021 [
4]. Every ton of prepared coffee will produce 0.5 tons of coffee husks, and about 6 million tons of coffee grounds are produced globally each year [
5]. These wastes contain some organic compounds, such as caffeine, tannins, and chlorogenic acid which can pollute the environment without proper treatment [
6]. Coffee waste also contains large amounts of lipids, cellulose and hemicellulose, polyphenols, carbohydrates, proteins, and various other components that can be converted into valuable products such as biofuels, biochar, dietary fibre, flavours, bioactive compounds, and carotenoids.
Coffee is one of the most common and most frequently consumed beverages in the world. Coffee drinks are considered to possess stimulating and refreshing properties [
7]. The main by-products of the coffee industry are spent coffee grounds (SCG), silverskin (CS), and coffee shells (CH).
CH is the epidermis of the coffee beans that falls off during roasting due to the application of heat, while CS is the only by-product of the coffee roasting process. Coffee silverskin is the thin skin on the outer layer of coffee beans—a by-product of the coffee roasting industry. The silver husk is the outer layer of coffee beans, so it can be assumed that at least some of the bioactive compounds present in roasted coffee beans will also remain in the husk. Roasted coffee beans are a rich source of bioactive compounds such as caffeine, chlorogenic acids, caffeic acid, coumaric acid, ferulic acid, protocatechuic acid, vanillic acid, gallic acid, and flavonoids [
8]. The content of polyphenolic compounds in the silver husk can be as great as 1600 mg∙100 g
−1 husk. Due to their presence, this residue is characterized by great antioxidant properties and a large concentration of soluble dietary fibre (86% of the total dietary fibre). In addition to polyphenolic compounds, important bioactive compounds present in coffee and silver husk are caffeine (1,3,7-trimethylxanthine) and some mono- and polysaccharides: cellulose and hemicellulose, xylose, galactose, mannose, arabinose, and glucose, being found in major amounts [
9].
In recent years, some studies have also proven the good adsorption action of coffee waste for the removal of organic and inorganic pollutants from wastewater, so it can be used as an adsorbent in wastewater treatment. Spent coffee grounds (SCGs) represent valuable precursors for activated carbon preparation [
10,
11,
12,
13,
14]. Sorbents obtained from coffee are mainly used for heavy metals and dyes [
15].
Jutakridsada et al. [
16] impregnated SCG in 60 mL of ZnCl
2 with various concentrations (5, 10, 15 wt.%), and carbonized it in a furnace with atmospheric air at 400, 450, and 500 °C and used for Cu(II) sorption.
SCG activation using phosphoric acid (H
3PO
4) and phosphorus pentoxide for Cu(II) sorption was described in [
17].
Sorption of aniline yellow dye was studied on carbon sorbents obtained from SCG soaked in potassium hydroxide (KOH) and carbonized at 500 °C for 30 min in a muffle furnace [
18].
Activated carbon obtained from ground coffee, impregnated with 25%
v/
v HNO
3 and activated at 500 °C for 20 min was used for the sorption of methyl orange [
19].
Activated carbon from SCGs [
20], provided by an Italian local cafeteria (100% Arabica), was mixed with potassium hydroxide (KOH) powder at the 1:1 mass ratio. KOH is commonly used as an activating agent to develop porosity during thermal treatments and was pyrolyzed in a tubular alumina reactor (Carbolite) at 800 °C for 4 h under N
2 atmosphere in the sorption of dyes (methylene blue (MB), erythrosine B (EB) and bromothymol blue) as well as phenols (3-chlorophenol and bisphenol-A).
Block et al. [
21] described the preparation of carbon adsorbents from spent coffee for the removal of methylene blue and methyl orange from water.
Chemical activation of carbons prepared from coffee residue was reported in [
22], while their use as CO
2 capture adsorbents was described in [
23].
In all the cases mentioned above, carbonization was carried out in a long process in traditional furnaces. Recently, attempts have been made to obtain carbon sorbents from coffee waste using a microwave treatment process of biomass [
24]. To obtain carbon from coffee ground waste, Kang et al. [
25] used an N
2 plasma jet for the carbonization process and a CO
2 plasma jet for the activation process.
In this paper, carbon sorbents obtained from coffee residues carbonized under the influence of microwave radiation and activated in a plasma reactor are presented. All samples were obtained after earlier impregnation by H3PO4. The influence of carbonization time on chemical and porous structure of the obtained carbons was studied. Comparative studies of antibiotic sorption on carbon sorbents obtained during microwave irradiation and on sorbents activated additionally with plasma were also carried out.
2. Results and Discussion
The spent coffee grounds used in the experiments were subjected to the characterization of their porous structure. The specific surface area was approx. 10 m2 g−1 and the total pore volume approx. 0.01 cm3 g−1.
The results of the porous structure determination for carbons are presented in
Table 1. The samples C2, C5, and C10, obtained from SCGs during irradiation of microwaves, are porous. As the microwave exposure time increases, a porous structure develops. The specific surface area of the samples increases from 26 m
2 g
−1 for the sample irradiated for 2 min to 482 m
2 g
−1 for the sample exposed to microwaves for 10 min. At the same time, the pore diameters decrease, and for the samples exposed to microwaves for 5 and 10 min, micropores appear. This phenomenon is clearly visible from pore size distribution, showing two-modal distributions of pore sizes (desorption branch).
This indicates that as the microwave exposure time increases, the structure of the forming carbons undergoes a reorganization. Microwave irradiation enabled the rapid internal heating of the samples, facilitating the release of gaseous products and pore development in a short time. It is assumed that graphitization progresses in their structure.
The porous structure of samples additionally activated by plasma has become more developed. Applying cold plasma to the samples increased their pore volume and specific surface areas. For the samples C5 and C10, the specific surface areas increased after plasma activation, from 325 and 482 m2 g−1 to 425 and 601 m2 g−1, respectively. Even the carbon obtained after 2 min of carbonization, which had a specific surface area of only 26 m2 g−1, increased to 44 m2 g−1 after plasma activation, and the pore volume increased from 0.108 cm3 g−1 to 0.155 cm3 g−1.
The results for this sample demonstrated that plasma alone is unlikely to induce significant porosity in slightly carbonized structures and should be used as a complementary surface treatment method.
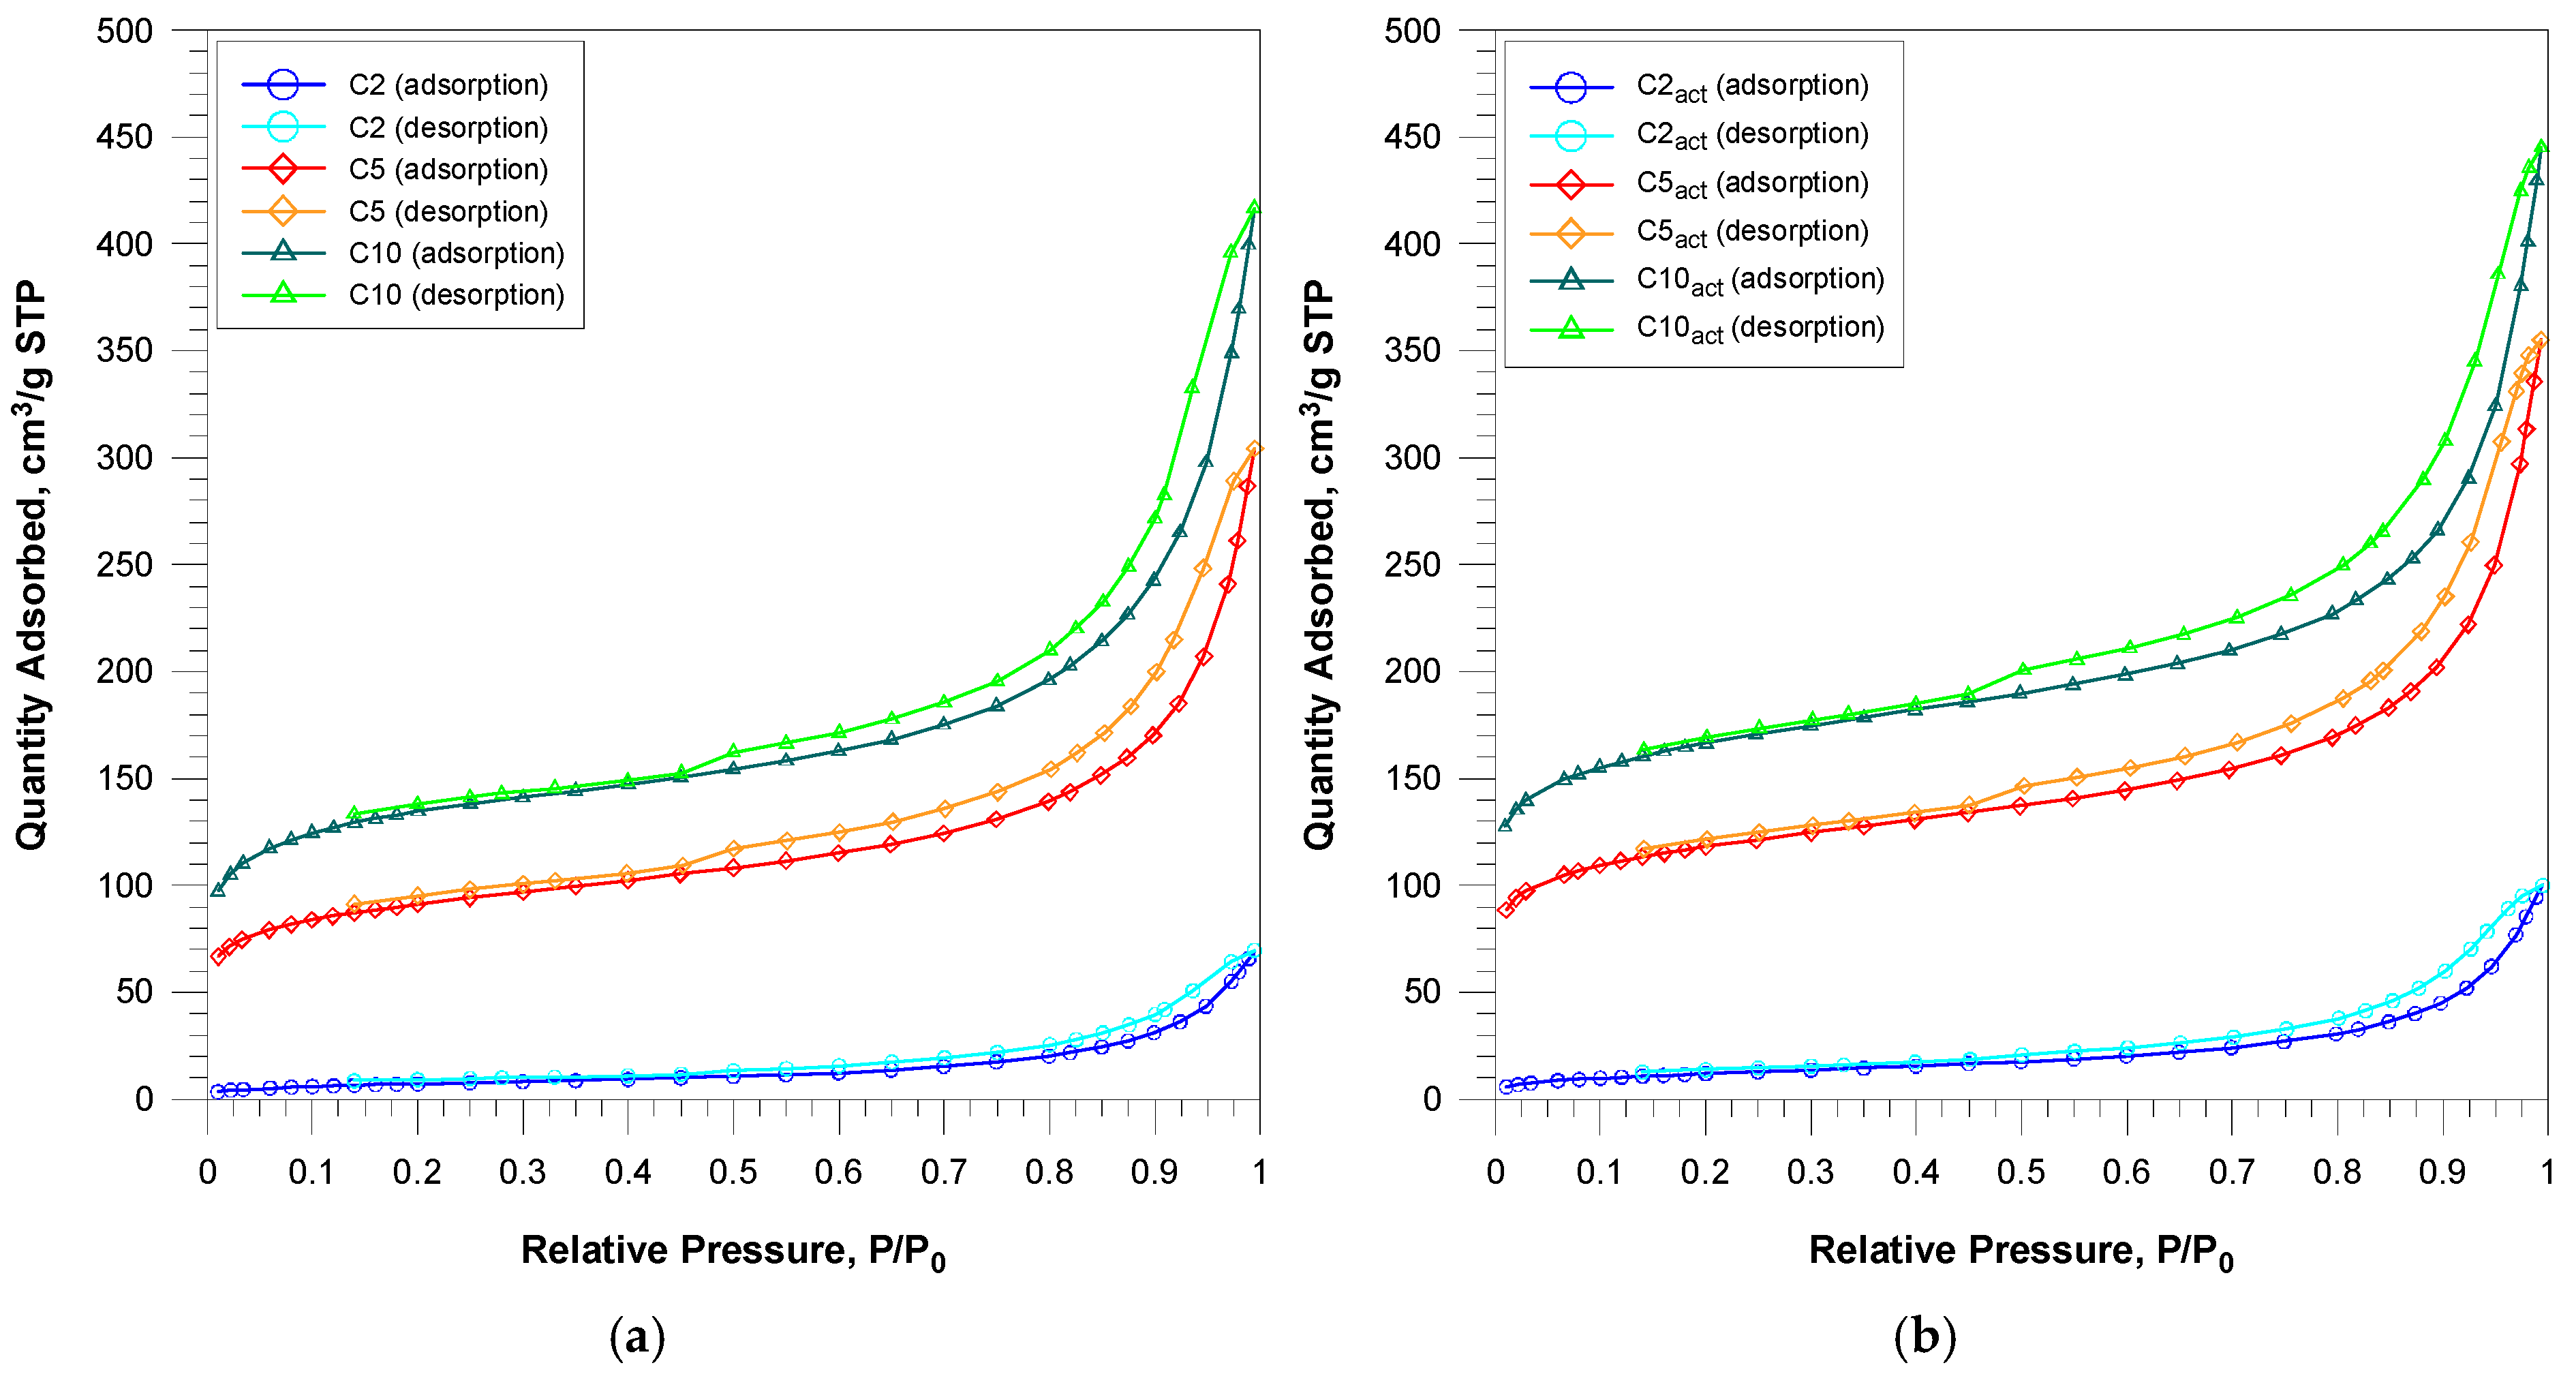
The nitrogen adsorption/desorption curves are presented in
Figure 1. Nitrogen adsorption–desorption isotherms for the obtained carbons can be assigned to the IUPAC type IV classification. Capillary condensation occurs with an accompanying H3/H4 type hysteresis loop. The isotherms for all materials are typical for the studied carbons with a mixed micro-/mesoporous structure.
Based on their courses, pore size distribution curves were determined (
Figure 2). The curves a and b in
Figure 2, relating to the starting carbon materials and their cold plasma-activated counterparts, are derived from the nitrogen absorption branch. The curves in
Figure 2c,d originate from the desorption branch. Based on their course, their most probable pore diameters can be determined. For the curves obtained from the adsorption branch for the samples before and after activation, the pore size distribution does not change significantly, and the most probable pore diameter is 30 nm [
26]. The PSD curves from the desorption branch show a bimodal pore distribution with the maxima around 4 and 22 nm, both for the samples before and after plasma activation.
The results from the SEM-EDS microanalysis show that with the increase in the time of microwave exposure to spent coffee impregnated with H
3PO
4, its carbonization occurs (
Table 2). The percentage of carbon for sample C2, which is 62.54%, increases to 77.37% for the sample irradiated for 10 min. At the same time, a large decrease in the percentage of oxygen can be observed. High temperature causes the breakdown of chemical bonds present in coffee, resulting in the release of volatile oxygen-containing compounds. The content of nitrogen in the studied carbon sorbents’ structures decreases relatively slowly. In turn, the percentage of phosphorus increases insignificantly. This indicates that the phosphoric acid used to impregnate the spent coffee was transformed into more stable compounds and it remained in this form in the carbonization products.
Similar results were obtained for the samples additionally activated with cold plasma. Differences in the content of individual elements did not exceed 0.5–1%. The largest differences can be observed for oxygen and phosphorus. For these elements, the percentage content increases insignificantly after plasma activation.
The results show that plasma activation induced very limited changes in elemental composition, as evidenced by the close similarity of each sample to its plasma-treated counterpart. These minimal differences suggest that plasma treatment affects primarily the surface chemistry, as confirmed by the XPS analysis, without significant alteration of the chemical composition. This is to be expected, as cold plasma operates at low temperatures and shallow penetration depths, making it an effective tool for surface functionalization without damaging the internal structure of carbon sorbents.
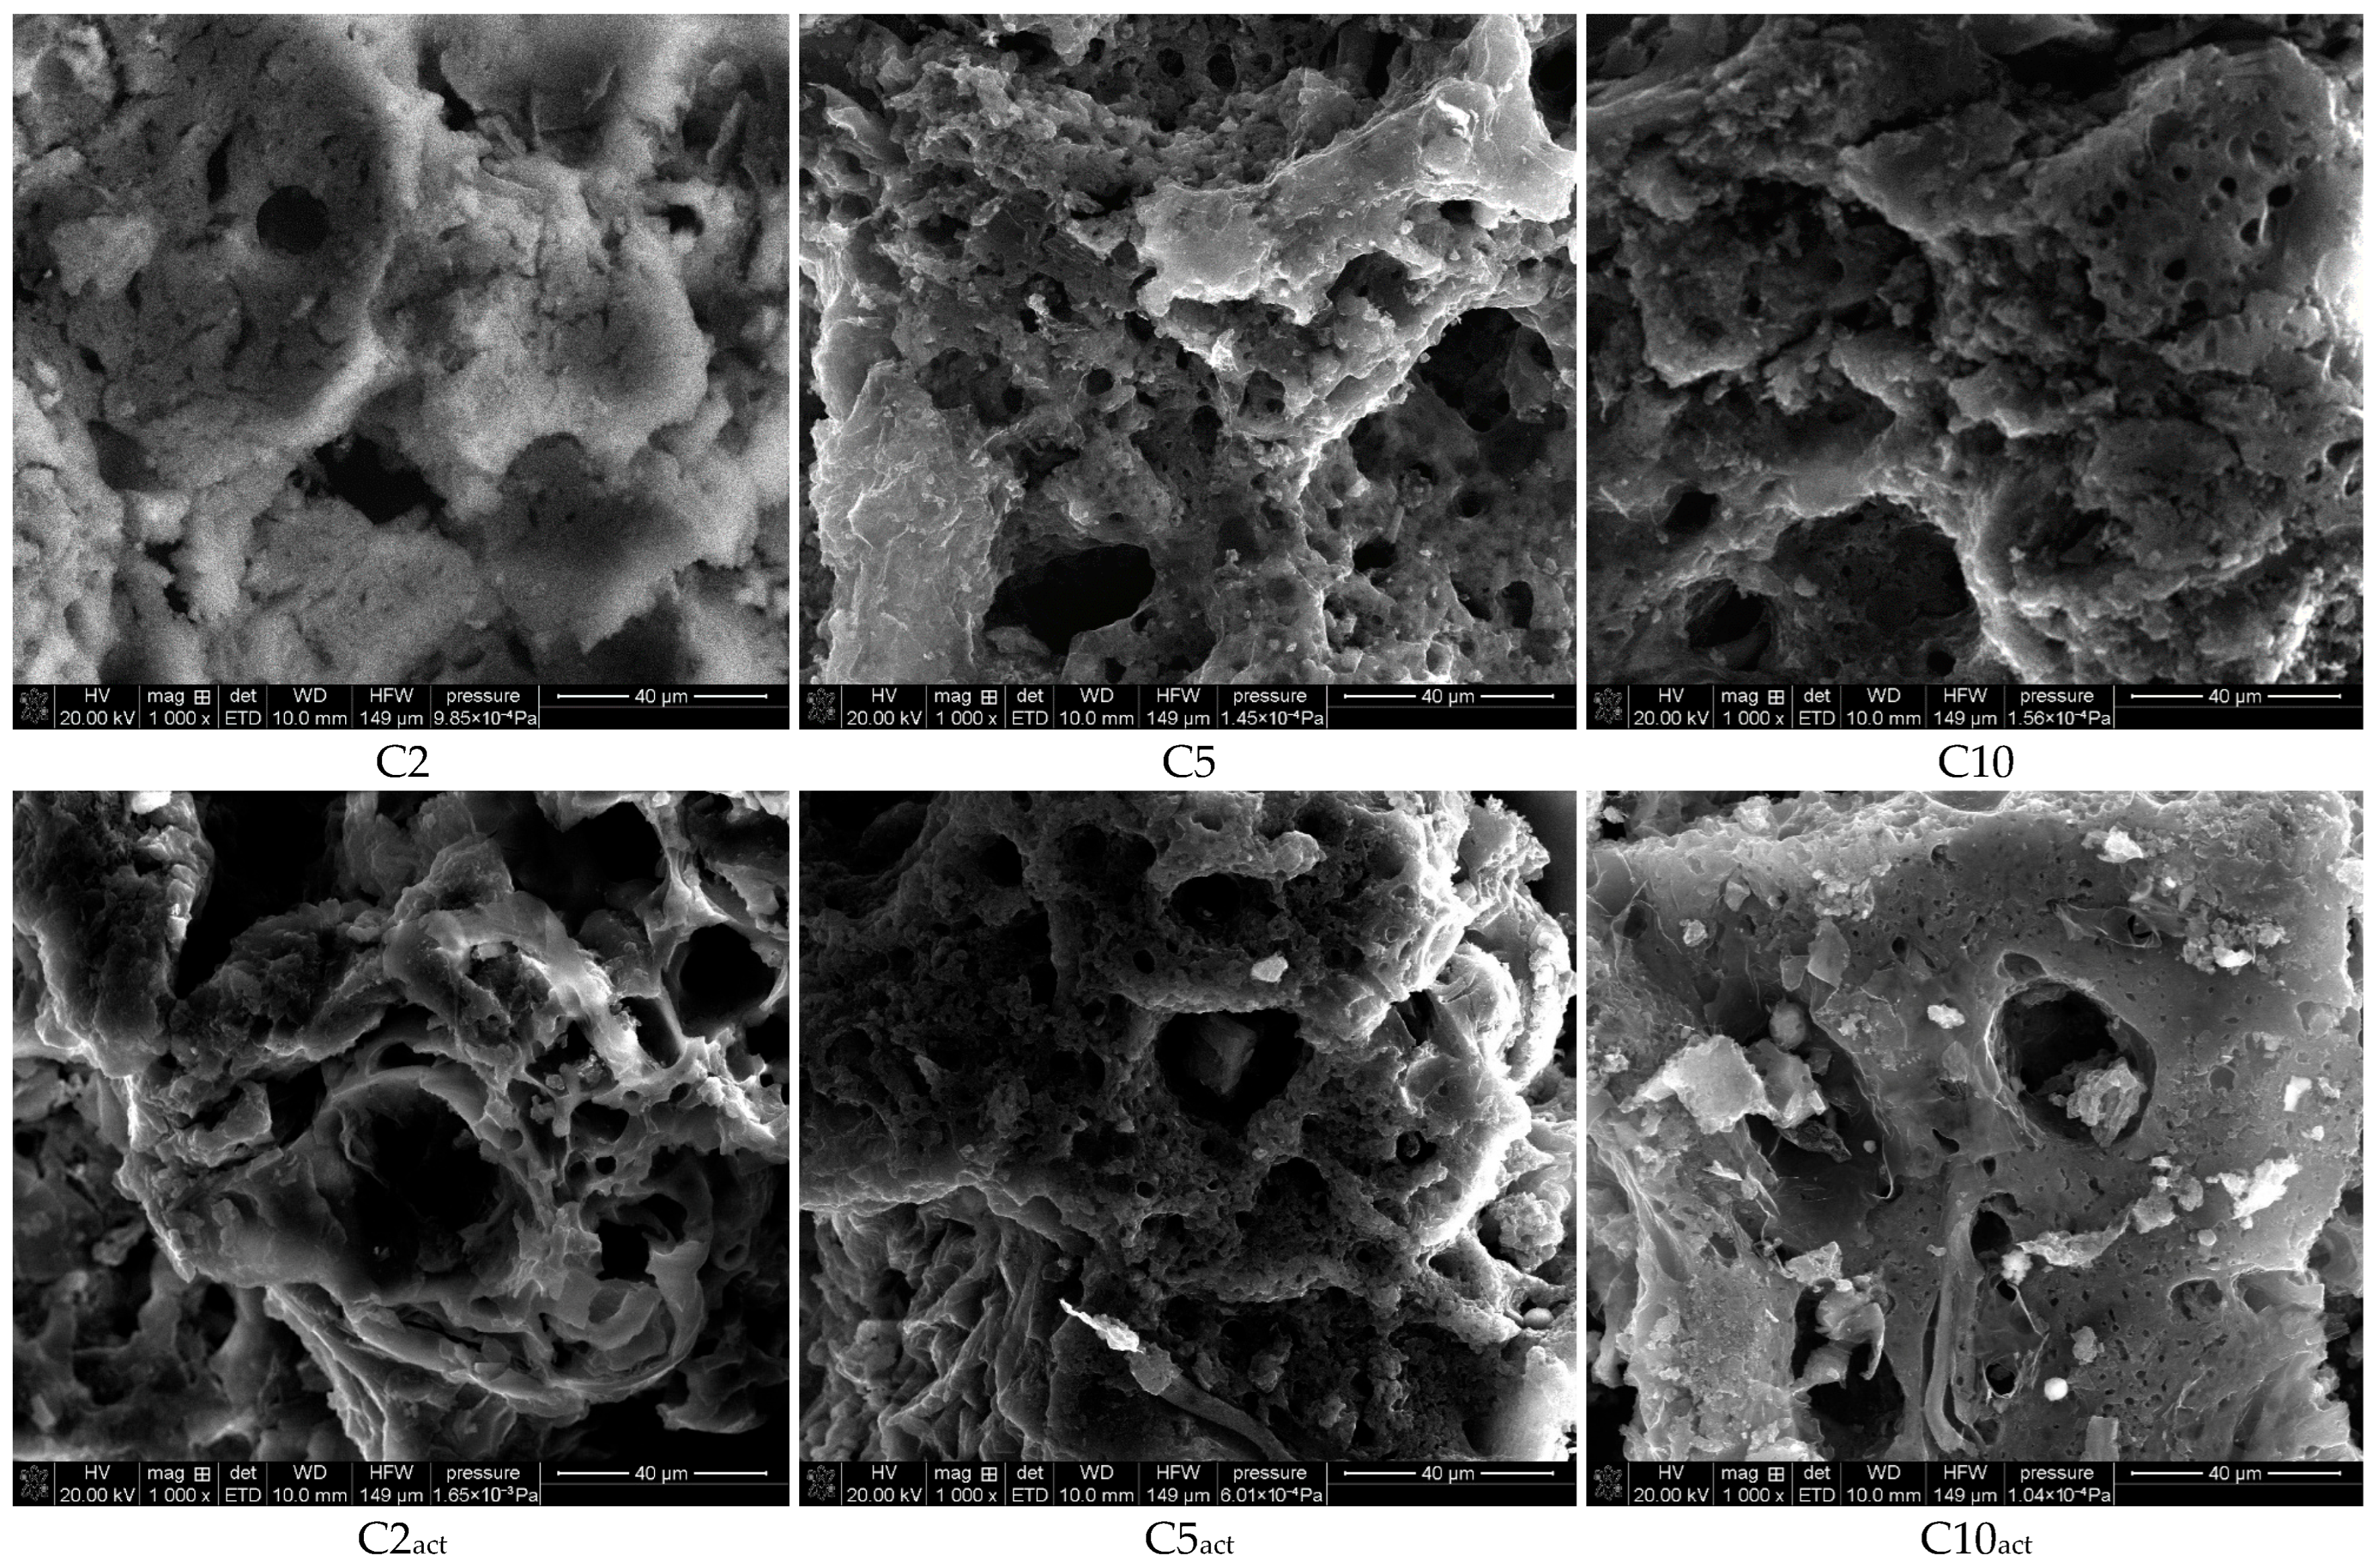
Figure 3 presents the SEM images of the obtained carbons at 1000× magnification. The photographs confirm the developed porous structure of the obtained carbons. Small clusters can be observed on the surface of the samples activated by plasma.
Detailed X-ray photoelectron spectroscopy (XPS) studies were carried out to elucidate their origin. This technique allows also for the tracking of changes in the composition of the resulting carbon sorbents with the increasing microwave irradiation time and subsequent plasma activation.
Surface elemental composition and chemical bonding types present in the coffee-based activated carbons were investigated using the XPS technique. The evolution of the carbon (C 1s), oxygen (O 1s), nitrogen (N 1s), and phosphorus (P 2p) functional groups following phosphoric acid activation, followed by microwave irradiation (2, 5, and 10 min) and subsequent cold plasma treatment, was examined. High-resolution deconvolution of the spectra revealed significant transformations of the surface functional groups.
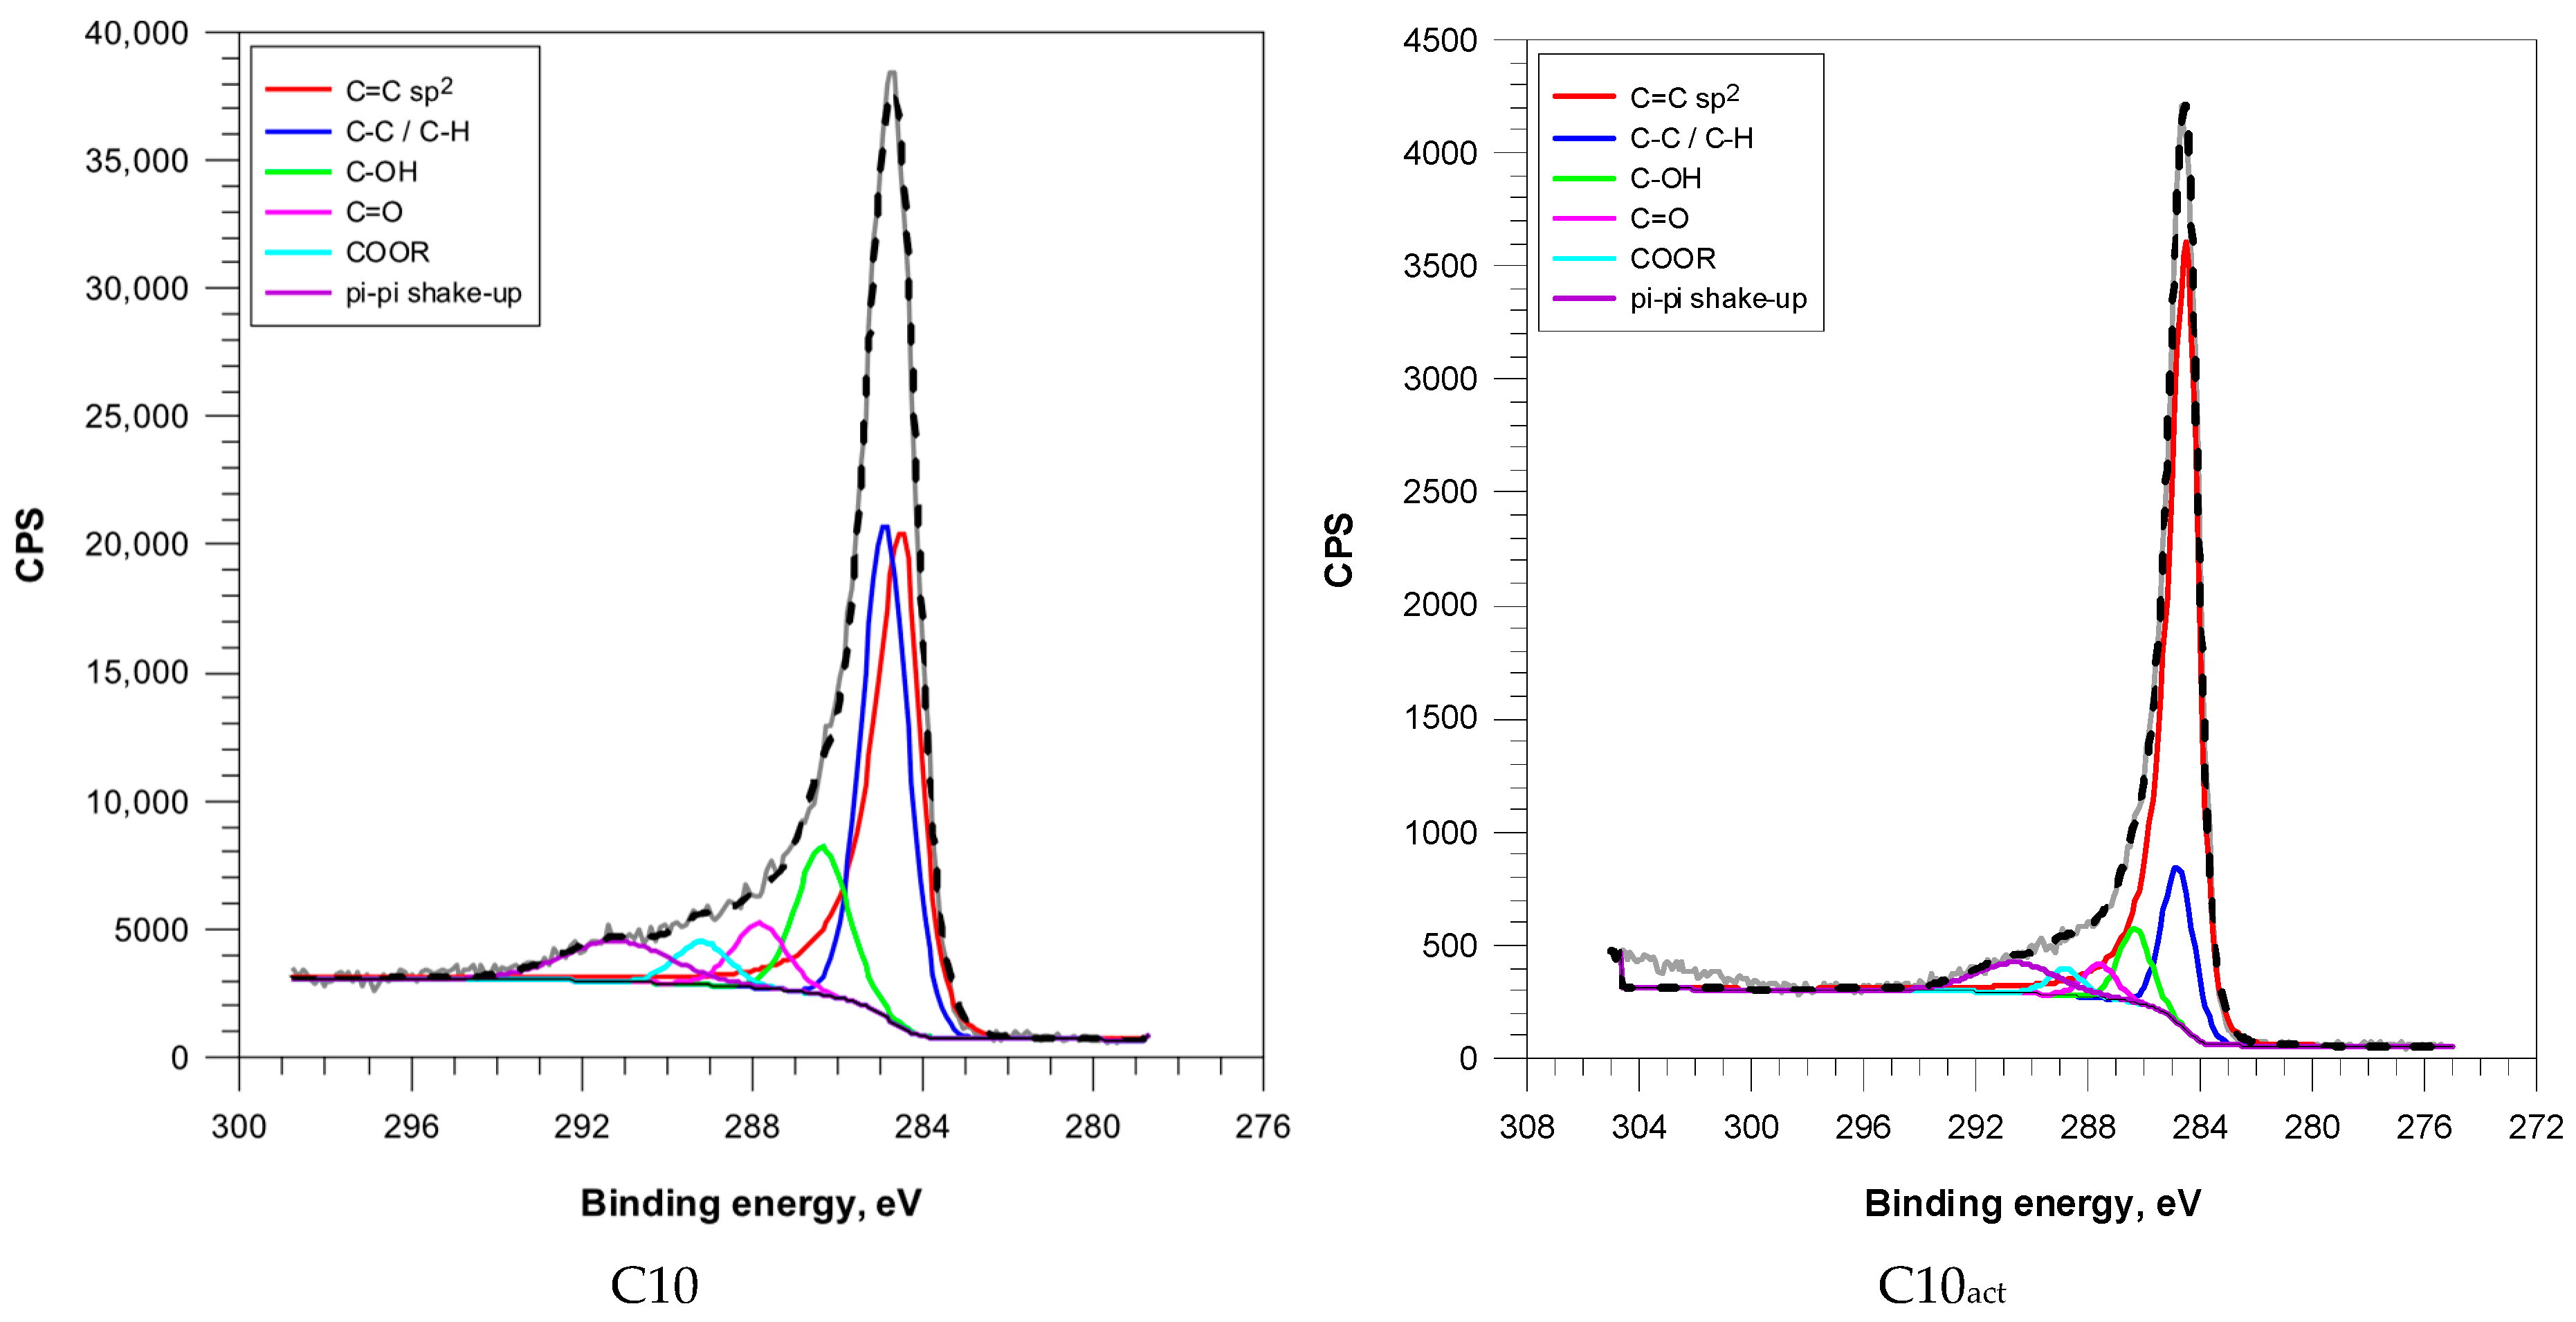
The C 1s peak of the XPS spectra (
Figure 4 and
Figure S1) was deconvoluted into six main components: sp
2-hybridized carbon (C=C), saturated carbon (C–C/C–H), hydroxyl/ether groups (C–OH), carbonyl groups (C=O), carboxyl/ester functionalities (COOR), and π–π* shake-up.
Microwave irradiation induced progressive aromatization of the carbon matrix. The content of sp
2 carbon increased from 41.2% (C2) to 60.2% (C10), suggesting extended formation of graphitic domains (
Table 3).
Cold plasma treatment resulted in a significant increase in sp2-hybridized carbon across all samples, as well as a significant reduction in aliphatic and hydroxyl species. This indicates to efficient removal of disordered carbon and enhancement of graphitic order. Interestingly, C2act retained elevated C=O (11.3%) and moderate C–OH (9.3%) levels, suggesting that plasma treatment of less aromatized surfaces favours the retention or reintroduction of oxygenated groups.
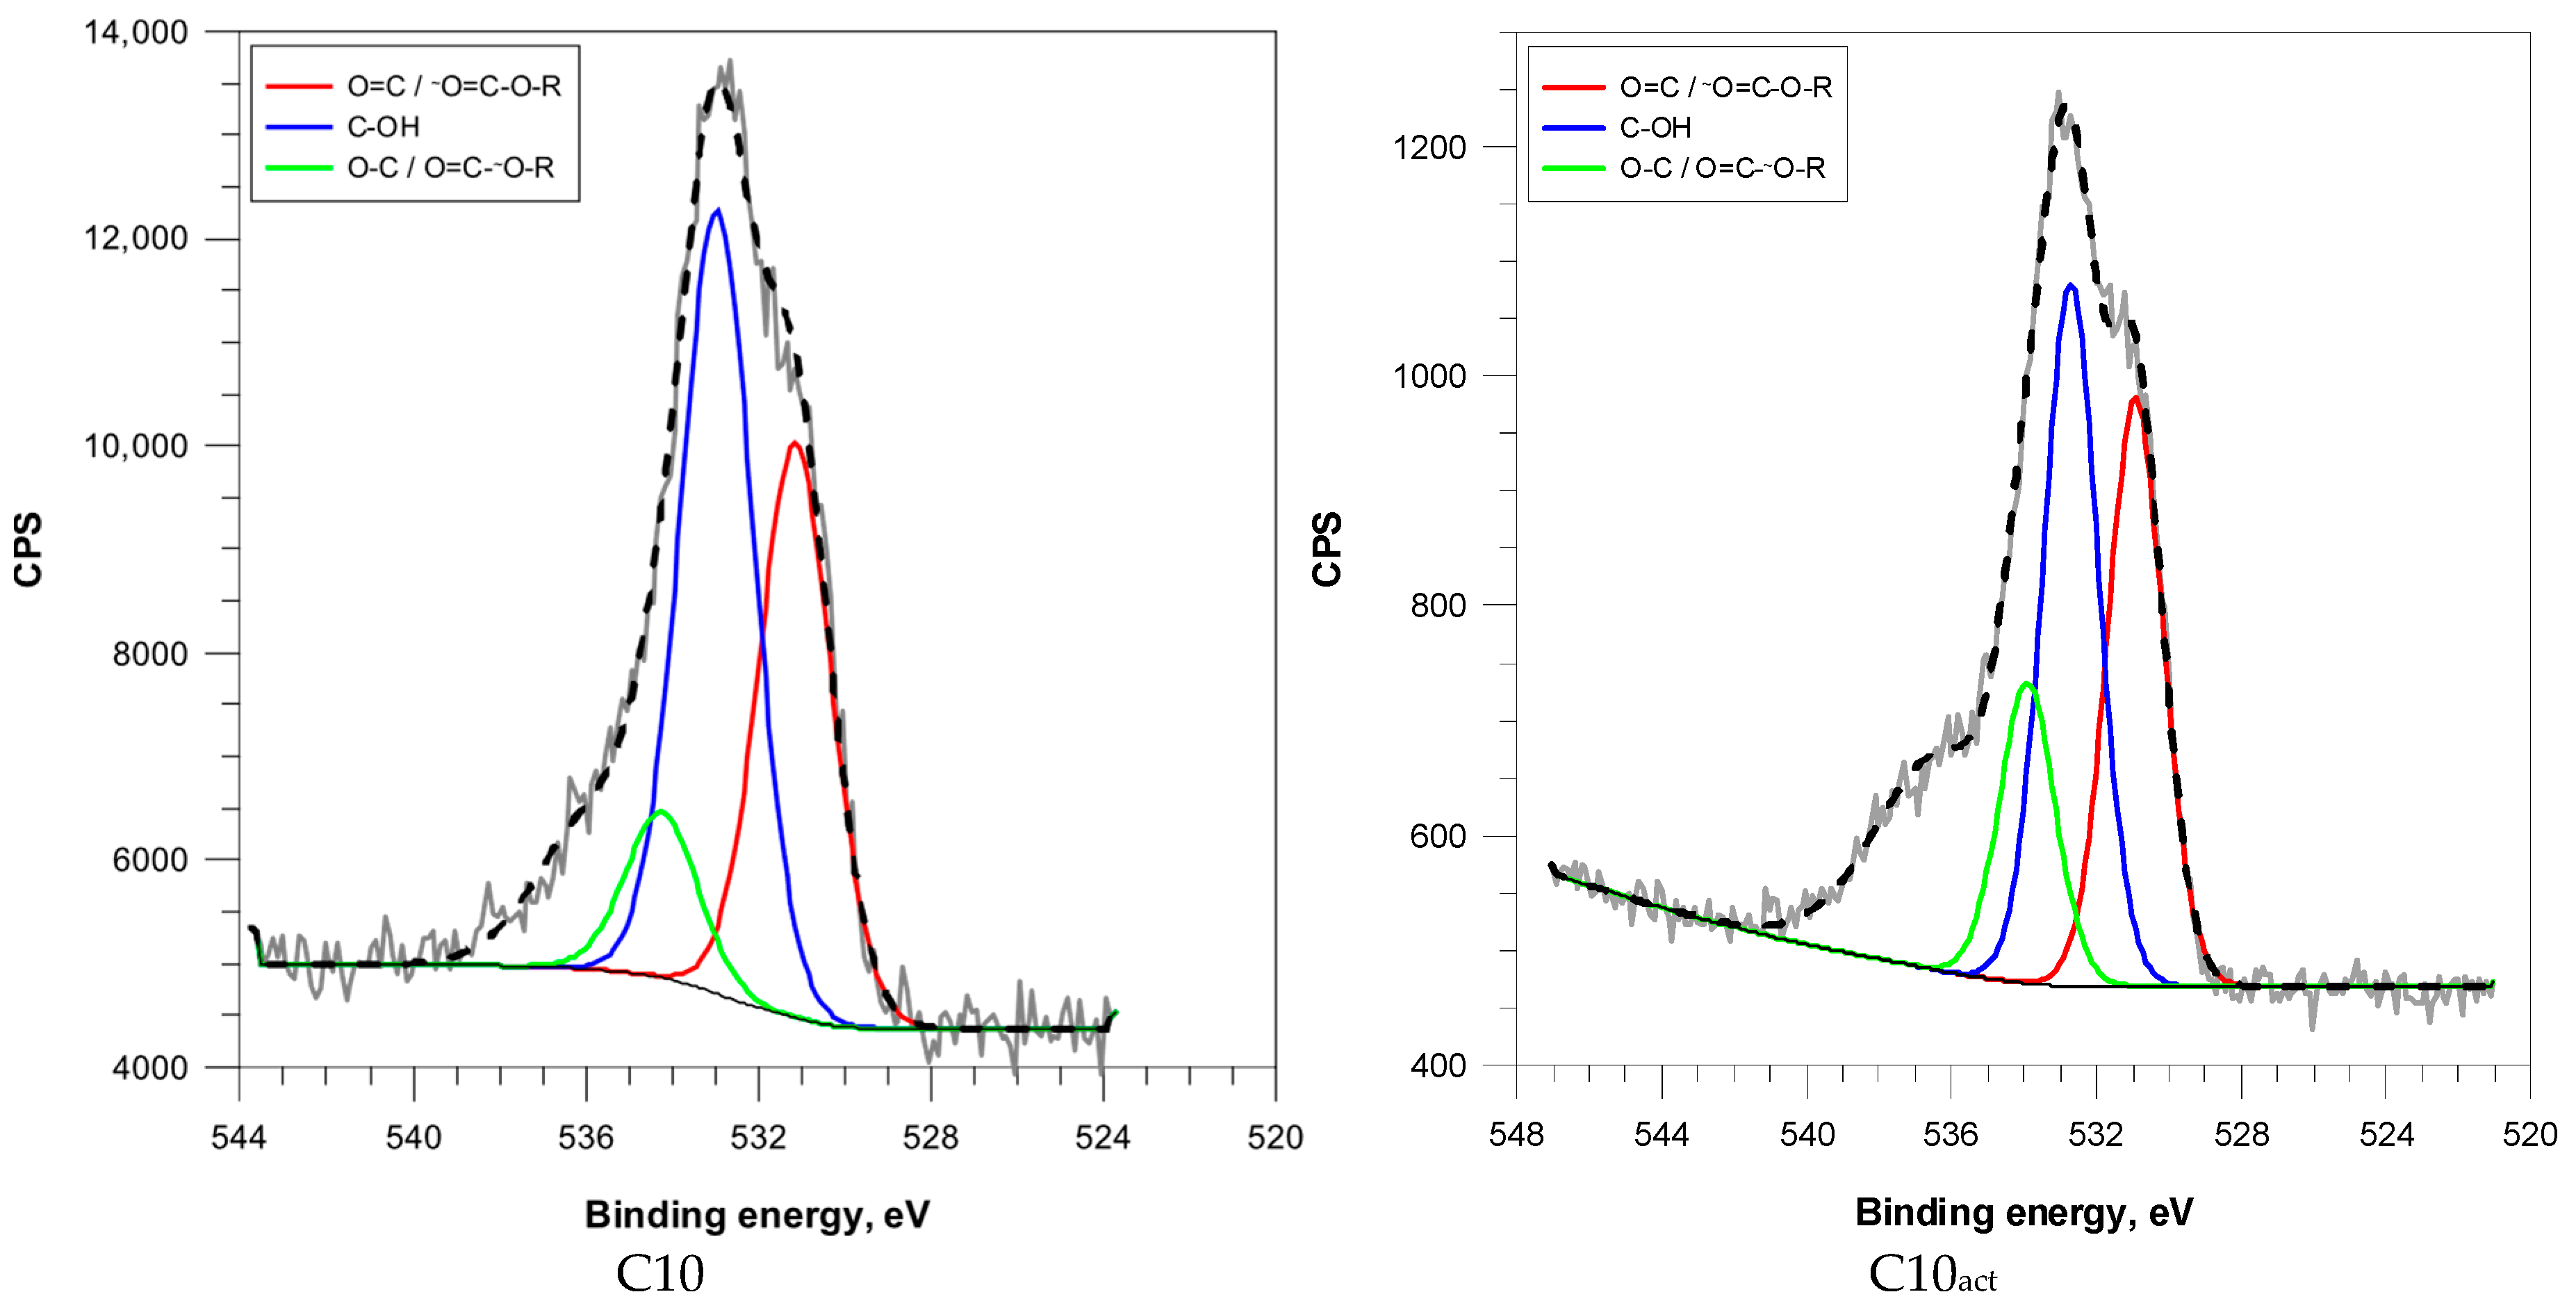
Deconvolution of the O 1s peak spectra identified four types of oxygen functionalities: carbonyl/carboxyl oxygen (O=C/O=C–O–R), hydroxyl groups (C–OH), and ether/phenolic groups (C–O/O–C=O) (
Figure 5).
The increasing microwave duration correlated with a significant enrichment in carbonyl functionalities—from 18.1% in C2 to 38.8% in C10—and a corresponding decline in the hydroxyl content (
Figure 5 and
Figure S2). This trend indicates thermal oxidation and the rearrangement of oxygenated species during the microwave treatment. The decrease in ether/phenolic oxygen indicates further decomposition of labile oxygen functionalities for both activated and nonactivated samples. Comparing the concentrations of oxygen functional groups in samples before and after plasma activation, an increase can be observed. Similar observations regarding the increase in the presence of these functional groups in carbon exposed to non-thermal plasma were made by Zhang et al. [
27].
C2
act exhibited a large ether/phenolic content (30.5%) and moderate carbonyl content (20.4%), suggesting effective oxidative functionalization of a less graphitized surface. C5
act and C10
act showed elevated carbonyl contents (32.1% and 42.0%, respectively), probably due to selective oxidation of sp
2-rich domains. (
Table 4).
According to
Figure 6 and
Figure S3, the N 1s peak spectra revealed five distinct nitrogen species: pyridinic N, pyrrolic N, graphitic (quaternary) N, amines/amides, and oxidized nitrogen (N–O).
In the samples treated solely by microwave irradiation, a progressive transformation of amines/amides (from 57.3% in C2 to 36.2% in C10) into pyridinic and graphitic nitrogen species was evident (
Table 5). This indicates the increasing incorporation of nitrogen into aromatic structures through cyclization, enhancing nitrogen stability.
C2act exhibited the largest concentration of pyrrolic N (38.1%) and a significant concentration of quaternary N (22.6%) as well as a significant reduction in amines/amides (15.3%), suggesting strong plasma dehydrogenation and nitrogen heterocycle formation. C5act and C10act retained a balanced distribution of pyridinic, pyrrolic, and graphitic nitrogen, reflecting a gradual transformation due to their aromatized nature.
Pharmaceuticals are increasingly recognized as emerging contaminants in water resources. A wide range of treatment strategies have been investigated to remove them, including conventional methods such as biodegradation, adsorption, and activated sludge as well as advanced techniques like membranes, microfiltration, and ozonation [
28]. Among these, activated carbon has proved particularly effective for antibiotic removal due to its large specific surface area, large porosity, and favourable pore size distribution [
29].
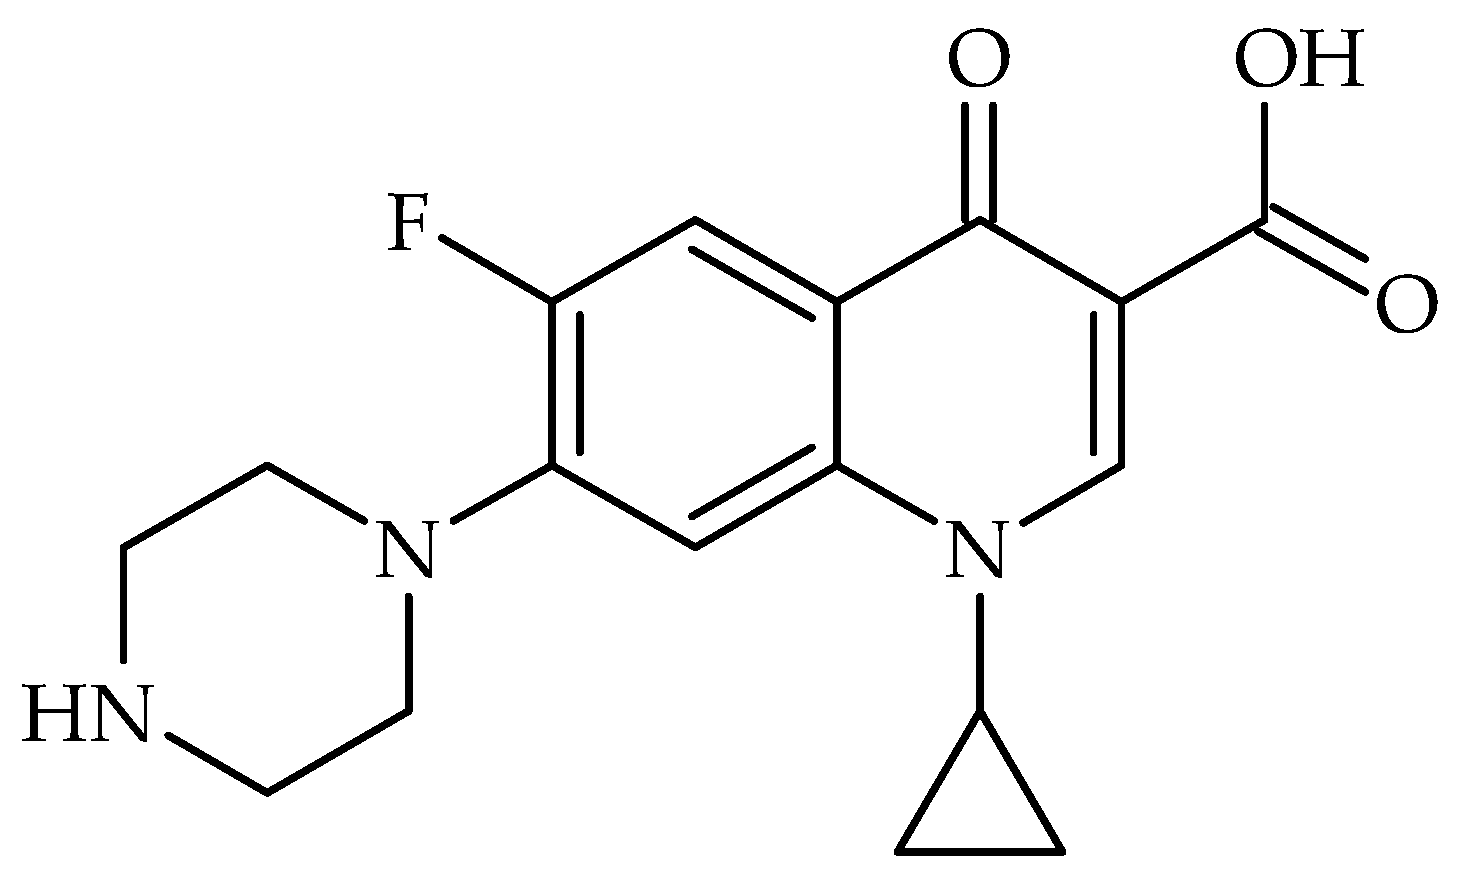
All the studied carbons were used in purification water investigations. As a test compound—antibiotic ciprofloxacin was chosen (
Figure 7). According to Balarak et al., the ciprofloxacin molecule has the following dimensions: length—1.31 nm; width—0.82 nm; and height—0.25 nm [
30].
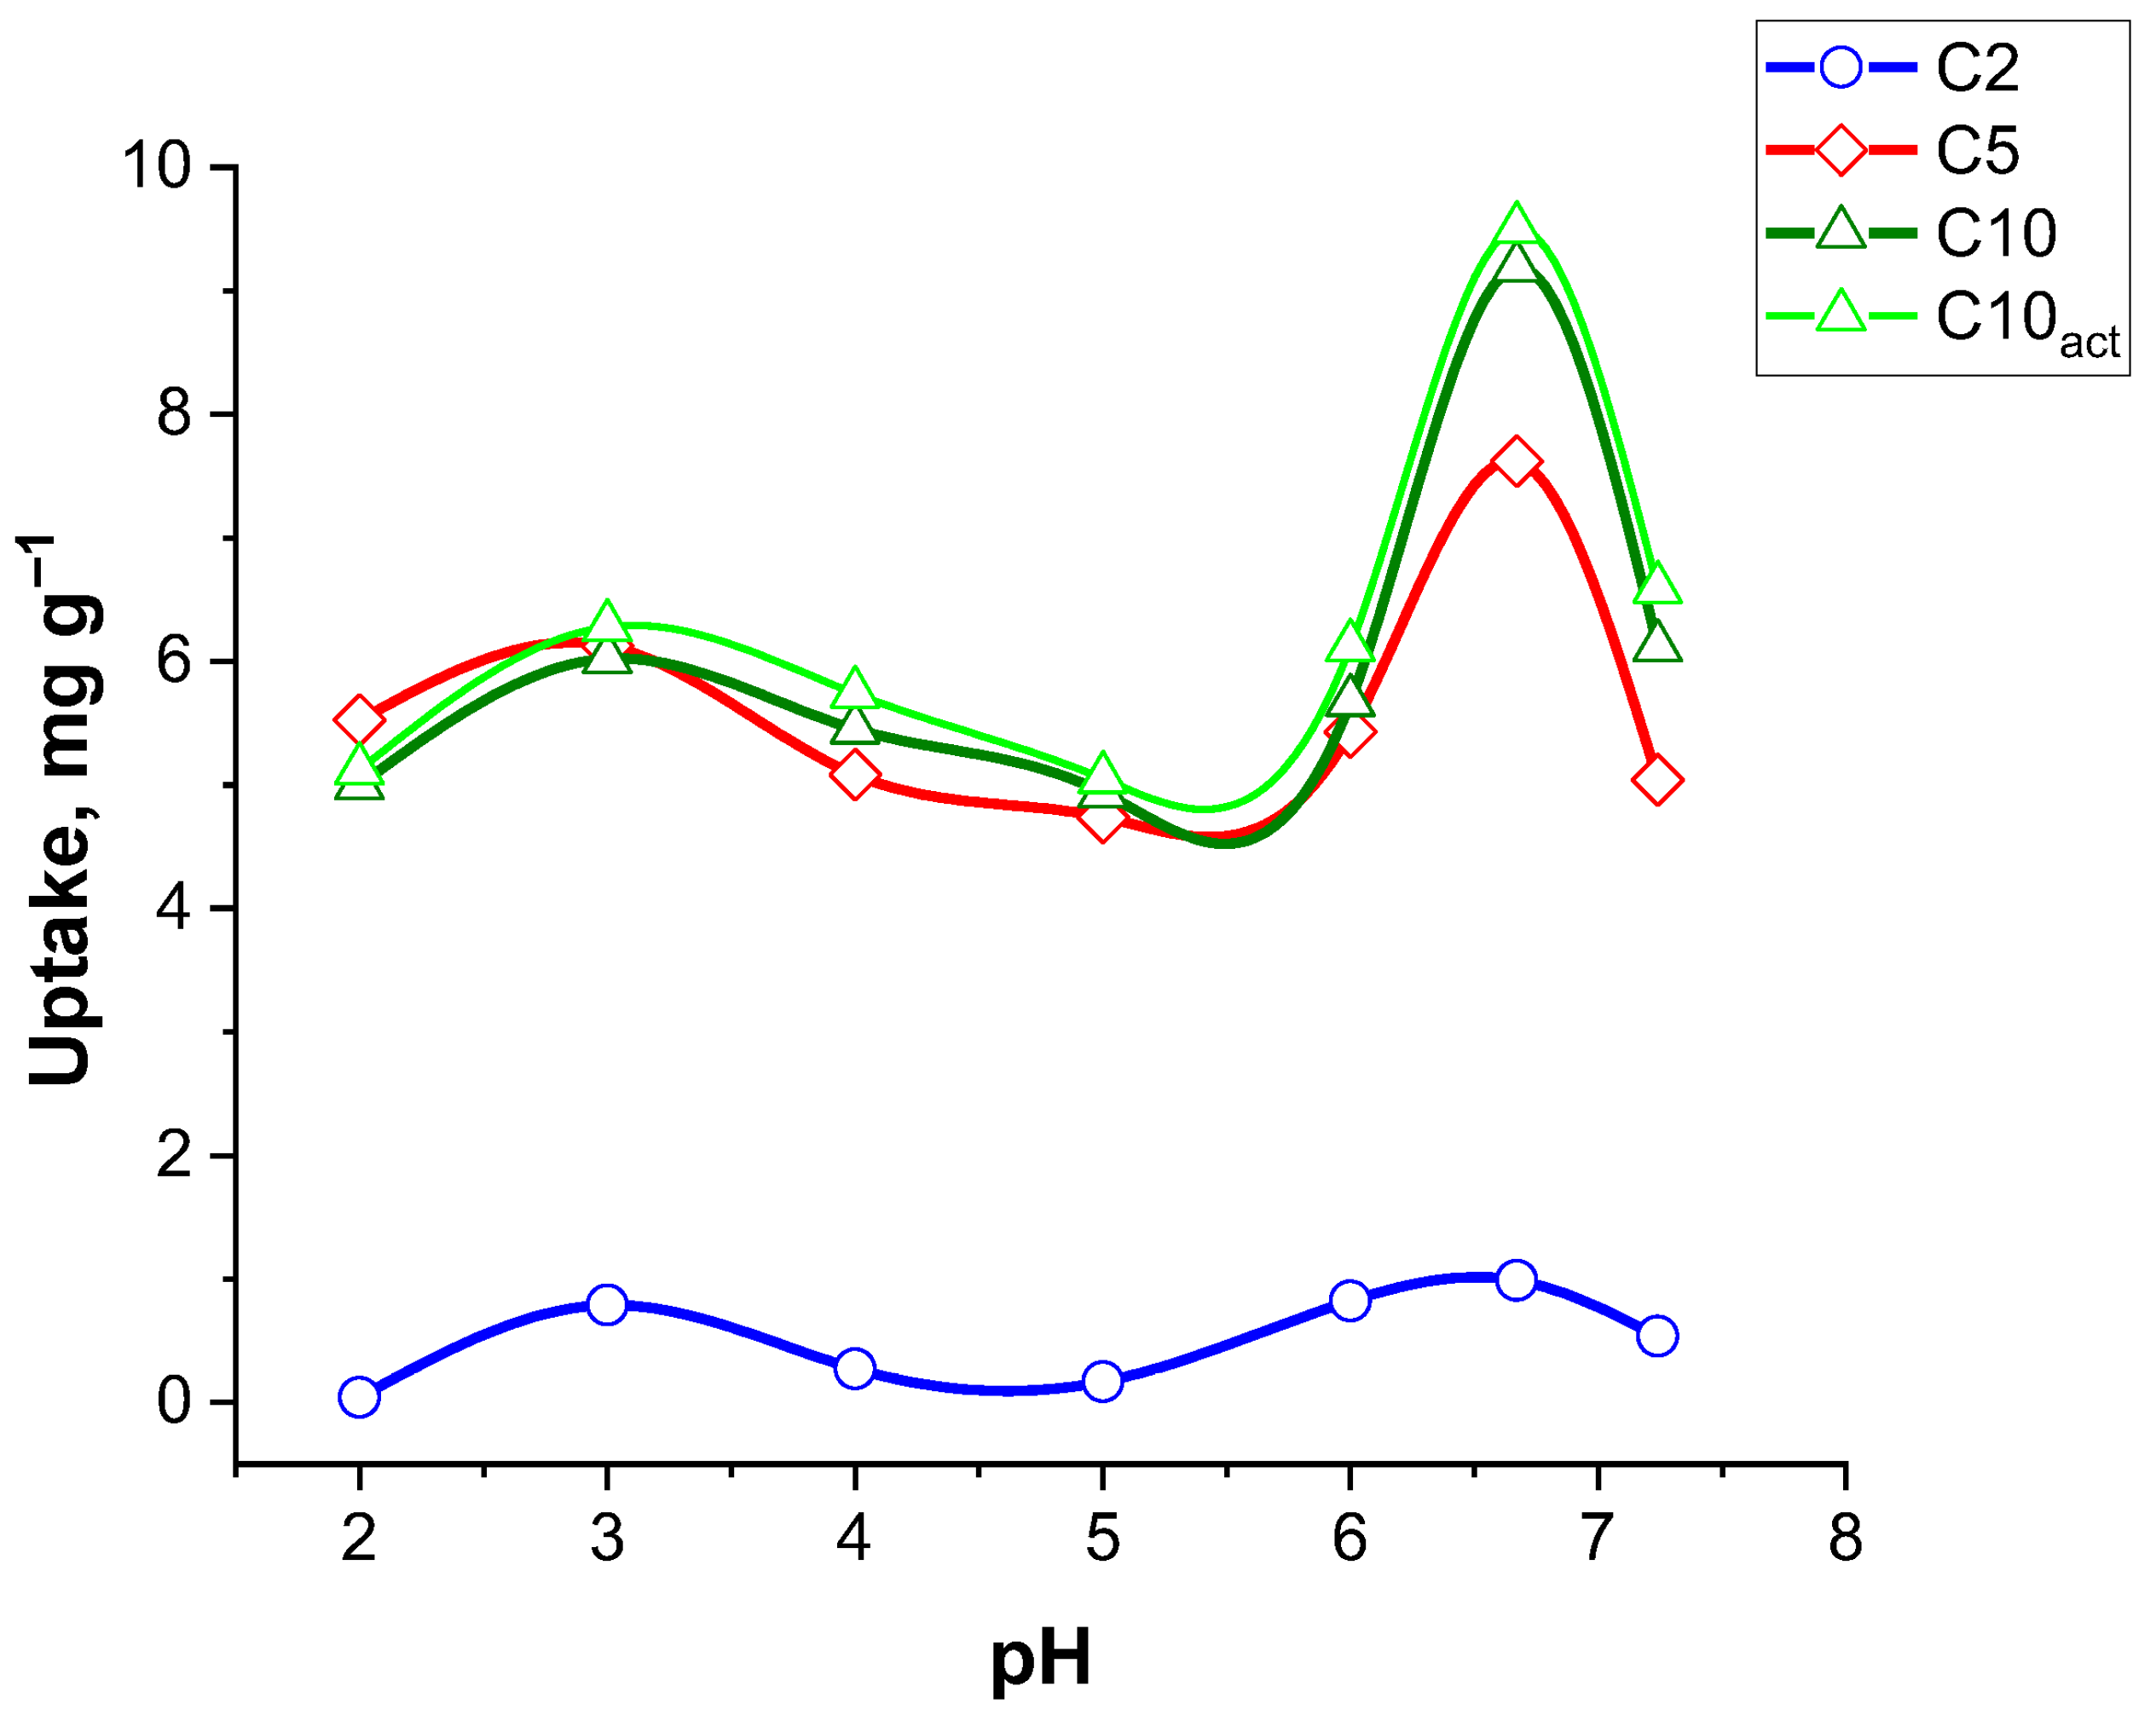
As a first step, we assessed how solution pH governs ciprofloxacin (CF) adsorption on the carbon adsorbents.
Figure 8 illustrates the effect of pH on the adsorption capacity of CF for three different adsorbent samples: C2, C5, C10, and C10
act. The uptake capacity is measured in mg g
−1 across a pH range of 2 to 7.5.
Samples C5, C10, and C10act exhibit significantly greater adsorption capacities compared to C2 across the entire pH range, with C10act showing the highest uptake overall. C5, C10, and C10act display relatively stable adsorption from pH 2 to around pH 6, with the uptake values ranging from approximately 5 to 6 mg g−1. A sharp increase in adsorption is observed as the pH approaches neutral (pH ~7), where C10act reaches a maximum uptake of ~9.5 mg g−1, while C5 peaks slightly lower at ~7 mg g−1.
This pH-dependent behaviour suggests that adsorption is more favourable at near-neutral pH, likely due to the deprotonation of functional groups on the adsorbent surface which enhances interactions with the ciprofloxacin molecules, a trend that has also been reported in previous studies [
31,
32]. Additionally, the increase can correspond to a reduction in competition between hydrogen ions and CF for active groups (see ciprofloxacin structure
Figure 7).
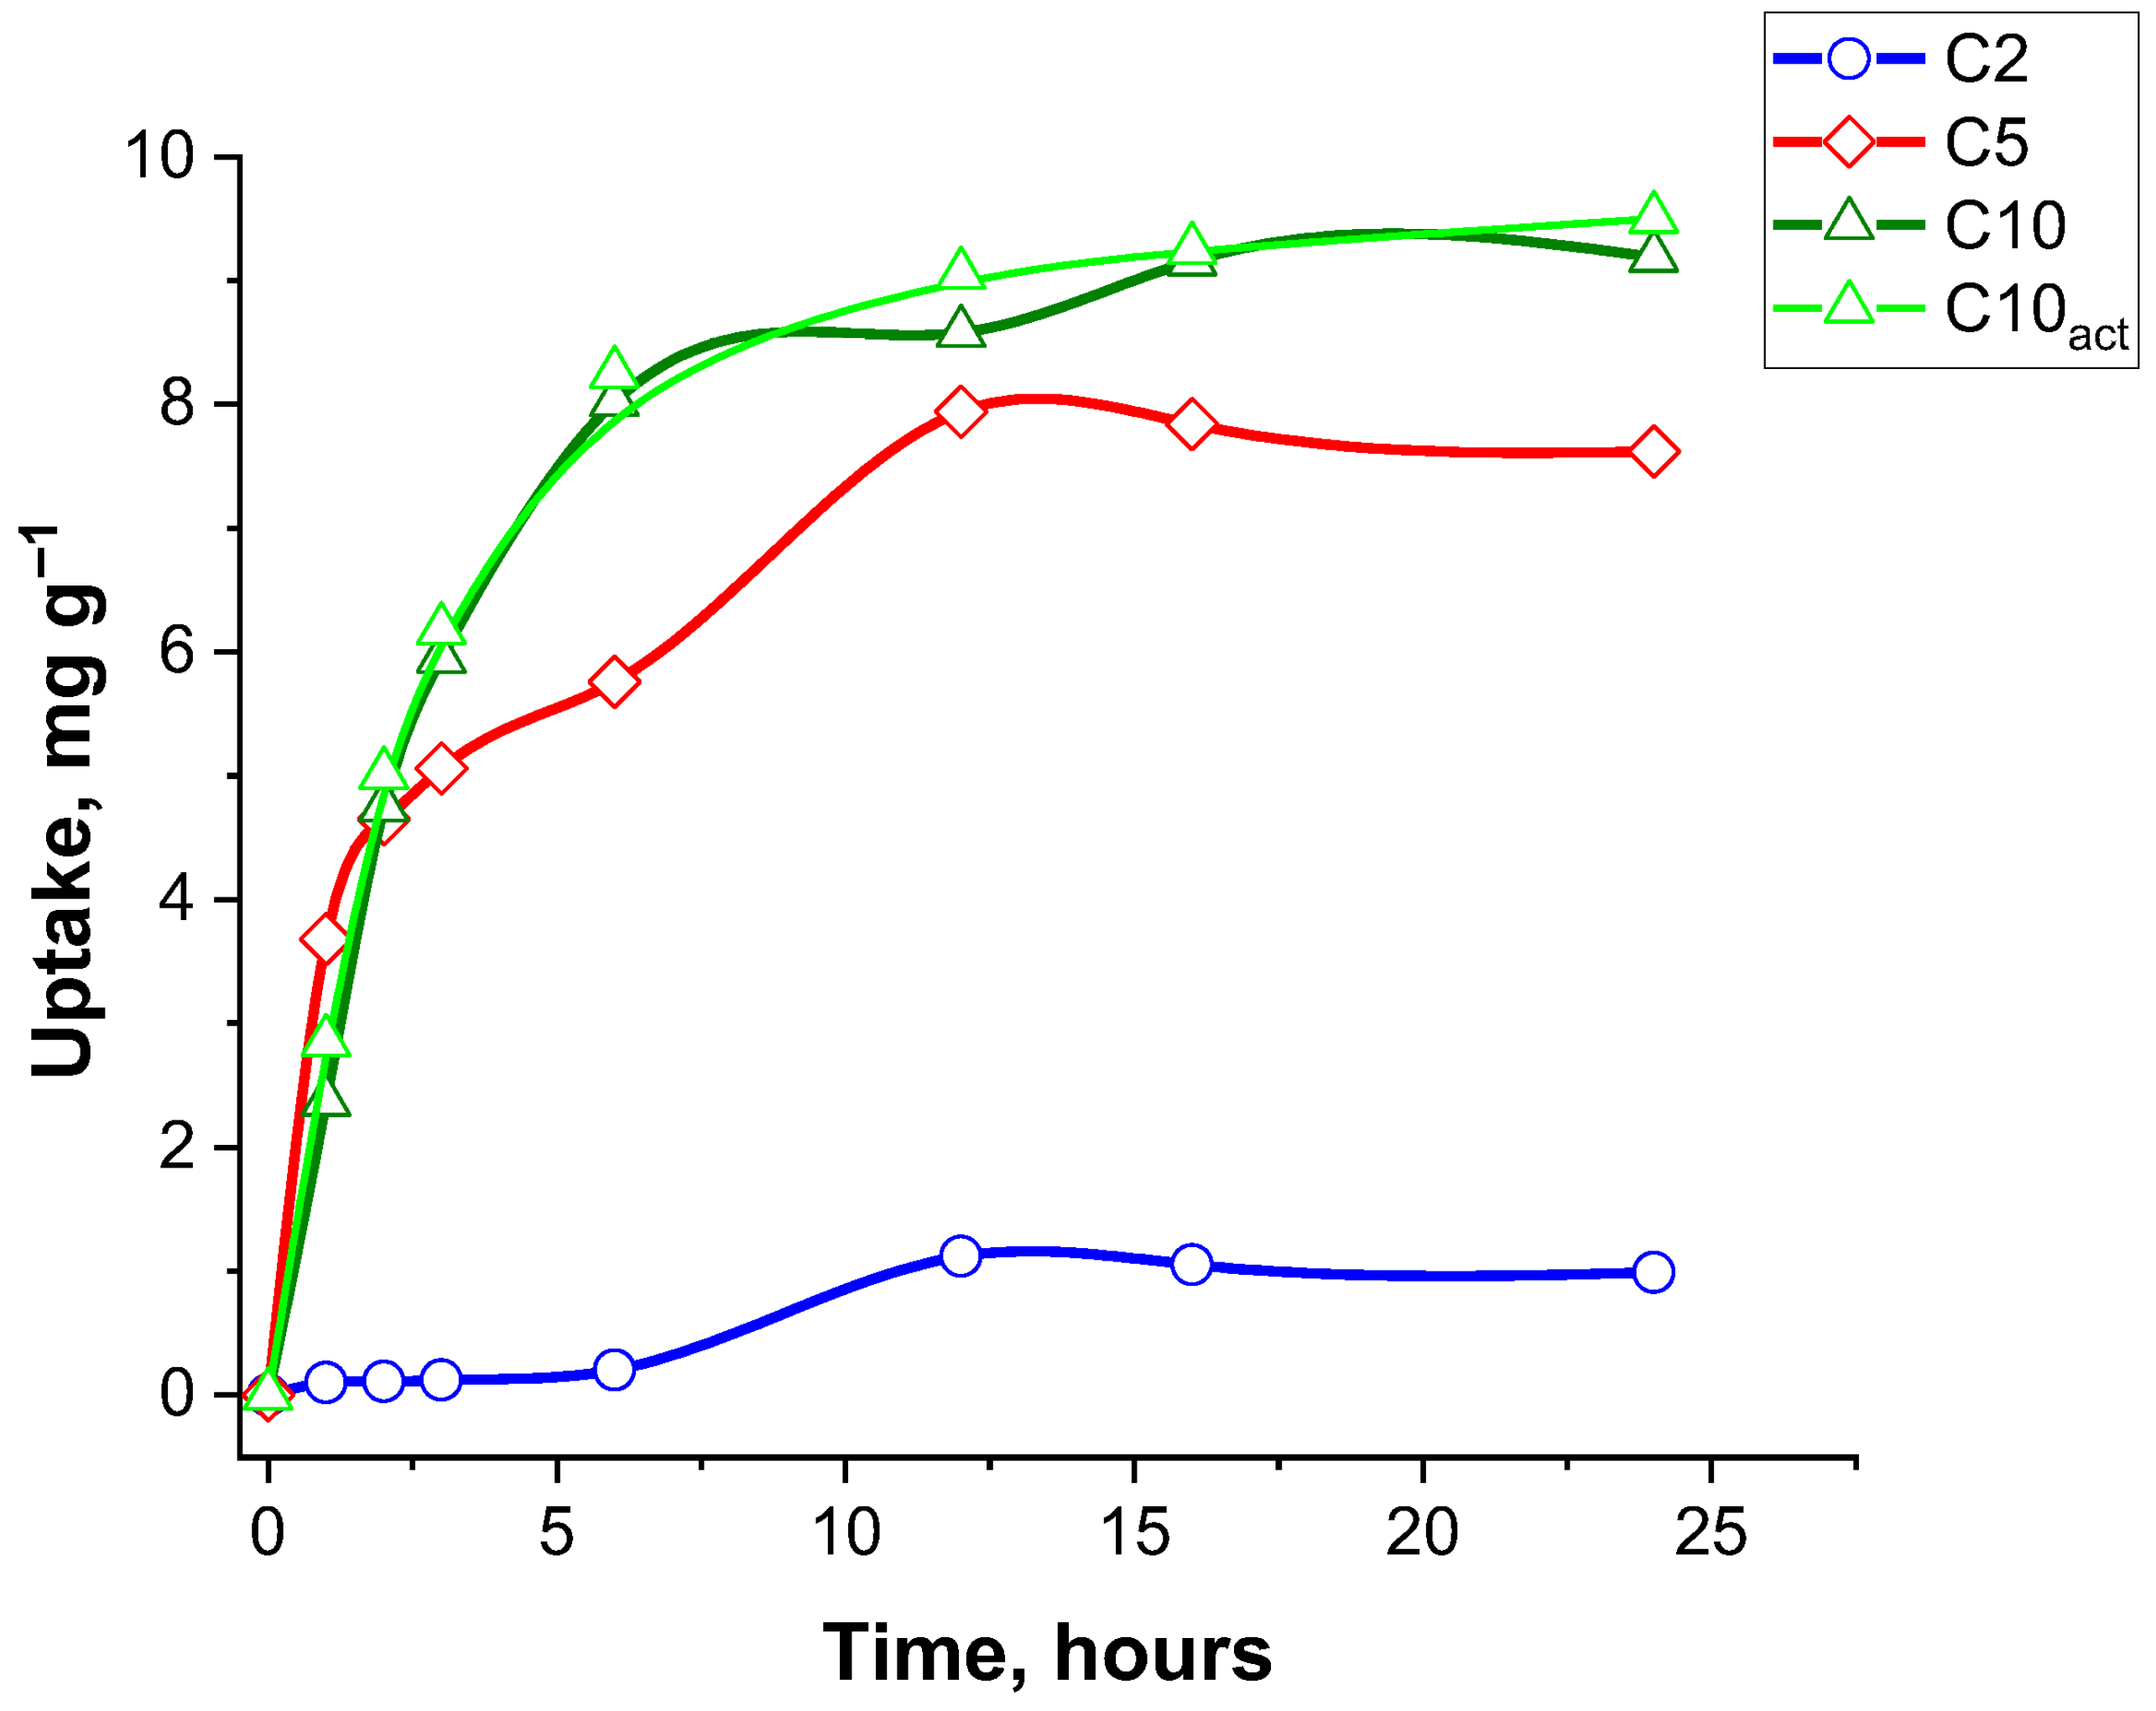
Figure 9 presents the adsorption kinetics of ciprofloxacin by four adsorbent samples—C2, C5, C10, and C10
act—over a 24 h period. Adsorption capacity (mg g
−1) is plotted against the contact time (hours), providing insight into the rate and extent of CF uptake by each carbon material.
Samples C10 and C10act exhibit the largest adsorption capacity among all samples, reaching a plateau of approximately 9.5 mg g−1. The uptake increases rapidly during the first 3 h, indicating a high initial adsorption rate due to the abundance of available active groups. After about 6 h, the curve begins to stabilize, suggesting that equilibrium is reached between 12 and 15 h. This rapid and high-capacity adsorption can be attributed not only to the specific surface area and well-developed porous structure of the material, which promote efficient diffusion and accessibility of active sites for ciprofloxacin molecules, but also to the presence of surface functional groups. These groups facilitate specific interactions, such as hydrogen bonding and electrostatic attraction, enhancing the affinity between the adsorbent and the antibiotic. Moreover, the activation process may increase the availability or reactivity of these functional groups, strengthening their ability to form hydrogen bonds and thus further contributing to the overall adsorption performance.
The C5 adsorbent shows a similar kinetic trend, though with a slightly smaller adsorption capacity, peaking around 7.5 mg g−1.
In contrast, the carbon sample C2 demonstrates a very small uptake capacity, reaching only about 1 mg g−1 after 24 h. The adsorption process is also significantly slower, with only marginal increases in uptake over time.
Table 6 presents the kinetic parameters for the adsorption of CF (ciprofloxacin) onto the samples C2, C5, C10, and C10
act, derived from both pseudo-first-order and pseudo-second-order kinetic (PSO) models. The experimental adsorption capacities (q
e (exp)) ranged from 1.12 to 9.50 mg g
−1, increasing for the samples C2 to C10
act. For the pseudo-first-order model, the calculated equilibrium adsorption capacities (q
e (cal)) deviated significantly from the experimental values, and the coefficients of determination (R
2) were relatively small (0.047–0.867), indicating the poor fit of the model.
In contrast, the pseudo-second-order model provided much better agreement with the experimental data. The qe (cal) values closely matched the qe (exp), and high R2 values (0.994–0.998) were observed across all samples. Notably, the rate constant k2 was the highest for the sample C10act (0.251 g mg−1 h−1), indicating a faster sorption process at lower adsorption capacity. Overall, the pseudo-second-order model more accurately represents the kinetic behaviour of ciprofloxacin adsorption onto the tested materials. This agreement indicates a surface-reaction-controlled process; adsorption rates are governed by the availability of active sites and specific interactions between CF and carbon surface groups (electrostatic complexation/H-bonding and possible π–π* interactions), rather than by intraparticle diffusion alone. The observed PSO kinetics indicate a chemisorption-like, site-limited uptake, in which adsorption rates are governed by surface functionality and the pH-dependent speciation of CF.
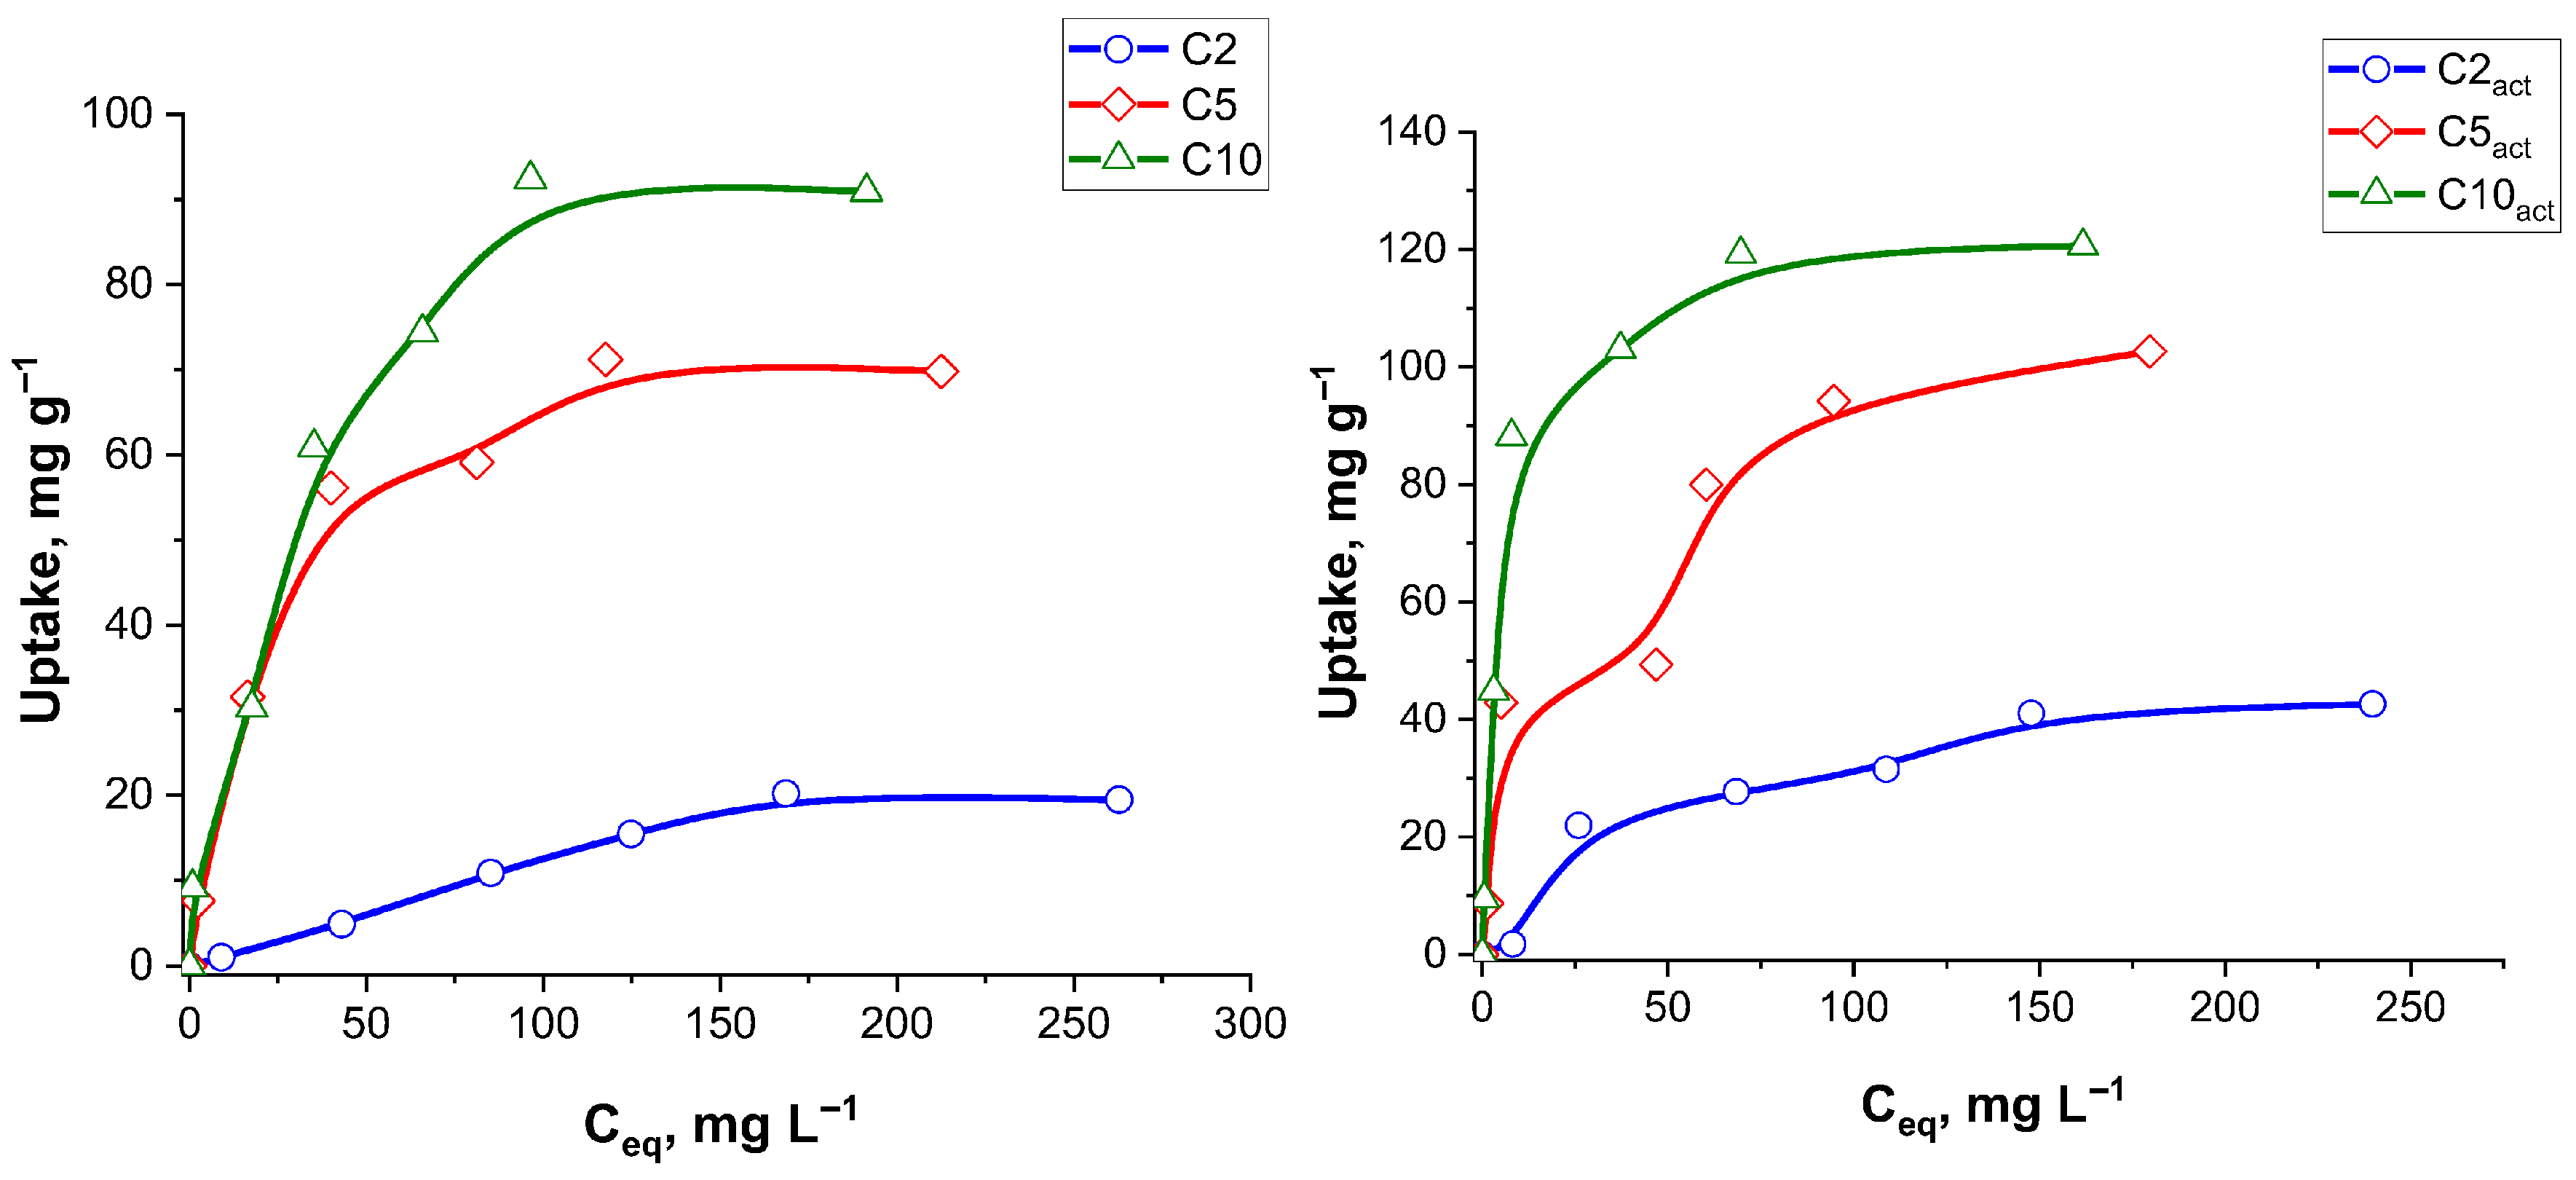
Isotherms of ciprofloxacin adsorption on the initial and plasma-activated carbon samples are presented in
Figure 10.
Table 7 summarizes the adsorption isotherm parameters for ciprofloxacin onto various adsorbent samples, evaluated using both the Langmuir and Freundlich models. The maximum monolayer adsorption capacities (q
max) estimated from the Langmuir model ranged from 30.3 to 138.9 mg g
−1, increasing with sample activation and suggesting enhanced surface area or active groups accessibility upon plasma treatment. The Langmuir model demonstrated excellent fitting for all samples, with the R
2 values exceeding 0.994 in most cases, indicating that monolayer adsorption on a homogenous surface is a dominant mechanism.
The Freundlich model also yielded reasonable fits, particularly for C2 (R2 = 0.972) and C5act (R2 = 0.977), though in general, the R2 values were smaller than those of the Langmuir model. The Freundlich constants 1/n ranged from 0.45 to 1.01, indicating favourable adsorption across all samples (0 < 1/n < 1), with C2act exhibiting a nearly linear sorption process (1/n = 1.01). The Freundlich adsorption capacity parameter (KF) peaked for C10act at 18.35 mg g−1, consistent with its high qmax in the Langmuir model.
Overall, the data indicate that the Langmuir model provides a better representation of the adsorption process for ciprofloxacin, particularly after the sample treatment with plasma, highlighting the role of monolayer adsorption on the well-defined active sites. Importantly, the good fit of both the Langmuir and Freundlich models indicates that the adsorption process is complex, involving both monolayer adsorption on uniform sites and multilayer adsorption on heterogeneous surfaces. This dual compatibility suggests that ciprofloxacin interacts with the carbon surface through multiple mechanisms, including specific binding to active sites and non-specific interactions across varied surface regions. To assess the adsorption performance of C10
act for ciprofloxacin removal, its maximum adsorption capacity was compared with that of previously reported adsorbents. A summary of the comparative data is provided in
Table 8.
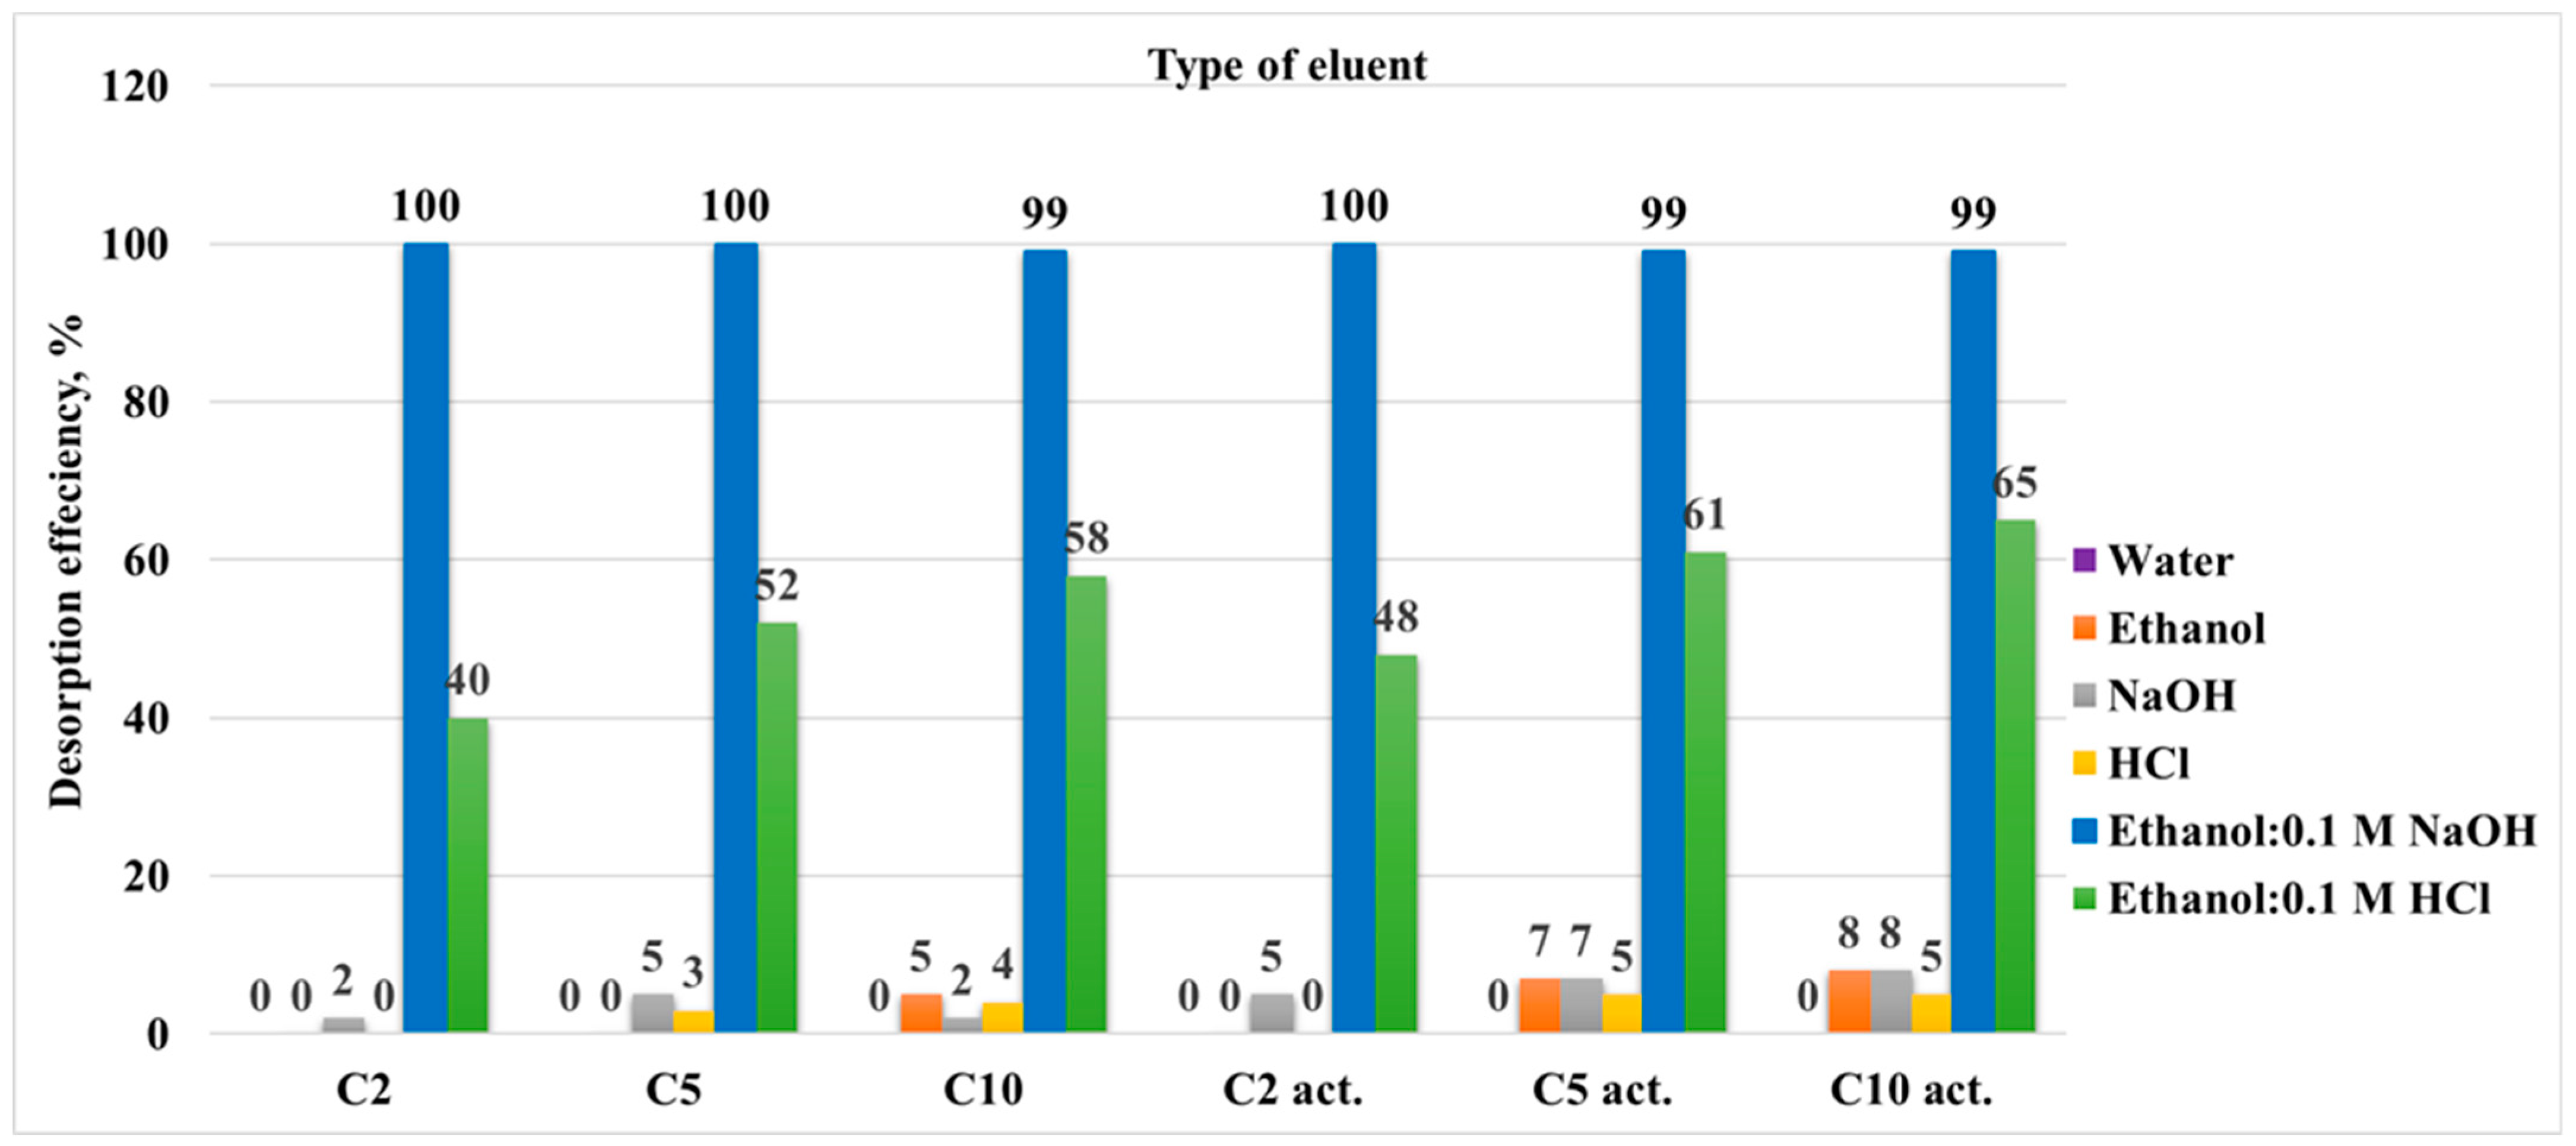
Desorption studies are essential to evaluate the reusability of the adsorbent and to understand the strength and reversibility of the adsorbate-adsorbent interactions. The desorption results for each sample, depending on the eluent used in the first desorption cycle, are presented as a bar chart in
Figure 11. The data show that, regardless of the sample, the desorption behaviour for each eluent is consistent with the ethanol–alkali mixture (70:30) EtOH: 0.1 M NaOH showing the largest desorption efficiency.
This observation is not unexpected and supports the proposed adsorption mechanism. Since ciprofloxacin hydrochloride was adsorbed onto the sample surface, and the adsorption probably involved both hydrophobic and electrostatic interactions, the desorption process is most effective when using ethanol (disrupting hydrophobic interactions) and alkali (disrupting electrostatic interactions).
For testing the eluents and comparing the samples, all samples were used in this procedure. However, only the sample C10act that exhibited the best adsorption activity was used to study 10 adsorption–desorption cycles under the selected optimal conditions (adsorption from the aqueous solution, desorption using the ethanol–alkali mixture).
Figure 12 illustrates the cyclic adsorption and desorption efficiencies of CF onto the plasma-activated C10
act sample over ten consecutive regeneration cycles. The initial cycles (1–4) demonstrate nearly complete adsorption (100%) and desorption (99%) efficiencies, indicating the excellent regeneration performance and chemical stability of the adsorbent. This effective performance suggests that the C10
act remains largely unaffected in the early reuse stages.
However, a gradual decline in both adsorption and desorption efficiencies began at cycle 5. By cycle 6, adsorption had decreased to 97% and desorption to 92%, indicating the onset of slight degradation of active sites or incomplete desorption of ciprofloxacin. The decrease became pronounced from cycles 7 to 10, with adsorption dropping from 95% to 45% and desorption from 91% to 42% [
41]. Regeneration was performed with a NaOH/ethanol mixture. As reported for organic pollutants, alkaline desorbents typically outperform acidic ones due to electrostatic repulsion at elevated pH and generally cause minimal surface damage; nevertheless, the sharp deterioration beyond cycle 8 is best explained by progressive alteration/depletion of plasma-generated surface functional groups (e.g., carboxyl and amino) and partial pore blockage by residual organics not fully removed by NaOH/ethanol (ethanol disrupts hydrophobic and hydrogen bond interactions but may not eliminate strongly bound species).
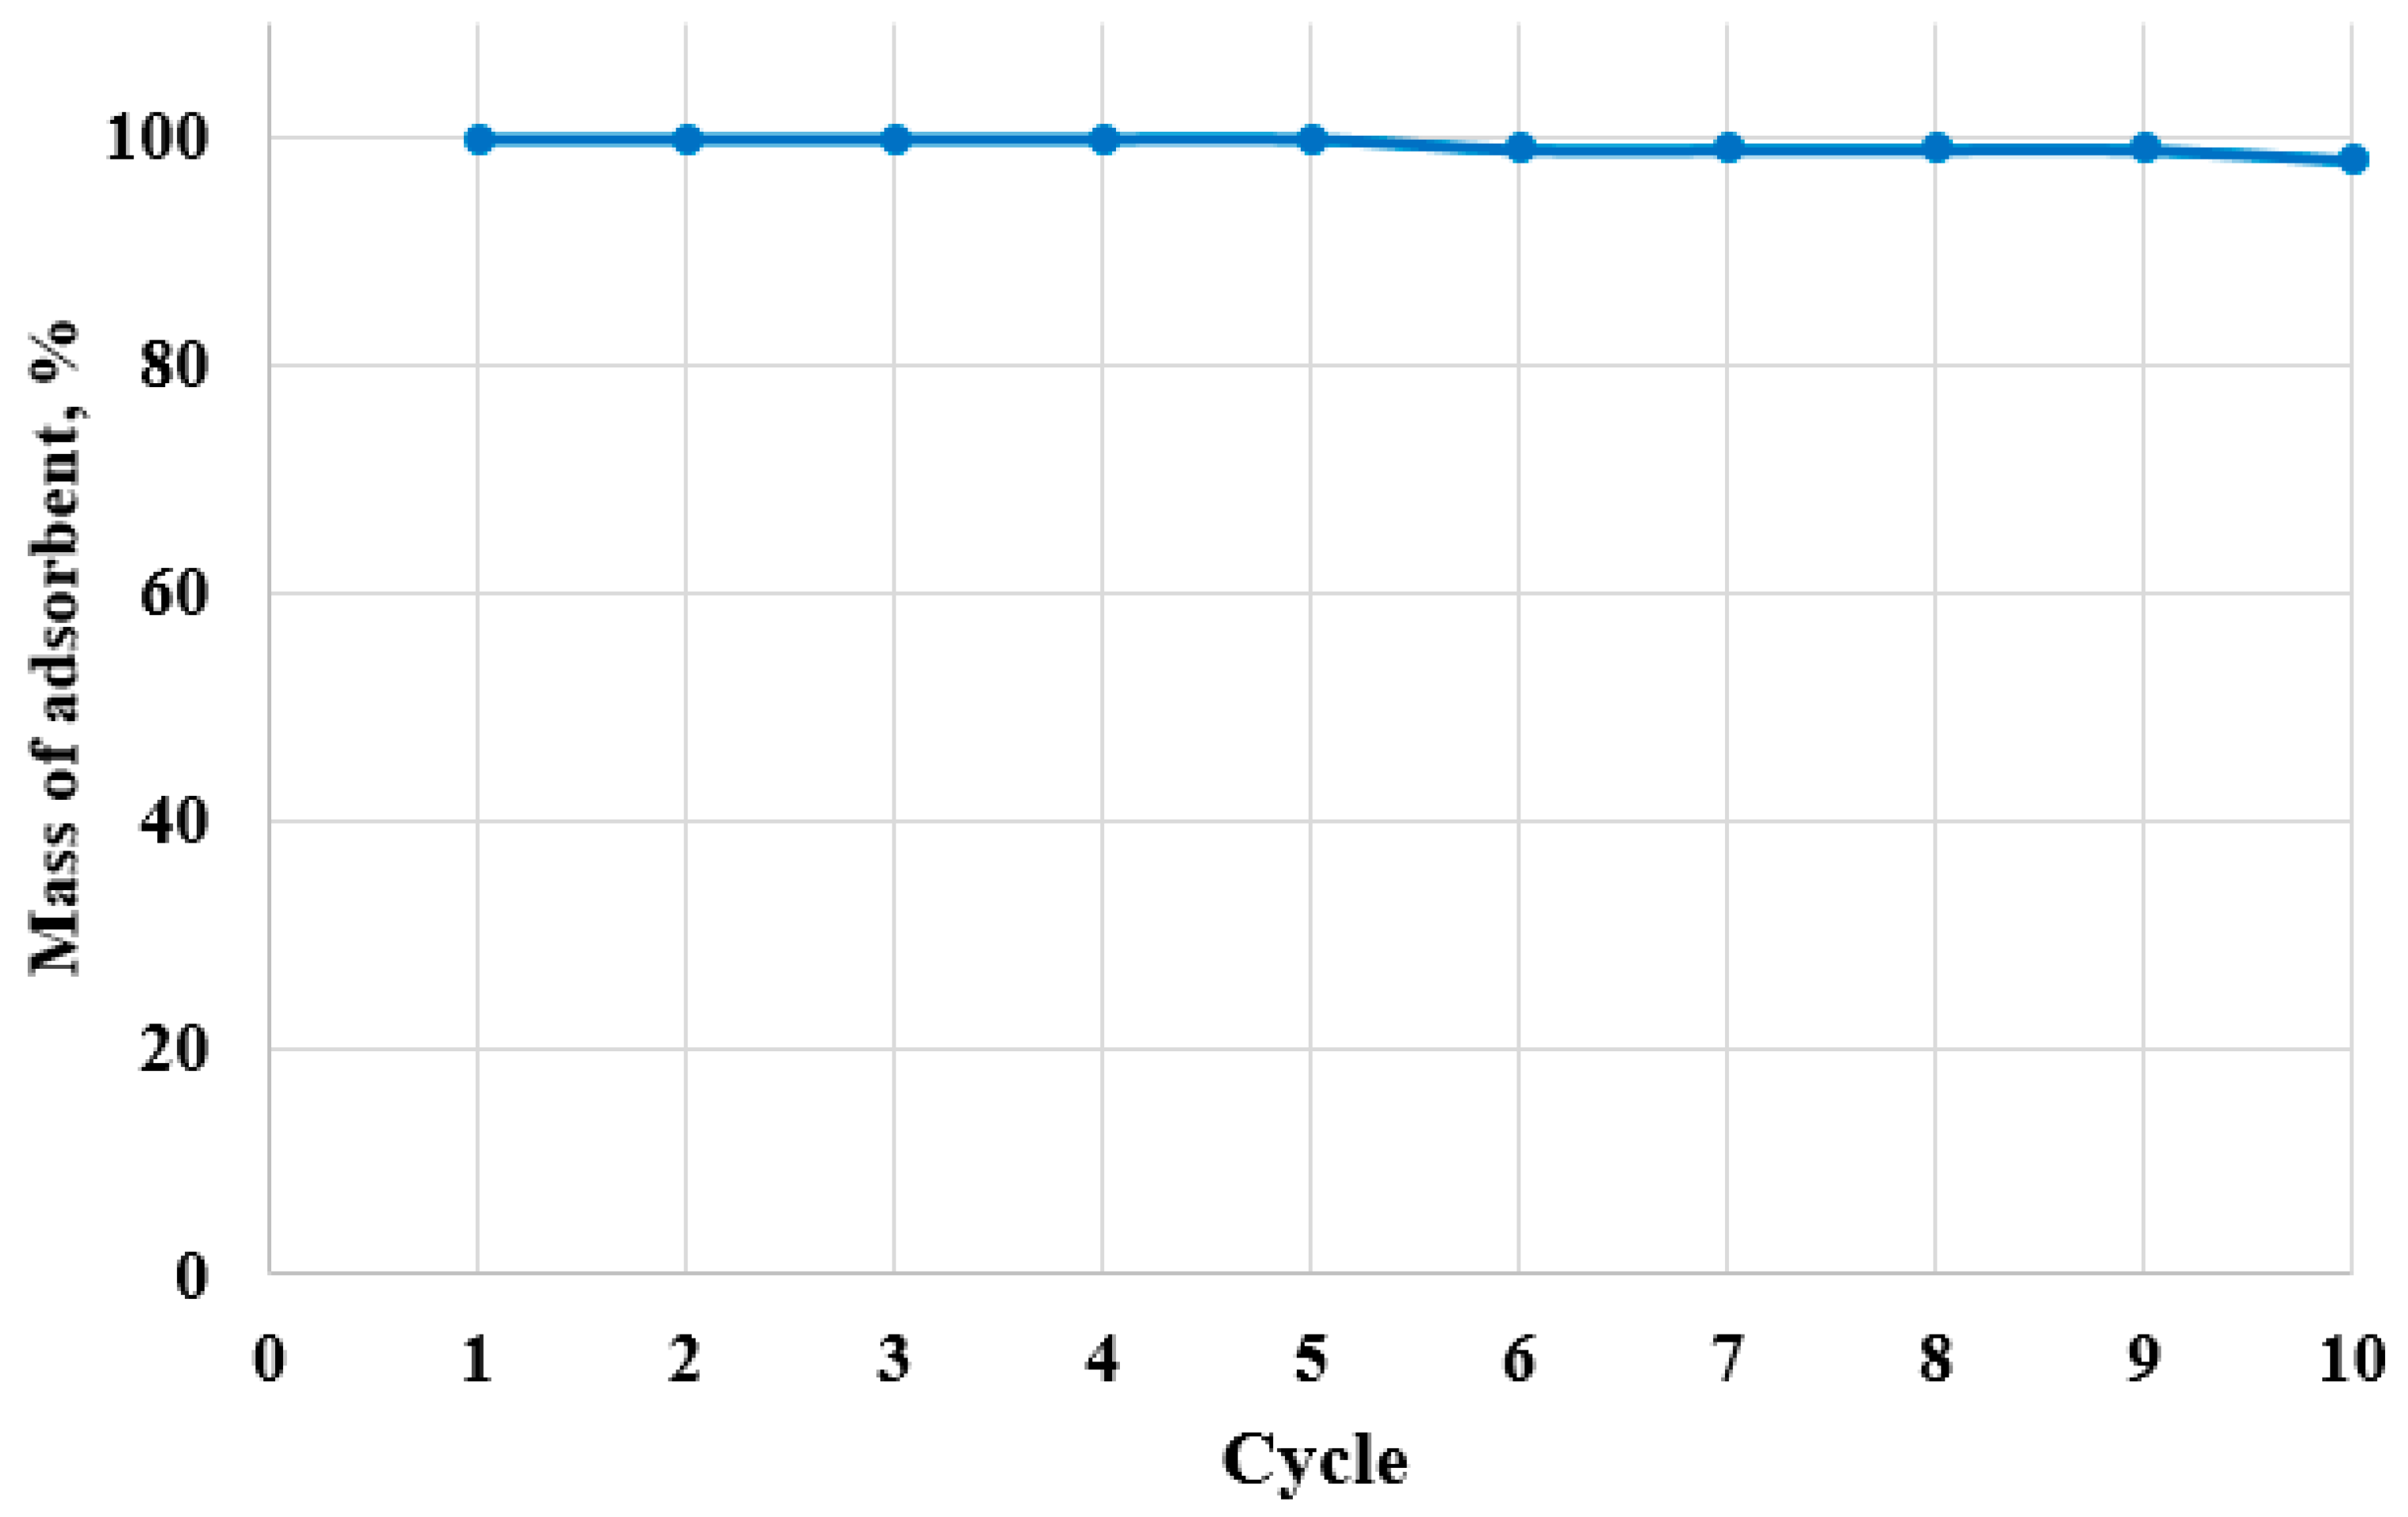
Loss of adsorbent material was ruled out. No visible physical degradation was observed over ten adsorption–desorption cycles, and the relative mass after each cycle remained essentially constant (
Figure 13), confirming physical stability and implicating surface chemical changes and fouling, rather than material loss, as the main causes of performance decline.
Despite this decline, C10act maintains reasonably great performance up to the 7th cycle (>90% efficiency), underscoring its good reusability and stability for practical applications. Nonetheless, a sharp decrease beyond cycle 8 suggests the need for reactivation treatment or replacement after a certain number of cycles to maintain effective performance.
Carbons obtained from coffee grounds are capable of specific sorption of ciprofloxacin. The sorption mechanism is based, among others, on interactions between ciprofloxacin molecules and aromatic carbon rings, as well as proton donor and electrostatic interactions of the sorbents with functional groups present in the pesticide’s structure. These assumptions are confirmed by XPS results indicating the formation of a surface rich in oxygen-containing functional groups with increasing carbonization time in a microwave reactor. This effect is most evident in the C10act sample, which was additionally enriched in oxygen-containing carbonyl groups through plasma activation.
