Abstract
This study explores the use of lignocellulosic Tectona grandis seeds (TGs), hydrochar (HC-230-4), and activated carbon (AC-850-5) produced via hydrothermal carbonization and followed by CO2 activation for removing acridine yellow G (AYG) and acridine orange 14 (ABO) from water. HC-230-4 showed a rich presence of surface functional groups and irregular morphology with some sphere-like structures. In contrast, AC-850-5 exhibited a much higher surface area (729.7 m2/g), though with fewer surface functional groups than HC-230-4. The batch method was used to study the effects of contact time, pH, dye concentration, and temperature. Among the materials, AC-850-5 showed the highest adsorption capacity of 198 mg/g for AYG and 171 mg/g for ABO at 25 °C, around 12% higher than commercial activated carbon. The adsorption process was spontaneous and endothermic, fitting well to the Langmuir isotherm model, suggesting monolayer coverage. The adsorption kinetics followed the pseudo-second-order model, indicating that the rate depends on the surface site availability. Intraparticle diffusion analysis further confirmed a multi-step adsorption process. These findings show the strong potential of TG-derived activated carbon as an effective and sustainable material for removing acridine dyes from polluted water.
1. Introduction
Water, the foundation of life, is facing an unprecedented crisis. The rapid growth of industrial activities, agricultural practices, and urbanization has led to a significant increase in water pollution, threatening the very sustainability of our planet. In this context, one significant contributor to water pollution is the extensive use of synthetic dyes in industries like textiles, leather, and paper. These colored substances brighten our textiles and enhance our products but they pose an unimaginable threat to the environment. When discharged into waterways without proper treatment, they can disrupt the delicate balance of aquatic ecosystems, harming both human health and aquatic life [1,2].
Due to their aromatic structure, synthetic dyes exhibit resistance to heat and oxidizing agents, presenting also a potential to induce cancerous and mutagenic diseases in humans [3,4,5]. The demand for synthetic dyes has substantially increased, in recent decades, with approximately 7 × 10⁵ metric tons of dyes. It includes around 1 × 10⁶ different types (cationic, anionic, disperse, and vat dyes), being manufactured annually for commercial purposes [6,7,8]. Among these, cationic dyes have garnered attention due to their excellent solubility, persistence in water, and recalcitrant effect [8]. Additionally, they have a very high tinctorial value, such as a concentration as low as < 1 ppm which is sufficient to bring color to the solution [9]. Cationic dyes belong to various chemical classes in which thiazine, triarylmethane, oxazine, cyanine, hemicyanine, diazahemicyanine, and acridine are the principal ones [4,10].
Acridine dyes are widely used for various applications, including dyeing silk, synthetic fibers and leather, high fluorescence intensity in luminescent analysis, as well as for printing purposes [11]. Acridine orange (AO) dyes are referred to as being an organic compound that serves as a nucleic acid selective fluorescent dye, such as it presents the cationic properties useful for cell cycle determination. They are mostly used in medicine and biology for staining solutions [12]. Acridine dyes have been found to possess mutagenic potential, owing to their ability to damage DNA. Exposure to these dyes can result in adverse health effects, including eye and skin irritation, as well as respiratory problems upon ingestion or inhalation [13]. Hence, they must be eliminated from wastewaters before discharging them into the environment.
A number of techniques including adsorption, biosorption, coagulation–flocculation, biological methods, ozonation, membrane separation, precipitation, and electro-chemical have been applied for the removal of these dyes from the water systems [14,15,16,17,18,19,20,21]. Among these, adsorption, mainly due to its simplicity of operation, economic viability, high removal potential, and the diversity of available adsorbents, is widely preferred for dye removal applications [22]. In the adsorption process, activated carbons have proven to be efficient and versatile materials as adsorbents for the elimination of dyes [23,24]. However, the high manufacturing cost of activated carbons (ACs) has prompted researchers to search for cost-effective alternatives [25].
Biomass, such as lignocellulosics, municipal, and sewage wastes, are abundant and renewable sources that can be converted into carbon-rich products through thermochemical methods. Various approaches have been explored in the literature to transform biomass into carbon-rich materials, including pyrolysis, torrefication, gasification, and hydrothermal carbonization [24,26,27,28]. Among these techniques, hydrothermal carbonization has emerged as a promising method for converting biomass into carbon-rich products under relatively mild conditions. The hydrochars obtained were intensively utilized for soil remediation, energy storage, fuel applications, adsorption of pollutants, and as a raw material to produce ACs. Although hydrochars have been widely used in the removal of dyes, their limited porosity is a barrier to their high performance in adsorption processes. Therefore, the activation of these materials, with the high proportion of carbon, can be an effective approach for the production of excellent adsorbents, such as activated carbon, which exhibits a high porous volume and superficial area.
In this work, we aim to evaluate and compare the adsorption capacity of raw Tectona grandis seeds (TGs), hydrochar (HC-230-4) and activated carbon (AC-850-5) prepared via hydrothermal carbonization followed by CO2 activation for the removal of acridine yellow G (AYG) and acridine basic orange 14 (ABO) dyes from an aqueous solution. Batch experiments were conducted to assess the effect of pH, contact time, dye concentration, and temperature. The adsorption behavior was further analyzed using isotherm, kinetic, and thermodynamic models. Commercial activated carbon (CAC) was also included for benchmarking. To the best of our knowledge, no study has yet provided a comparative evaluation of acridine dye removal using hydrochar and activated carbon derived from Tectona grandis seeds. This work offers new insights into the potential of this biomass as a sustainable and efficient adsorbent source.
2. Results
The adsorbents previously prepared (TGs, HC-230-4, AC-850-5) were tested for the removal of two acridine dyes from the aqueous phase. The influence of a variety of parameters on the performance of HC-230-4 and AC-850-4 for the adsorption of both dyes was evaluated, which are detailed in the following sections. Commercial activated carbon (CAC) has also been tested for the removal of acridine dye for comparison purposes.
2.1. Effect of Contact Time and Initial Concentration of Acridine Dyes
The equilibration time is one of the most crucial parameters for achieving cost effective wastewater treatment efficiency. The influence of contact time on the removal of modeled dyes, namely AYG and ABO, by the prepared hydrochar (HC-230-4) and activated carbon (AC-850-5) was investigated, up to 300 min, at 25 °C. It is apparent from Figure 1a,b that the amount of dyes removed from the aqueous phase increases with contact time, reaching equilibrium at 240 min for HC-230-4 and 180 min for AC-850-5. Initially, AYG and ABO were rapidly adsorbed due to the abundance of free active sites on the adsorbent surfaces. As time progressed, the rate of adsorption decreased as these sites became occupied, eventually reaching saturation [29].
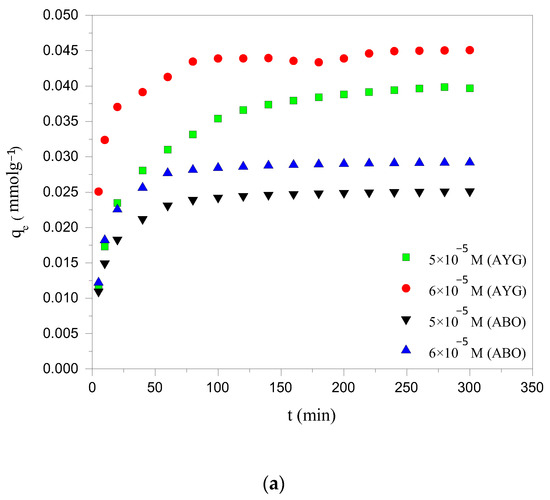
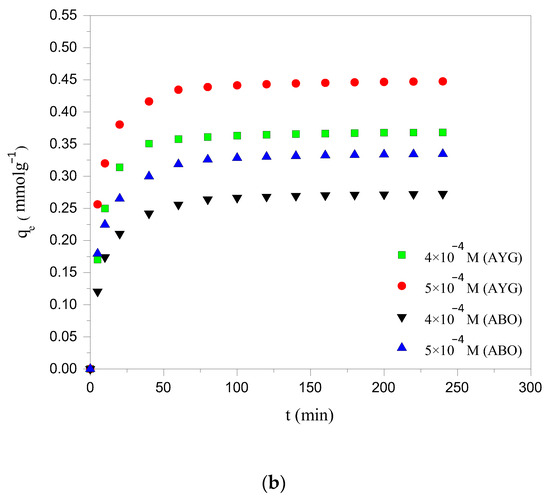
Figure 1.
Effect of contact time and initial concentration on the adsorption of AYG and ABO onto (a) HC-230-4 (Ci: 5 × 10⁻⁵; 6 × 10⁻⁵ mol dm−3; T: 25 °C) and (b) AC-850-5 (Ci: 4 × 10⁻⁴; 5 × 10⁻⁴ mol dm−3; T: 25 °C).
The effect of the initial dye concentration on adsorption was studied using two concentrations: 5 × 10⁻⁵ and 6 × 10⁻⁵ mol dm−3 for HC-230-4, and 4 × 10⁻⁴ and 5 × 10⁻⁴ mol dm−3 for AC-850-5, as shown in Figure 1a,b. The results showed that the adsorption capacity increased with the increasing dye concentration for both adsorbents. This is because, at higher concentrations, the larger driving force promotes more rapid dye transfer from the solution to the adsorbent surface, until the available active sites become saturated. Moreover, the increase in the initial dye concentration increased the adsorbent loading potential [30]. This may be attributed to an enhancement in the driving force for adsorption due to the increased concentration gradient between the liquid and solid phases, which overcomes the resistance to mass transfer [31].
2.2. Influence of pH of Solution on Dye Adsorption
The pH of the adsorbate solution is also a crucial factor influencing the adsorption progress. A thorough investigation of the adsorption of AYG and ABO on HC-230-4 and AC-850-5, at pH values ranging from 2 to 12, as shown in Figure 2a,b, was conducted in order to understand the impact of pH on these adsorption processes. The initial pH of the modeled dyes solutions, before pH adjustment, was 8.3 for AYG and 6.4 for ABO.
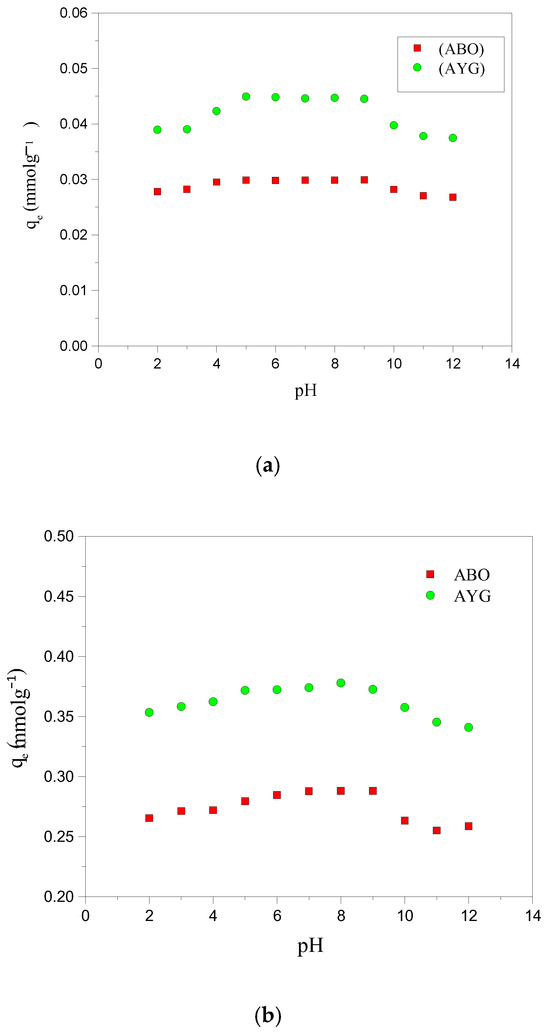
Figure 2.
Effect of pH on the adsorption of AYG and ABO onto (a) HC-230-4 (Ci: 6 × 10⁻⁵ mol dm−3; T: 25 °C) and (b) AC-850-5 (Ci: 4 × 10⁻⁴ mol dm−3, at 25 °C).
As shown in Figure 2a,b, maximum adsorption for both dyes occurred within the pH range of 5–9 for both adsorbents. At lower pH values (pH < 4.3 for HC-230-4 (hydrochar) and < 6.2 for AC-850-5), the reduced adsorption capacity can be primarily attributed to competition between H+ ions and dye cations for active sites, along with the proto-nation of surface functional groups that suppress dye binding. Electrostatic repulsion may also play a role at a very acidic pH (below 4.3 for HC-230-4), but from a pH of 4.3 and above, the surface of HC-230-4 becomes negatively charged, enabling electrostatic attraction with cationic dye species.
Moreover, as inferred from the FTIR analysis (Table 1), the surface of HC-230-4 is rich in oxygenated functional groups, such as hydroxyl and carboxyl groups, which contribute to dye adsorption through multiple interactions including hydrogen bonding, π–π stacking, and electrostatic attraction. For both dyes, adsorption by HC-230-4 decreased above pH 9. This decline could be attributed to multiple factors, including the potential for dye molecule aggregation or dimerization at higher pH, which reduces the number of free dye monomers available for adsorption [32,33]. At an alkaline pH, the increased concentration of OH− ions may compete with dye cations for active sites or lead to electrostatic screening effects, which weaken the attractive forces between the adsorbent surface and the dye molecules, resulting in reduced adsorption.

Table 1.
Characteristics of adsorbents (Tectona grandis seeds, HC-230-4 and AC-850-5 [34].
For AYG, the adsorption trend closely follows the expected pH-dependent behavior, with an increased uptake above pH 4.3 due to electrostatic attraction and a minor decline at a higher pH likely caused by OH− competition and dye aggregation. In contrast, ABO adsorption onto HC-230-4 exhibits a relatively constant profile across the pH range from 5 to 9, resembling a plateau. This behavior could result from the early saturation of available adsorption sites or potential dye aggregation and dimerization at higher pH, which reduces the availability of free monomeric ABO molecules for adsorption. Additionally, kinetic limitations or diffusional constraints within the porous structure of HC-230-4 may also contribute, particularly for larger cationic dyes like ABO. These factors combined may explain the relatively constant adsorption values across the pH range.
The AC-850-5 surface becomes negatively charged at pH values above pH 6.2 and this shift in surface charge leads to dominant electrostatic interactions with the positively charged dyes [13]. Above pH 6.2, these attractive interactions become the primary driving force for adsorption, leading to an enhanced dye uptake. However, the maximum adsorption capacity for both adsorbents did not show significant variations in terms of the solutions’ pH. Hence, the subsequent adsorption studies were performed at an original pH of both dye solutions (pH = 8.3 for AYG and pH = 6.4 for ABO).
2.3. Dyes’ Adsorption Isotherms
Adsorption isotherms provided detailed insights into the mechanisms relating the surface properties and affinity of an adsorbent for a specific adsorbate as revealed through the analysis of the experimental data [20,36,37]. Out of the various applied and discussed models, Langmuir, Freundlinch, Temkin, and D-R isotherm models are extensively utilized to analyze and describe the experimental data. The mathematical expression and the related parameters are presented in Table 2. The joint use of these models allows for a more accurate representation and comprehension of the data, especially when dealing with complex adsorption processes.

Table 2.
Mathematical expressions and related parameters for Langmuir, Freundlich, Temkin, and D-R isotherm models.
The Langmuir isotherm equation, which is an extensively used model [38], assumes that the adsorption occurs in a monolayer on the adsorbent’s surface, and that the adsorption energy remains alike for all adsorbate molecules. The model allows for the calculation of the maximum adsorption capacity and the adsorption energy, which can be useful in terms of understanding the adsorption behavior of the material. Utilizing Langmuir parameters, a dimensionless separation factor (RL), which demonstrates whether the adsorption process is favorable (0 < RL < 1), unfavorable (RL > 1), irreversible (RL = 0), or linear (RL = 1) [39], can be obtained using the following expression [40]:
The Freundlich model [41], which is another extensively used model, is known for providing information about the adsorption behavior for the materials with a notable degree of surface heterogeneity and the adsorption energy varies with the availability of surface site. The Freundlich model allows for the calculation of the constant related to the maximum adsorption capacity (KF and heterogeneity factor (n), as shown in Table 2. The heterogeneity factor ‘n’ gives details of whether the process is physical or chemical. Values of n between 1 and 10 demonstrates the adsorbent’s compatibility with the adsorption process [42].
The Temkin isotherm model [43] is often used to account for indirect interactions between adsorbent and adsorbate molecules. It assumes that the adsorption heat decreases linearly with the surface coverage, which is typically valid for the intermediate concentration range. In this study, the Temkin isotherm was applied in its empirical linearized form (Table 2). Although BT is sometimes expressed thermodynamically as BT = RT/bT, this formulation can lead to dimensional inconsistencies when qe is reported in mass-based units. Therefore, following Chu [44], in this work, the Temkin model is treated purely as an empirical fit, and only the Temkin binding constant (KT) and coefficient of determination R2 are reported to represent adsorption affinity and model fitting accuracy.
The Dubinin–Radushkevich (D-R) model [45] was applied in this study primarily to estimate the mean adsorption energy (E), rather than to describe the isotherm fit. The model provides insights into whether the adsorption is physical or chemical in nature. The calculated E values were used to interpret the mechanism but not to predict the isotherm shape. The model (Table 2) assumes that the adsorption occurs in a monolayer of the adsorbent surface, and the adsorption energy varies with the surface site coverage. The mean adsorption energy is represented by the following expression, where β is a constant related to the adsorption energy.
The adsorption potential of HC-230-4 and AC-850-5, for AYG and ABO dyes, was determined by plotting equilibrium adsorption, at 25 °C, as a function of equilibrium concentration, as shown in Figure 3a,b, respectively. The parameters obtained based on the application of different equations and models are presented in Table 3.
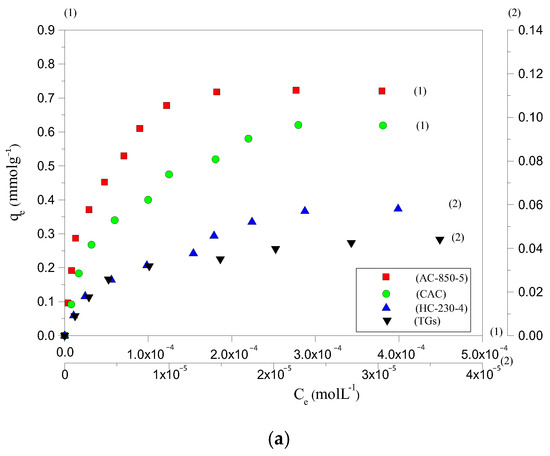
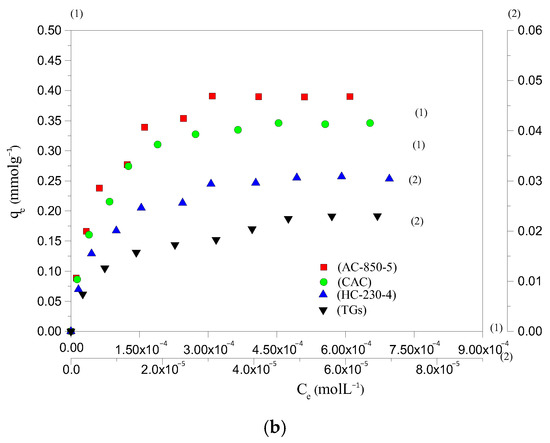
Figure 3.
Adsorption isotherm for the removal of (a) AYG and (b) ABO on four adsorbents, at 25 °C.

Table 3.
Adsorption isotherm parameters for the adsorption of Acridine Yellow G (AYG) and Acridine Basic Orange 14 (ABO) dye onto hydrochar (HC-230-4) and derived activated carbon (AC-850-5) at different temperatures.
It can be seen from the isotherms that a maximum amount of 0.058 and 0.030 mmolg−1 for AYG and ABO, respectively, were adsorbed by HC-230-4, whereas 0.723 and 0.390 mmolg−1 were adsorbed by AC-850-5. While analyzing the isotherm data, it was observed that the prepared hydrochar exhibited very low adsorption capacity for both modeled dyes. However, the activation which allows for the porosity development promotes a significant increase in adsorption capacities of the AC-850-5. The hydrochars are normally prepared at a lower temperature and high pressure than ACs. In this case, the surface area and porosity are less developed in HC-230-4, which is a constraint for the adsorption of large molecules such as the acridine dyes.
The removal efficiency of HC-230-4 and AC-850-5, at 25 °C, for the modeled dyes was also compared with the performance of TGs and with a commercial activated carbon (CAC surface area = 830 m2g−1, total pore volume = 0.48 cm3g−1, and average pore size = 2.31 nm). The N2 adsorption–desorption isotherm for the CAC was provided in Figure S1. The obtained isotherms are included in Figure 3a,b. It was found that the amount of AYG adsorbed was 0.048, 0.058, 0.637, and 0.723 mmolg−1 for TGs, HC-230-4, CAC, and AC-850-5, and the order for the ABO was 0.023, 0.030, 0.346, and 0.390 mmolg−1 for TGs, HC-230-4, CAC, and AC-850-5, respectively.
The raw TGs presented the lower adsorption capacity of dyes; this was expected as it has low porosity, where the lignin present reduces the access of the dyes to the pores. The prepared HC-230-4 shows a low adsorption potential, which can be attributed to its smaller surface area (14.41 m2g−1) and reduced porosity relative to AC-850-5 (729.7 m2g−1, 0.392 cm3g−1) and CAC (830 m2g−1, 0.48 cm3g−1). Although CAC exhibited a higher surface area and pore volume compared to AC-850-5, its adsorption capacity for AYG and ABO was lower. This difference can be attributed to variations in surface chemistry and pore structure. Since both dyes are cationic, adsorption is not governed solely by electrostatics but also by π–π stacking, hydrophobic interactions, and dye accessibility to the pores. AC-850-5, prepared by the CO2 activation of hydrochar at 850 °C, likely retains a greater amount of surface-oxygenated groups (such as hydroxyl and carboxyl functionalities) compared to commercial CAC, which may undergo more extensive high-temperature treatments. These functional groups enhance dye interaction through additional non-electrostatic mechanisms. Furthermore, the slightly smaller average pore size of AC-850-5 (2.15 nm) compared to CAC (2.31 nm) could promote stronger dye confinement effects, increasing van der Waals interactions and stabilizing dye molecules within the pores. These combined factors likely contribute to the higher adsorption capacity observed for AC-850-5. For all adsorbents, a higher adsorption capacity was observed for AYG as compared to ABO, indicating a better affinity between AYG and the adsorbents’ surface.
The experimental adsorption data for the modeled dyes was evaluated using Langmuir, Freundlich, Temkin, and D-R models. Each model provides a unique perspective on the adsorption mechanism, allowing for a more comprehensive understanding of the interactions between the dyes and the adsorbent’s surfaces. Among these models, the Langmuir isotherm provided the best fit to the experimental data, as evidenced by the high R2 values (0.990–0.999) and the close agreement between experimental and calculated adsorption capacities. The D–R model was used solely to estimate the adsorption energy and to confirm the nature of the interaction, not for isotherm fitting. For the Temkin model, only the equilibrium binding constant (KT) and the coefficient of determination R2 are reported in line with recent recommendations to avoid dimensional inconsistency in mass-based adsorption studies [44]. The extracted model parameters for each isotherm are summarized in Table 3. The analysis of the adsorption data reveals that the Langmuir isotherm fit better to both dyes’ experimental isotherms, as shown by the data presented in Table 3, and supported by the Figure 4a–d and Figure 5a–d for the fit of AYG and ABO onto AC-850-5, obtained at different temperatures.
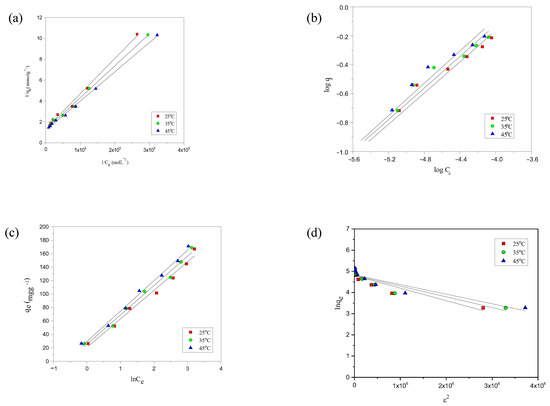
Figure 4.
Representation of the (a) Langmuir, (b) Freundlich, (c) Temkin, and (d) D-R isotherms for the adsorption of AYG onto AC-850-5 at different temperatures.
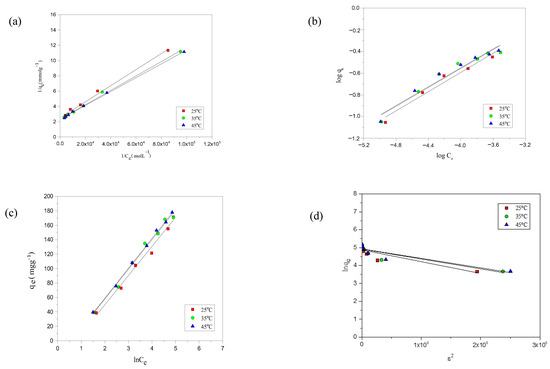
Figure 5.
Representation of the (a) Langmuir; (b) Freundlich; (c) Temkin; and (d) D-R isotherm for the adsorption of ABO onto AC-850-5 at different temperatures.
Similar graphs were obtained for the adsorption of both dyes onto HC-230-4 and are provided in Supplementary Materials (Figures S2 and S3). A notable consensus between experimental adsorption capacities and theoretical Langmuir model estimates emphasizes the model’s effectiveness in describing the observed data. For instance, Acridine Yellow G adsorbed onto HC-230-4 and AC-850-5 exhibited experimental values of 0.058 and 0.723 mmolg−1, respectively, which closely matches the Langmuir model’s estimates of 0.059 and 0.756 mmolg−1. Similar trends were observed for Acridine Basic Orange 14 (Table 3). Furthermore, the consistently high R2 (ranging from 0.990 to 0.999) across all cases confirm the Langmuir model applicability in representing the observed adsorption data. The low adsorption energy values obtained by the Temkin and D-R models, at different temperatures, allows us to confirm that the adsorption of both dyes onto the four adsorbents, as shown in Table 3, is due to the physical adsorption. This observation supports the conclusion that the process is dominated by physisorption, involving weak van der Waals interactions, as reflected by the low E values (all below 8 kJ mol−1). It is important to note that, while the D–R model provided insights into adsorption energy, the Langmuir model was superior in describing the adsorption isotherm behavior. El-Shafie and co-workers [46] identified the presence of two stages related to the adsorption of acridine orange onto TTWM500 (thermally treated watermelon rinds at 500 °C). The first stage, which presented an adsorption energy varying from 8.67 kJ/mol to 11.18 kJmol−1 was attributed to formation of a first layer, through chemical adsorption. The formation of multilayers, due to the presence of physical adsorption, was identified by the presence of adsorption energy values ranging from 1.90 to 4.08 kJmol−1 [46].
2.4. Effect of Temperature
Temperature plays a vital role in understanding the adsorption process, as it can significantly influence the thermodynamic driving forces, potentially favoring either endothermic or exothermic adsorption mechanisms. The adsorption studies of AYG and ABO over HC-230-4 and AC-850-5 were conducted at temperatures ranging from 25–45 °C. The results depicted in Figure 6a,b for AYG adsorption onto HC-230-4 and AC-850-5, clearly show the influence of temperature on the adsorption process.
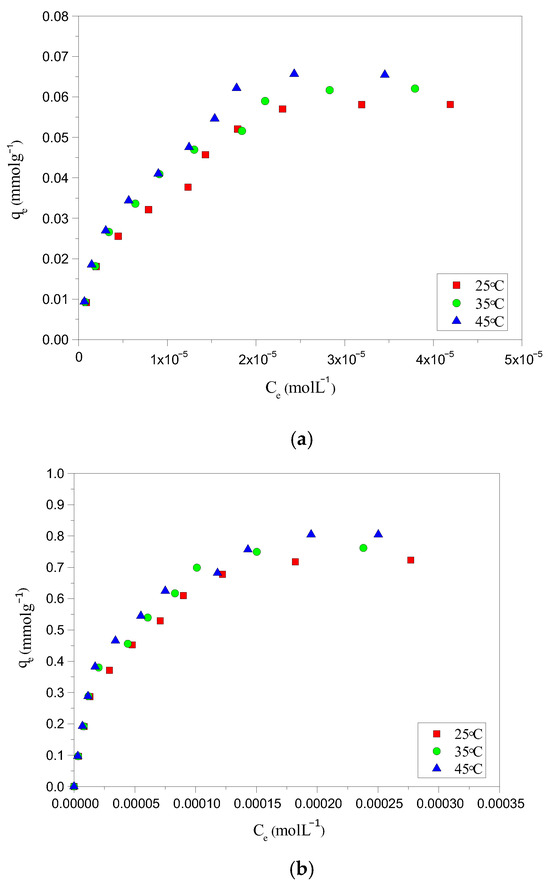
Figure 6.
Adsorption isotherm for the removal of AYG onto (a) HC-230-4 and (b) AC-850-5 at different temperatures.
Similar graphs were obtained for the adsorption of ABO dye onto HC-230-4 and AC-850-5, and are provided in Supplementary Materials (Figure S4). Figures reveal a positive co-relation between adsorption capacity and temperature. These results suggest that the adsorption process is mainly endothermic in nature, as found previously by Temkin and D-R models. The adsorption of AYG increased from 0.058 to 0.066 mmolg−1 and from 0.723 to 0.805 mmolg−1, whereas, in the case of ABO, it increased from 0.030 to 0.036 mmolg−1 and 0.390 to 0.441 mmolg−1 on HC-230-4 and AC-850-5, respectively, when the temperature raised from 25 °C to 45 °C. The increase in the dyes adsorbed was attributed to their diffusion rate in the solution. Increasing the temperature accelerated the diffusion across the external liquid film and inside the pores, which decreased the solution viscosity, and promoted an increase in the adsorption [47,48].
2.5. Possible Adsorption Interactions
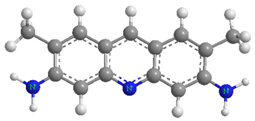
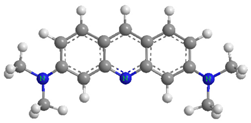
This section discusses the types of interactions between dyes and adsorbent surfaces (electrostatic forces, π–π stacking, H-bonding), inferred from FTIR and structural analysis. Kinetic mechanisms are discussed separately in Section 2.7. There is no one assumption that can adequately explain the adsorption mechanism of adsorbates onto the adsorbents, as numerous factors, including group functionality, surface area, and porous nature of the adsorbent, as well as the structure and the nature of the adsorbate, influence the adsorption process. The analysis of the obtained adsorption isotherms for both modeled dyes revealed that AYG exhibited higher adsorption compared to ABO, on both adsorbents. From Table 4, it is evident that the molecular size of AYG is smaller compared to ABO. A smaller dye molecule presents a higher diffusivity in water and is more readily attached to available adsorption sites [49].

Table 4.
Molecular structures and properties of Acridine Yellow G (AYG) and Acridine Basic Orange 14 (ABO) dyes.
In a general way, the presence of the –CH3 group increases hydrophobicity, favoring adsorption. Despite ABO having a higher number of methyl groups in its structure, AYG exhibited higher adsorption on both adsorbents. This inconsistency may be attributed to the molecular size of ABO, as it covers a higher adsorbent surface area than AYG. In this situation, the presence of methyl groups inhibits other molecules of ABO to approach the adsorbent surface.
The dominant interactions in the adsorption of both modeled dyes onto the HC-230-4 surface were electrostatic interactions, H-bonding, and π–π interactions. The FTIR analysis from Table 1 identified the presence of hydroxyl, carboxylic, and phenolic groups on the HC-230-4 surface. The interactions between dye molecules, with a positive charge, and these groups, which bear a negative charge, confirms the dominance of electrostatic interactions in the case of HC-230-4 [13]. The FTIR spectra of AC-850-5 before and after dye adsorption (Figure 7) provide useful insights into the possible interactions between the adsorbent and the acridine dyes. After the adsorption of both AYG and ABO, a slight shift and broadening of the O–H stretching band in the range of 3500–3400 cm−1 was observed, which suggests the involvement of hydroxyl groups in hydrogen bonding with the dye molecules. Moreover, the C=O stretching band at 1622 cm−1 shifted to 1636 cm−1 for AYG and 1637 cm−1 for ABO, which indicate the possible interactions between the aromatic rings of the dyes and the carboxyl groups on the adsorbent surface, likely through electrostatic attraction or π–π interactions. Furthermore, the band at 1115 cm−1 shifted to 1134 cm−1 (AYG) and 1131 cm−1 (ABO) after adsorption. This shift is often attributed to π–π stacking interactions between the dye molecules and the aromatic domains of AC-850-5, suggesting a role of non-covalent interactions in dye retention.
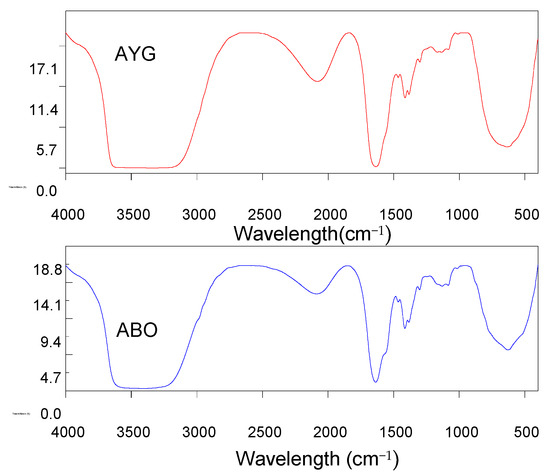
Figure 7.
FTIR spectra after the adsorption of AYG and ABO onto AC-850-5.
The porous structure and surface chemistry of ACs affects the adsorption process to a greater extent [50]. The porosity of AC-850-5 is considered a dominating factor in the adsorption of the modeled dyes, from aqueous solutions. The high surface area (729.70 m2g−1) and sample porosity (0.392 cm3g−1) of AC-850-5 allows the dye molecules to adsorb on its surface. The FTIR analyses (Table 1) reveal the presence of carboxylic groups and some aromaticity on the surface of AC-850-5. The electrostatic interactions between both dyes and these groups, along with H-bonding, may enhance the extent of adsorption of the modeled dyes onto AC-850-5.
2.6. Thermodynamics
The effectiveness of an adsorption process relies profoundly on its thermodynamic feasibility and underlying behavior. By examining key parameters like Gibb’s free energy (∆G), entropy (∆S°), and enthalpy (∆H°), crucial information about the process’s favorability, randomness, and the nature of the interactions involved can be achieved.
The change in ∆G delivers the information regarding the thermodynamic favorability and spontaneity of the process under the studied conditions. The calculation of the ∆G° for the process is based on the following expression; here, T is the temperature, b and R are the equilibrium constant (from Langmuir) and universal gas constants, respectively.
ΔG = −RT ln b
The change in the ∆H° indicate whether the adsorption process is endothermic or exothermic. Additionally, the change in ∆S° reflects the system’s tendency towards increasing randomness during adsorption. Higher ∆S° values signify increased disorder and suggest a more favorable process. ∆H° and ∆S° can be calculated using the van’t Hoff equation [51], expressed by equation 4, where R is the gas constant:
To investigate the feasibility and nature of the adsorption of AYG and ABO onto HC-230-4 and AC-850-5, experiments were conducted at three distinct temperatures, 25, 35 and 45 °C. Subsequently, the ΔS° and ΔH° of the adsorption process were determined by analyzing the linear relationship between the logarithm of the adsorption capacity (lnb) and reciprocal temperature (1/T). Van’t Hoff plots for the AYG and ABO are shown in Figure 8, for AC-850-5, and the corresponding parameters obtained were reported in Table 5. Similar graphs were obtained for the adsorption of both dyes onto HC-230-4, and are provided in the Supplementary Materials (Figure S5).
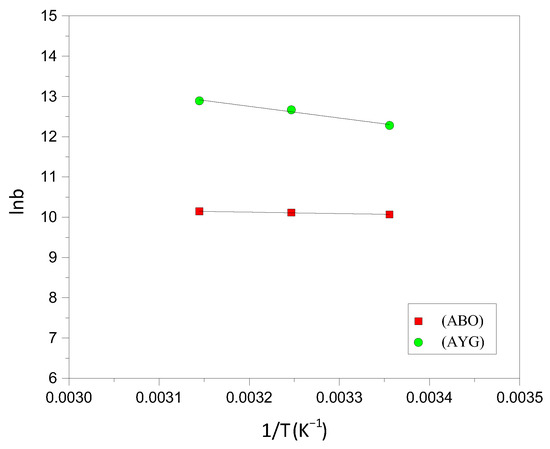
Figure 8.
Van’t Hoff plot for the adsorption of AYG and ABO onto AC-850-5.

Table 5.
Thermodynamic parameters for the adsorption of Acridine Yellow G (AYG) and Acridine Basic Orange 14 (ABO) onto HC-230-4 and derived AC-850-5.
For both dyes, the adsorption process was identified as spontaneous and endothermic based on the negative ΔG values obtained at all studied temperatures. Notably, AYG adsorption consistently exhibited more negative ΔG values compared to ABO on both adsorbents, indicating a higher affinity and more favorable adsorption of AYG under the experimental conditions.
2.7. Kinetics
Knowledge of the rate at which adsorbates bind to the surface of adsorbents and plays a vital role in understanding and optimizing the processes, mainly with regard to the definition of the residence time [52]. Therefore, to deeply understand the rate controlling mechanism, the kinetic investigations at 25 °C, for the removal of AYG and ABO by HC-230-4 and AC-850-5, were carried out, in a time span of 300 and 240 min, respectively. To understand the mechanisms governing dye adsorption, four well-established kinetic models, viz. pseudo first- and second-order, Elovich and intraparticle diffusion [23,24] were applied.
Pseudo first-order (PFO) rate equation was firstly introduced by Lagergren in 1898 [53]. It describes that the change in the rate of adsorbate uptake by adsorbent is proportional to the difference of equilibrium concentration and the amount of adsorbate adsorbed with time. The equation and the parameters related to the PFO model are given in Table 6.

Table 6.
Mathematical expressions and related parameters for pseudo-first order, pseudo-second order, Elovich, and intraparticle diffusion models (qe (mmolg−1)—equilibrium capacity; qt (mmolg−1); adsorption capacity at time t).
Pseudo second-order (PSO) rate equation was firstly applied by Ho and Mckay for the modeling of adsorption of lead onto peat in 1966 [54]. Thereafter, the model was widely utilized to validate the kinetic data of the adsorption processes. It describes that the rate-limiting step for the process may be the chemisorption, where forces are involved during the adsorption process in the electron-exchange between the adsorbate and adsorbent. The equation for the PSO model and the respective parameters are provided in Table 6.
The Elovich model [55] is an empirical model used to elucidate the chemisorption of gas onto solid. The Elovich kinetic equation has been considered in order to define the adsorption rate on the heterogenous surface of the adsorbent; however, no detail on the mechanism for the adsorbate–adsorbent interaction was suggested. The model also assumes that the activation energy increases with the increase in the adsorption time. The related equation and the model parameters for the Elovich equation are provided in Table 6.
Weber and Morris in 1962 [56] proposed a model to describe the intraparticle diffusion process, as shown in Table 6. The model describes that the adsorption of an adsorbate, from a solution, to the adsorbent surface involves bulk diffusion, mass transfer of adsorbate (film diffusion), pore diffusion (intraparticle diffusion), and adsorptive attachment. The second and third steps were crucial in deciding the mechanism involved during the adsorption process. The intraparticle diffusion (IPD) model [56] describes the rate limiting step during adsorption and assists in elucidating the exact mechanism for the adsorption process. A plot between qt vs. √t is used to estimate the parameters, kid (rate constant) and C (intercept of ID). According to the model, the intraparticle diffusion controls the process if the obtained plot is a straight line and passes through the origin. However, deviation from the straight line or non-zero intercept suggests that the adsorption is controlled by different processes (bulk diffusion, mass transfer of adsorbate, and adsorptive attachment).
The PFO, PSO, and Elovich models for AYG and ABO onto AC-850-5 are shown in Figure 9a–d and the obtained parameters are presented in Table 7. The graphs were also obtained for the adsorption of both dyes onto HC-230-4, and are provided in Supplementary Materials (Figure S6). On applying the pseudo first-order rate equation to the experimental data in Figure 9a, the theoretical adsorption capacity did not agree well with the experimental values. Moreover, the low value of the regression coefficient indicated that the pseudo first-order model did not satisfactorily fit the experimental data in Table 7. In contrast, applying the pseudo second-order equation yielded adsorption capacity values qe (theoretical) closely matching to those obtained experimentally, as shown in Figure 9b and data presented in Table 7. Additionally, the R2 obtained for the equation was in close to unity, indicating a good fit for the equation. These results suggest that the adsorption kinetics follow a pseudo-second-order behavior, indicating that the rate-limiting step may be related to surface site interactions and adsorption capacity availability [57].
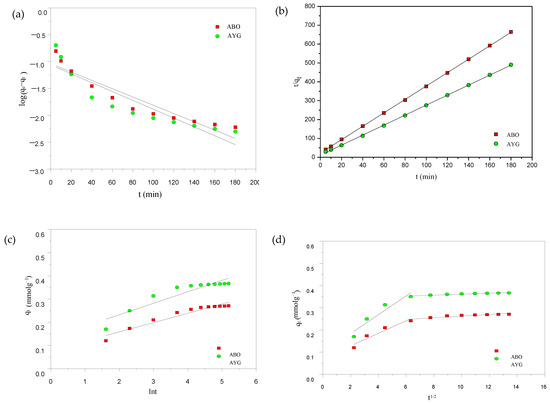
Figure 9.
(a) PFO; (b) PSO; (c) Elovich; and (d) intraparticle kinetic plots for the adsorption of AYG and ABO onto AC-850-5 (Ci: 4 × 10⁻⁴ moldm−3; T: 25 °C).

Table 7.
Kinetic parameters for the adsorption of Acridine Yellow G (AYG) and Acridine Basic Orange 14 (ABO) dye onto hydrochar HC-230-4 and derived activated carbon (AC-850-5).
Furthermore, to better compare the initial adsorption kinetics between the adsorbents and adsorbates, the initial adsorption rate (h) was calculated from the pseudo-second-order model using the equation h = k2. The values obtained were 0.00871 mmol g−1 min−1 for AYG and 0.00463 mmol g−1 min−1 for ABO on HC-230-4, and 0.089 mmol g−1 min−1 for AYG and 0.0461 mmol g−1 min−1 for ABO on AC-850-5. These results highlight that the AC-850-5 exhibits a significantly faster initial adsorption rate, owing to its higher surface area and porosity. Additionally, the higher h values for AYG in both cases indicate a better initial interaction and affinity compared to ABO.
The Elovich model was also applied and the corresponding plot and parameters for the dyes onto AC-850-5 are shown in Figure 9c and the parameters are presented in Table 7. The low regression coefficient (0.862–0.955) obtained for this model indicates its inapplicability. Therefore, among these three models, pseudo second-order model equation was identified as the most appropriate for describing the adsorption kinetics of AYG and ABO on HC-230-4 and AC-850-5.
The intraparticle diffusion model (IPD) was further tested to elucidate the mechanism and rate governing step for the adsorption of AYG and ABO dye onto AC-850-5. The obtained plots for the modeled dyes are given in Figure 9d and the corresponding parameters are shown in Table 7. In Figure 9d, two straight lines were identified and no one passed through the origin, which is consistent with a complex adsorption process [58].
The intraparticle diffusion rate constant Kid (Kid1 for the first stage and Kid2 for the second stage) and the value of C (C1 for the first stage and C2 for the second stage) were obtained from the plot of qt versus t1/2. From the Table 7, it can be observed that the value of Kid2 is lower than Kid1 for both dyes, which shows that intraparticle diffusion is the rate limiting step. Therefore, it can be concluded that the adsorption of AYG and ABO onto AC-850-5 follows a complex mechanism, where the four identified mechanisms can play an important role.
3. Materials and Methods
3.1. Precursor, Adsorbents, Adsorbates, and Chemicals
Tectona grandis seeds (TGs) utilized in this work were obtained locally. The as-obtained TGs were thoroughly washed to remove the adhered dust and impurities, and then dried. The dried seeds were then ground and sieved to obtain a homogeneous size (10–30 mesh) and further dried in an oven, at 105 °C, for 24 h. The prepared sample was kept in air tight containers for further use. The adsorbates, Acridine basic orange 14 was supplied by TCI chemicals, Tokyo, Japan, and Acridine yellow G was purchased from Loba Chemie, Mumbai, India. The properties of both dyes are included in Table 4. NaOH and HCl were purchased from Rankem, Gurugram, India, and Merck, Darmstadt, Germany, respectively.
3.2. Adsorbent’s Production and Characterisation
This work is the continuation of our previously published work. Production conditions and some of the key characterization findings (TGA, FE-SEM, FTIR, XRD, textural properties, and surface chemistry) of the prepared adsorbents, HC-230-4, AC-850-5, and raw Tectona grandis seeds, adapted from the previously published article, [34], are presented in the Table 1. The commercial activated carbon used in this study, for comparative purposes, was procured from Merck, Germany.
3.3. Adsorption Studies
The adsorption studies were performed employing the batch experiments. The effect of different parameters such as pH (2–12), contact time (0 to 300 min), the initial dye concentration (5 × 10⁻⁵, 6 × 10⁻⁵ moldm−3 for HC-230-4, and 4 × 10⁻⁴, 5 × 10⁻⁴ moldm−3, for AC-850-5) and the temperature (25, 35 and 45 °C) were evaluated. The experiments were carried out in a temperature-controlled shaking assembly (JSGW, India), having a stirring speed of 40–140 cycles per minute. The pH values of the dye solution were adjusted by using HCl and NaOH solutions (0.1 mol dm−3) and a pH meter (HI2210, Hanna, instruments, Smithfield, USA). After the desired contact time, the suspensions containing the adsorbents and dyes were filtered and the concentration of the remaining dyes was evaluated, at their respective λmax, by a UV–Vis spectrophotometer (UV-1800, Shimadzu, Kyoto, Japan). Each experiment was repeated thrice to minimize the experimental errors.
4. Conclusions
The seeds of the Tectona grandis have been successfully utilized as a starting material to prepare adsorbents (hydrochar and activated carbon) capable of adsorbing cationic acridine dyes from aqueous phase. The results demonstrated that the developed HC-230-4 but mainly the AC-850-5 exhibited a significantly higher surface affinity for AYG and ABO dyes as compared to raw TGs. The AC-850-5 presents a well-developed porous structure which reflects on the amount of acridine dyes adsorbed. The maximum adsorption capacity found was 15.9 and 198 mgg−1 for acridine yellow G onto hydrochar and activated carbon, respectively, while it was found to be 13.5 and 171 mgg−1 for acridine basic orange 14. The maximum adsorption occurs under the conditions of the pH ranging between 5 and 9, for both adsorbents, and a contact time of 240 and 180 min for HC-230-4 and AC-850-5, respectively. It was found that the adsorption was an endothermic process, on both adsorbents (positive values of ΔH°). The values of ΔG° corroborate the spontaneity and the physical nature of the adsorption process. Furthermore, the adsorption studies carried out in this work showed that the adsorption of both dyes on both adsorbents followed the Langmuir isotherm models. The kinetic study confirmed that the adsorption of both dyes onto HC-230-4 and AC-850-5 follows a pseudo-second-order model, with intraparticle diffusion acting as a rate-limiting step, suggesting a multi-step adsorption mechanism.
Supplementary Materials
The following supporting information can be downloaded at https://www.mdpi.com/article/10.3390/molecules30193989/s1. Figure S1. N2 adsorption desorption isotherm of commercial activated carbon. Figure S2. (a) Langmuir (b) Freundlich, (c) Temkin and (d) D-R isotherm for the adsorption of AYG onto HC-230-4 at different temperatures. Figure S3. (a) Langmuir (b) Freundlich, (c) Temkin and (d) D-R isotherm for the adsorption of ABO onto HC-230-4 at different temperatures. Figure S4. Adsorption isotherm for the removal of ABO onto (a) HC-230-4 and (b) AC-850-5 at different temperatures. Figure S5. Van’t Hoff plot for the adsorption of AYG and ABO onto HC-230-4 at 25 °C. Figure S6. (a) PFO; (b) PSO and (c) Elovich kinetic plots for the adsorption of AYG and ABO onto HC-230-4 (Ci: 6 × 10⁻⁵M; T: 25 °C).
Author Contributions
S.: Conceptualization; Funding acquisition; Investigation; Resources; Supervision; Writing—original draft; and Writing—review and editing. S.C. (Shubham Chaudhary): Formal analysis; Investigation; Methodology; Writing—original draft; and Writing—review and editing. M.C.: Formal analysis; and Writing—review and editing. S.K.: Formal analysis; Visualization; Writing—original draft; and Writing—review and editing. S.C. (Shivangi Chaubey): Methodology; and Writing—review and editing. V.T.: Methodology; and Writing—review and editing. I.P.d.P.C.: Visualization, Writing—review and editing; E.G.: Software; and Writing—review and editing. All authors have read and agreed to the published version of the manuscript.
Funding
This research was funded by DST, New Delhi, India, under Water Technology Initiative (Project No: DST/TMD/EWO/WTI/2K19/EWFH/2019/90).
Institutional Review Board Statement
Not applicable.
Informed Consent Statement
Not applicable.
Data Availability Statement
Data will be made available upon request.
Acknowledgments
The authors are thankful to DST, New Delhi, India for providing the financial support.
Conflicts of Interest
The authors declare no conflicts of interests.
References
- Jawad, A.H.; Rashid, R.A.; Ishak, M.A.M.; Wilson, L.D. Adsorption of methylene blue onto activated carbon developed from biomass waste by H2SO4 activation: Kinetic, equilibrium and thermodynamic studies. Desalin. Water Treat. 2016, 57, 25194–25206. [Google Scholar] [CrossRef]
- Ghaedi, M.; Karimi, F.; Barazesh, B.; Sahraei, R.; Daneshfar, A. Removal of reactive orange 12 from aqueous solutions by adsorption on tin sulfide nanoparticle loaded on activated carbon. J. Ind. Eng. Chem. 2013, 19, 756–763. [Google Scholar] [CrossRef]
- El Qada, E.N.; Allen, S.J.; Walker, G.M. Adsorption of methylene blue onto activated carbon produced from steam activated bituminous coal: A study of equilibrium adsorption isotherm. Chem. Eng. J. 2006, 124, 103–110. [Google Scholar] [CrossRef]
- Gupta, V.K.; Suhas. Application of low-cost adsorbents for dye removal—A review. J. Environ. Manag. 2009, 90, 2313–2342. [Google Scholar] [CrossRef]
- Qu, S.; Huang, F.; Yu, S.; Chen, G.; Kong, J. Magnetic removal of dyes from aqueous solution using multi-walled carbon nanotubes filled with Fe2O3 particles. J. Hazard. Mater. 2008, 160, 643–647. [Google Scholar] [CrossRef] [PubMed]
- Farhan Hanafi, M.; Sapawe, N. A review on the water problem associate with organic pollutants derived from phenol, methyl orange, and remazol brilliant blue dyes. Mater. Today Proc. 2020, 31, A141–A150. [Google Scholar] [CrossRef]
- Bhagavathi Pushpa, T.; Vijayaraghavan, J.; Sardhar Basha, S.J.; Sekaran, V.; Vijayaraghavan, K.; Jegan, J. Investigation on removal of malachite green using EM based compost as adsorbent. Ecotoxicol. Environ. Saf. 2015, 118, 177–182. [Google Scholar] [CrossRef]
- Rajabi, M.; Mahanpoor, K.; Moradi, O. Removal of dye molecules from aqueous solution by carbon nanotubes and carbon nanotube functional groups: Critical review. Rsc Adv. 2017, 7, 47083–47090. [Google Scholar] [CrossRef]
- Mao, J.; Won, S.W.; Min, J.; Yun, Y.-S. Removal of basic blue 3 from aqueous solution by Corynebacterium glutamicum biomass: Biosorption and precipitation mechanisms. Korean J. Chem. Eng. 2008, 25, 1060–1064. [Google Scholar] [CrossRef]
- Kausar, A.; Iqbal, M.; Javed, A.; Aftab, K.; Nazli, Z.-i.-H.; Bhatti, H.N.; Nouren, S. Dyes adsorption using clay and modified clay: A review. J. Mol. Liq. 2018, 256, 395–407. [Google Scholar] [CrossRef]
- Allen, R.L. Colour Chemistry; Springer Science & Business Media: New York, NY, USA, 2013. [Google Scholar]
- Nassar, H.F. Comparing the Efficiency of Nanostructured Pure and Modified ZnO in the Photocatalytic Degradation of Acridine Orange Dye from Wastewater. Egypt. J. Chem. 2022, 65, 617–623. [Google Scholar] [CrossRef]
- Aliyeva, S. Adsorption of acridine yellow G from aqueous solutions using functionalized graphene nanoplatelets/modified polybutadiene hybrid composite. J. Chin. Chem. Soc. 2020, 67, 2071–2081. [Google Scholar] [CrossRef]
- Ihaddaden, S.; Aberkane, D.; Boukerroui, A.; Robert, D. Removal of methylene blue (basic dye) by coagulation-flocculation with biomaterials (bentonite and Opuntia ficus indica). J. Water Process Eng. 2022, 49, 102952. [Google Scholar] [CrossRef]
- Verma, A.K.; Raghukumar, C.; Parvatkar, R.R.; Naik, C.G. A rapid two-step bioremediation of the anthraquinone dye, reactive blue 4 by a marine-derived fungus. Water Air Soil Pollut. 2012, 223, 3499–3509. [Google Scholar] [CrossRef]
- Abdel-Aziz, M.H.; Bassyouni, M.; Zoromba, M.S.; Alshehri, A.A. Removal of dyes from waste solutions by anodic oxidation on an array of horizontal graphite rods anodes. Ind. Eng. Chem. Res. 2019, 58, 1004–1018. [Google Scholar] [CrossRef]
- Kadhim, R.J.; Al-Ani, F.H.; Al-shaeli, M.; Alsalhy, Q.F.; Figoli, A. Removal of dyes using graphene oxide (GO) mixed matrix membranes. Membranes 2020, 10, 366. [Google Scholar] [CrossRef] [PubMed]
- Anushree, C.; Philip, J. Efficient removal of methylene blue dye using cellulose capped Fe3O4 nanofluids prepared using oxidation-precipitation method. Colloids Surf. A Physicochem. Eng. Asp. 2019, 567, 193–204. [Google Scholar] [CrossRef]
- Sakthisharmila, P.; Palanisamy, P.N.; Manikandan, P. Removal of benzidine based textile dye using different metal hydroxides generated in situ electrochemical treatment-A comparative study. J. Clean. Prod. 2018, 172, 2206–2215. [Google Scholar] [CrossRef]
- Chaudhary, M.; Suhas; Singh, R.; Yilmaz, M.; Chaudhary, S.; Kushwaha, S. Role of the similar molecular weight dyes on the adsorption by activated carbon. Desalin. Water Treat. 2021, 244, 343–354. [Google Scholar] [CrossRef]
- Santaeufemia, S.; Abalde, J.; Torres, E. Efficient removal of dyes from seawater using as biosorbent the dead and living biomass of the microalga Phaeodactylum tricornutum: Equilibrium and kinetics studies. J. Appl. Phycol. 2021, 33, 3071–3090. [Google Scholar] [CrossRef]
- Crini, G. Non-conventional low-cost adsorbents for dye removal: A review. Bioresour. Technol. 2006, 97, 1061–1085. [Google Scholar] [CrossRef]
- Chaudhary, M.; Suhas; Singh, R.; Tyagi, I.; Ahmed, J.; Chaudhary, S.; Kushwaha, S. Microporous activated carbon as adsorbent for the removal of noxious anthraquinone acid dyes: Role of adsorbate functionalization. J. Environ. Chem. Eng. 2021, 9, 106308. [Google Scholar] [CrossRef]
- Suhas; Kushwaha, S.; Tyagi, I.; Ahmed, J.; Chaudhary, S.; Chaudhary, M.; Stephen Inbaraj, B.; Goscianska, J.; Karri, R.R.; Sridhar, K. Adsorptive analysis of azo dyes on activated carbon prepared from Phyllanthus emblica fruit stone sequentially via hydrothermal treatment. Agronomy 2022, 12, 2134. [Google Scholar] [CrossRef]
- Ali, I. The quest for active carbon adsorbent substitutes: Inexpensive adsorbents for toxic metal ions removal from wastewater. Sep. Purif. Rev. 2010, 39, 95–171. [Google Scholar] [CrossRef]
- Zubrik, A.; Matik, M.; Hredzák, S.; Lovás, M.; Danková, Z.; Kováčová, M.; Briančin, J. Preparation of chemically activated carbon from waste biomass by single-stage and two-stage pyrolysis. J. Clean. Prod. 2017, 143, 643–653. [Google Scholar] [CrossRef]
- Isemin, R.; Melezhyk, A.; Kuzmin, S.; Nebyvayev, A.; Muratova, N.; Mikhalev, A.; Milovanov, O.; Teplitskii, Y.; Buchilko, E.; Pitsukha, E. Production of activated carbon from biochar obtained by wet torrefaction of chicken manure as sole feedstock, and in mixture with sawdust in a fluidized bed powered with superheated steam. Chem. Eng. Trans. 2021, 86, 1519–1524. [Google Scholar] [CrossRef]
- Maneerung, T.; Liew, J.; Dai, Y.; Kawi, S.; Chong, C.; Wang, C.-H. Activated carbon derived from carbon residue from biomass gasification and its application for dye adsorption: Kinetics, isotherms and thermodynamic studies. Bioresour. Technol. 2016, 200, 350–359. [Google Scholar] [CrossRef]
- Abdel-Ghani, N.T.; El-Chaghaby, G.A.; Rawash, E.-S.A.; Lima, E.C. Adsorption of coomassie brilliant blue R-250 dye onto novel activated carbon prepared from Nigella sativa l. waste: Equilibrium, kinetics and thermodynamics. J. Chil. Chem. Soc. 2017, 62, 3505–3511. [Google Scholar] [CrossRef]
- El mahbouby, A.; Ezaier, Y.; Zyade, S.; Mechnou, I. Elaboration and Characterization of Organo-Ghassoul (Moroccan Clay) as an Adsorbent Using Cationic Surfactant for Anionic Dye Adsorption. Phys. Chem. Res. 2023, 11, 913–928. [Google Scholar] [CrossRef]
- Aksu, Z.; Akın, A.B. Comparison of remazol black B biosorptive properties of live and treated activated sludge. Chem. Eng. J. 2010, 165, 184–193. [Google Scholar] [CrossRef]
- Feng, S.; Shi, H. Spectroscopic study on the interaction of acridine yellow with adenosine disodium triphosphate and its analytical application. Spectrochim. Acta Part A Mol. Biomol. Spectrosc. 2007, 68, 244–249. [Google Scholar] [CrossRef]
- da Silva Lacerda, V.; López-Sotelo, J.B.; Correa-Guimarães, A.; Hernández-Navarro, S.; Sánchez-Báscones, M.; Navas-Gracia, L.M.; Martín-Ramos, P.; Martín-Gil, J. Rhodamine B removal with activated carbons obtained from lignocellulosic waste. J. Environ. Manag. 2015, 155, 67–76. [Google Scholar] [CrossRef]
- Suhas; Chaudhary, M.; Chaudhary, S.; Chaubey, S.; da Paixão Cansado, I.P.; Dehghani, M.H.; Tyagi, I.; Gaur, R. Transforming Biomass Waste into Hydrochars and Porous Activated Carbon: A Characterization Study. Resources 2025, 14, 34. [Google Scholar] [CrossRef]
- Carrott, P.J.M.; Carrott, M.M.L.R.; Vale, T.S.C.; Marques, L.; Nabais, J.M.V.; Mourão, P.A.M.; Suhas. Characterisation of Surface Ionisation and Adsorption of Phenol and 4-Nitrophenol on Non-Porous Carbon Blacks. Adsorpt. Sci. Technol. 2008, 26, 827–841. [Google Scholar] [CrossRef]
- Kızıltaş, H. Production of highly effective adsorbent from tea waste, and its adsorption behaviors and characteristics for the removal of rhodamine B. Int. J. Environ. Anal. Chem. 2022, 104, 1730–1749. [Google Scholar] [CrossRef]
- Al-Ghouti, M.A.; Da’ana, D.A. Guidelines for the use and interpretation of adsorption isotherm models: A review. J. Hazard. Mater. 2020, 393, 122383. [Google Scholar] [CrossRef] [PubMed]
- Langmuir, I. The adsorption of gases on plane surfaces of glass, mica and platinum. J. Am. Chem. Soc. 1918, 40, 1361–1403. [Google Scholar] [CrossRef]
- Hameed, B.H. Equilibrium and kinetic studies of methyl violet sorption by agricultural waste. J. Hazard. Mater. 2008, 154, 204–212. [Google Scholar] [CrossRef]
- Weber, T.W.; Chakravorti, R.K. Pore and solid diffusion models for fixed-bed adsorbers. AIChE J. 1974, 20, 228–238. [Google Scholar] [CrossRef]
- Freundlich, H. Over the adsorption in solution. J. Phys. Chem. 1906, 57, 1100–1107. [Google Scholar]
- Konicki, W.; Aleksandrzak, M.; Moszyński, D.; Mijowska, E. Adsorption of anionic azo-dyes from aqueous solutions onto graphene oxide: Equilibrium, kinetic and thermodynamic studies. J. Colloid Interface Sci. 2017, 496, 188–200. [Google Scholar] [CrossRef]
- Temkin, M. Kinetics of ammonia synthesis on promoted iron catalysts. Acta Physiochim. URSS 1940, 12, 327–356. [Google Scholar]
- Chu, K.H. Revisiting the Temkin Isotherm: Dimensional Inconsistency and Approximate Forms. Ind. Eng. Chem. Res. 2021, 60, 13140–13147. [Google Scholar] [CrossRef]
- Dubinin, M. The equation of the characteristic curve of activated charcoal. Dokl. Akad. Nauk. SSSR. 1947, 55, 327–329. [Google Scholar]
- El-Shafie, A.S.; Hassan, S.S.; Akther, N.; El-Azazy, M. Watermelon rinds as cost-efficient adsorbent for acridine orange: A response surface methodological approach. Environ. Sci. Pollut. Res. 2023, 30, 71554–71573. [Google Scholar] [CrossRef] [PubMed]
- Huang, G.; Shi, J.X.; Langrish, T.A.G. Removal of Cr(VI) from aqueous solution using activated carbon modified with nitric acid. Chem. Eng. J. 2009, 152, 434–439. [Google Scholar] [CrossRef]
- Khezami, L.; Capart, R. Removal of chromium(VI) from aqueous solution by activated carbons: Kinetic and equilibrium studies. J. Hazard. Mater. 2005, 123, 223–231. [Google Scholar] [CrossRef]
- Lei, M.; Yang, L.; Shen, Y.; Yang, L.; Sun, J. Efficient adsorption of anionic dyes by ammoniated waste polyacrylonitrile fiber: Mechanism and practicability. ACS Omega 2021, 6, 19506–19516. [Google Scholar] [CrossRef]
- Husien, S.; El-taweel, R.M.; Salim, A.I.; Fahim, I.S.; Said, L.A.; Radwan, A.G. Review of activated carbon adsorbent material for textile dyes removal: Preparation, and modelling. Curr. Res. Green Sustain. Chem. 2022, 5, 100325. [Google Scholar] [CrossRef]
- Atkins, P.; Atkins, P.W.; de Paula, J. Atkins’ Physical Chemistry; Oxford University Press: Oxford, UK, 2014. [Google Scholar]
- Harrache, Z.; Abbas, M.; Aksil, T.; Trari, M. Thermodynamic and kinetics studies on adsorption of indigo carmine from aqueous solution by activated carbon. Microchem. J. 2019, 144, 180–189. [Google Scholar] [CrossRef]
- Lagergren, S.K. About the theory of so-called adsorption of soluble substances. Sven. Vetenskapsakad. Handingarl 1898, 24, 1–39. [Google Scholar]
- Ho, Y.S.; McKay, G. Sorption of dye from aqueous solution by peat. Chem. Eng. J. 1998, 70, 115–124. [Google Scholar] [CrossRef]
- Elovich, S. Proceedings of the second international congress on surface activity. In Proceedings of Teh Second International Congress on Surface Activity; Academic Press Inc.: New York, NY, USA, 1959. [Google Scholar]
- Morris, J.C.; Weber, W.J. Advances in Water Pollution Research: Removal of Biologically Resistant Pollutant from Wastewater by Adsorption. Proceedings of 1st International Conference on Water Pollution Symposium. 1962, pp. 231–266. Available online: https://www.scirp.org/reference/referencespapers?referenceid=2806624 (accessed on 5 June 2025).
- Mechnou, I.; Meskini, S.; Elqars, E.; Ait El Had, M.; Hlaibi, M. Efficient CO2 capture using a novel Zn-doped activated carbon developed from agricultural liquid biomass: Adsorption study, mechanism and transition state. Surf. Interfaces 2024, 52, 104846. [Google Scholar] [CrossRef]
- Duran, C.; Ozdes, D.; Gundogdu, A.; Senturk, H.B. Kinetics and isotherm analysis of basic dyes adsorption onto almond shell (Prunus dulcis) as a low cost adsorbent. J. Chem. Eng. Data 2011, 56, 2136–2147. [Google Scholar] [CrossRef]
Disclaimer/Publisher’s Note: The statements, opinions and data contained in all publications are solely those of the individual author(s) and contributor(s) and not of MDPI and/or the editor(s). MDPI and/or the editor(s) disclaim responsibility for any injury to people or property resulting from any ideas, methods, instructions or products referred to in the content. |
© 2025 by the authors. Licensee MDPI, Basel, Switzerland. This article is an open access article distributed under the terms and conditions of the Creative Commons Attribution (CC BY) license (https://creativecommons.org/licenses/by/4.0/).
