1. Introduction
Arachidonic acid, i.e., eicosatetraenoic acid, is the precursor of multiple metabolites, collectively named eicosanoids [
1,
2]. They include prostaglandins (PGs) and leukotrienes (LTs). Cyclooxygenase (COX) catalyzes the formation of prostaglandin (PG) PGF
2α ((5
Z,9α,11α,13
E,15
S)-9,11,15-trihydroxyprosta-5,13-dien-1-acid) and can also catalyze the formation of its isomer 8-i
so-PGF
2α ((5Z,9α,11α,13
E,15
S)-9,11,15-trihydroxyprosta-5,13-dien-1-acid). Four classes of F
2-prostaglandins, widely known as F
2-isoprostanes, differ in regiochemistry (
Figure S1). In theory, 64 isomers of F
2-prostaglandins may exist in total [
3]. Besides PGF
2α and 8-
iso-PGF
2α, F
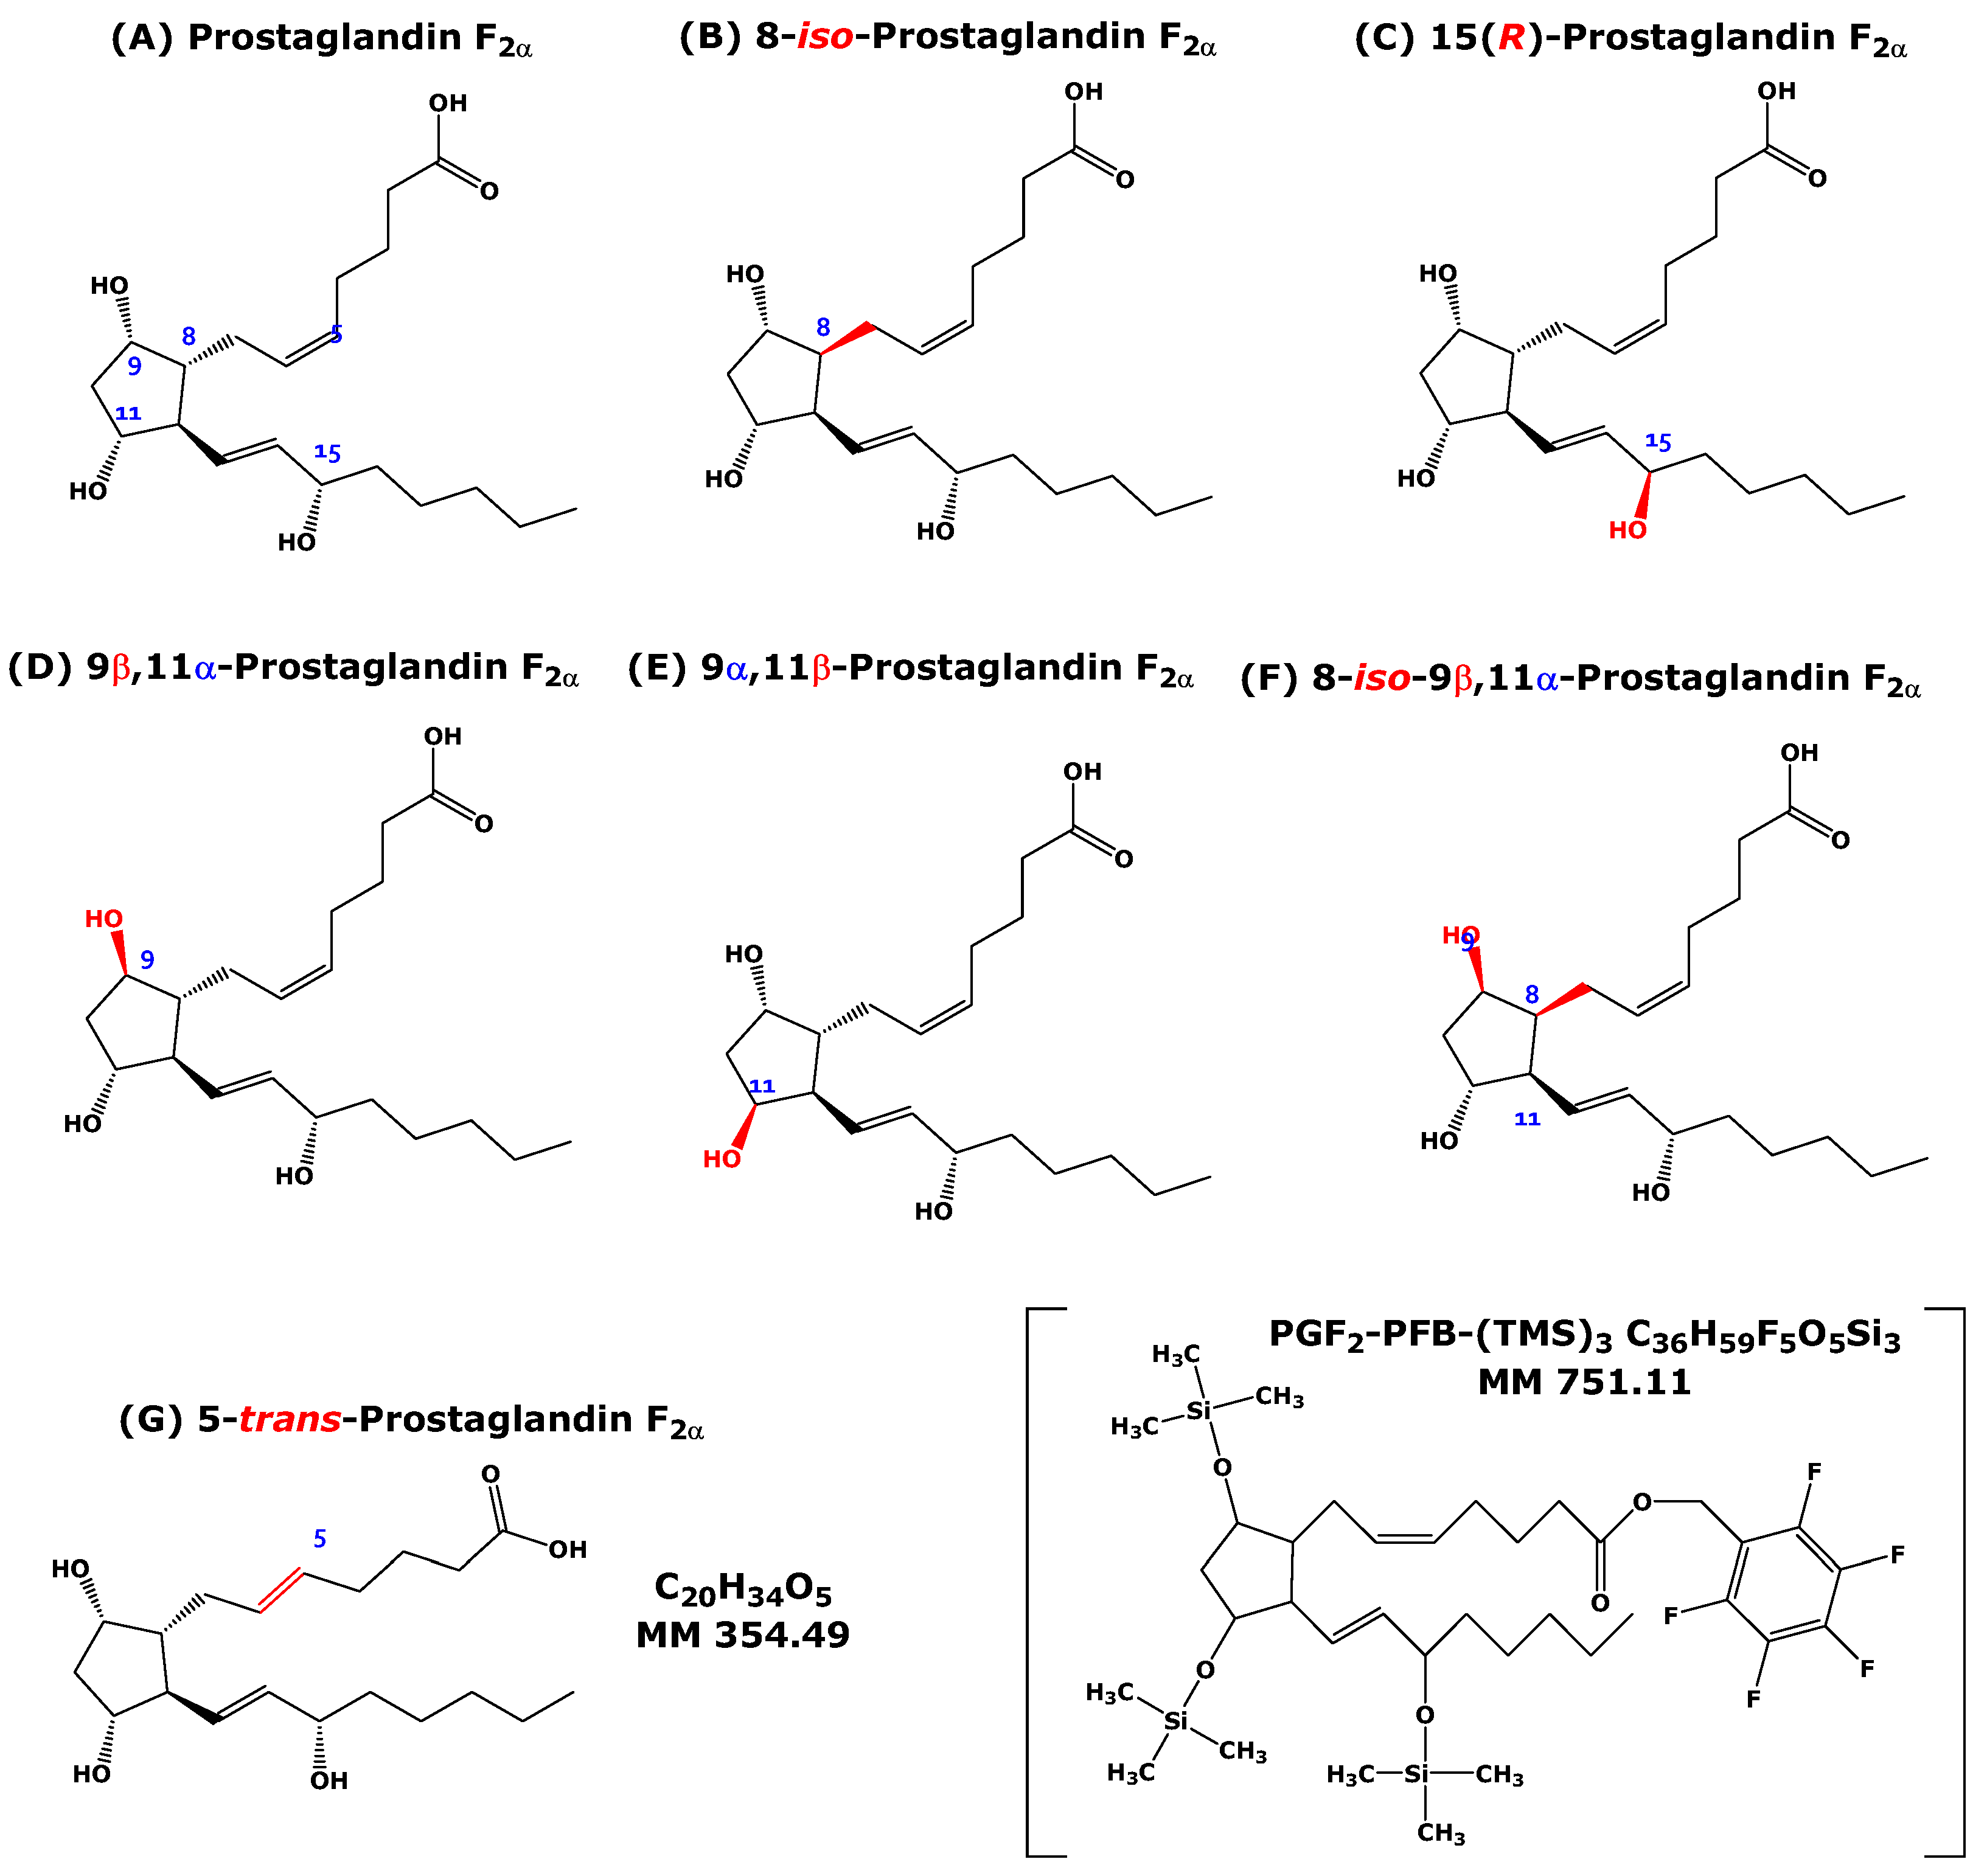
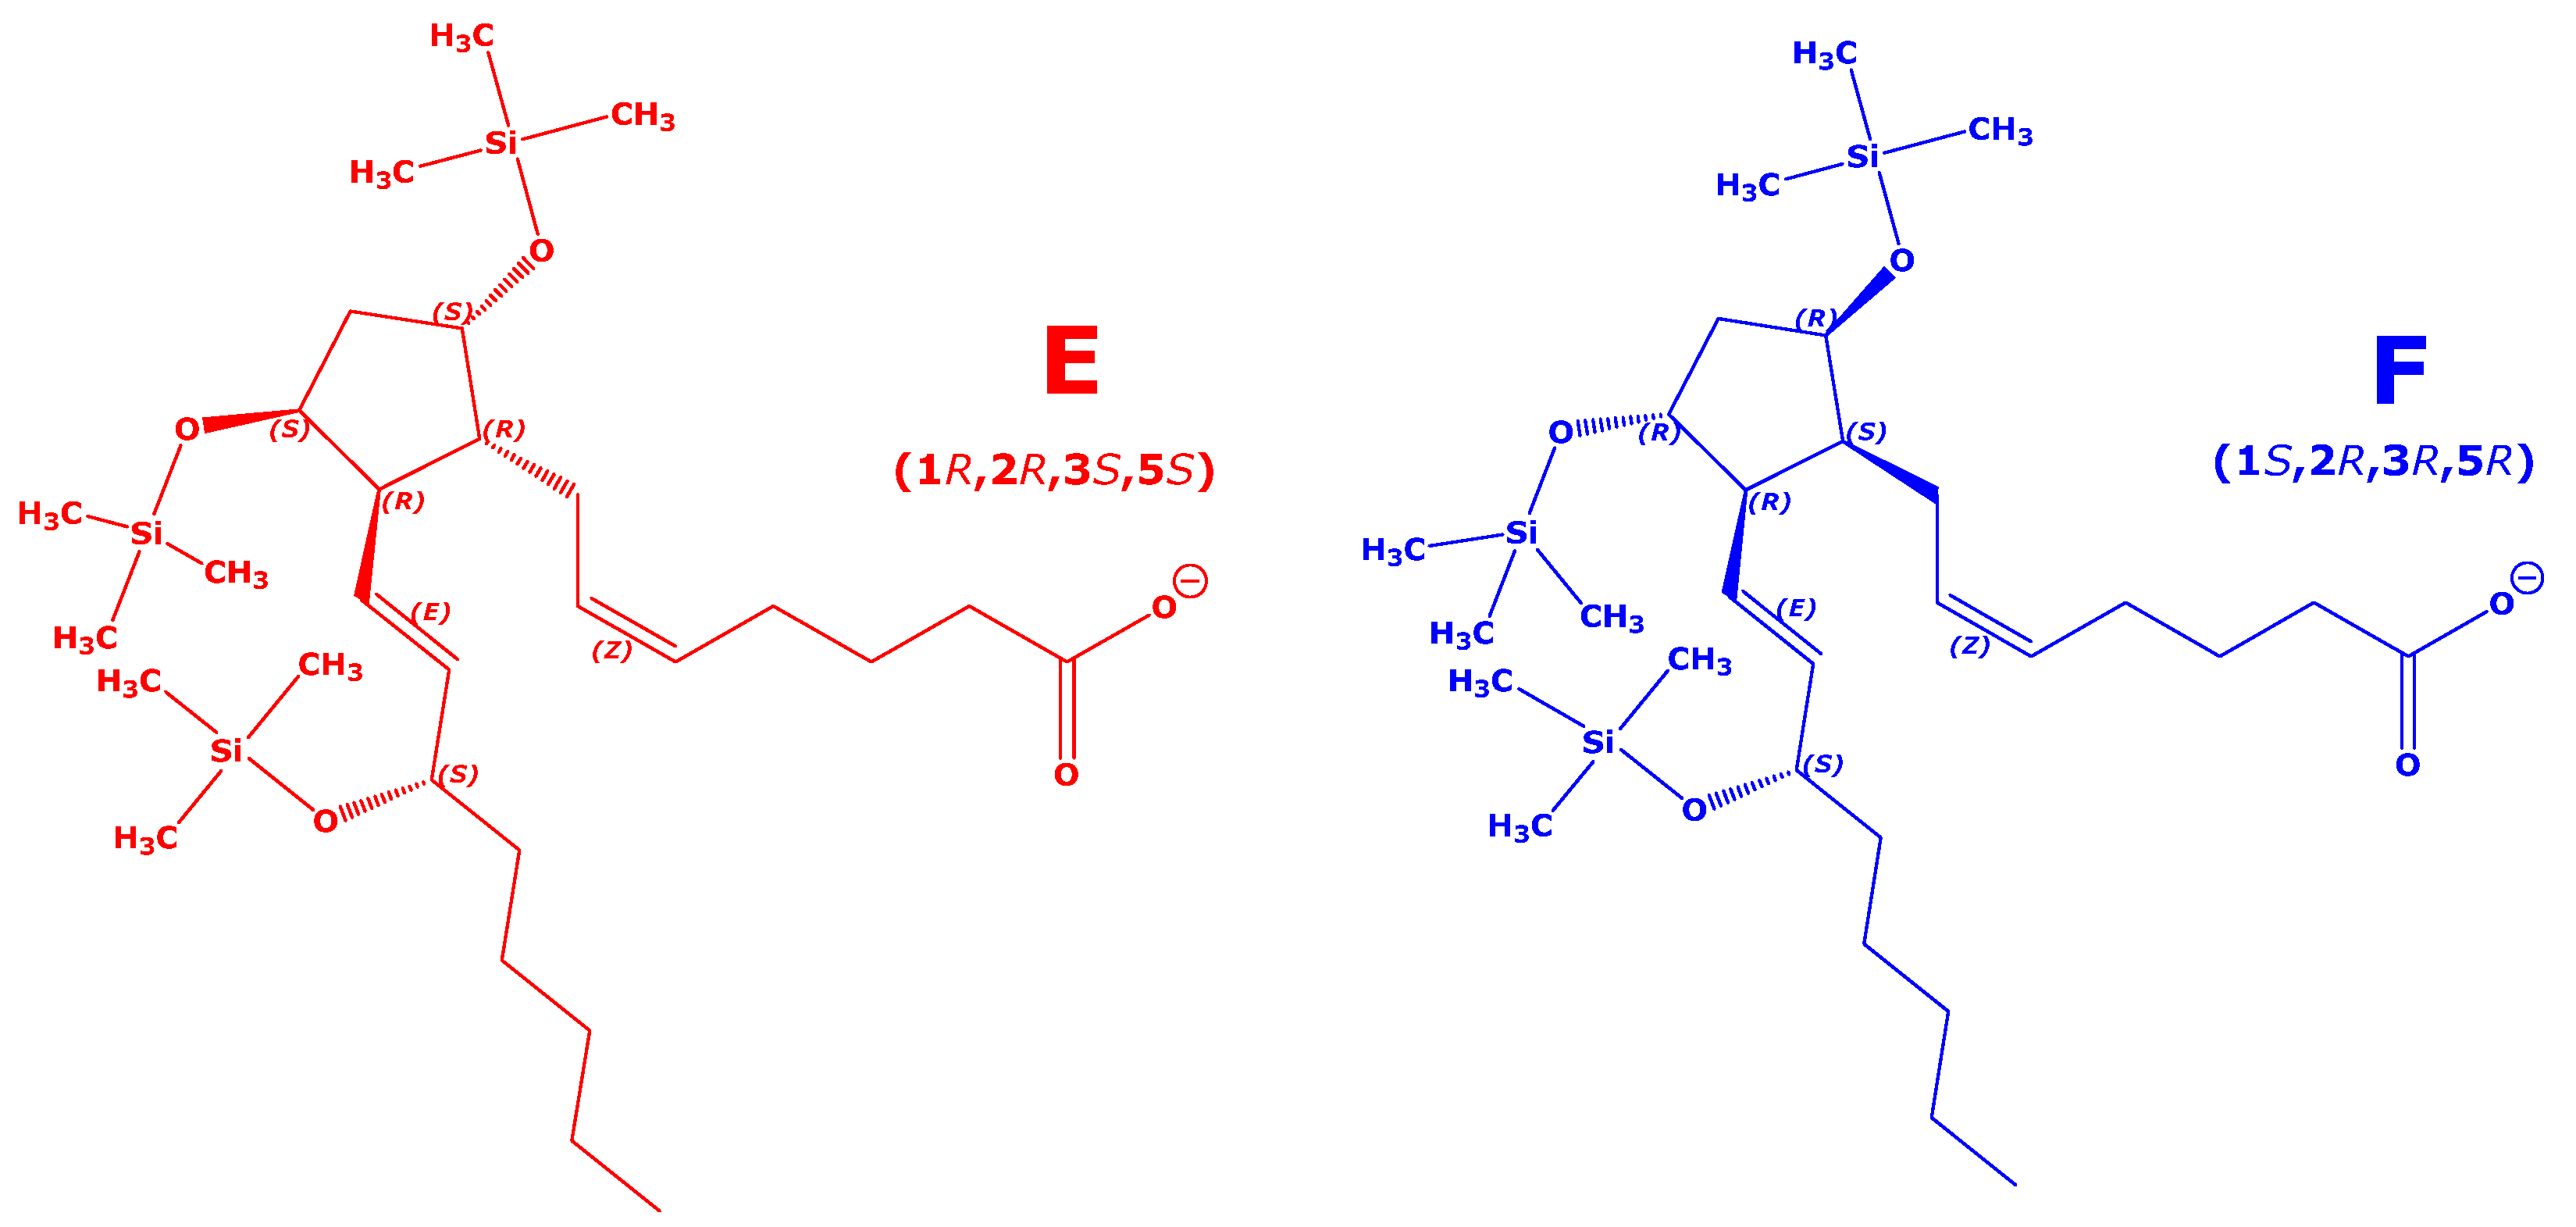
2-prostaglandins include the structures shown in
Figure 1 (see also
Table S1 in the Supplementary Materials). They all have the formula C
20H
34O
5, the molecular mass 354.48, a cyclopentane ring, and three hydroxyl groups at C-9, C-11, and C-15. Two OH groups are positioned on the cyclopentane ring (C-9 and C-11). The cyclopentane ring carries two residues on C-8 and C-12, which are differently oriented in space. The
α-chain on C-8 carries a carboxylic group, while the
β-chain or
w-chain on C-12 is a hydroxylated olefinic alkyl. These F
2-prostaglandin isomers have been analyzed by GC-MS/MS in the NICI mode by Ferretti and Flanagan [
4]. The GC-NICI-MS/MS mass spectra of these isomeric F
2-prostaglandins are the subject of the present work.
F
2-Isoprostanes have been analyzed in biological samples by GC-MS or GC-MS/MS as pentafluorobenzyl (PFB) ester trimethylsilyl (TMS) ether derivatives (PFB-TMS) in the NICI mode (
Figure 2). In the first derivatization reaction, the carboxylic group is converted by PFB-Br in acetonitrile to its PFB ester derivative. This reaction is catalyzed by organic bases such as
N,
N-diisopropylethylamine. Subsequently, the PFB ester derivative is silylated by means of silylating agents such as BSTFA (
N,
O-bis(trimethylsilyl)trifluoroacetamide) to generate the PFB ester TMS ether derivatives [
5]. Divergence in urinary 8-
iso-PGF
2α concentrations from GC-NICI-MS/MS quantification after thin-layer chromatography and immunoaffinity column chromatography revealed the heterogeneity of 8-
iso-PGF
2α, which consists at least of 15(
S)-8-
iso-PGF
2α [
5] and presumably of 15(
R)-8-
iso-PGF
2α [
6]. Non-derivatized F
2-isoprostanes and other eicosanoids can be analyzed by LC-MS/MS using negative electrospray ionization (NESI), i.e., LC-NESI-MS/MS [
2,
6].
Quantitative determination of eicosanoids by GC-NICI-MS is performed by selected ion monitoring (SIM) of [M-PFB]
− ions that are generated by NICI of PFB-TMS derivatives (
Figure 2). In the case of F
2-prostaglandins, the common anions with
m/
z 569 [M-PFB]
− are generated by NICI of the PFB-TMS derivatives of all F
2-prostaglandin isomers. The number of isobaric F
2-prostaglandins is high. Anions with
m/
z 569 [M-PFB]
− are the most intense and therefore the most useful ions in quantitative GC-NICI-MS analyses of F
2-prostaglandins by SIM. The concentration of F
2-prostaglandins in biological samples is very low, usually lying in the pM range [
5,
6]. For these reasons and because of coelution or incomplete GC separation, GC-NICI-MS methods lack specificity for particular F
2-prostaglandins.
In general, higher specificity of eicosanoid analysis is achieved by quantitative GC-NICI-MS/MS analysis in the selected reaction monitoring (SRM) mode, even in the case of coelution of derivatives. Given the high chemical similarity of the F
2-prostaglandins, selection of both specific and abundant product ions generated by CID of the precursor ion
m/
z 569 [M-PFB]
− is not trivial (
Figure S2), but requires detailed GC-NICI-MS/MS studies with available synthetic F
2-prostaglandin compounds.
In this article, we review CID gas-phase reactions of PFB-TMS derivatives of F
2-prostaglandins, which consist of PGF
2α, 8-
iso-PGF
2α, and up to 62 further isomers, known as the F
2-isoprostanes. The paper is a meta-analysis of the CID mass spectra (32 eV) of the PFB-(TMS)
3 derivatives of seven chemically closely related isomeric F
2-prostaglandins that have been previously reported by Ferretti and Flanagan [
4] (
Figure 1). This unique dataset contains 19 product ions generated by CID of the common precursor ions at
m/
z 569 [M-PFB]
− in the
m/
z-range 150–600. Fragmentation pathways are proposed for the formation of the 19 product ions of the seven F
2-prostaglandins shown in
Figure 1.
Principal Component Analysis (PCA) and Receiver Operating Characteristic (ROC) Analysis (ROCA) are widely used chemometric analytical tools in qualitative studies to detect and visualize differences and agreements between tested groups of analytes, notably in metabolomics studies [
7,
8,
9,
10,
11]. In the present study, we tested the utility of PCA and ROCA as additional analytical approaches to resolve the CID behavior of the seven isomeric F
2-prostaglandins shown in
Figure 1.
2. Methods
Ferretti and Flanagan performed a GC-NICI-MS/MS study on synthetic, structurally closely related F
2-prostaglandins of the 15-F
2t-IsoP type, including PGF
2α and 8-
iso-PGF
2α [
4]. 8-
iso-PGF
2α is one of the best investigated F
2-isoprostanes [
3]. Ferretti and Flanagan generated GC-NICI-MS/MS mass spectra (32 eV) of seven F
2-prostaglandins (
Figure 1), analyzed the individual GC-NICI-MS/MS mass spectra, and tabulated the
m/
z and relative intensity values of the remaining, non-fragmented precursor ion with
m/
z 569 and of the 19 product ions in the
m/
z range of 150–600. Unfortunately, retention times had been reported only for the PFB-TMS derivatives of 8-
iso-PGF
2α (9.4 min) and of 9α,11β-PGF
2α (10.9 min). In the present work, we used the originally reported data [
4] to reconstruct the GC-NICI-MS/MS mass spectra (see
Figure S3 and
Table 1 below). We conducted PCA, ROCA, and other statistical tests to visualize and detect potential differences between the seven F
2-prostaglandins. Such analyses could be useful to interpret the GC-NICI-MS/MS mass spectra and to outline potential CID mechanisms that may depend upon the structure of the chemically closely related F
2-prostaglandins. In this context, data previously reported by our group on stable-isotope-labeled 8-
iso-PGF
2α and its metabolites were used to complement the analyses [
12,
13].
PCA was performed with STATA 14 (StataCorp, College Station, TX, USA) and with SIMCA 13.0.2 (UMETRICS AB, Umea, Sweden) in unit variance (UV) scaling. Data were further analyzed with PLS-DA, OPLS, and OPLS-DA. The validity of the obtained models was assessed using the cross-validation parameters (R2X: R2Y and Q2Y), in combination with loadings, permutation, and VIP plots, and the
p-value of cross-validated analysis of variance (CV-ANOVA). Only features with VIP value > 1 were considered statistically significant. GraphPad Prism was used for statistical analyses and preparation of graphs. PCA was conducted on the relative intensity values of the product ions of the seven F
2-prostaglandins obtained from the GC-NICI-MS/MS analyses originally performed by Ferretti and Flanagan [
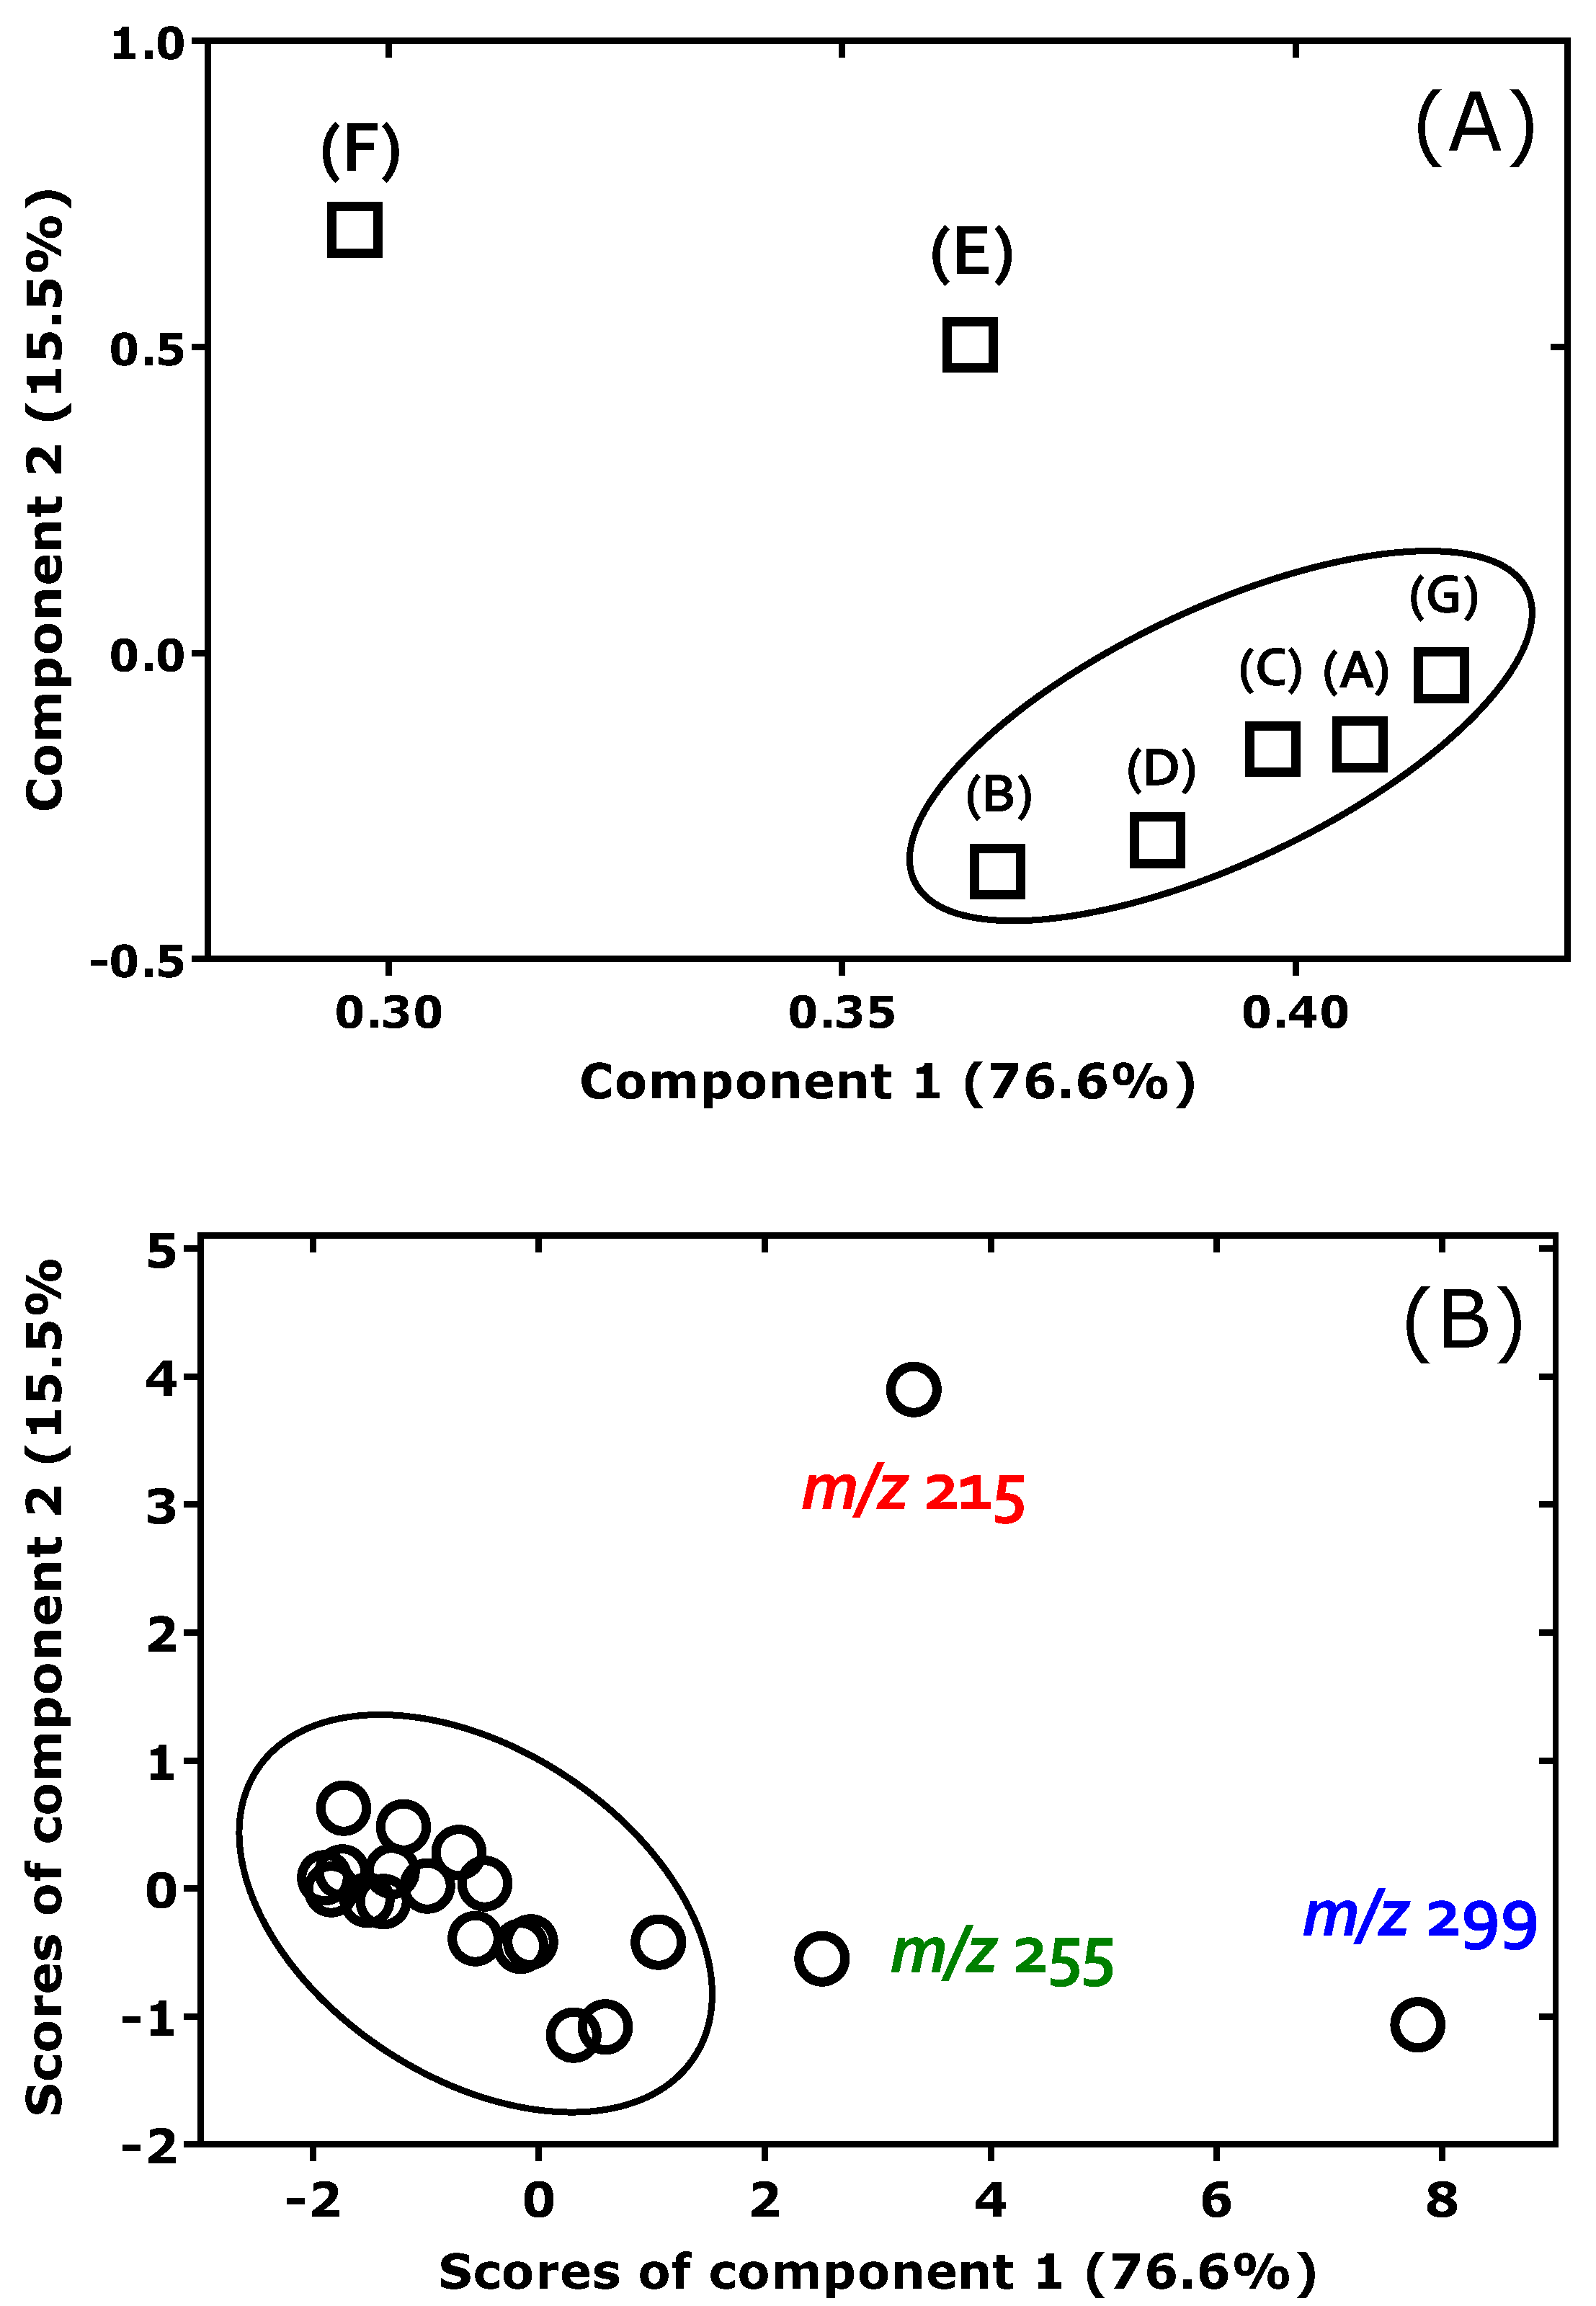
4]. A plot of compound loadings and component scores retrieved from PCA is graphically presented in
Figure 3.
GraphPad Prism Version 7 for Windows (GraphPad Software, San Diego, CA, USA) and STATA 14 (StataCorp, College Station, TX, USA) were used for PCA, k-means cluster analysis, and bi- and multivariate statistical tests. ROCA was used to calculate area under the curve (AUC) values and evaluate agreement/disagreement between the seven F2-prostaglandins. The Wilcoxon matched-pairs signed-rank test was used in two-tailed paired analyses. A p-value of <0.05 was considered significant.
Chemical structures and names of the investigated native and derivatized F2-prostaglandins, as well as of product ions, were drawn and suggested by ChemDraw 15.0 Professional (PerkinElmer, Rodgau, Germany). The Clean Up Structure tool was used in drawing the structures of F2-prostaglandins.
3. Results
Twenty product ions, including the remaining, non-fragmented precursor ion
m/
z 569 (intensity range, 7–42%), were detected within a relative intensity ranging from <1% to 100%. The same product ions were observed from all F
2-prostaglandins. F
2-Prostaglandins with product ions with intensity values <1% had generally intense product ions of very low intensity. The most intense product ions (base peaks, intensity of 100%) were
m/
z 299 for the F
2-prostaglandins, abbreviated as A, B, C, D, and G, and
m/
z 215 for the F
2-prostaglandins, abbreviated as E and F (
Table 1).
The results of PCA, based on the data listed in
Table 1, are presented in
Figure 3.
Figure 3A shows that all F
2-prostaglandins load positively on Component 1 (Eigenvalue 5.36; 76.6% of the total variance explained), suggesting that this component reflects a shared variance structure across compounds, likely associated with overall intensity or common chemical behavior. In contrast, Component 2 (Eigenvalue 1.08; 15.5% of the total variance explained) differentiates the variables more distinctly: the isomers 8-
iso-9β,11α-PGF
2α and PGF
2α have strong positive loadings, while the remaining five isomers exhibit negative loadings of varying magnitude. This separation implies that Component 2 covers a secondary dimension of variation, potentially related to structural isomerism or specific fragmentation behavior in the collision cell of the GC-MS/MS apparatus. F
2-Prostaglandins clustering closely in the plot, e.g., PGF
2α and 15(
R)-PGF
2α, indicate closely related MS/MS properties. Thus, PGF
2α and 15(
R)-PGF
2α differ “only” in the spatial orientation of the OH group on C-15 on the β-chain (i.e.,
S versus
R).
The PCA score plot in
Figure 3B illustrates the distribution of the product ions from
m/
z 569 in the space defined by the first two principal components, which together explain 92% of the variance in the data. Each point represents the position of each product ion along Component 1 and Component 2. The score plot reveals considerable spread along Component 1, suggesting that the
x-axis covers the dominant variance across the
m/
z values, likely driven by overall intensity differences of PGF
2 isomers with high loadings on Component 1 as seen in the loading plot (
Figure 3A). Component 2 contributes less to the overall separation but highlights a small number of
m/
z values with distinctive profiles, notably
m/
z 215 (strongly positive on Component 2) and
m/
z 299 (strongly negative on Component 2) (
Figure 3B).
Guided by visual inspection of the PCA score plot, k-means clustering (k = 3) was applied, resulting in three chemically distinct sample groups (“cluster”):
- (1)
Group 3:
m/
z 299 and
m/
z 215 (i.e., the two outliers in
Figure 3B).
- (2)
Group 2: m/z 569, m/z 317, m/z 273, m/z 255, m/z 219, and m/z 161.
- (3)
Group 1: all remaining m/z values.
The location of Groups 3 and 2 at the periphery of the PCA plot (
Figure 3B), especially along Component 2, supports their outlier-like behavior in terms of multivariate compound intensities.
Statistical testing confirmed that the clusters differ significantly: a Kruskal–Wallis test indicated group differences in the intensity values of individual PGF2 isomers, and a MANOVA showed a jointly significant multivariate difference across the PGF2 isomers. These results suggest that PCA-based clustering illustrates differences between groups with regard to their CID behavior.
Figure 4 shows the results of the statistical analysis of the intensity values of the ions summarized in
Table 1. The most intense ions were found to be
m/
z 299, 215, 255, 273, 161, and 219.
No correlations were found between 8-
iso-9β,11α-PGF
2α and PGF
2α, 8-
iso-PGF
2α, 15(
R)-PGF
2α, 9β,11α-PGF2α, or 5-
trans-PGF
2α (see
Supplementary Materials). The highest Spearman correlation coefficient (
rS) was observed between 8-
iso-PGF
2α and 15(
R)-PGF
2α:
rS = 0.903 and
p = 5×10
−8. It should be noted that urinary 8-
iso-PGF
2α consists of 15(
S)-8-
iso-PGF
2α and 15(
R)-8-
iso-PGF
2α [
5,
6]. In the present case, no data were available for 15(
R)-8-
iso-PGF
2α in the study reported by Ferretti and Flanagan [
4]. We have to assume that 8-
iso-PGF
2α analyzed by Ferretti and Flanagan [
4] is identical to 15(
S)-8-
iso-PGF
2α.
ROCA of the data revealed AUC values for the ROC curves, which were statistically significantly different only for the comparison of PGF
2α with 8-
iso-9β,11α-PGF
2α: AUC = 0.7075 ± 0.0834,
p = 0.0248 (mean ± SEM) (see
Supplementary Materials).
Commercially available [3,3,4,4-2H4]-8-iso-PGF2α has been used as an internal standard for the quantitative determination of 8-iso-PGF2α in biological samples, including urine and plasma or serum, by GC-NICI-MS and GC-NICI-MS/MS. [3,3,4,4-2H4]-8-iso-PGF2α (i.e., 15(S)-[3,3,4,4-2H4]-8-iso-PGF2α) has also been used to study the NICI and CID of their PFB-TMS derivatives. In general, the use of 2H labels is useful in mechanistic studies, as they provide additional information that is not revealed by using unlabeled material such as 8-iso-PGF2α.
The most intense ions in the GC-NICI-MS mass spectra were at m/z 569, 573, and 573 due to [M-PFB]−. No loss of 2H from [3,3,4,4-2H4]-8-iso-PGF2α was observed, indicating that NICI did not influence the stability of the labels in the PFB-(TMS)3 derivatives under the conditions used.
Table 2 summarizes the most intense product ions in the GC-NICI-MS/MS mass spectra of the PFB-(TMS)
3 derivatives of 8-
iso-PGF
2α and [3,3,4,4-
2H
4]-8-
iso-PGF
2α (i.e., both 15(
S)-8-
iso-PGF
2α and 15(
S)-[3,3,4,4-
2H
4]-8-
iso-PGF
2α), and of PGF
2α and [3,3,4,4-
2H
4]-PGF
2α. Neutral loss of one TMSOH group (90 Da) led to [M-PFB-1×TMSOH]
− at
m/
z 479, 483, and 483, respectively, with an intensity of about 15% each. Neutral loss of one (CH
3)
2Si=CH
2 group (72 Da) generated [M-PFB-1×TMSOH]
− at
m/
z 407, 411, and 411, respectively, with an intensity of about 12% each. The positions of the TMSO groups that lost TMSOH and (CH
3)
2Si=CH
2 are unknown. Several isomeric anions are likely to co-exist.
2,3-Dinor-8-
iso-PGF
2α and 2,3-dinor-5,6-dihydro-8-
iso-PGF
2α are enzymatic metabolites of 8-
iso-PGF
2α (
Figure S4), and
ent-2,3-dinor-5,6-dihydro-8-
iso-PGF
2α is considered a metabolite of
ent-8-
iso-PGF
2α. These isoprostanes have been analyzed by GC-NICI-MS and GC-NICI-MS/MS as PFB-(TMS)
3 derivatives [
13].
Table 3 summarizes the most intense ions in the GC-NICI-MS and GC-NICI-MS/MS mass spectra of the PFB-(TMS)
3 derivatives of synthetic 2,3-dinor-5,6-dihydro-8-
iso-PGF
2α,
ent-2,3-dinor-5,6-dihydro-8-
iso-PGF
2α. The α-chain of the 8-
iso-PGF
2αmetabolites is by two CH
2 groups shorter than its precursor in 2,3-dinor-8-
iso-PGF
2α; in 2,3-dinor-5,6-dihydro-8-
iso-PGF
2α, the C-5=C-6 double bond is saturated (
Figure S4).
Table 3.
Mass fragments (
m/
z, intensity, %) in the GC-NICI-MS and GC-NICI-MS/MS mass spectra of the PFB-TMS derivatives of 2,3-dinor-5,6-dihydro-8-
iso-PGF
2α and
ent-2,3-dinor-5,6-dihydro-8-
iso-PGF
2α. The ions [M-PFB]
− (P, precursor) were subjected to CID with argon (0.15 Pa) with a collision energy of 25 eV. NICI with methane (65 Pa) was performed (electron current, 200 eV; electron current, 600 µA). The instrument TSQ 7000 was used. The table was constructed with data reported in Ref. [
13].
| Ion Assignment | 2,3-Dinor-5,6-dihydro-8-iso-PGF2α | ent-2,3-Dinor-5,6-dihydro-8-iso-PGF2α |
|---|
| GC-NICI-MS |
| [M-PFB]− | 543 (100) | 543 (100) |
| [M-PFB-TMSOH]− | 453 (4) | 453 (3) |
| [M-PFB-TMSOH-(CH3)2Si=CH2]− | 381 (6) | 381 (5) |
| GC-NICI-MS/MS |
| [P]− | 543 (8) | 543 (10) |
| [P-TMSOH]− | 453 (5) | 453 (4) |
| [P-2×TMSOH]− | 363 (4) | 363 (5) |
| [P-2×TMSOH-(CH3)2Si=CH2]− | 291 (12) | 291 (14) |
| [P-3×TMSOH]− | 273 (100) | 273 (100) |
| see Figure 5 | 247 (22) | 247 (21) |
| see Figure 5 | 229 (35) | 229 (31) |
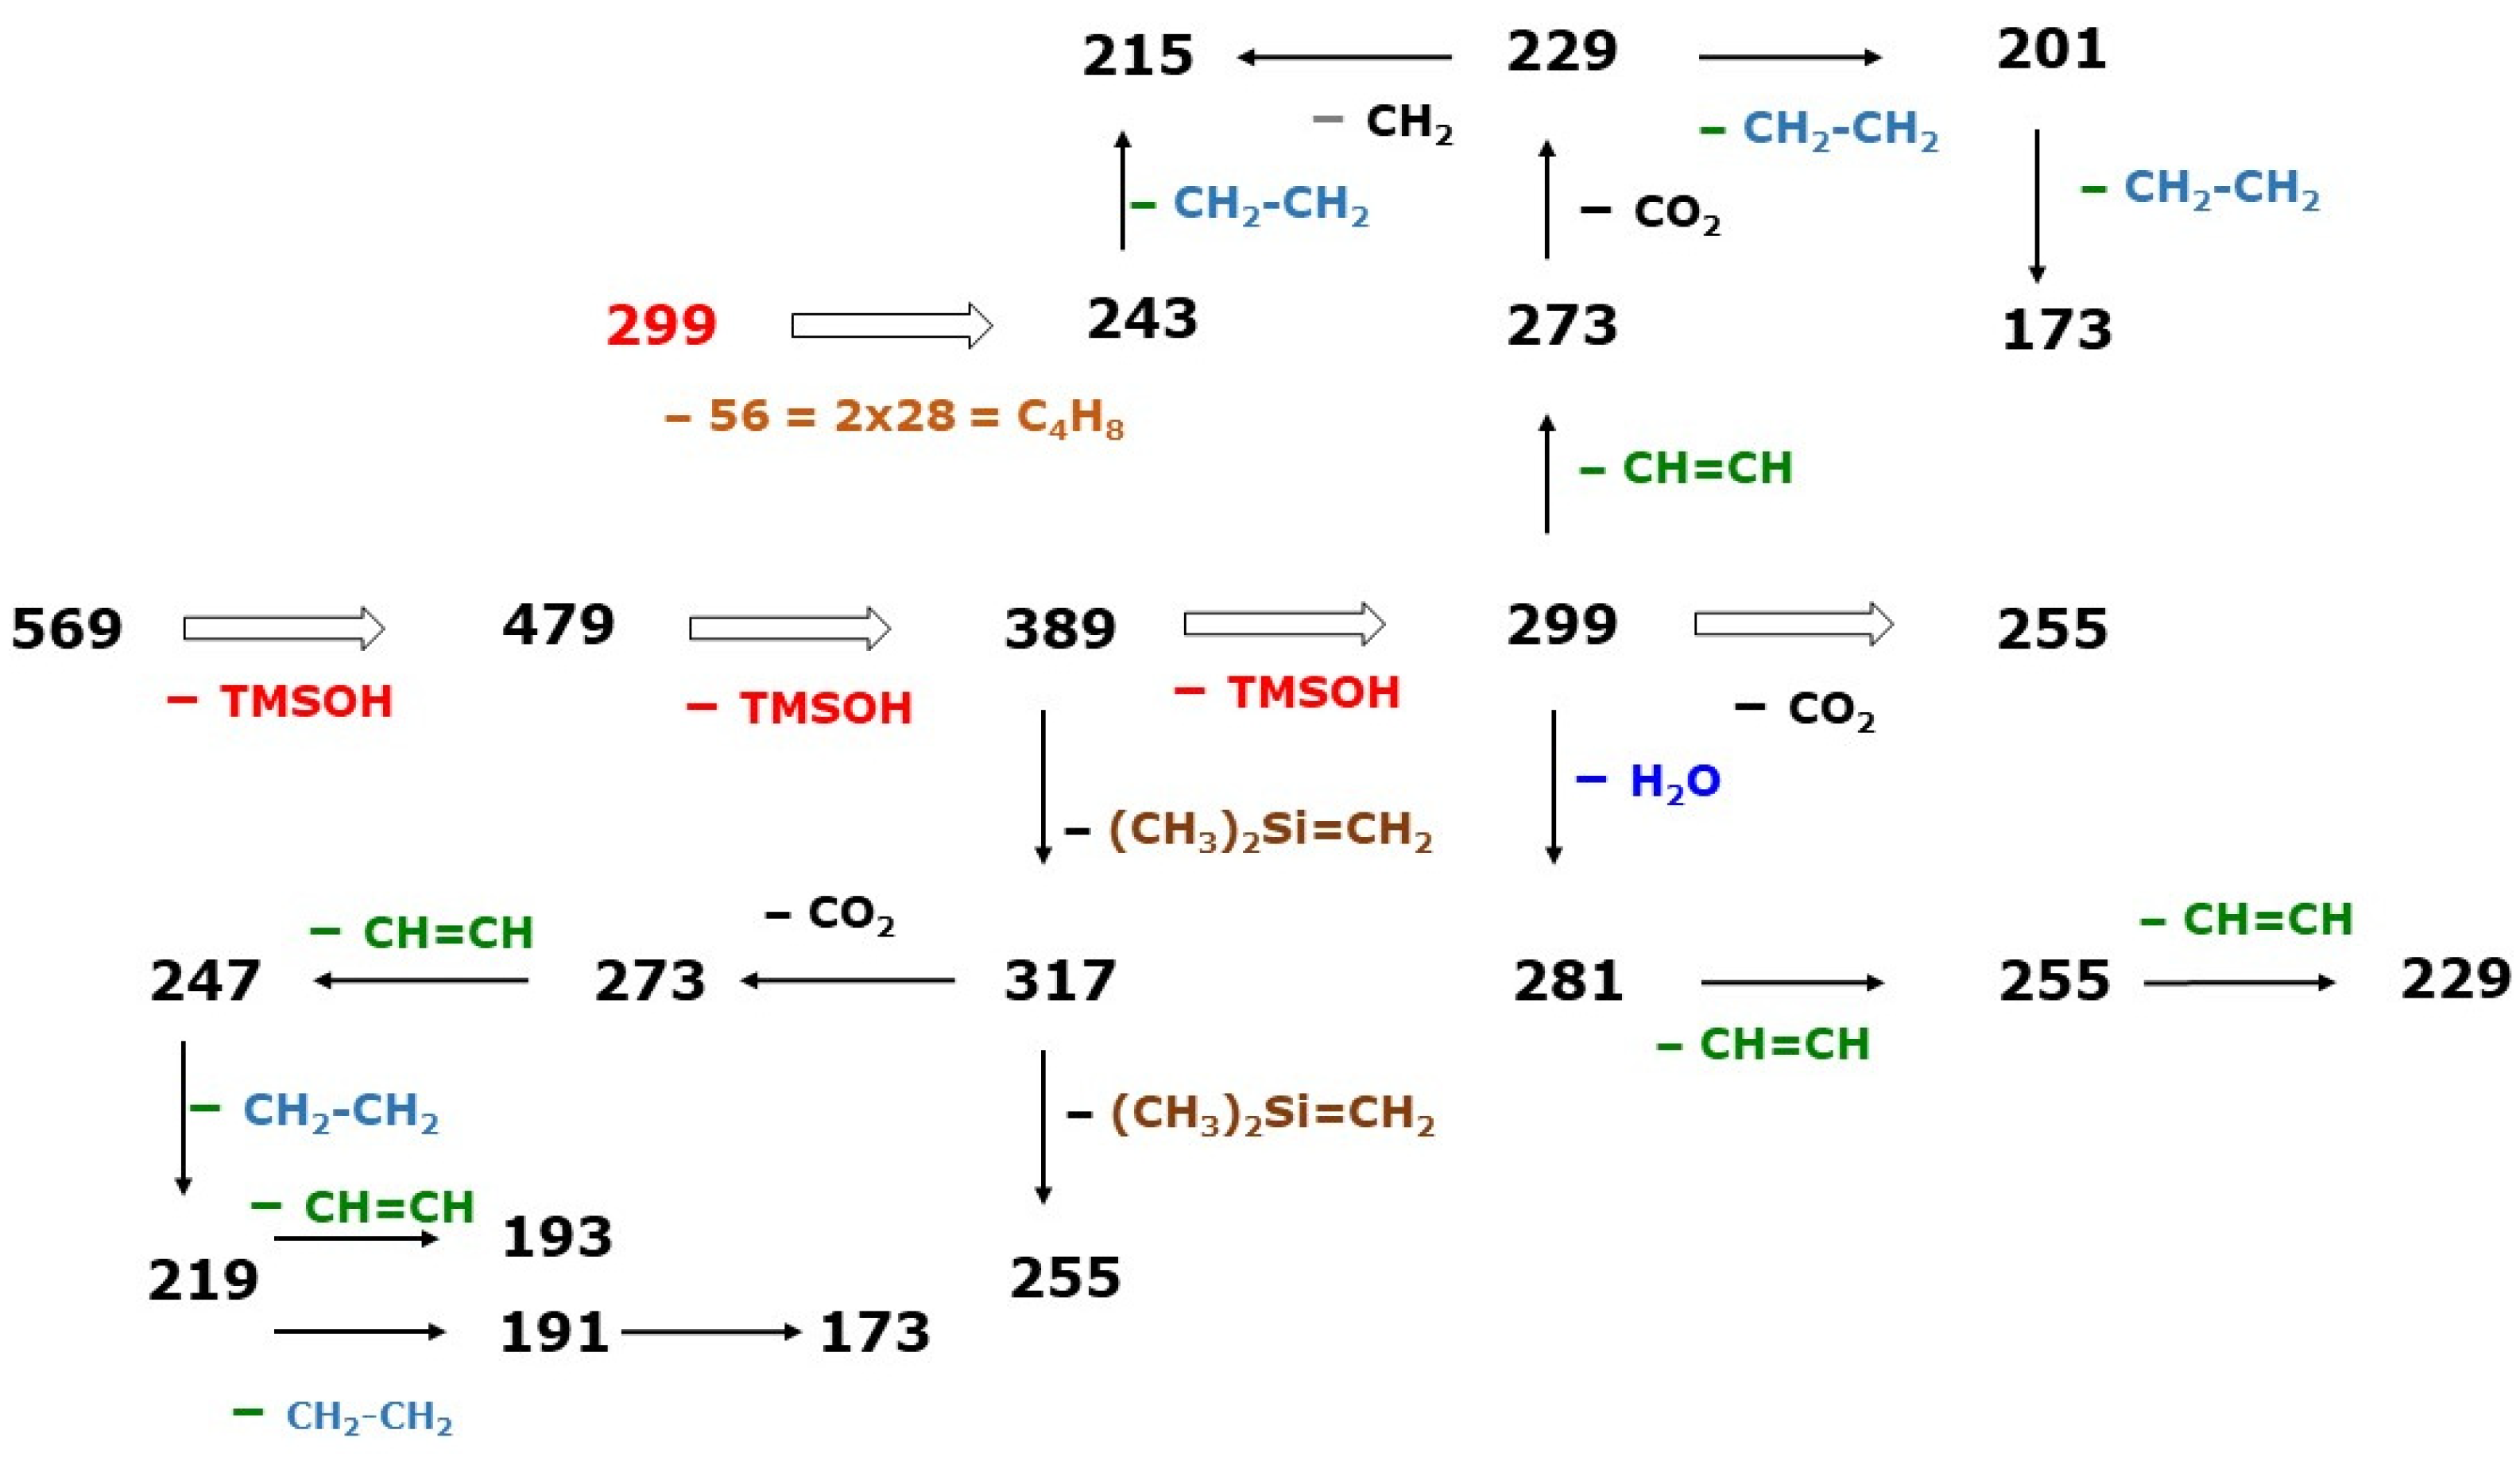
Figure 5.
Proposed fragmentation pathways for the formation of the indicated product ions produced by CID of the ion
m/
z 569 [M-PFB]
− generated by NICI of the PFB-TMS derivatives of prostaglandin F
2 isomers, investigated by Ferretti and Flanagan [
4]. See also
Table 1.
Figure 5.
Proposed fragmentation pathways for the formation of the indicated product ions produced by CID of the ion
m/
z 569 [M-PFB]
− generated by NICI of the PFB-TMS derivatives of prostaglandin F
2 isomers, investigated by Ferretti and Flanagan [
4]. See also
Table 1.
The most intense ions in the GC-NICI-MS mass spectra were at m/z 543 due to [M-PFB]−. The most intense product ions in the GC-NICI-MS/MS mass spectra generated from the precursor ion at m/z 543 were m/z 273 due to [M-PFB-3×TMSOH]−.
5. Conclusions
The eicosanoids are a large family of arachidonic acid-derived organic carboxyl groups containing endogenous molecules. In theory, solely the primary F
2-prostaglandins amount to up to 64. Reliable quantitative analysis of biological F
2-prostaglandins is highly challenging, even for GC-NICI-MS/MS. NICI of PFB-TMS derivatives of F
2-prostaglandins generates the common ion M-PFB]
− with
m/
z 569. CID of the precursor carboxylate ions generates many product ions, which are common to all F
2-prostaglandins but may differ in their intensity. We meta-analyzed the data reported by Ferretti and Flanagan [
4] on the GC-NICI-MS/MS analysis of the PFB-(TMS)
3 derivatives of seven chemically closely related F
2-prostaglandin isomers of the 15-F
2t-IsoP type, including PGF
2α and 8-
iso-PGF
2α. A meta-analysis of data previously reported on
2H-labeled 8-
iso-PGF
2α and its dinor-dihydro metabolite complemented this analysis. By means of these datasets, the 32-eV CID behavior and the formation of 19 product ions from [M-PFB]
− of the seven F
2-prostaglandin isomers was elucidated. Identified neutral losses included TMSOH (90 Da), CH
3)
2Si=CH
2 (72 Da), CO
2 (44 Da), H
2C=CH
2 (28 Da), HC≡CH (26 Da), and H
2O (18 Da). PCA and ROCA of the GC-NICI-MS/MS mass spectra identified 8-
iso-9β,11α-PGF
2α and 9α,11β-PGF
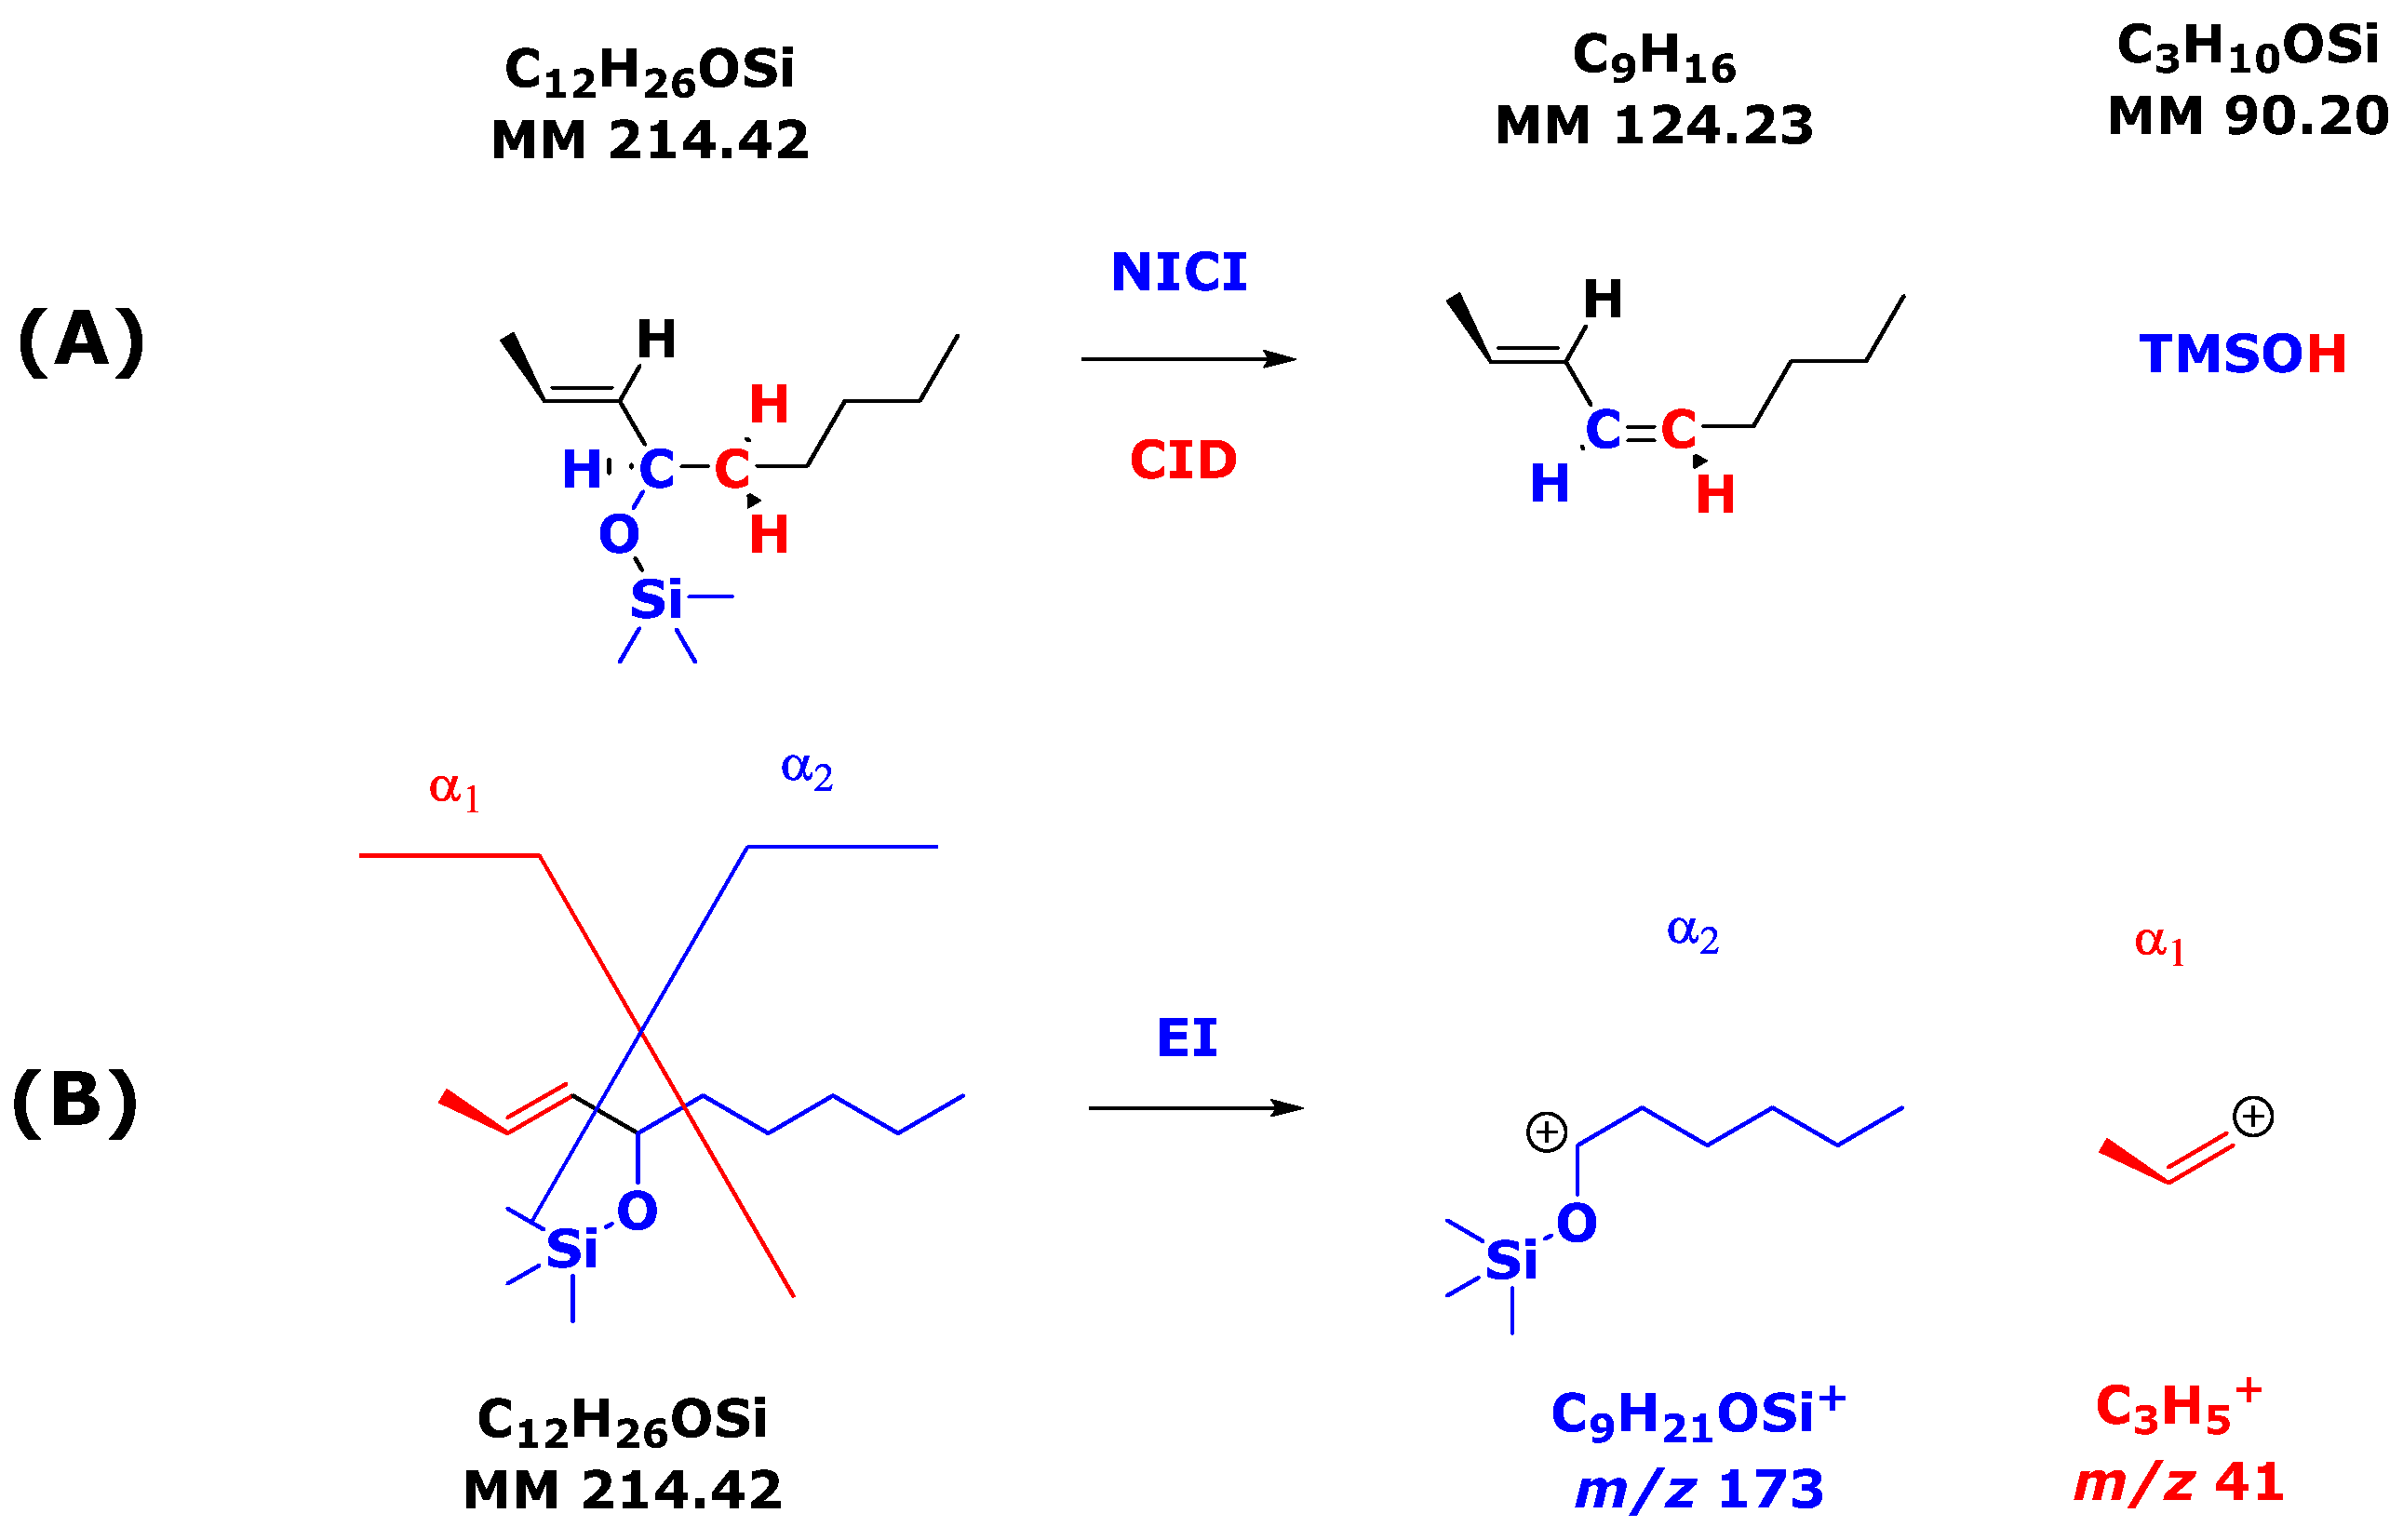
2α as the isomers with the greatest disagreement. Based on these data, CID fragmentation mechanisms were proposed. Neutral losses of TMSOH are prominent intramolecular redox-based elimination reactions that lead to the formation of C=C-bonds within the cyclopentane ring and in the β-chain of F
2-prostaglandin isomers of the 15-F
2t-IsoP type.
Although unique in the literature, the utility of the data meta-analyzed here is of limited value to delineate, in depth, the CID reactions of PFB-TMS derivatives of closely related F
2-prostaglandin isomers. Additional experimental, for instance, use of different unlabeled and stable-isotope-labeled precursors, collision energy, and argon pressure values for other eicosanoids [
18,
19], and theoretical studies, such as density functional theory (DFT) computations reported on structurally unrelated molecules [
20,
21], are warranted for F
2-prostaglandin isomers.
