Abstract
This research explores the effect of a composite support of SiO2 and Al2O3 with Fe and Co incorporated as catalysts for Fischer–Tropsch synthesis (FTS) using a 3D-printed stainless steel (SS) microchannel microreactor. Two mesoporous catalysts, FeCo/SiO2Al2O3 and Co/SiO2Al2O3, were synthesized via a one-pot (OP) method and extensively characterized using N2 physisorption, XRD, SEM, TEM, H2-TPR, TGA-DSC, FTIR, and XPS. H2-TPR results revealed that the synthesis method significantly affected the reducibility of metal oxides, thereby influencing the formation of active FTS sites. SEM-EDS and TEM further revealed a well-defined hexagonal matrix with a porous surface morphology and uniform metal ion distribution. FTS reactions, carried out in the 200–350 °C temperature range at 20 bar with a H2/CO molar ratio of 2:1, exhibited the highest activity for FeCo/SiO2Al2O3, with up to 80% CO conversion. Long-term stability was evaluated by monitoring the catalyst performance for 30 h on stream at 320 °C under identical reaction conditions. The catalyst was initially active for the methanation reaction for up to 15 h, after which the selectivity for CH4 declined. Correspondingly, the C4+ selectivity increased after 15 h of time-on-stream, indicating a shift in the product distribution toward longer-chain hydrocarbons. This trend suggests that the catalyst undergoes gradual activation or restructuring under reaction conditions, which enhances chain growth over time. The increase in C4+ products may be attributed to the stabilization of the active sites and suppression of methane or light hydrocarbon formation.
1. Introduction
Fischer–Tropsch synthesis (FTS) involves conversion of synthesis gas (syngas), a mixture of hydrogen and carbon monoxide, into long-chain hydrocarbons. The process is named after Franz Fischer and Hans Tropsch, who invented hydrocarbon production using cobalt catalysts in 1923 [1]. Syngas can be derived from various carbon-based feedstocks, including natural gas, biogas, biomass, coal, and waste, using different reforming techniques [2,3,4,5,6,7]. This can involve both single- and two-step processes [8,9,10]. For example, syngas can be produced in the presence of oxygen and water through coal gasification [11]. The selectivity of products in FTS plays a pivotal role in its viability, as the formation of byproducts such as CH4 and CO2 is not desirable. Therefore, there is a tremendous interest in the development of stable catalysts for FTS to improve product selectivity for the economical production of hydrocarbons [12].
In Fischer–Tropsch synthesis (FTS), the commonly used active metals are cobalt (Co), iron (Fe), and ruthenium (Ru), due to their high catalytic activity and selectivity under different reaction conditions [13,14]. Iron (Fe)-based catalysts offer several distinct advantages over other metals for large-scale industrial applications: (i) low cost and abundant availability, making them economically favorable; (ii) intrinsic promotion of the water gas shift (WGS) reaction, which is particularly beneficial for syngas derived from coal or biomass with low H2/CO ratios; and (iii) high thermal stability and activation temperature, with a product distribution that favors short-chain olefins, oxygenates, and gasoline-range hydrocarbons [15,16,17,18]. Support materials play an important role in enhancing the performance of Fe-based catalysts, and mesoporous support with large surface areas are often incorporated in FTS. These supports not only improve the mechanical strength and dispersion of the active phase, but also the overall catalytic activity by increasing the surface area and providing more accessible active sites [19,20,21]. The support materials for FTS usually include SiO2, ZnO, TiO2, ZrO2, and γ-Al2O3 [22,23,24,25]. A significant drawback of many of these oxide supports is the formation of mixed metal support oxides during catalyst preparation due to the strong interaction between the metal and the supports. These mixed oxides are often difficult to reduce, which limits the availability of the active metallic phase and thereby reduces the overall catalytic activity in the FTS process.
In addition, obtaining a high loading of active metals on such supports is challenging, further limiting the catalyst performance in FTS processes [19]. For example, silica-supported Fe-based catalysts tend to form iron silicate, which cannot be fully reduced to active α-Fe, as reported by Wielers et al. [26]. Similarly, Zhang et al. [27] observed that iron silicate formation hinders the iron oxide reduction, resulting in decreased FTS activity. Therefore, modifying the Fe/SiO2 interaction is desirable to enhance both the stability and catalytic performance [28,29,30,31]. An alternative option to overcome the stability and activity issues of the catalysts is to consider catalysts in which the support can protect the metal from sintering or deactivation. Ni et al. [32,33,34] studied Fe-based catalysis with promoters such as potassium and graphite carbon (GC) for the FTS reaction. They reported that GC and potassium additions significantly enhanced catalytic activity. While GC acted as a reductant, facilitating the reduction of Fe3+ to metallic Fe0 while also strengthening the SiO2 channels, potassium increased CO chemisorption but inhibited H2 chemisorption, which lowered hydrogenation capacity and boosted olefin selectivity. In another study, Ni et al. [28] modified an Fe@SiO2 catalyst with GC for FTO. The incorporation of GC altered the Fe-SiO2 interaction, and the rigid porous framework of GC helped maintain open channels for syngas access, preventing mesopore collapse during the reaction.
In our previous study, we used a Co-based SiO2Al2O3 catalyst for FTS [35]. The catalyst achieved 45% CO conversion. In this study, we focused on the influence of their physical and chemical properties; specifically, Fe addition with Co on SiO2 Al2O3 mixed oxide for Fischer–Tropsch synthesis (FTS) [36]. Iron-based catalysts were synthesized using the one-pot (OP) method, and their catalytic performances were evaluated in 3D-printed stainless steel microreactors at 20 bar. We investigated the effect of the SiO2-Al2O3 support by incorporating Al2O3 on SiO2 and the bimetallic FeCO core. The use of a SiO2-Al2O3 mixed oxide support offered the synergistic effect of properties from both pure oxide supports. SiO2 provided high surface area and thermal stability, while Al2O3 contributed to enhanced metal–support interactions and moderate acidity, which could influence the distribution and reducibility of the active metal phase. Compared to pure oxides, the mixed support could improve catalyst performance by optimizing the balance between metal dispersion, reducibility, and support acidity, ultimately enhancing catalytic activity and selectivity in FTS. In our previous work, we studied a SiO2-Al2O3 support for the FTS process [37]. The catalysts were characterized by N2 adsorption–desorption, XRD, SEM-EDS, TEM, H2-TPR, FTIR, TGA-DSC, and XPS before the FTS reactions to understand the effects of adding Fe metal with Co on a SiO2Al2O3 support on the product selectivity and CO conversion of the reaction.
2. Experimental Section
2.1. Materials
All chemicals used in this study were of analytical grade and employed without any further purification. Tetraethyl orthosilicate (TEOS, 99%) and ammonium hydroxide were sourced from Acros Organics (Fair Lawn, NJ, USA). Iron (III) nitrate nonahydrate (Fe (NO3)3·9H2O), cobalt (II) nitrate hexahydrate (Co (NO3)2·6H2O), and cetyltrimethylammonium bromide (CTAB) were obtained from Sigma-Aldrich (Burlington, MA, USA). Ethanol, absolute ethanol, and acetone were purchased from Fisher Scientific (Fair Lawn, NJ, USA).
2.2. Synthesis of FeCo/SiO2Al2O3 Catalyst
Bimetallic FeCo catalysts supported on SiO2–Al2O3 were synthesized via a one-pot (OP) sol–gel method adapted from previously reported procedures, Supporting Information). In a typical synthesis, CTAB was dissolved in deionized (DI) water at 35 °C and stirred until fully dissolved. The required quantities of iron and cobalt nitrates, calculated based on the target metal loading, were dissolved in absolute ethanol to form a clear metal precursor solution. The solution was stirred for 30 min to ensure homogeneity.
The metal nitrate solution was then added dropwise to the CTAB solution under continuous stirring to enable the formation of metal–surfactant micellar complexes. After an additional 30 min of stirring, TEOS was added dropwise as the silica source while maintaining a stirring speed of 350 rpm. The mixture was stirred for 30 min to facilitate partial hydrolysis and condensation of TEOS.
To initiate co-precipitation and further drive the sol–gel reaction, ammonium hydroxide was added dropwise to the reaction mixture while maintaining the pH between 9 and 10. The resulting suspension was stirred at ambient temperature for 20 h to allow for complete hydrolysis of TEOS and incorporation of the metal hydroxides into the silica–alumina matrix.
The precipitate was collected by filtration and washed repeatedly with DI water until the filtrate reached neutral pH (~7) to remove excess surfactant and residual precursors. This was followed by washing with ethanol to remove organics and to accelerate drying. The solid was air-dried at room temperature for 24 h and further dried in an oven at 98 °C for an additional 24 h.
Calcination was performed in air at 550 °C for 6 h at a heating rate of 2 °C min−1 to decompose the surfactant and stabilize the mesoporous structure. The calcined powders were allowed to cool to room temperature in a furnace before further characterization and catalytic testing.
2.3. The 3D-Printed SS Microchannel Microreactor
For high-pressure Fischer–Tropsch synthesis, a microchannel reactor was used with secured sealing at the inlet and outlet, under high-pressure conditions. The AutoCAD 23.0 schematic and the final stainless steel 3D-printed reactor are presented in reference [38]. The cross-sectional view illustrates seven parallel microchannels, each 5 cm long and 1000 µm wide and deep, connecting the cylindrical inlet and outlet sections. Both the inlet and outlet were engineered with outer diameters compatible with ¼-inch Swagelok tubing, allowing for precise coupling with a Swagelok filter to achieve robust, leak-proof sealing during high-pressure operation [38].
2.4. Characterization
Nitrogen adsorption–desorption isotherms were measured at −196 °C using a BET surface area analyzer (3Flex, Micromeritics, Norcross, GA, USA). Specific surface areas were calculated by the Brunauer–Emmett–Teller (BET) method, while pore size distributions were determined using the Barrett–Joyner–Halenda (BJH) method.
X-ray diffraction (XRD) patterns were collected using a Bruker AXS powder (Boston, MA, USA) diffractometer with Cu Kα1 radiation (λ = 1.5406 Å) over a 2θ range of 10° to 70°, employing a step size of 0.02°. Phase identification and crystalline grain size were determined from the diffraction profiles.
Temperature-programmed reduction (TPR) experiments were conducted on a 3Flex chemisorption analyzer (Micromeritics, Norcross, GA, USA). Approximately 50 mg of catalyst was loaded into a quartz tube reactor, secured between a quartz wool plug and a quartz frit. The sample was exposed to 10% H2 in Ar (v/v = 1:9) at a flow rate of 50 mL min−1, and heated from room temperature to 800 °C at a ramp rate of 10 °C min−1 to assess metal oxide reducibility.
Morphological features and surface topography were analyzed using a ZEISS (White Plains, NY, USA) Auriga Focused Ion Beam Scanning Electron Microscope (FIB-SEM) at the Joint School of Nanoscience and Nanoengineering. Particle distribution and crystallinity were evaluated by transmission electron microscopy (TEM) using a Thermo-Fisher Talos F200X instrument (Hillsboro, Oregon, USA) operated at 200 kV.
Surface chemical composition and oxidation states were determined via X-ray photoelectron spectroscopy (XPS) using a Thermo Scientific Escalab Xi+ spectrometer (West Sussex, UK). Surface functional groups were identified by Fourier transform infrared spectroscopy (FTIR) using a Shimadzu IR Prestige-21 instrument (Columbia, MD, USA) equipped with a mercury–cadmium–telluride (MCT) detector.
Thermogravimetric analysis coupled with differential scanning calorimetry (TGA-DSC) was performed on a TA Instruments system (New Castle, DE, USA) to investigate the thermal stability and decomposition behavior of the polymer components of the catalyst precursor.
2.5. FTS Process
The catalyst was introduced into the microreactor using a packing procedure designed to optimize the utilization of the available microchannel volume. The quantity of catalysts used for FTS was determined by weighing the microreactor before and after loading, resulting in a net catalyst mass of 0.16 g. To prevent catalyst loss during operation, both the inlet and outlet of the microreactor were sealed using ¼-inch Swagelok VCR filter gaskets, to ensure secure containment and compatibility with high-pressure conditions. The catalyst-loaded microreactor was then mounted into a custom-fabricated reactor block (see Figure 1) and integrated into the reaction system using ¼-inch female Swagelok fittings for leak-tight and pressure-stable operation [38,39].

Figure 1.
The 3D-printed stainless steel microchannel microreactor [38].
FTS experiments were performed using a custom-designed, LabVIEW-automated (Austin, TX, USA) system that enabled precise control over flow rates, temperature, and pressure, as shown elsewhere [35]. The syngas mixture, consisting of H2 and CO in a 2:1 molar ratio, was introduced into the reactor using a Bronkhorst mass flow controller with a maximum capacity of 20 sccm. Nitrogen, used as a carrier and internal standard, was supplied via a Bronkhorst mass flow controller (Bethlehem, PA, USA) with 20 sccm capacity.
The upstream and downstream pressures were continuously monitored using Bronkhorst pressure sensors (Bethlehem, PA, USA). The readings were relayed to a Bronkhorst solenoid valve for real-time pressure regulation. The entire system was operated using a custom LabVIEW 2018 interface for automated control and data acquisition.
Prior to catalytic testing, the metal oxide-based catalyst was subjected to in situ reduction under hydrogen flow at 350 °C overnight inside the microreactor to activate the metal sites of the catalysts at 1 bar. After the reduction process, the microreactor temperature was reduced to the desired reaction temperature in the presence of N2 flow to maintain an inert atmosphere for the reduced catalyst. The microreactor temperature was measured using a thermocouple. The FTS reactions were carried out at a constant gas hourly space velocity (GHSV) of 12,000 h−1 in the temperature range of 200 to 380 °C at 20 bar. The syngas flow rates were maintained at 4 mL/min for H2 and 2 mL/min for CO, while the N2 flow was held constant at 1.5 mL/min. To obtain reproducible data, the FTS reaction was carried out three times at each temperature.
The reaction products were analyzed both qualitatively and quantitatively using a combination of gas chromatography (GC) and mass spectrometry (MS). Specifically, an Agilent 7890B gas chromatograph coupled with a 5977 MSD detector (Santa Clara, CA, USA) was employed for product identification and quantification [35].
3. Result and Discussion
3.1. Brunauer–Emmett–Teller (BET) Analysis
To evaluate the textural properties of the synthesized catalysts, nitrogen adsorption–desorption measurements were performed using the BET method. Capillary condensation was observed in the relative pressure (P/P0) range of 0.6–1.0. The isotherms of Co/SiO2Al2O3 and FeCo/SiO2Al2O3 exhibited Type IIb behavior with an H3 hysteresis loop, indicative of interparticle pores formed by aggregated particles (Figure 2a) [35,40]. Capillary condensation in the P/P0 range of 0.45–1.0 further supports the presence of mesoporous structures in these catalysts. The BJH pore size distribution plots derived from the desorption branch (Figure 2b) show a sharp peak at 3.76 nm for both catalysts, confirming the presence of mesopores.
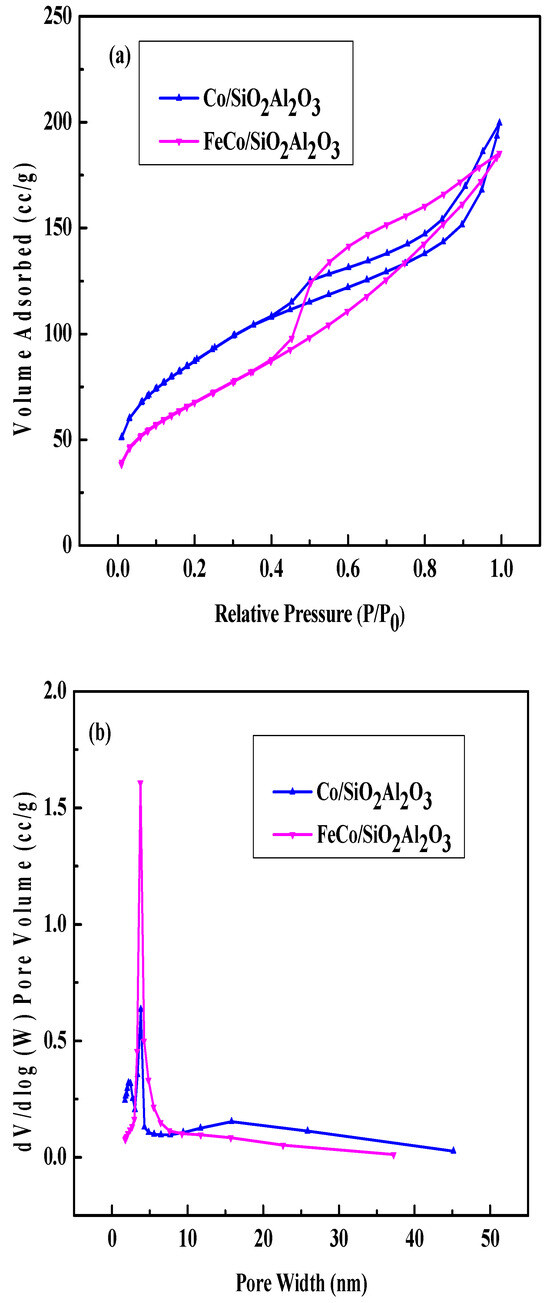
Figure 2.
N2 adsorption–desorption: (a) isotherms and (b) pore size distribution plots of Co/SiO2Al2O3 and FeCo/SiO2Al2O3 catalysts.
A notable reduction in surface area was observed for the Co/SiO2Al2O3 and FeCo/SiO2Al2O3 catalysts, which is attributed to the incorporation of Al2O3 into the mesoporous SiO2 framework within the catalyst architecture [39].
Table 1 shows the surface area, pore volume, and pore diameter of the two catalysts. The surface area decreased with the addition of Fe. The decrease in surface area was supported by the increase in pore volume and pore diameter.

Table 1.
BET analyses of Co/SiO2Al2O3 and FeCo/SiO2Al2O3 catalysts.
3.2. X-Ray Diffraction (XRD) Analysis
The X-ray diffraction (XRD) patterns of the samples are shown in Figure 3.
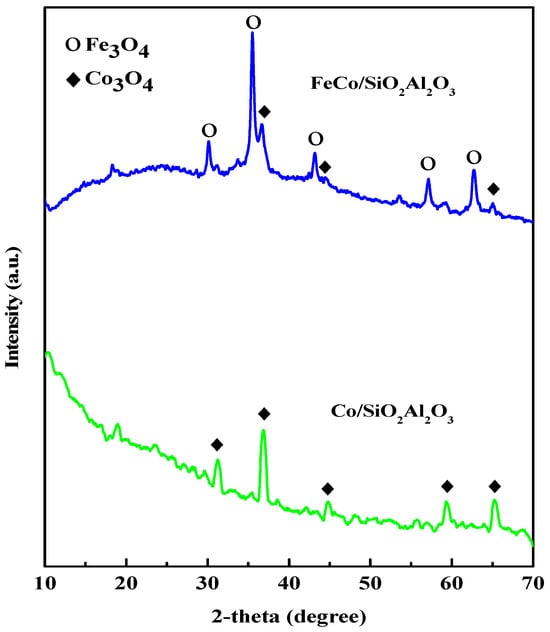
Figure 3.
Wide-angle XRD patterns of FeCo/SiO2Al2O3 and Co/SiO2Al2O3 catalysts.
XRD analysis showed the presence of a cubic Co3O4 phase in the Co/SiO2Al2O3 catalyst, with characteristic diffraction peaks observed at 2θ values of 31.27° (220), 36.54° (311), 44.57° (400), 59.41° (511), and 64.90° (440). These results are consistent with the standard JCPDS-42-1467 pattern (Zinc Oxide (ZnO). International Centre for Diffraction Data: Newtown Square, PA, USA, 1991) of Co3O4 reported in the literature [41]. For the FeCo/SiO2Al2O3 catalyst, the diffraction peaks indicate the presence of both Co3O4 and Fe3O4 crystalline phases, exhibiting cubic and orthorhombic structures, respectively. The Fe3O4 phase was identified by peaks at 2θ values of 30.20° (200), 35.46° (121), 43.09° (004), 57.09° (321), and 62.71° (400), corresponding to JCPDS-75-1609 [41]. The Co3O4 peaks at 36.54° (311), 44.57° (400), and 64.90° (440) were also observed for the FeCo/SiO2Al2O3 catalyst, confirming its coexistence. Notably, the characteristic SiO2 peak was absent in the XRD patterns of both Co/SiO2Al2O3 and FeCo/SiO2Al2O3 catalysts, likely due to the incorporation of Al2O3 into the mesoporous silica shell, which may have altered the structural ordering [42]. The average crystallite size of each catalyst was calculated from the XRD data using the modified Scherrer equation [43], and the results are presented in Table 2. Comparable crystallite sizes were observed for both catalysts. According to our previous study, the average crystallite size of Co3O4 in the Co/SiO2Al2O3 catalyst was 10.36 nm [35]. In contrast, the Co3O4 crystallite size in the FeCo/SiO2Al2O3 catalyst increased to 16.35 nm. This increase in size may be attributed to the incorporation of iron oxide or its interaction with cobalt oxide during the synthesis process, which could influence particle aggregation or crystallization behavior in the SEM images described below.
3.3. Scanning Electron Microscopy (SEM) Analysis
The morphologies and elemental compositions (wt.%) of the catalysts were characterized using Scanning Electron Microscopy (SEM). The SEM images of the catalysts are presented in Figure 4. Noticeable agglomeration of particles was observed in the Co/SiO2Al2O3 (OP) catalyst (Figure 4a) [35]. This may be attributed to the presence of Al2O3 in the mesoporous silica. This incorporation likely reduced the adhesion of cobalt to the support, promoting aggregation [44]. In contrast, the presence of iron (Fe) with Co significantly altered the morphology of the FeCo/SiO2Al2O3 catalyst (Figure 4b), resulting in more uniform dispersion of particles throughout the support matrix.
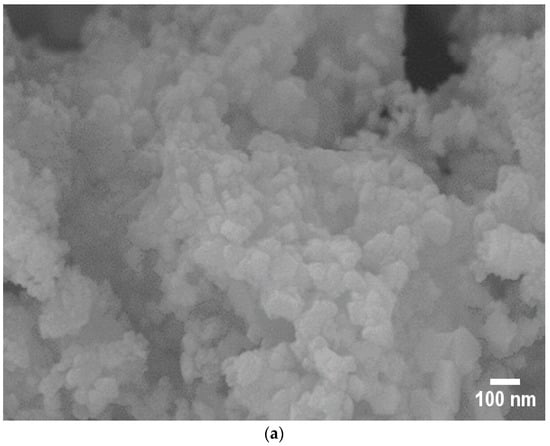
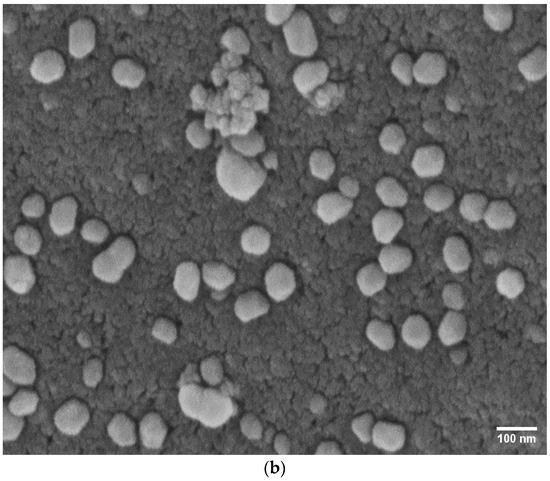
Figure 4.
Scanning Electron Microscopy (SEM) images of (a) Co/SiO2Al2O3 and (b) FeCo/SiO2Al2O3 catalysts.
Table 3 presents the energy-dispersive X-ray spectroscopy (EDS) results for all the catalysts [45]. In our previous work, the addition of Al2O3 with the SiO2 support Co/SiO2Al2O3 (OP) catalyst altered the metal loading. Similarly, in the current study, the incorporation of Fe into the FeCo/SiO2Al2O3 catalyst influenced the distribution of other metals, resulting in an increased Co content and decreased loadings of Si and Al. The detected oxygen (O) was attributed to surface oxidation of the metals in all catalysts. EDS analysis was performed on five randomly selected regions for each catalyst sample [35].
3.4. H2 Temperature Programmed Reduction (TPR) Analysis
Temperature programmed reduction (TPR) with H2 was conducted to examine the reduction behavior of metal oxides and metal–support interactions that may have played a significant role. The H2-TPR profiles of all catalysts are presented in Figure 5. These profiles act as an important structural promoter during the reduction process, consistent with the BET surface area results shown in Table 4. Specifically, two distinct reduction peaks at 386 °C and 405 °C were observed for the Co/SiO2Al2O3 catalyst. These peaks were due to the reduction of Co3O4 to metallic Co [35]. The peak at 672 °C corresponded to the reduction of cobalt silicate. The peak shifted to a lower temperature after the addition of Al2O3 to the silica support [36]. This may be due to Al2O3 weakening the interaction between FeCo and SiO2. The H2-TPR profile of the FeCo/SiO2Al2O3 catalyst exhibited several overlapping reduction peaks between 350 °C and 425 °C, corresponding to the reduction of Co3O4 to metallic Co and Fe3O4 to FeO. A distinct peak at 648 °C was attributed to reduction of FeO to metallic Fe [46].
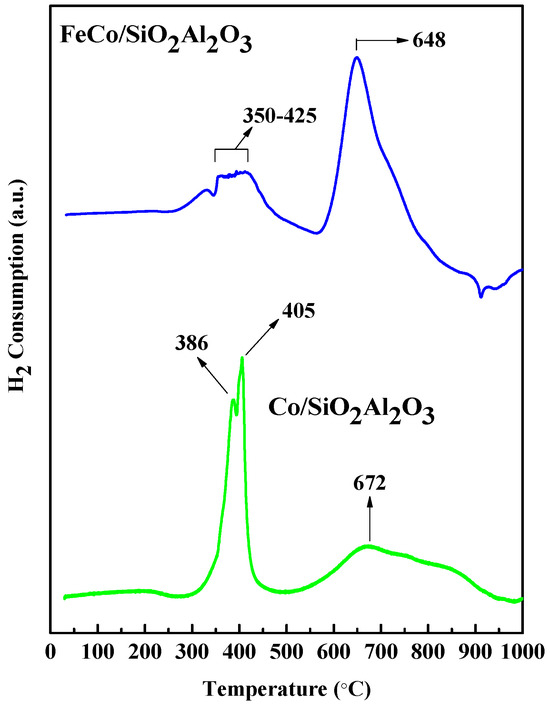
Figure 5.
H2−TPR analyses of all catalysts.
Table 4 summarizes the H2 consumption and reduction degrees (%) for all catalysts. The Co/SiO2Al2O3 catalyst showed both the highest H2 consumption and the highest reduction degree within the 150–400 °C range where Fischer–Tropsch synthesis (FTS) is typically carried out [47]. This indicates the presence of reducible metal oxide species and easier reduction of cobalt oxide nanoparticles, facilitating the formation of active cobalt sites for FTS.
3.5. Thermogravimetric Analysis and Differential Scanning Calorimetry (TGA–DSC) Analysis
Figure 6 presents the TGA-DSC analysis of the FeCo/SiO2Al2O3 (As) catalyst. Here, “As” corresponds to as-synthesized catalyst (before calcination). The thermogram reveals five distinct weight loss stages, each corresponding to specific regions in the heat flow curve: from room temperature to approximately 200 °C, 200–300 °C, 300–400 °C, 400–500 °C, and 500–1000 °C. The initial weight loss up to 200 °C is primarily attributed to the removal of physically adsorbed water and residual solvents. There is consistent weight loss corresponding to a downward peak in the heat flow curve, representing an endothermic process, which is most likely the decomposition of a templating agent [48]. Between 200 °C and 300 °C, a consistent weight loss is observed, followed by a slight decrease in the rate of weight loss from 300 °C to 400 °C. This temperature range corresponds to an upward peak in the heat flow curve around 300 °C, indicating an exothermic event such as crystallization, which temporarily slows the weight loss. The weight loss continues between 300 °C and 400 °C, primarily due to the decomposition of the templating agent [48], reflected as an endothermic portion (negative slope) in the heat flow curve. Rapid weight loss occurs between 400 °C and 500 °C, coinciding with a local minimum in the heat flow curve, characteristic of an endothermic process such as melting or evaporation. This stage likely represents the major decomposition and removal of the templating agent. Finally, in the temperature range of 500 °C to 1000 °C, the weight loss curve continues to decline but at a reduced rate, while the heat flow curve remains linear with a negative slope. This slower weight loss suggests a diminished evaporation rate as most of the templating agent has already been removed by this stage.
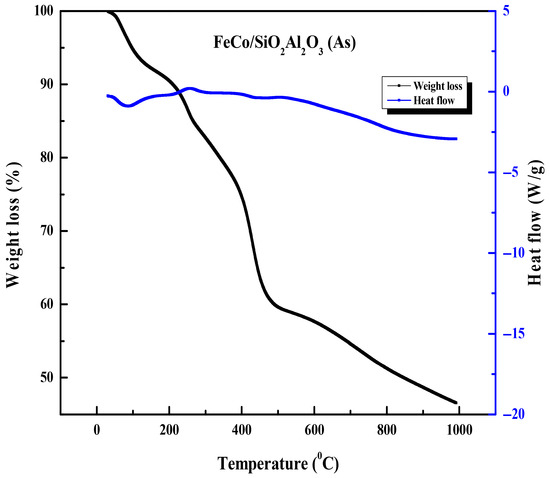
Figure 6.
Thermogravimetric analysis and differential scanning calorimetry TGA-DSC thermograms of FeCo/SiO2Al2O3 (As) catalysts.

Table 2.
Crystal size calculation * based on the XRD data.
Table 2.
Crystal size calculation * based on the XRD data.
| Catalyst | Avg. Fe3O4 Crystal Size (nm) | Avg. Co3O4 Crystal Size (nm) |
|---|---|---|
| Co/SiO2Al2O3 | - | 10.36 |
| FeCo/SiO2Al2O3 | 16.19 | 16.35 |
* Using modified Scherrer equation [49].

Table 3.
SEM-EDS analyses of synthesized catalysts.
Table 3.
SEM-EDS analyses of synthesized catalysts.
| Catalyst | Metal Loading (wt. %) | ||||
|---|---|---|---|---|---|
| Fe | Co | Si | Al | O | |
| Co/SiO2Al2O3 | - | 15.44 | 18.81 | 11.36 | 54.39 |
| FeCo/SiO2Al2O3 | 18.47 | 22.07 | 9.16 | 4.95 | 45.35 |

Table 4.
H2 consumption by different catalysts.
Table 4.
H2 consumption by different catalysts.
| Catalyst | H2 Consumption (mmol/g) | Reduction Degree (%) * |
|---|---|---|
| Co/SiO2Al2O3 | 0.91 | 31.24 |
| FeCo/SiO2Al2O3 | 0.73 | 14.39 |
* Degree of reduction (%) was defined, following the literature [45], as the ratio of the measured H2 consumption between 150 and 400 °C in the TPR peak to the theoretical H2 consumption (mmol H2/g) multiplied by 100.
3.6. Fourier Transform Infrared Spectroscopy (FTIR)
The FTIR spectra of the as-synthesized samples are shown in Figure 7. The peak in the spectra at 565 cm−1 is due to the Fe-O stretching vibration [49].
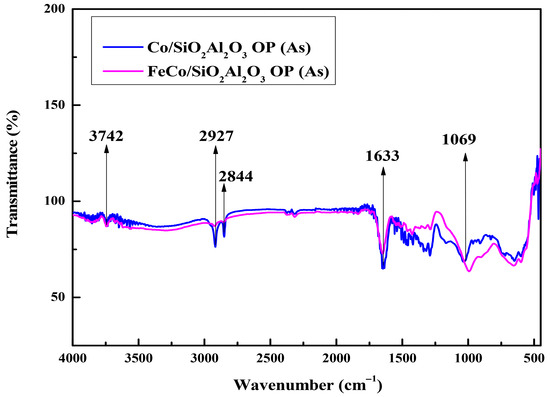
Figure 7.
FTIR spectra of all catalysts prior to calcination: Co/SiO2Al2O3 (As) and FeCo/SiO2Al2O3 (As) catalysts.
FTIR spectroscopy confirmed the presence of a silica layer on the iron nanoparticles, as evidenced by a characteristic absorption band near 1069 cm−1 [50]. This band, originally located at 1100 cm−1, was observed to shift to lower wavenumbers, indicating a weakening of the siloxane (Si-O-Si) bridges. This shift is attributed to interactions between the silica and surface hydroxyl groups on the iron nanoparticles. However, these silica-related bands disappeared upon the addition of Al2O3 in the silica layer of the Co/SiO2Al2O3 (As) and FeCo/SiO2Al2O3 (As) catalysts. The band at 1633 cm−1 corresponded to the bending vibration of hydroxyl groups from interlayer water molecules [40,51]. Additionally, absorption bands at 2844 and 2927 cm−1 were attributed to symmetric and asymmetric C-H stretching vibrations from organic species [52]. The broad band between 3750 and 3000 cm−1, observed at 3742 cm−1, is assigned to O-H stretching from water adsorbed on silanol groups on the silica surface [53]. The IR spectra of all calcined catalysts are shown in the supplementary section of the manuscript (Figure S1 (See Supplementary file)).
3.7. X-Ray Photoelectron Spectroscopy (XPS)
X-ray photoelectron spectroscopy (XPS) was utilized to analyze the surface chemical composition and oxidation states of elements present in the FeCo/SiO2Al2O3 catalyst. Charge correction for all spectra was performed using the C 1s peak at 284.8 eV, corresponding to adventitious carbon (C–C bonds). The intensity in the spectra represents the measured value from the instrument, and envelope represents the resultant intensity from the deconvoluted peaks. Deconvolution of the C 1s spectrum revealed additional peaks attributed to oxygen-containing carbon species, including a component associated with O–C=O bonds, suggesting the presence of surface-bound carbon–oxygen functionalities [54]. Figure 8c shows the Si 2p XPS spectrum, featuring a single peak at a binding energy of 102.52 eV, confirming the presence of silicates in the FeCo/SiO2Al2O3 catalyst.
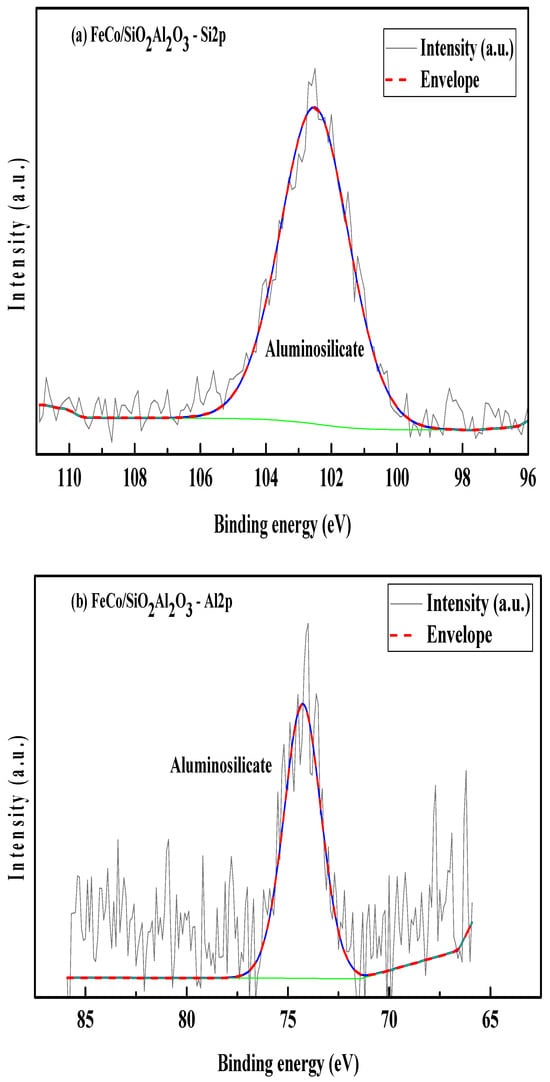
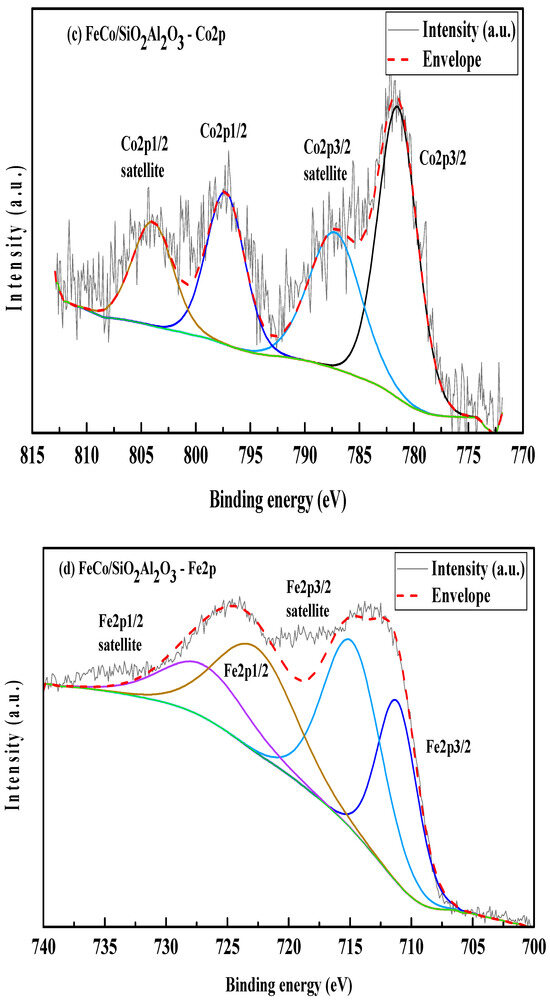
Figure 8.
(a) Si2p, (b) Al2p, (c) Co2p, and (d) Fe2p XPS scans of FeCo/SiO2Al2O3.
The Al 2p XPS spectrum of the FeCo/SiO2Al2O3 catalyst (Figure 8b) shows a binding energy peak at 74.27 eV, indicative of aluminum in an aluminosilicate framework, thereby confirming successful Al incorporation into the silica matrix. In the Co 2p region (Figure 8c), a positive binding energy shift of +3.29 eV is observed, attributed to the electronic influence of Fe, which possesses higher electronegativity. The Co 2p spectrum exhibits two principal peaks at 781.49 eV (Co 2p3/2) and 797.28 eV (Co 2p1/2), corresponding to spin–orbit splitting, along with satellite features at 787.23 eV and 803.95 eV, respectively. These features are characteristic of Co2+ species, confirming the presence of cobalt oxides in the catalyst matrix [54,55,56].
Two distinct peaks are observed at binding energies (BEs) of 781.61 eV and 797.25 eV, corresponding to Co 2p3/2 and Co 2p1/2, respectively (Figure 8c). Two satellite peaks are observed at 787.23 eV and 804.02 eV for the Co2p spectrum in the FeCo/SiO2Al2O3 catalyst.
The Fe 2p spectrum further supports the presence of iron oxides, showing a positive binding energy shift consistent with strong metal–metal interactions. Distinct multiplet-split peaks are observed at 711.16 eV (Fe 2p3/2) and 726.89 eV (Fe 2p1/2), accompanied by satellite peaks at 714.83 eV and 722.65 eV, respectively (Figure 8d). These spectral features indicate the coexistence of Fe2+ and Fe3+ oxidation states, confirming the formation of mixed-valent iron oxides within the catalyst [55].
3.8. Fischer–Tropsch Synthesis (FTS) of Fe-Based Catalysts
Fischer–Tropsch synthesis (FTS) reactions were conducted in a stainless steel microreactor over a temperature range of 200 °C to 350 °C to determine the optimum reaction temperature for CO conversion and hydrocarbon selectivity. The reactions were performed using a constant H2:CO molar ratio of 2:1, with a gas hourly space velocity (GHSV) of 12,000 h−1 and a pressure of 20 bar. The N2 gas flow rate was maintained at 1.5 mL/min. CO conversion and hydrocarbon selectivity were calculated using the equations below [57,58]. Although CO2 formation is important because of the water–gas shift reaction, it was not considered for the hydrocarbon selectivity calculation. The effect of reaction temperature on CO conversion and hydrocarbon selectivity for the Co/SiO2Al2O3 catalyst was discussed extensively in our previous paper [35].
In our previous study, we showed the effect of temperature on Co/SiO2Al2O3 catalyst activity for the FTS process [35].
Figure 9 shows the effect of the reaction temperature on the CO conversion and product selectivity of the FeCo/SiO2Al2O3 catalyst. Initially, the CO conversion increased slowly up to 290 °C and then increased sharply to 57.7% at 320 °C. After that, the CO conversion increased further at higher temperatures. The CH4 selectivity increased up to 370 °C and then decreased [58]. The increasing trend in CH4 selectivity indicates that the catalyst was active for the methanation reaction. The presence of cobalt in the catalyst may facilitate the activation of CO2 (a byproduct of the FTS process), which can react with H2 to form CH4 [59]. At 290 °C, the selectivity for both CH4 (C1) and light hydrocarbons (C2-C4) reached their maximum, after which selectivity declined at higher temperatures (290–380 °C). In contrast, C4+ selectivity showed a decreasing trend with rising temperature up to 290 °C, then stabilized and remained nearly constant at higher temperatures. This is due to the higher reduction degree, lack of agglomeration of particles, and proper core–shell structure of this catalyst. The TPR, SEM, and TEM (Figure S2 (See Supplementary file)) results support the enhanced catalytic activity of this catalyst.
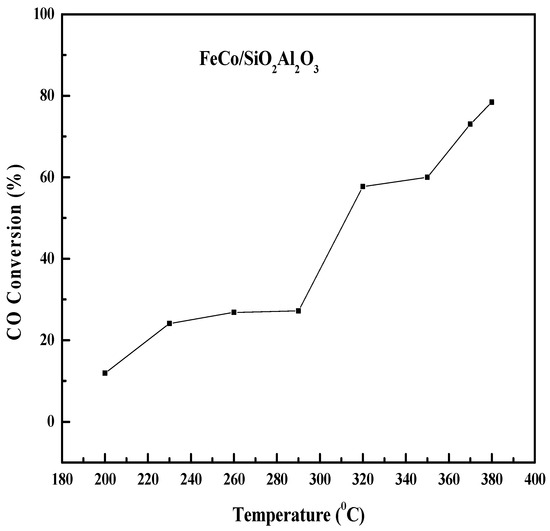
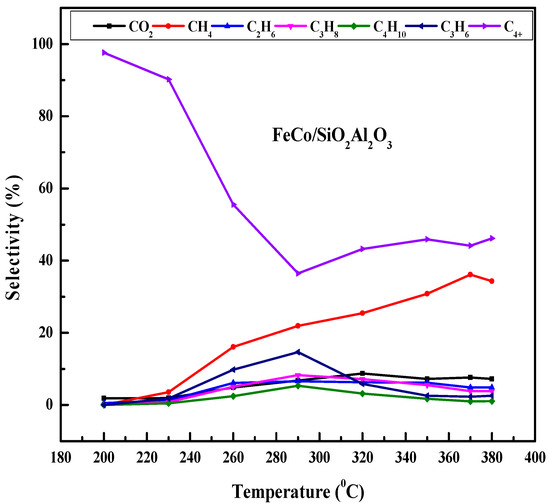
Figure 9.
Comprehensive evaluation of the influence of reaction temperature on CO conversion and hydrocarbon product selectivity in Fischer–Tropsch synthesis using FeCo/SiO2Al2O3 catalyst. Reaction conditions: H2/CO = 2, pressure = 20 bar, GHSV = 12,000 h−1, N2 flow rate = 1.5 mL/min.
4. Time-on-Stream Studies of All Catalysts
To investigate the time-on-stream behavior of all catalysts, the Fischer–Tropsch synthesis (FTS) reaction was conducted for 30 h at 320 °C under identical operating conditions. In the case of the FeCo/SiO2Al2O3 catalyst, quite (60–65%) stable CO conversions of 65% and 61% were observed for 30 h.
As discussed in the H2-TPR experiments, the reduction of iron oxide to metallic iron generates more active sites, enhancing the FTS activity of the catalyst [60,61]. The catalyst structure effectively protects metallic Fe particles from oxidation and suppresses their growth during activation and reaction [62], making this catalyst favorable for the water–gas shift reaction. Methane selectivity increases during the first 15 h of reaction over the FeCo/SiO2Al2O3 catalyst, followed by a decrease thereafter (Figure 10). This trend suggests that the catalyst is initially active for methanation up to 15 h, after which CH4 formation reaches saturation and its selectivity declines. Correspondingly, C4+ selectivity rises after 15 h in our time-on-stream studies.
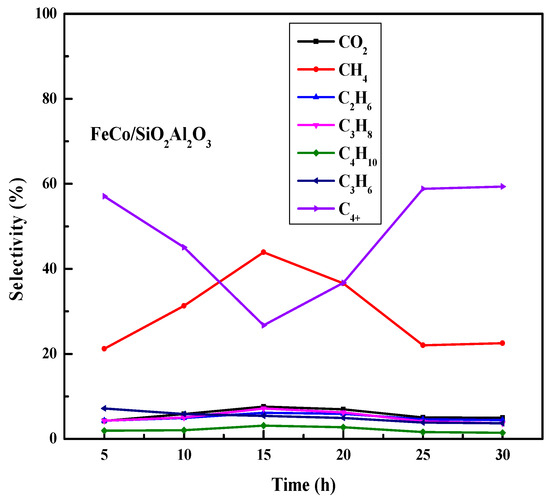
Figure 10.
Time-on-stream performance of FeCo/SiO2Al2O3 catalyst during Fischer–Tropsch synthesis. Reaction conditions: H2/CO = 2, pressure = 20 bar, GHSV = 12,000 h−1, temperature = 320 °C, duration = 30 h, N2 flow rate = 1.5 mL/min.
Overall, these results demonstrate that the core–shell catalyst structure promotes the formation of heavier hydrocarbons (C4+). Furthermore, the SiO2 and Al2O3 components in the catalyst support do not suppress surface basicity but instead provide active sites for mild hydrocracking reactions, including skeletal isomerization, hydrogenation, and double bond migration [60]. The acidic properties of SiO2Al2O3 supports, widely reported in the literature [61], likely contribute to the enhanced production of heavier hydrocarbons.
4.1. Spent Catalyst Characterization
4.1.1. Scanning Electron Microscopy (SEM) Analyses
Figure 11 presents the SEM images of all spent catalysts, showing noticeable changes in surface morphology after the time-on-stream studies. Notably, particle agglomeration was observed in the FeCo/SiO2Al2O3 catalyst (Figure 11). Additionally, coke deposits were visible on the catalyst surfaces following the FTS reactions, which correlates with the observed decline in catalytic activity.
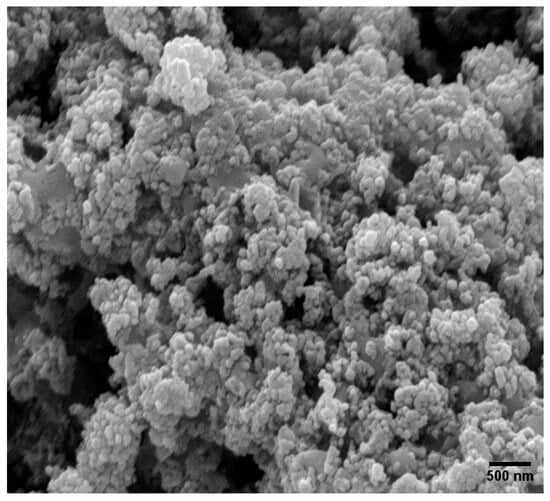
Figure 11.
SEM images of spent FeCo/SiO2Al2O3 catalyst.
4.1.2. Thermogravimetric and Differential Scanning Calorimetry (TGA-DSC) Analysis of Spent Catalysts
Thermogravimetric analysis coupled with differential scanning calorimetry (TGA-DSC) was performed on the spent catalysts to assess coke deposition and evaluate thermal stability. The measurements were conducted under an air atmosphere with a temperature ramp up to 1000 °C, allowing the detection of carbon oxidation events and thermal transitions associated with spent catalyst degradation [62,63,64].
The observed weight loss in the TGA profiles is primarily attributed to the combustion of carbonaceous species-such as coke and surface carbides—formed during the high-temperature Fischer–Tropsch reaction [48,62,63]. In some cases, a minor weight gain was also detected, which was attributed to the exothermic oxidation of residual reduced metal species upon exposure to air [49]. Given that all catalysts underwent hydrogen reduction prior to FTS, some degree of reoxidation during the TGA is expected.
Although the dominant trend was net weight loss due to coke combustion, it is important to acknowledge the potential presence of residual silicon carbide (SiC) in the spent catalyst samples. Despite implementing mechanical sifting steps to remove SiC particles, complete separation could not be guaranteed, and trace contamination may contribute to variability in the thermal analysis results.
Figure 12 shows the TGA-DSC profiles of the spent FeCo/SiO2Al2O3 catalyst. As observed with other spent catalysts, a slight initial weight gain was observed, corresponding to an exothermic peak in the DSC curve, indicative of reoxidation of reduced metal species. This was followed by a substantial weight loss, comparable to that observed for the spent Fe2O3@SiO2 catalyst [35]. The major weight loss event aligns with an endothermic minimum in the DSC signal and is attributed to the oxidative combustion of carbonaceous deposits (e.g., carbides) accumulated during the Fischer–Tropsch reaction.
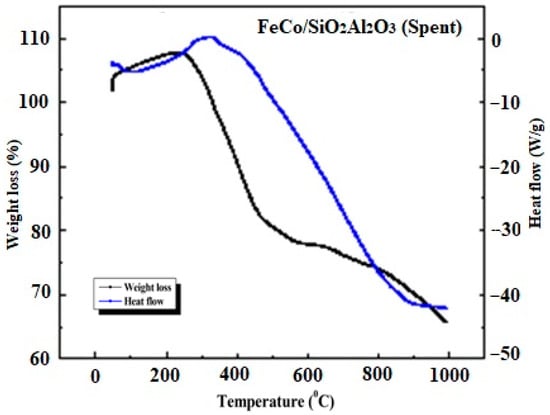
Figure 12.
Thermogravimetric and differential scanning calorimetry (TGA-DSC) thermograms of spent FeCo/SiO2Al2O3 catalysts.
5. Conclusions
A 3D-printed stainless steel microchannel microreactor was employed to evaluate the catalytic performance of silica and alumina-supported core shell Fe and Co catalysts for Fischer–Tropsch synthesis (FTS). The XRD and SEM analyses confirmed good metal distribution in both Co/SiO2Al2O3 and FeCo/SiO2Al2O3 catalysts. The H2-TPR results further revealed that the synthesis method significantly affected the reducibility of metal oxides, thereby influencing the formation of active FTS sites that were consistent with the structural insights obtained from XRD and SEM studies. In addition, SEM-EDS analysis showed uniform metal ion distribution.
Catalytic activity tests were performed under FTS conditions in a 3D-printed microreactor at 20 bar [38]. While all catalysts showed a similar trend of increasing CO conversion with temperature, the FeCo/SiO2Al2O3 catalyst exhibited the highest performance, achieving a maximum CO conversion of 80%. Overall, the 3D-printed stainless steel microreactor demonstrated its effectiveness as a platform for catalyst screening and development, providing a scalable and practical solution to key challenges in Fischer–Tropsch synthesis.
Supplementary Materials
The following supporting information can be downloaded at: https://www.mdpi.com/article/10.3390/molecules30173486/s1, Figure S1: FTIR spectra of Co/SiO2Al2O3 and FeCo/SiO2Al2O3 catalysts; Figure S2: Transmission Electron Microscopy (TEM) images of (a) Co/SiO2Al2O3 and (b) FeCo/SiO2Al2O3 core-shell catalysts.
Author Contributions
M.A.: investigation, methodology, writing the original draft. S.B.: investigation, methodology, writing—original draft. J.S.: formal analysis, writing—review and editing. S.H.: methodology, writing—review and editing. D.K.: conceptualization, writing—review and editing, supervision. All authors have read and agreed to the published version of the manuscript.
Funding
This project was partially supported by funds provided by NSF-CREST (Award Number: 1736173), UNC-ROI (Award Number: 110092), and DOE-BES (Award Number: DE SC0022230). This work was conducted in part at the Joint School of Nanoscience and Nanoengineering (JSNN), a member of the National Nanotechnology Coordinated Infrastructure (NNCI), supported by the National Science Foundation under Grant No. ECCS-2025462.
Institutional Review Board Statement
Not applicable.
Informed Consent Statement
Not applicable.
Data Availability Statement
The data will be made available upon request.
Acknowledgments
This work was performed at the North Carolina A&T State University, Department of Applied Science Technology, and Department of Chemistry. The authors gratefully acknowledge the help from Kyle Nowlin for the TEM and SEM studies at the Joint School of Nanoscience and Nanoengineering.
Conflicts of Interest
The authors declare that they have no known competing financial interests or personal relationships that could have influenced the work reported in this manuscript.
References
- Fischer, F.; Tropsch, H. The synthesis of petroleum at atmospheric pressures from gasification products of coal. Brennst.-Chem. 1926, 7, 97–104. [Google Scholar]
- Bepari, S.; Khan, M.; Li, X.; Mohammad, N.; Kuila, D. Effect of Ce and Zn on Cu-Based Mesoporous Carbon Catalyst for Methanol Steam Reforming. Top. Catal. 2023, 1, 375–392. [Google Scholar] [CrossRef]
- Bepari, S.; Kuila, D. Steam reforming of methanol, ethanol and glycerol over nickel-based catalysts-A review. Int. J. Hydrogen Energy 2020, 45, 18090–18113. [Google Scholar] [CrossRef]
- Bej, B.; Bepari, S.; Pradhan, N.C.; Neogi, S. Production of hydrogen by dry reforming of ethanol over alumina supported nano-NiO/SiO2 catalyst. Catal. Today 2017, 291, 58–66. [Google Scholar] [CrossRef]
- Bepari, S.; Pradhan, N.C.; Dalai, A.K. Selective production of hydrogen by steam reforming of glycerol over Ni/Fly ash catalyst. Catal. Today 2017, 291, 36–46. [Google Scholar] [CrossRef]
- Bepari, S.; Basu, S.; Pradhan, N.C.; Dalai, A.K. Steam reforming of ethanol over cerium-promoted Ni-Mg-Al hydrotalcite catalysts. Catal. Today 2017, 291, 47–57. [Google Scholar] [CrossRef]
- Bepari, S.; Sarkar, J.J.; Pradhan, N.C. Kinetics of ethanol steam reforming over Ni/Olivine catalyst. Int. J. Hydrogen Energy 2022, 47, 30843–30860. [Google Scholar] [CrossRef]
- Maschio, G.; Lucchesi, A.; Stoppato, G. Production of syngas from biomass. Bioresour. Technol. 1994, 48, 119–126. [Google Scholar] [CrossRef]
- Rauch, R.; Hrbek, J.; Hofbauer, H. Biomass gasification for synthesis gas production and applications of the syngas. Wiley Interdiscip. Rev. Energy Environ. 2014, 3, 343–362. [Google Scholar] [CrossRef]
- Prins, M.J.; Ptasinski, K.J.; Janssen, F.J.J.G. More efficient biomass gasification via torrefaction. Energy 2006, 31, 3458–3470. [Google Scholar] [CrossRef]
- van Dyk, J.C.; Keyser, M.J.; Coertzen, M. Syngas production from South African coal sources using Sasol–Lurgi gasifiers. Int. J. Coal Geol. 2006, 65, 243–253. [Google Scholar] [CrossRef]
- Zhang, M.; Fang, K.; Lin, M.; Hou, B.; Zhong, L.; Zhu, Y.; Wei, W.; Sun, Y. Controlled fabrication of iron oxide/mesoporous silica core-shell nanostructures. J. Phys. Chem. C 2013, 117, 21529–21538. [Google Scholar] [CrossRef]
- Dry, M.E. The Fischer–Tropsch process: 1950–2000. Catal. Today 2002, 71, 227–241. [Google Scholar] [CrossRef]
- Davis, B.H. Fischer–Tropsch synthesis: Comparison of performances of iron and cobalt catalysts. Ind. Eng. Chem. Res. 2007, 46, 8938–8945. [Google Scholar] [CrossRef]
- Mohammad, N.; Abrokwah, R.Y.; Stevens-Boyd, R.G.; Aravamudhan, S.; Kuila, D. Fischer-Tropsch studies in a 3D-printed stainless steel microchannel microreactor coated with cobalt-based bimetallic-MCM-41 catalysts. Catal. Today 2020, 358, 303–315. [Google Scholar] [CrossRef]
- Davis, B.H. Fischer–Tropsch synthesis: Current mechanism and futuristic needs. Fuel Process. Technol. 2001, 71, 157–166. [Google Scholar] [CrossRef]
- Mohammad, N.; Aravamudhan, S.; Kuila, D. Atomic Layer Deposition of Cobalt Catalyst for Fischer–Tropsch Synthesis in Silicon Microchannel Microreactor. Nanomaterials 2022, 12, 2425. [Google Scholar] [CrossRef]
- Abelló, S.; Montané, D. Exploring Iron-based Multifunctional Catalysts for Fischer–Tropsch Synthesis: A Review. ChemSusChem 2011, 4, 1538–1556. [Google Scholar] [CrossRef]
- Santos, V.P.; Wezendonk, T.A.; Jaén, J.J.D.; Dugulan, A.I.; Nasalevich, M.A.; Islam, H.U.; Chojecki, A.; Sartipi, S.; Sun, X.; Hakeem, A.A.; et al. Metal organic framework-mediated synthesis of highly active and stable Fischer-Tropsch catalysts. Nat. Commun. 2015, 6, 6451. [Google Scholar] [CrossRef]
- Jung, J.S.; Kim, S.W.; Moon, D.J. Fischer–Tropsch Synthesis over cobalt based catalyst supported on different mesoporous silica. Catal. Today 2012, 185, 168–174. [Google Scholar] [CrossRef]
- Panpranot, J.; Goodwin, J.G.; Sayari, A. Synthesis and characteristics of MCM-41 supported CoRu catalysts. Catal. Today 2002, 77, 269–284. [Google Scholar] [CrossRef]
- Iglesia, E.; Reyes, S.C.; Madon, R.J.; Soled, S.L. Selectivity Control and Catalyst Design in the Fischer-Tropsch Synthesis: Sites, Pellets, and Reactors. Adv. Catal. 1993, 39, 221–302. [Google Scholar] [CrossRef]
- Iglesia, E.; Soled, S.L.; Fiato, R.A. Fischer-Tropsch synthesis on cobalt and ruthenium. Metal dispersion and support effects on reaction rate and selectivity. J. Catal. 1992, 137, 212–224. [Google Scholar] [CrossRef]
- Kang, S.H.; Bae, J.W.; Woo, K.J.; Prasad, P.S.S.; Jun, K.W. ZSM-5 supported iron catalysts for Fischer–Tropsch production of light olefin. Fuel Process. Technol. 2010, 91, 399–403. [Google Scholar] [CrossRef]
- Park, J.Y.; Lee, Y.J.; Khanna, P.K.; Jun, K.W.; Bae, J.W.; Kim, Y.H. Alumina-supported iron oxide nanoparticles as Fischer–Tropsch catalysts: Effect of particle size of iron oxide. J. Mol. Catal. A Chem. 2010, 323, 84–90. [Google Scholar] [CrossRef]
- Wielers, A.F.H.; Kock, A.J.H.M.; Hop, C.E.C.A.; Geus, J.W.; van Der Kraan, A.M. The reduction behavior of silica-supported and alumina-supported iron catalysts: A Mössbauer and infrared spectroscopic study. J. Catal. 1989, 117, 1–18. [Google Scholar] [CrossRef]
- Zhang, C.H.; Yang, Y.; Teng, B.T.; Li, T.Z.; Zheng, H.Y.; Xiang, H.W.; Li, Y.W. Study of an iron-manganese Fischer–Tropsch synthesis catalyst promoted with copper. J. Catal. 2006, 237, 405–415. [Google Scholar] [CrossRef]
- Ni, Z.; Qin, H.; Kang, S.; Bai, J.; Wang, Z.; Li, Y.; Zheng, Z.; Li, X. Effect of graphitic carbon modification on the catalytic performance of Fe@SiO2-GC catalysts for forming lower olefins via Fischer-Tropsch synthesis. J. Colloid. Interface Sci. 2018, 516, 16–22. [Google Scholar] [CrossRef] [PubMed]
- Sun, B.; Yu, G.; Lin, J.; Xu, K.; Pei, Y.; Yan, S.; Qiao, M.; Fan, K.; Zhang, X.; Zong, B. A highly selective Raney Fe@HZSM-5 Fischer–Tropsch synthesis catalyst for gasoline production: One-pot synthesis and unexpected effect of zeolites. Catal. Sci. Technol. 2012, 2, 1625–1629. [Google Scholar] [CrossRef]
- Su, L.; Jing, Y.; Zhou, Z. Li ion battery materials with core–shell nanostructures. Nanoscale 2011, 3, 3967–3983. [Google Scholar] [CrossRef] [PubMed]
- Song, F.; Yong, X.; Wu, X.; Zhang, W.; Ma, Q.; Zhao, T.; Tan, M.; Guo, Z.; Zhao, H.; Yang, G.; et al. FeMn@HZSM-5 capsule catalyst for light olefins direct synthesis via Fischer-Tropsch synthesis: Studies on depressing the CO2 formation. Appl. Catal. B 2022, 300, 120713. [Google Scholar] [CrossRef]
- Ni, Z.; Zhang, X.; Bai, J.; Wang, Z.; Li, X.; Zhang, Y. Potassium promoted core–shell-structured FeK@SiO2-GC catalysts used for Fischer–Tropsch synthesis to olefins without further reduction. New J. Chem. 2019, 44, 87–94. [Google Scholar] [CrossRef]
- Qiu, T.; Wang, L.; Lv, S.; Sun, B.; Zhang, Y.; Liu, Z.; Yang, W.; Li, J. SAPO-34 zeolite encapsulated Fe3C nanoparticles as highly selective Fischer-Tropsch catalysts for the production of light olefins. Fuel 2017, 203, 811–816. [Google Scholar] [CrossRef]
- Di, Z.; Zhao, T.; Feng, X.; Luo, M. A Newly Designed Core-Shell-Like Zeolite Capsule Catalyst for Synthesis of Light Olefins from Syngas via Fischer–Tropsch Synthesis Reaction. Catal. Lett. 2019, 149, 441–448. [Google Scholar] [CrossRef]
- Arslan, M.; Bepari, S.; Abrokwah, R.; Mohammad, N.; Shajahan, J.; Kuila, D. Effect of Al2O3 Support on Co-Based SiO2 Core–Shell Catalysts for Fischer–Tropsch Synthesis in 3D Printed SS Microchannel Microreactor. Top. Catal. 2022, 1, 477–497. [Google Scholar] [CrossRef]
- Arslan, M. Development of Core-Shell Catalysts for Fischer-Tropsch Synthesis in 3D Printed SS Microchannel Microreactors. In Spring 2020 Graduate Student Research Symposium; North Carolina Agricultural and Technical State University: Greensboro, NC, USA, 2020; Available online: https://digital.library.ncat.edu/gradresearchsymposium20/9 (accessed on 1 July 2025).
- Bepari, S.; Stevens-Boyd, R.; Mohammad, N.; Li, X.; Abrokwah, R.; Kuila, D. Composite mesoporous SiO2-Al2O3 supported Fe, FeCo and FeRu catalysts for Fischer-Tropsch studies in a 3-D printed stainless-steel microreactor. Mater. Today Proc. 2021, 35, 221–228. [Google Scholar] [CrossRef]
- Arslan, M. Development of Core-Shell Catalysts for Fischer-Tropsch Synthesis in 3D Printed SS Microchannel Microreactor and Tubular Reactor. Ph.D. Thesis, North Carolina Agricultural and Technical State University, Greensboro, NC, USA, 2023. [Google Scholar]
- Ni, Z.; Kang, S.; Bai, J.; Li, Y.; Huang, Y.; Wang, Z.; Qin, H.; Li, X. Uniformity dispersive, anti-coking core@double-shell-structured Co@SiO2@C: Effect of graphitic carbon modified interior pore-walls on C5+ selectivity in Fischer-Tropsch synthesis. J. Colloid. Interface Sci. 2017, 505, 325–331. [Google Scholar] [CrossRef]
- Tu, J.; Ding, M.; Zhang, Y.; Li, Y.; Wang, T.; Ma, L.; Wang, C.; Li, X. Synthesis of Fe3O4-nanocatalysts with different morphologies and its promotion on shifting C5+ hydrocarbons for Fischer–Tropsch synthesis. Catal. Commun. 2015, 59, 211–215. [Google Scholar] [CrossRef]
- Xie, R.; Wang, H.; Gao, P.; Xia, L.; Zhang, Z.; Zhao, T.; Sun, Y. Core@shell Co3O4@C-m-SiO2 catalysts with inert C modified mesoporous channel for desired middle distillate. Appl. Catal. A Gen. 2015, 492, 93–99. [Google Scholar] [CrossRef]
- Saleh, T.A. Nanocomposite of carbon nanotubes/silica nanoparticles and their use for adsorption of Pb (II): From surface properties to sorption mechanism. Desalination Water Treat. 2015, 57, 10730–10744. [Google Scholar] [CrossRef]
- Monshi, A.; Foroughi, M.R.; Monshi, M.R. Modified Scherrer equation to estimate more accurately nano-crystallite size using XRD. World J. Nano Sci. Eng. 2012, 2, 154–160. [Google Scholar] [CrossRef]
- Iglesia, E. Design, synthesis, and use of cobalt-based Fischer–Tropsch synthesis catalysts. Appl. Catal. A Gen. 1997, 161, 59–78. [Google Scholar] [CrossRef]
- Jiang, X.; Chen, Y.; Nisa, M.U.; Li, X.; Zhao, N.; Li, Z. Highly active FexOy@SiO2 catalyst for Fischer-Tropsch synthesis through the confinement effect of metal organic frameworks material: Preparation and structure-activity relationship. Mol. Catal. 2021, 513, 111813. [Google Scholar] [CrossRef]
- Sirikulbodee, P.; Ratana, T.; Sornchamni, T.; Phongaksorn, M.; Tungkamani, S. Catalytic performance of Iron-based catalyst in Fischer–Tropsch synthesis using CO2 containing syngas. Energy Procedia 2017, 138, 998–1003. [Google Scholar] [CrossRef]
- Li, Y.P.; Wang, T.J.; Wu, C.Z.; Qin, X.X.; Tsubaki, N. Effect of Ru addition to Co/SiO2/HZSM-5 catalysts on Fischer–Tropsch synthesis of gasoline-range hydrocarbons. Catal. Commun. 2009, 10, 1868–1874. [Google Scholar] [CrossRef]
- Adeli, M.; Seyedein, S.H.; Aboutalebi, M.R.; Kobashi, M.; Kanetake, N. Implementation of DSC analysis in reaction kinetics during heating of Ti–50 at.%Al powder mixture. J. Therm. Anal. Calorim. 2017, 128, 867–874. [Google Scholar] [CrossRef]
- Tengku-Rozaina, T.M.; Birch, E.J. Thermal oxidative stability analysis of hoki and tuna oils by Differential Scanning Calorimetry and Thermogravimetry. Eur. J. Lipid Sci. Technol. 2016, 118, 1053–1061. [Google Scholar] [CrossRef]
- Pejova, B.; Isahi, A.; Najdoski, M.; Grozdanov, I. Fabrication and characterization of nanocrystalline cobalt oxide thin films. Mater. Res. Bull. 2001, 36, 161–170. [Google Scholar] [CrossRef]
- Yang, C.; Zhao, H.; Hou, Y.; Ma, D. Fe 5C 2 nanoparticles: A facile bromide-induced synthesis and as an active phase for Fischer-Tropsch synthesis. J. Am. Chem. Soc. 2012, 134, 15814–15821. [Google Scholar] [CrossRef]
- Galakhov, V.R.; Shkvarin, A.S.; Semenova, A.S.; Uimin, M.A.; Mysik, A.A.; Shchegoleva, N.N.; Yermakov, A.Y.; Kurmaev, E.Z. Characterization of carbon-encapsulated nickel and iron nanoparticles by means of X-ray absorption and photoelectron spectroscopy. J. Phys. Chem. C 2010, 114, 22413–22416. [Google Scholar] [CrossRef]
- Bukur, D.B.; Nowicki, L.; Manne, R.K.; Lang, X.S. Activation Studies with a Precipitated Iron Catalyst for Fischer-Tropsch Synthesis: II. Reaction Studies. J. Catal. 1995, 155, 366–375. [Google Scholar] [CrossRef]
- Lam, D.J.; Paulikas, A.P.; Veal, B.W. X-ray photoemission spectroscopy studies of soda aluminosilicate glasses. J. Non Cryst. Solids 1980, 42, 41–47. [Google Scholar] [CrossRef]
- Biesinger, M.C.; Payne, B.P.; Grosvenor, A.P.; Lau, L.W.M.; Gerson, A.R.; Smart, R.S.C. Resolving surface chemical states in XPS analysis of first row transition metals, oxides and hydroxides: Cr, Mn, Fe, Co and Ni. Appl. Surf. Sci. 2011, 257, 2717–2730. [Google Scholar] [CrossRef]
- Mohammad, N.; Bepari, S.; Aravamudhan, S.; Kuila, D. Kinetics of Fischer–Tropsch Synthesis in a 3-D Printed Stainless Steel Microreactor Using Different Mesoporous Silica Supported Co-Ru Catalysts. Catalysts 2019, 9, 872. [Google Scholar] [CrossRef]
- Nohira, H.; Tsai, W.; Besling, W.; Young, E.; Petry, J.; Conard, T.; Vandervorst, W.; De Gendt, S.; Heyns, M.; Maes, J.; et al. Characterization of ALCVD-Al2O3 and ZrO2 layer using X-ray photoelectron spectroscopy. J. Non Cryst. Solids 2002, 303, 83–87. [Google Scholar] [CrossRef]
- Bepari, S.; Li, X.; Abrokwah, R.; Mohammad, N.; Arslan, M.; Kuila, D. Co-Ru catalysts with different composite oxide supports for Fischer–Tropsch studies in 3D-printed stainless steel microreactors. Appl. Catal. A Gen. 2020, 608, 117838. [Google Scholar] [CrossRef]
- Liang, C.; Tian, H.; Gao, G.; Zhang, S.; Liu, Q.; Dong, D.; Hu, X. Methanation of CO2 over alumina supported nickel or cobalt catalysts: Effects of the coordination between metal and support on formation of the reaction intermediates. Int. J. Hydrogen Energy 2020, 45, 531–543. [Google Scholar] [CrossRef]
- Bae, J.S.; Hong, S.Y.; Park, J.C.; Rhim, G.B.; Youn, M.H.; Jeong, H.; Kang, S.W.; Yang, J.I.; Jung, H.; Chun, D.H. Eco-friendly prepared iron-ore-based catalysts for Fischer-Tropsch synthesis. Appl. Catal. B 2019, 244, 576–582. [Google Scholar] [CrossRef]
- Cárdenas-Lizana, F.; Wang, X.; Lamey, D.; Li, M.; Keane, M.A.; Kiwi-Minsker, L. An examination of catalyst deactivation in p-chloronitrobenzene hydrogenation over supported gold. Chem. Eng. J. 2014, 255, 695–704. [Google Scholar] [CrossRef]
- Meng, Y.; Chen, D.; Jiao, X. Fabrication and characterization of mesoporous Co3O4 core/mesoporous silica shell nanocomposites. J. Phys. Chem. B 2006, 110, 15212–15217. [Google Scholar] [CrossRef] [PubMed]
- Hassan, S.; Arslan, M.; Shajahan, J.; Bepari, S.; Vidanapathirana, P.; Kuila, D. Fischer-tropsch synthesis of fuels and olefins in 3D printed SS microreactor using iron/graphene oxide catalysts with Mn- and Na-metal promoters. Int. J. Hydrogen Energy 2024, 67, 1248–1261. [Google Scholar] [CrossRef]
- Arslan, M.; Bepari, S.; Shajahan, J.; Hassan, S.; Kuila, D. Effect of Preparation Conditions of Fe@SiO2 Catalyst on Its Structure Using High-Pressure Activity Studies in a 3D-Printed SS Microreactor. Molecules 2025, 30, 280. [Google Scholar] [CrossRef] [PubMed]
Disclaimer/Publisher’s Note: The statements, opinions and data contained in all publications are solely those of the individual author(s) and contributor(s) and not of MDPI and/or the editor(s). MDPI and/or the editor(s) disclaim responsibility for any injury to people or property resulting from any ideas, methods, instructions or products referred to in the content. |
© 2025 by the authors. Licensee MDPI, Basel, Switzerland. This article is an open access article distributed under the terms and conditions of the Creative Commons Attribution (CC BY) license (https://creativecommons.org/licenses/by/4.0/).