Article

Investigating the Effect of Hydrogen Bonding on the Viscosity of an Aqueous Methanol Solution Using Raman Spectroscopy

1
School of Arts and Sciences, Guangzhou Maritime University, Guangzhou 510725, China
2
School of Electrical Engineering, Shandong Huayu University of Technology, Dezhou 253000, China
3
School of Shipping and Maritime Studies, Guangzhou Maritime University, Guangzhou 510725, China
*
Authors to whom correspondence should be addressed.
Molecules 2025, 30(15), 3204; https://doi.org/10.3390/molecules30153204
Submission received: 5 April 2025 / Revised: 10 July 2025 / Accepted: 18 July 2025 / Published: 30 July 2025
(This article belongs to the Section Molecular Liquids)

Abstract

Water science has always been a central part of modern scientific research. In this study, the viscosity and hydrogen bond structures of methanol aqueous solutions with different molar ratios were investigated via confocal microscopic Raman spectroscopy. The Raman spectra of methanol in the CH and CO stretching regions were measured in order to investigate the structure of water/methanol molecules. The points of transition were identified by observing changes in viscosity following changes in concentration, and the bands were assigned to the C-H bond vibration shifts where the molar ratios of methanol and water were 1:3 and 3:1. Furthermore, the large band shift of 19 cm−1 between the methanol solutions with the lowest and highest concentrations contained three hydrogen bond network modes, affecting the viscosity of the solution. This study provides an explanation for the relationship between the microstructures and macroscopic properties of aqueous solutions.

1. Introduction

Water and methanol are the most commonly used solvents in natural sciences, engineering technology, agriculture, medicine, and economics, demonstrating their importance [1,2,3]. However, there is some controversy regarding their structures because of the complex hydrogen bonding networks involved [4,5,6]. The obvious importance of water as a solvation medium has fueled tremendous efforts to understand the properties of aqueous solutions. The anomalous properties of water are determined by continuous 3D networks of hydrogen bonds between neighboring molecules [7,8,9,10,11,12,13,14]. The variety of local environments of different OH groups leads to variations in the geometry and energy of their H-bonds. Alcohol molecules are typical organic molecules that contain hydrophobic groups and hydrophilic groups. Monohydric alcohols possess the simplest structures, making them ideal for studying hydrogen bonding in aqueous methanol solutions.
Raman spectroscopy is useful for studying structures in water [15,16,17,18,19] and has been used extensively to study the structures of methanol and its aqueous solutions [20,21] as it can effectively avoid the destruction of molecular structures in methanol solutions. Raman spectroscopy is the most sensitive method used for studying H-bonding in the stretching vibration regions of OH groups. Methanol molecules are believed to affect the hydrogen bonding networks of water, since methanol is an associating liquid that can both donate and accept hydrogen bonds, yet water–methanol mixtures also possess an OH group. Wavenumber shifts in Raman bands include a change in the microstructure of the solution and the formation of hydrogen bonds between methanol and water molecules. In order to understand the structural changes in methanol and methanol–water solutions, Ebukuro et al. [21] measured the frequency shifts in the Raman characteristic bands of methanol in both pure methanol and a methanol–water mixture at high temperature and high pressure. The results of their ab initio theory and Raman spectroscopy accounted for the spectral features of the two components in the binary mixture. Liu Huaibo et al. [22] used density functional theory to analyze the characteristic Raman bands of monohydric alcohols. Ouyang et al. [23] assigned characteristic Raman bands to different vibrational modes using a simulated Raman spectra calculation of methanol molecules. Many researchers [24,25,26,27,28,29,30,31] have investigated the physicochemical behavior of different concentrations of methanol–water mixtures with experimental DFT characterization to derive an optimized framework for methanol molecules in water. Statistical analysis has also been used to analyze the hydrogen bond structures of water–methanol mixtures; the methanol–water binary solutions showed three hydrated structures, which transformed when the molar ratios were 0.7 and 0.25.
When the microstructure of a solution changes, its macroscopic properties also change, which is an important aspect of studying the physical and chemical properties of a solution through the relationship between its microstructure and its surface tension and viscosity [22,23,24,25]. However, many connections within methanol–water mixtures remain poorly understood. In this article, we extended our work to the more important case of establishing the relationship between the microstructure and viscosity of aqueous solutions. We found that, in methanol–water mixtures, the C-O band undergoes a large shift, while the O-H band only undergoes a slight blueshift owing to the hydrogen bonds formed by the methanol and water molecules. More importantly, the structure of the hydrogen bonds affects the viscosity of the mixture. Raman spectra were used to semi-quantitatively determine the relationship between hydrogen bonding and macroscopic properties.

2. Results and Discussion

Methanol molecules are the smallest among the alcohols, consisting of one methyl group and one hydroxyl group. When methanol molecules interact with water molecules, the molecular structure is significantly affected and can be recorded by Raman spectra. Methanol molecules only contain three groups: C-O, O-H, and C-H. Changes in the O-H stretching vibration band can be used to determine hydrogen bonds, and methanol itself also has O-H bonds. Therefore, we studied the hydrogen bonding between methanol and water using the frequency shifts in the Raman peaks of methanol’s C-O and C-H bond vibrations. The frequency of the characteristic bands decreased slightly with the decrease in methanol content. The destructive effect of water on the molecular chain structure of methanol was obvious; the hydrogen bonds between methanol molecules were gradually replaced by new hydrogen bonds (CH3OH…H2O). Figure 1 shows the Raman spectrum of pure methanol. The Raman bands and their vibration modes are assigned as follows, from low to high wavenumbers: The Raman band at 1031 cm−1 is assigned to the C-O stretching vibration. The Raman band at 1451 cm−1 is assigned to the CH3 asymmetric deformation vibration. The Raman bands at 2840 cm−1 are assigned to the CH2 symmetrical stretching vibrations, and the Raman bands near 2944 cm−1 are assigned to the CH3 asymmetrical deformation vibrations. In the range of 3100–3800 cm−1, the characteristic bands correspond to OH stretching vibrations. The molecular vibration assignments of liquid methanol are shown in Table 1.

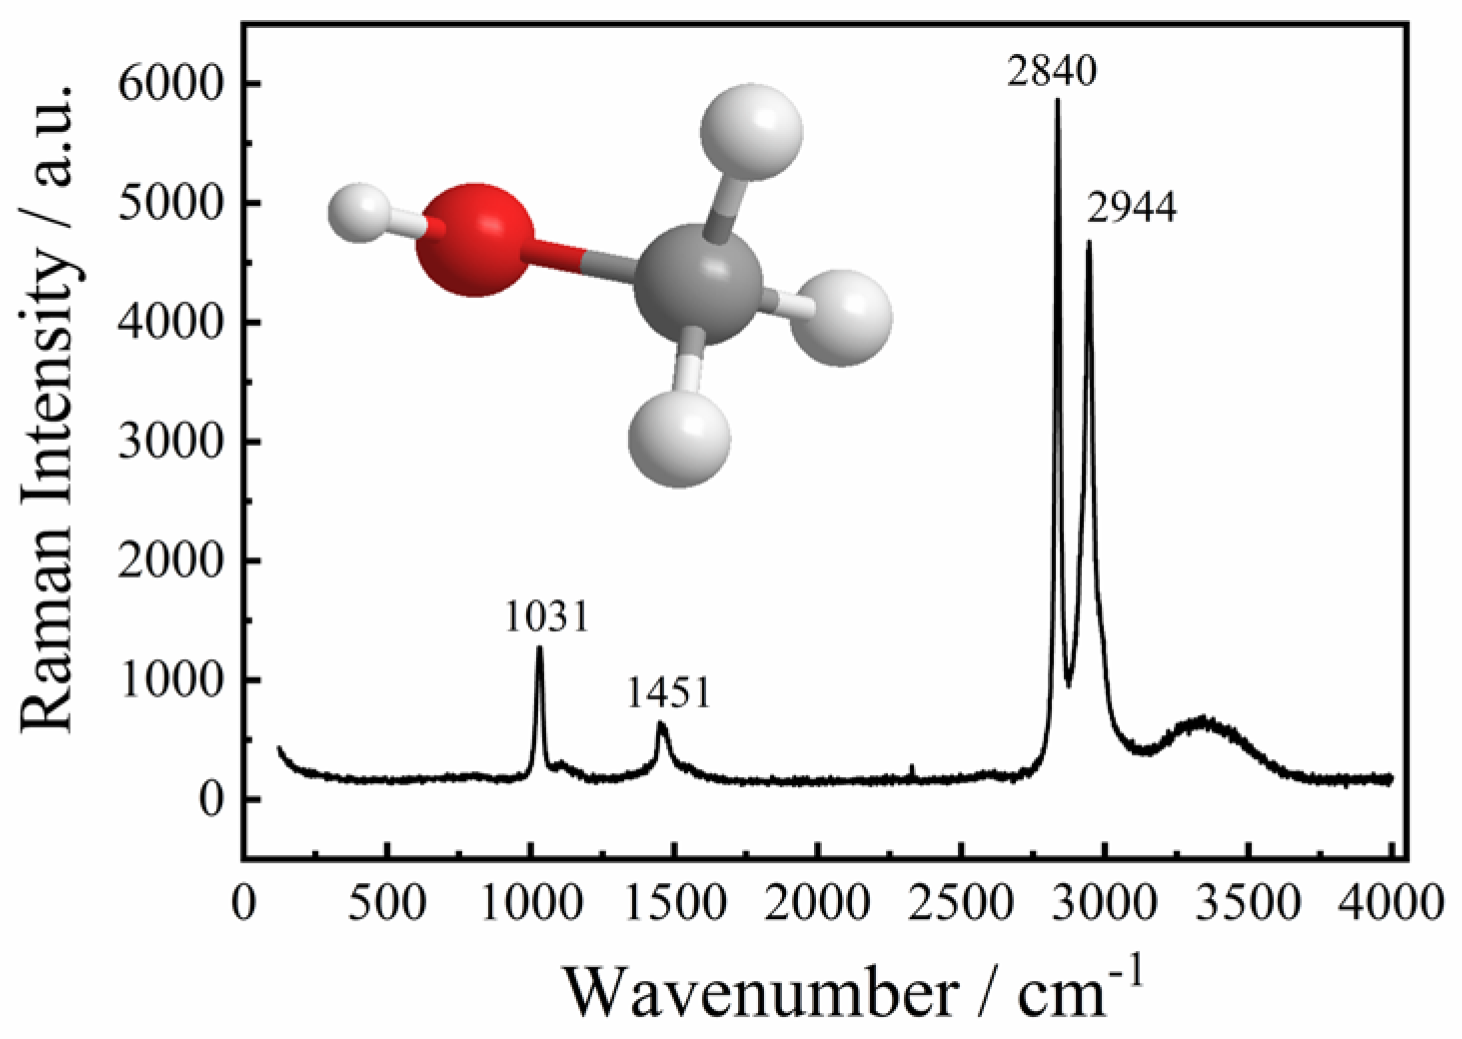
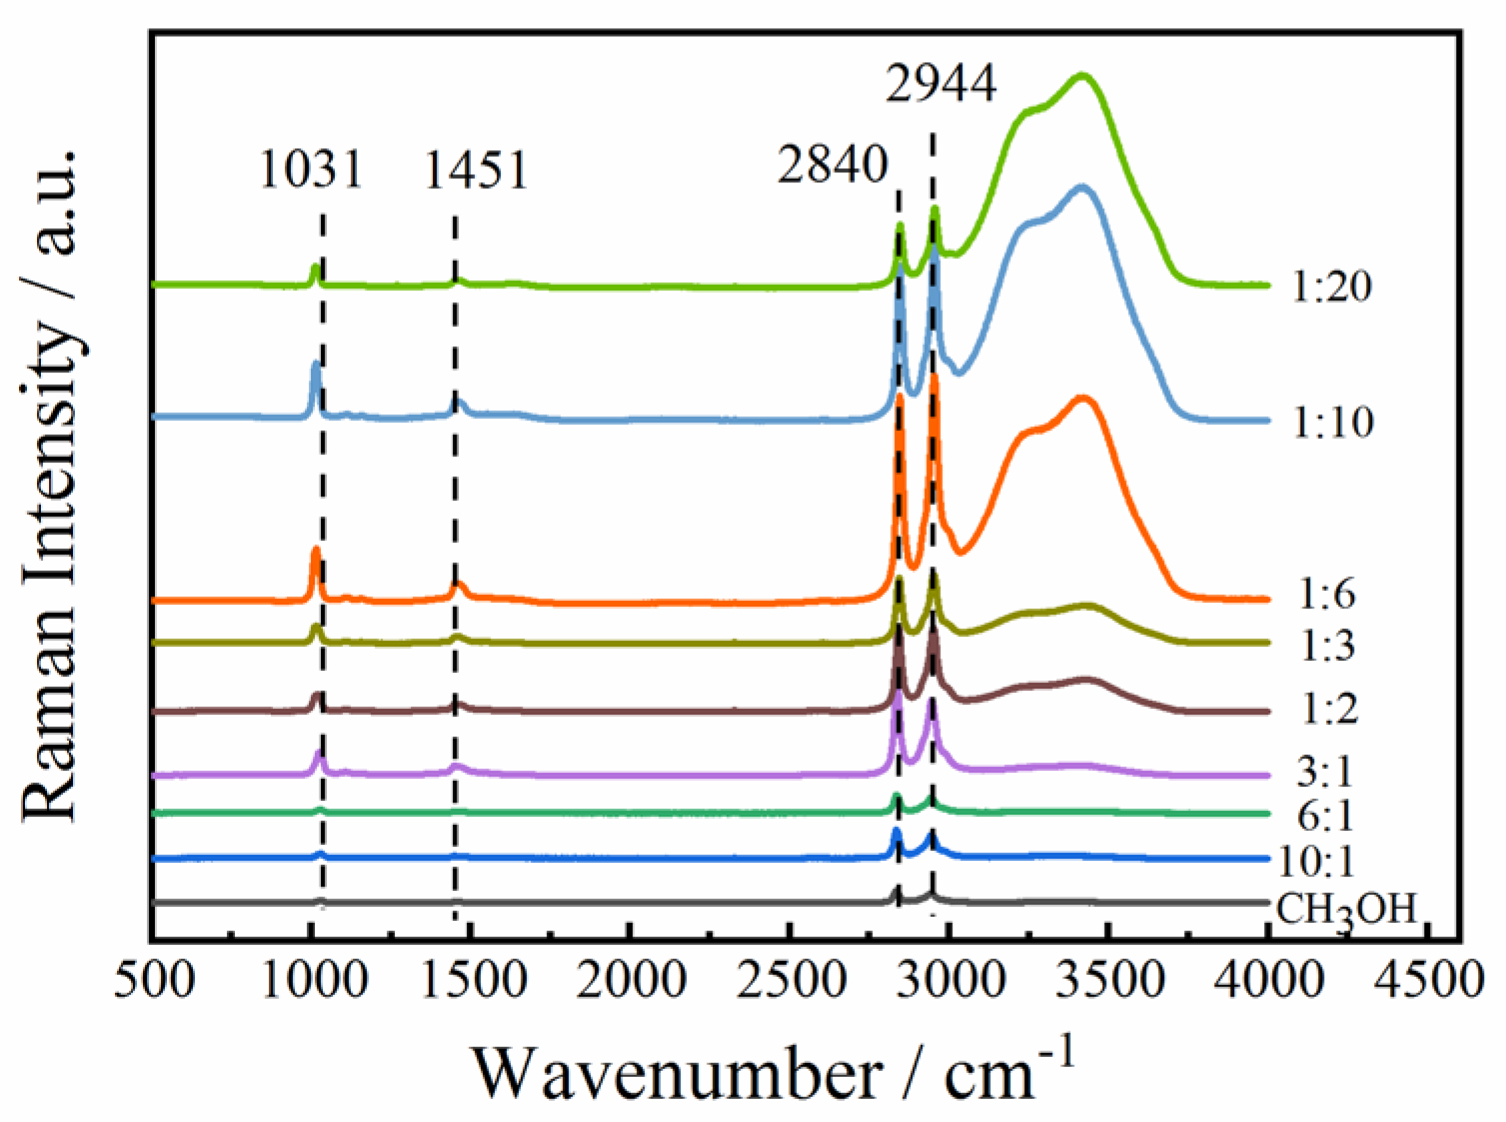
2.1. The Effect of Hydrogen Bonds on C-O, C-H, and O-H Bonds

The Raman spectra of both neat methanol and its binary mixtures with different molar ratios are shown in Figure 2. As can be observed, two characteristic bands assigned to the C-O stretching vibration and C-H stretching vibration modes of methanol molecules in methanol–water solutions are presented. The shifts in the bands are different for all molar ratios. It is likely that the presence of a weaker band gives rise to an apparent asymmetry. This may be the result of different inter-molecular interactions and their extents in mixtures containing varying concentrations of methanol. Figure 3 presents the optimized structures of (methanol)n-(water)n clusters (Mn Wn, n = 1–4) calculated at the B3LYP/6-311++G(d, p) level using the BDF software (No. BDF-2024A).
As the methanol concentration increases, the Raman bands of the O-H stretching vibrations shift to lower wavenumbers. When the molar ratio of methanol is lower than 1:3, the characteristic band assigned to the C-O stretching vibration mode hardly shifts. The redshift of characteristic bands is assigned to the C-H stretching vibration modes. When the molar ratio of methanol is higher than 1:3, the characteristic bands assigned to the C-O stretching vibration mode are blueshifted, and the characteristic bands assigned to the C-H stretching vibration mode are redshifted. When the molar ratio of methanol is higher than 3:1, the characteristic band assigned to the C-O stretching vibration mode hardly shifts. The frequency shift with concentration in the characteristic band assigned to the C-O stretching vibration mode is shown in Figure 3; it can be inferred that the transition points of the hydrogen bond structure in the solution occur when the molar ratios of methanol to water are 1:3 and 3:1.
The hydrogen bonding between methanol molecules and water molecules in aqueous methanol solutions with varying concentrations was analyzed by measuring the Raman spectra of several groups (see Figure 4). The hydrogen bond structure formed by the interaction between methanol and water molecules was studied by the frequency shifts in the Raman bands of the C-O, O-H, and C-H bond vibrations according to the relationship between the vibrational frequency of diatomic molecules and the vibrational force constant [26]:
ν = 1 / 2 π c k / μ
where ν is the vibration frequency of the O-H stretching vibration mode in water molecules, k is the vibration force constant, c is the speed of light, and μ is the mass of a single particle. It can be observed that the vibration frequency and the vibration force constant have a proportional relationship in Equation (1). As the vibration frequency increases, the vibration force constant increases. The vibration force constant is related to the electron cloud density of the covalent bond. When the electron cloud density approaches that of any one of the two atoms, the vibration force constant decreases. Conversely, when it approaches the middle of the two atoms, the vibration force constant increases. For water molecules, the electron cloud density between O-H bonds is biased towards the oxygen atom due to its high electronegativity. The hydrogen atoms in the O-H bond interact with different groups in the methanol molecule to form hydrogen bonds. The O-H bond length in the H2O molecule increases, and the density of the electron cloud shifts more towards the O atom, away from the central position. Therefore, the wavenumber of the O-H stretching vibration mode of water molecules decreases with an increase in the relative content of methanol in the solution.
Wopenka et al. [27] laid the foundation for a quantitative analysis of Raman spectroscopy and simplified the expression of Raman scattering intensity to
I = K N σ I L
where K is the scale factor, N is the number of molecules with Raman activity, σ is the Raman cross-section, and IL is the intensity of the excitation light source. It can be seen from Equation (2) that the Raman scattering intensity is directly proportional to the concentration of the measured substance. The result indicates that the concentration of the measured substance can be obtained from the intensity of the Raman characteristic band. Importantly, using the relative intensity ratio as a parameter can eliminate the influence of test conditions on the measurement results. [28,29,30,31] The expression is as follows:
N = σ R σ I I R N R
Thereinto, R is the selected reference system. σ R / σ can be regarded as a constant.
In the 1400–1550 cm−1 range, there is a character band corresponding to the C-H stretching vibration mode. The intensity of the character band is noted as II. The intensity of the band that is attributed to the C-O stretching vibration mode is noted as IH. The C-H stretching vibration mode is used as the reference. The relative intensity is calculated as IH/II. The relationship between the concentration of the methanol and the relative intensity of the character band is obtained using MATLAB R2014a.
n = 0.1126 I H / I I + 0.4408
where n is the concentration of the methanol.
The Raman spectra demonstrate the hydrogen bonding structure of methanol molecules and water molecules. Methanol molecules and water molecules can form different molecular networks through hydrogen bonding, so many researchers have studied cluster structures in aqueous methanol solutions through hydrogen bonding [26,28,32,33,34,35,36,37]. In summary, through a large number of theoretical studies on the effect of hydrogen bonding on the structures of methanol–water binary solutions, when the molar ratios are 0.7 and 0.25 (i.e., molar ratios = 3:1 and 1:3), the structure changes. This change was recorded by Raman spectroscopy. By observing the frequency shift in the Raman characteristic bands of the solution, it can also be inferred that the transition points of the hydrogen bond structure in the solution occur when the molar ratios of methanol and water are 1:3 and 3:1, respectively.
The structural anomalies of water, methanol, and their mixtures pose challenges for the scientific community. Changes in the hydrogen bond structures of binary aqueous solutions exhibit unique local structures. When the molar ratio of methanol is lower than 1:3, the tetrahedral structure of water is rarely destroyed by methanol. A small number of water molecules in the tetrahedral structure are replaced by methanol molecules through hydrogen bonds. When the molar ratio of methanol is 1:3, the tetrahedral structure of water is completely destroyed and more water molecules rapidly form a monocyclic structure with methanol molecules. In this study, when the molar ratio of methanol was higher than 3:1, the hydrogen bonds of the methanol–water complexes began to break and methanol–methanol complexes were formed instead. The hydrogen bond length between methanol–methanol complexes increased, resulting in a reduction in the bond length of the C-O bond. A decrease in the bond length of the C-O bond led to an increase in the corresponding vibrational force constant. According to the diatomic molecular interaction formula (Equation (1)), as the vibrational force constant increases, the frequency also increases, indicating that the Raman band of the C-O bond shifts to a higher wavenumber, which is consistent with the shifts in the characteristic bands of the Raman spectra.

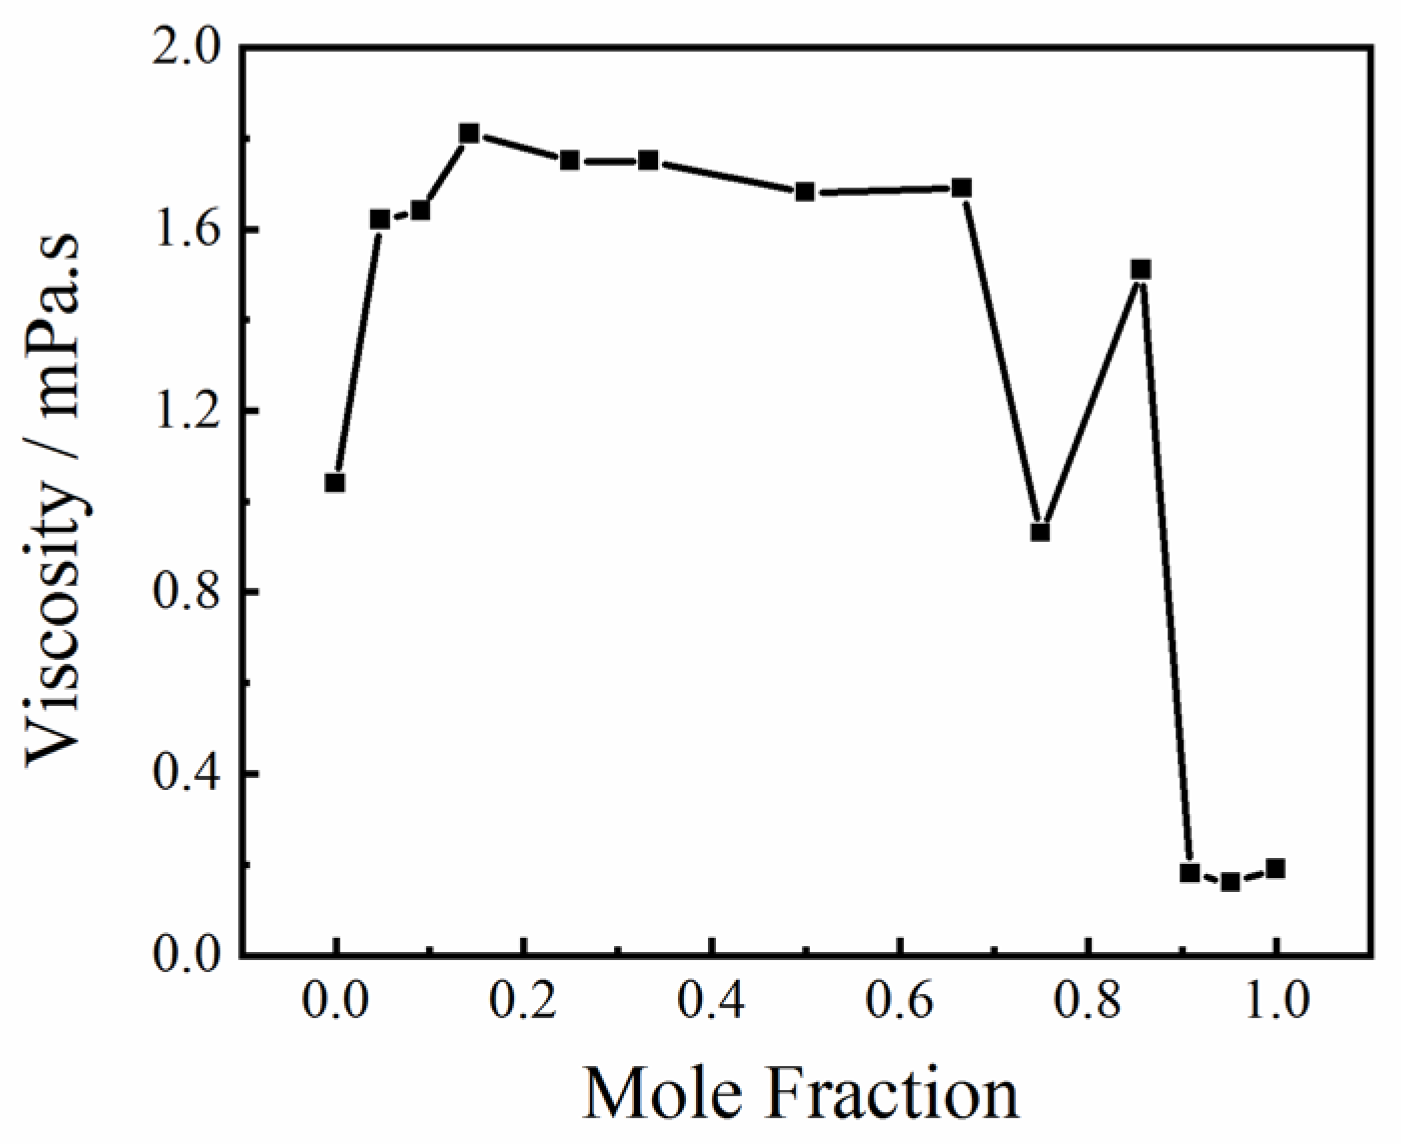
2.2. The Effect of Hydrogen Bond Interactions on the Viscosity of the Solution

When liquid flows, the opposing forces between the layers are called viscous forces. Viscosity is an important physical quantity used to measure the magnitude of internal friction, which is affected by factors such as molecular structure and temperature. As shown in Figure 5, the viscosity of the methanol–water binary mixture shows an irregular relationship with concentration. The viscosity of the mixed solution is greater than that of the two pure solutions.
In addition to the experimental measurements, the viscosity of mixed aqueous solutions and its influencing factors were studied using correlations and predictions with a viscosity calculation model. The Eyring equation [38], Grunberg–Nissan equation [39], and Weiland equation [40] are currently the most commonly used viscosity models. Compared with the Eyring and Grunberg–Nissan equations, the Weiland equation has more advantages and a wider application range. We used Weiland’s equation to predict viscosity, as it accounts for temperature as well as mass fraction and other influencing factors. The equation is expressed as follows:
η m i x = w 1 w 1 + w 2 η 1 + w 2 w 1 + w 2 η 2
In the formula, η m i x represents the viscosity of the mixed aqueous solution, w 1 and w 2 represent the mass fractions of methanol and pure water, respectively, and η 1 and η 2 represent the viscosity of the pure methanol and pure water, respectively. Since the solutions contained only methanol and water, we simplified the formula to the following:
η m i x = w 1 η 1 + w 2 η 2
According to the above formula, the viscosity of an aqueous methanol solution is influenced by the relative contents of the two substances in the solution. When w 1 η 1 > > w 2 η 2 , the viscosity of the methanol aqueous solution is infinitely close to the viscosity of methanol.
Viscosity is directly affected by the structure of the hydrogen bond network between the methanol and water molecules. With a change in the concentration of the solution, different hydrogen bond network structures are formed between the molecules in the solution, and the molecular cluster structure and viscosity both change. When a trace amount of methanol was added to pure water, the viscosity of the aqueous methanol solution increased slightly. A small amount of water molecules in the tetrahedral structure of water was replaced by methanol molecules, and the methanol and water molecules formed a tetrahedral structure through hydrogen bonding. When the molar ratio of methanol added to pure water was higher than 1:3, the viscosity varied in a small range. The tetrahedral structure was completely destroyed, and the water molecules rapidly formed a monocyclic structure with methanol molecules. When the molar ratio of methanol was higher than 3:1, the viscosity reduced quickly. The hydrogen bonds of the methanol–water complexes began to break and methanol–methanol complexes formed. This shows that the tetrahedral structure formed by methanol molecules and water molecules increases the viscosity of the solution and that the ring structure formed by methanol molecules and water molecules has little effect on the viscosity. When the methanol–methanol complex begins to form, the viscosity decreases rapidly. The influence of hydrogen bonding on the viscosity of an aqueous methanol solution is complex; the spatial structure of a hydrogen bond network, the form of hydrogen bond interactions, and the spatial directionality of hydrogen bond strength all affect viscosity.

3. Experimental Methods

3.1. Sample and Preparation

The methanol used in this experiment had over 99.5% purity and was not further purified before the experiment. Water was deionized by UPD-I-20T HYJD-D purchased from Sichuan ULUPURE Ultrapure Technology Co., Ltd. (Chengdu, China), with a resistivity of 18.25 MΩ·cm. All concentrations are expressed as molar ratios (nCH3OH:nH2O).

3.2. Experiment Apparatus

The Raman spectra were measured using a Renishaw inVia Qontor Raman spectrometer (Renishaw, inVia Qontor, Wotton-under-Edge, UK) equipped with a Leica microscope, a 532 nm solid-state laser, and an electron-multiplier CCD (charge-coupled device) detector. In the tests of the sample solutions, the scanning range was 0 to 4000 cm−1 and the resolution was ±1 cm−1; the exposure time was 10 s and the accumulation time was 1 s. The samples were placed in 5 mm diameter tubes and the spectra were acquired at room temperature.
The viscosities were measured by an NDJ-5S-type digital display viscometer purchased from Shanghai Precision Instrument Co., Ltd. (Shanghai, China). The measuring range was 1–100,000 m Pa·s, the accuracy was ±0.2 m Pa·s, Rotor 0 was selected, and the speed was either 30 RPM or 60 RPM.
The optimized structures of (methanol)n-(water)n clusters (Mn Wn, n = 1–4) calculated at the B3LYP/6-311++G(d, p) level were determined using the BDF software.

4. Conclusions and Perspectives

Raman spectroscopy was used to study the microscopic hydrogen bond structure in a methanol solution. Combined with the correlation of solution viscosity with concentration, this study showed that in a pure water system, the hydrogen bond structure changed with the addition of methanol. The relative content of the two solutes in the methanol–water binary mixture is different, and the hydrogen bond network structure of the methanol and water molecules is also changed under the action of hydrogen bonds. By observing the frequency shift in the Raman characteristic bands of the solution, it can be inferred that the transition points of the hydrogen bond structure in the solution occur when the molar ratios of methanol and water are 1:3 and 3:1, respectively. When the molar ratio of the mixed solution is higher than 3:1, methanol molecules no longer form a hydrogen bond structure with water molecules and instead start to form methanol–methanol-type complexes. The change in the hydrogen bond network structure of the solution caused a great change in the viscosity of the mixed solution, indicating that the change in the solution viscosity was related to the structure of the hydrogen bond network.

Author Contributions

Formal analysis, N.-N.W.; Resources, S.-L.O.; Data curation, Z.L., Z.Q., X.L., J.H., B.L. and J.Q.; Writing—original draft, F.L.; Writing—review & editing, N.-N.W. and S.-L.O.; Funding acquisition, N.-N.W. All authors have read and agreed to the published version of the manuscript.

Funding

This project was supported by the National Natural Science Foundation of China (Grant No. 21864019), the Tertiary Education Scientific Research Project of Guangzhou Municipal Education Bureau (2024312053, 2024312054), and the Guangdong Provincial Special Innovative Project for Ordinary Higher Education Institutions (2024KTSCX147).

Institutional Review Board Statement

Not applicable.

Informed Consent Statement

Not applicable.

Data Availability Statement

The original contributions presented in this study are included in the article. Further inquiries can be directed to the corresponding authors.

Acknowledgments

We gratefully acknowledge HZWTECH for providing computation facilities.

Conflicts of Interest

The authors declare no conflict of interest.

References

  1. Li, C.-Y.; Le, J.-B.; Wang, Y.-H.; Chen, S.; Yang, Z.-L.; Li, J.-F.; Cheng, J.; Tian, Z.-Q. In situ probing electrified interfacial water structures at atomically flat surfaces. Nat. Mater. 2019, 18, 697–701. [Google Scholar] [CrossRef]
  2. Lang, X.; Shi, L.; Zhao, Z.; Min, W. Probing the structure of water in individual living cells. Nat. Commun. 2024, 15, 5271. [Google Scholar] [CrossRef]
  3. Westall, F.; André, B. The Importance of Water for Life. Space Sci. Rev. 2018, 214, 50. [Google Scholar] [CrossRef]
  4. Mishra, A.; Mohapatra, H.; Pradhan, M. Study of the perturbed hydrogen-bonded water structure of the hydration shell of N-Methyl-Acetamide by Raman multivariate curve resolution spectroscopy. J. Mol. Liquids. 2024, 410, 125574. [Google Scholar] [CrossRef]
  5. Zhou, G.Y. A Quantum Chemistry Study of Hydrogen Bonds (1). J. Adv. Phys. Chem. 2015, 4, 84–101. [Google Scholar] [CrossRef]
  6. Zhou, G.Y. A Quantum Chemistry Study of Hydrogen Bonds (2). J. Adv. Phys. Chem. 2016, 5, 58–74. [Google Scholar] [CrossRef]
  7. Shiotari, A.; Sugimoto, Y. Characterization of two-and one-dimensional water networks on Ni (111) via atomic force microscopy. Phys. Rev. Mater. 2019, 3, 1–6. [Google Scholar] [CrossRef]
  8. Wang, Y.-H.; Li, S.; Zhou, R.-Y.; Zheng, S.; Zhang, Y.-J.; Dong, J.-C.; Yang, Z.-L.; Pan, F.; Tian, Z.-Q.; Li, J.-F. In situ electrochemical Raman spectroscopy and ab initio molecular dynamics study of interfacial water on a single-crystal surface. Nat. Protoc. 2023, 18, 883–901. [Google Scholar] [CrossRef] [PubMed]
  9. Nilson, A.; Pettersson, L.G.M. The structural origin of anomalous properties of liquid water. Nat. Commun. 2015, 6, 8998. [Google Scholar] [CrossRef] [PubMed]
  10. Han, G.; Liu, F.; Zhang, T.; Xu, W.; Zhang, Y.; Wu, N.; Ouyang, S. Study of microwave non-thermal effects on hydrogen bonding in water by Raman spectroscopy. Spectrochim. Acta Part A Mol. Biomol. Spectrosc. 2023, 285, 1386–1425. [Google Scholar] [CrossRef] [PubMed]
  11. Iachen, L.; Yun, K.; Yongtao, M.; Xin, T.; Wei-Hsuan, H.; Xiao, Z.; Aowen, L.; Mingquan, X.; Wu, Z.; Ching-Shun, K.; et al. Electroreduction of CO2 to formate on copper based electrocatalyst at high pressures with high energy conversion efficiency. J. Am. Chem. Soc. 2020, 142, 7276–7282. [Google Scholar]
  12. Xue, X.; He, Z.-Z.; Liu, J. Detection of water-ice phase transition based on Raman spectrum. J. Raman Spectrosc. 2019, 44, 1045–1048. [Google Scholar] [CrossRef]
  13. Yang, J.; Dettori, R.; Nunes, J.P.F.; List, N.H.; Biasin, E.; Centurion, M.; Chen, Z.; Cordones, A.A.; Deponte, D.P.; Heinz, T.F.; et al. Direct observation of ultrafast hydrogen bond strengthening in liquid water. Nature 2001, 596, 531–535. [Google Scholar] [CrossRef] [PubMed]
  14. Errington, J.R.; Debenedetti, P.G. Relationship between structural order and the anomalies of liquid water. Nature 2001, 409, 318–321. [Google Scholar] [CrossRef] [PubMed]
  15. Hu, Q.; Zhao, H.; Ouyang, S. Understanding water structure from Raman spectra of isotopic substitution H2O/D2O up to 573 K. Phys. Chem. Chem. Phys. 2017, 19, 21540–21547. [Google Scholar] [CrossRef]
  16. Liu, S.; Zhang, M.; Huang, B.; Wu, N.; Ouyang, S. Raman Spectroscopy for the Competition of Hydrogen Bonds in Ternary (H2O-THF-DMSO) Aqueous Solutions. Molecules 2019, 24, 3666. [Google Scholar] [CrossRef]
  17. Han, L.; Sun, Y.; Wang, S.; Su, T.; Cai, W.; Shao, X. Understanding the water structures by near-infrared and Raman spectroscopy. J. Raman Spectrosc. 2022, 53, 1686–1693. [Google Scholar] [CrossRef]
  18. Balos, V.; Kaliannan, N.K.; Elgabarty, H.; Wolf, M.; Kühne, T.D.; Sajadi, M. Time-resolved terahertz–Raman spectroscopy reveals that cations and anions distinctly modify intermolecular interactions of water. Nat. Chem. 2022, 14, 1031–1037. [Google Scholar] [CrossRef]
  19. Wang, Y.-H.; Zheng, S.; Yang, W.-M.; Zhou, R.-Y.; He, Q.-F.; Radjenovic, P.; Dong, J.-C.; Li, S.; Zheng, J.; Yang, Z.-L.; et al. In situ Raman spectroscopy reveals the structure and dissociation of interfacial water. Nature 2021, 600, 81. [Google Scholar] [CrossRef]
  20. Yang, B.; Cao, X.; Lang, H.; Wang, S.; Sun, C. Study on hydrogen bonding network in aqueous methanol solution by Raman spectroscopy. Spectrochim. Acta Part. A Mol. Biomol. Spectrosc. 2020, 225, 117488. [Google Scholar] [CrossRef]
  21. Ebukuro, T.; Takami, A.; Oshima, Y.; Koda, S. Raman spectroscopic studies on hydrogen bonding in methanol and methanol/water mixtures under high temperature and pressure. J. Supercrit. Fluids 1999, 15, 73–78. [Google Scholar] [CrossRef]
  22. Liu, H.; Chen, G.; Gu, J.; Zhu, C.; Song, X.; Zhang, X. Raman spectroscopic analysis and fast identification of several saturated monohydroxy alcohols. Spectrosc. Lett. 2017, 50, 347–351. [Google Scholar] [CrossRef]
  23. Ouyang, S.; Zhang, M.; Hu, Q.; Wei, H. Hydrogen Bonding Effect on the Surface Tension and Viscosity of DMSO Aqueous Solutions Studied by Raman Spectroscopy. Spectrosc. Spectr. Anal. 2018, 38, 2778–2781. [Google Scholar]
  24. Hsin, W.L.; Sheng, Y.-J.; Lin, S.-Y.; Tsao, H.-K. Surface tension increment due to solute addition. Phys. Rev. E Stat. Nonlinear Soft Matter Phys. 2004, 69, 031605. [Google Scholar] [CrossRef] [PubMed]
  25. David, R.; Neumann, A.W. A Theory for the Surface Tensions and Contact Angles of Hydrogen Bonding Liquids. Langmuir 2014, 30, 11634–11639. [Google Scholar] [CrossRef]
  26. Dixit, S.; Poon, W.C.K.; Crain, J. Hydration of methanol in aqueous solutions: A Raman spectroscopic study. J. Phys. Condens. Matter 2000, 12, 323–328. [Google Scholar] [CrossRef]
  27. Wopenka, B.; Pasteris, J.D. Raman Intensities and Detection Limits of Geochemically Relevant Gas Mixtures for a Laser Raman Microprobe. Anal. Chem. 1987, 59, 2165–2170. [Google Scholar] [CrossRef]
  28. Wang, Q.; Sun, Q. The Quantitative Analysis of Raman Spectroscopy to Suifate Ion in Aqueous Solution. Spectrosc. Spectr. Anal. 2016, 36, 430–435. [Google Scholar]
  29. Ouyang, S.; Zhou, M.; Cao, B.; Lu, G. Raman Spectral Analysis of the Anti-freezing Mechanism of Dimethyl Sulfoxide. Chem. J. Chin. Univ. 2008, 29, 2055–2058. [Google Scholar]
  30. Zou, Q.; Du, X.-Y.; Zhang, C.; Li, X.-C.; Li, Y. Vibrational Assignment Analysis of Raman Spectra of Fatty Alcohols. Spectrosc. Spectr. Anal. 2013, 33, 106–110. [Google Scholar]
  31. Weng, S. Fourier Transform Infrared Spectral Analysis; Chemical Industry Press: Beijing, China, 2016; pp. 6–8. [Google Scholar]
  32. Mir, J.M.; Itoo, F.A. Experimental-DFT interface of hydrogen bonding description of 1:10 methanol-water solution. J. Mol. Liq. 2017, 247, 1–5. [Google Scholar] [CrossRef]
  33. Bakó, I.; Megyes, T.; Bálint, S.; Grósz, T.; Chihaia, V. Water-methanol mixtures: Topology of hydrogen bonded network. Phys. Chem. Chem. Phys. 2008, 10, 5004–5011. [Google Scholar] [CrossRef]
  34. Dixit, S.; Crain, J.; Poon, W.; Finney, J.L.; Soper, A.K. Molecular segregation observed in a concentrated alcohol-water solution. Nature 2002, 6838, 829–832. [Google Scholar] [CrossRef]
  35. Matisz, G.; Kelterer, A.M.; Fabian, W.M.F.; Kunsági-Máté, S. Structural properties of methanol-water binary mixtures within the quantum cluster equilibrium model. Phys. Chem. Chem. Phys. 2015, 17, 8467–8479. [Google Scholar] [CrossRef]
  36. Laaksonen, A.; Kusalik, P.G.; Svishchev, I.M. Three-dimensional structure in water- methanol mixtures. J. Phys. Chem. A 1997, 101, 5910–5918. [Google Scholar] [CrossRef]
  37. Tomza, P.; Wrzeszcz, W.; Mazurek, S.; Szostak, R.; Czarnecki, M.A. Microheterogeneity in binary mixtures of water with CH3OH and CD3OH: ATR-IR spectroscopic, chemometric and DFT studies. Spectrochim. Acta Part. A Mol. Biomol. Spectrosc. 2018, 197, 88–94. [Google Scholar] [CrossRef] [PubMed]
  38. Tinker, D.; Lesher, C.E.; Baxter, G.M.; Uchida, T.; Wang, Y. High-pressure viscometry of polymerized silicate melts and limitations of the Eyring equation. Am. Mineral. 2004, 89, 1701–1708. [Google Scholar] [CrossRef]
  39. Vogel, H.; Weiss, A. Transport Properties of Liquids, III. Viscosity of Athermal Liquid Mixtures. Ztschrift Fr. Elektrochem. Berichte Der Bunsenges. Fr. Phys. Chem. 2010, 86, 193–198. [Google Scholar] [CrossRef]
  40. He, Y.; Xu, X.; Yang, L.; Ding, B. Viscosity modeling for ionic liquid solutions by Eyring-Wilson equation. Chem. Ind. Chem. Eng. Q. 2012, 18, 441–447. [Google Scholar] [CrossRef]
Figure 1. Raman spectrum of pure methanol. A schematic diagram of the monomolecular structure of methanol is shown in the upper left.
Molecules 30 03204 g001
Figure 2. Raman spectra of pure methanol and methanol–water binary aqueous solutions (nCH3OH:nH2O) with different molar ratios.
Molecules 30 03204 g002
Figure 3. Optimized geometric structures of methanol–water clusters calculated at the B3LYP/6-311++G(d, p) level.
Molecules 30 03204 g003
Figure 4. (a) The characteristic bands assigned to C-O stretching vibration modes in methanol aqueous solution (nCH3OH: nH2O) with different molar ratios. (b) Wavenumber shifts in the bands.
Molecules 30 03204 g004
Figure 5. Viscosity characteristics of pure methanol and methanol–water binary mixtures with different mole fractions.
Molecules 30 03204 g005
Table 1. Molecular vibration assignments of pure methanol.
Serial NumberWavenumber, m−1AssignmentsRef.
11031C-O stretching vibration[20,24,25]
21451CH3 asymmetrical deformation vibration[20,24,25]
32840CH2 symmetrical stretching vibration[20,24,25]
42944CH3 asymmetrical deformation vibration[20,24,25]
53100–3800OH stretching vibration[20,24,25]
Disclaimer/Publisher’s Note: The statements, opinions and data contained in all publications are solely those of the individual author(s) and contributor(s) and not of MDPI and/or the editor(s). MDPI and/or the editor(s) disclaim responsibility for any injury to people or property resulting from any ideas, methods, instructions or products referred to in the content.

