
Isolation of Humic Substances Using Waste Wood Ash Extracts: Multiparametric Optimization via Box–Behnken Design and Chemical Characterization of Products


Abstract

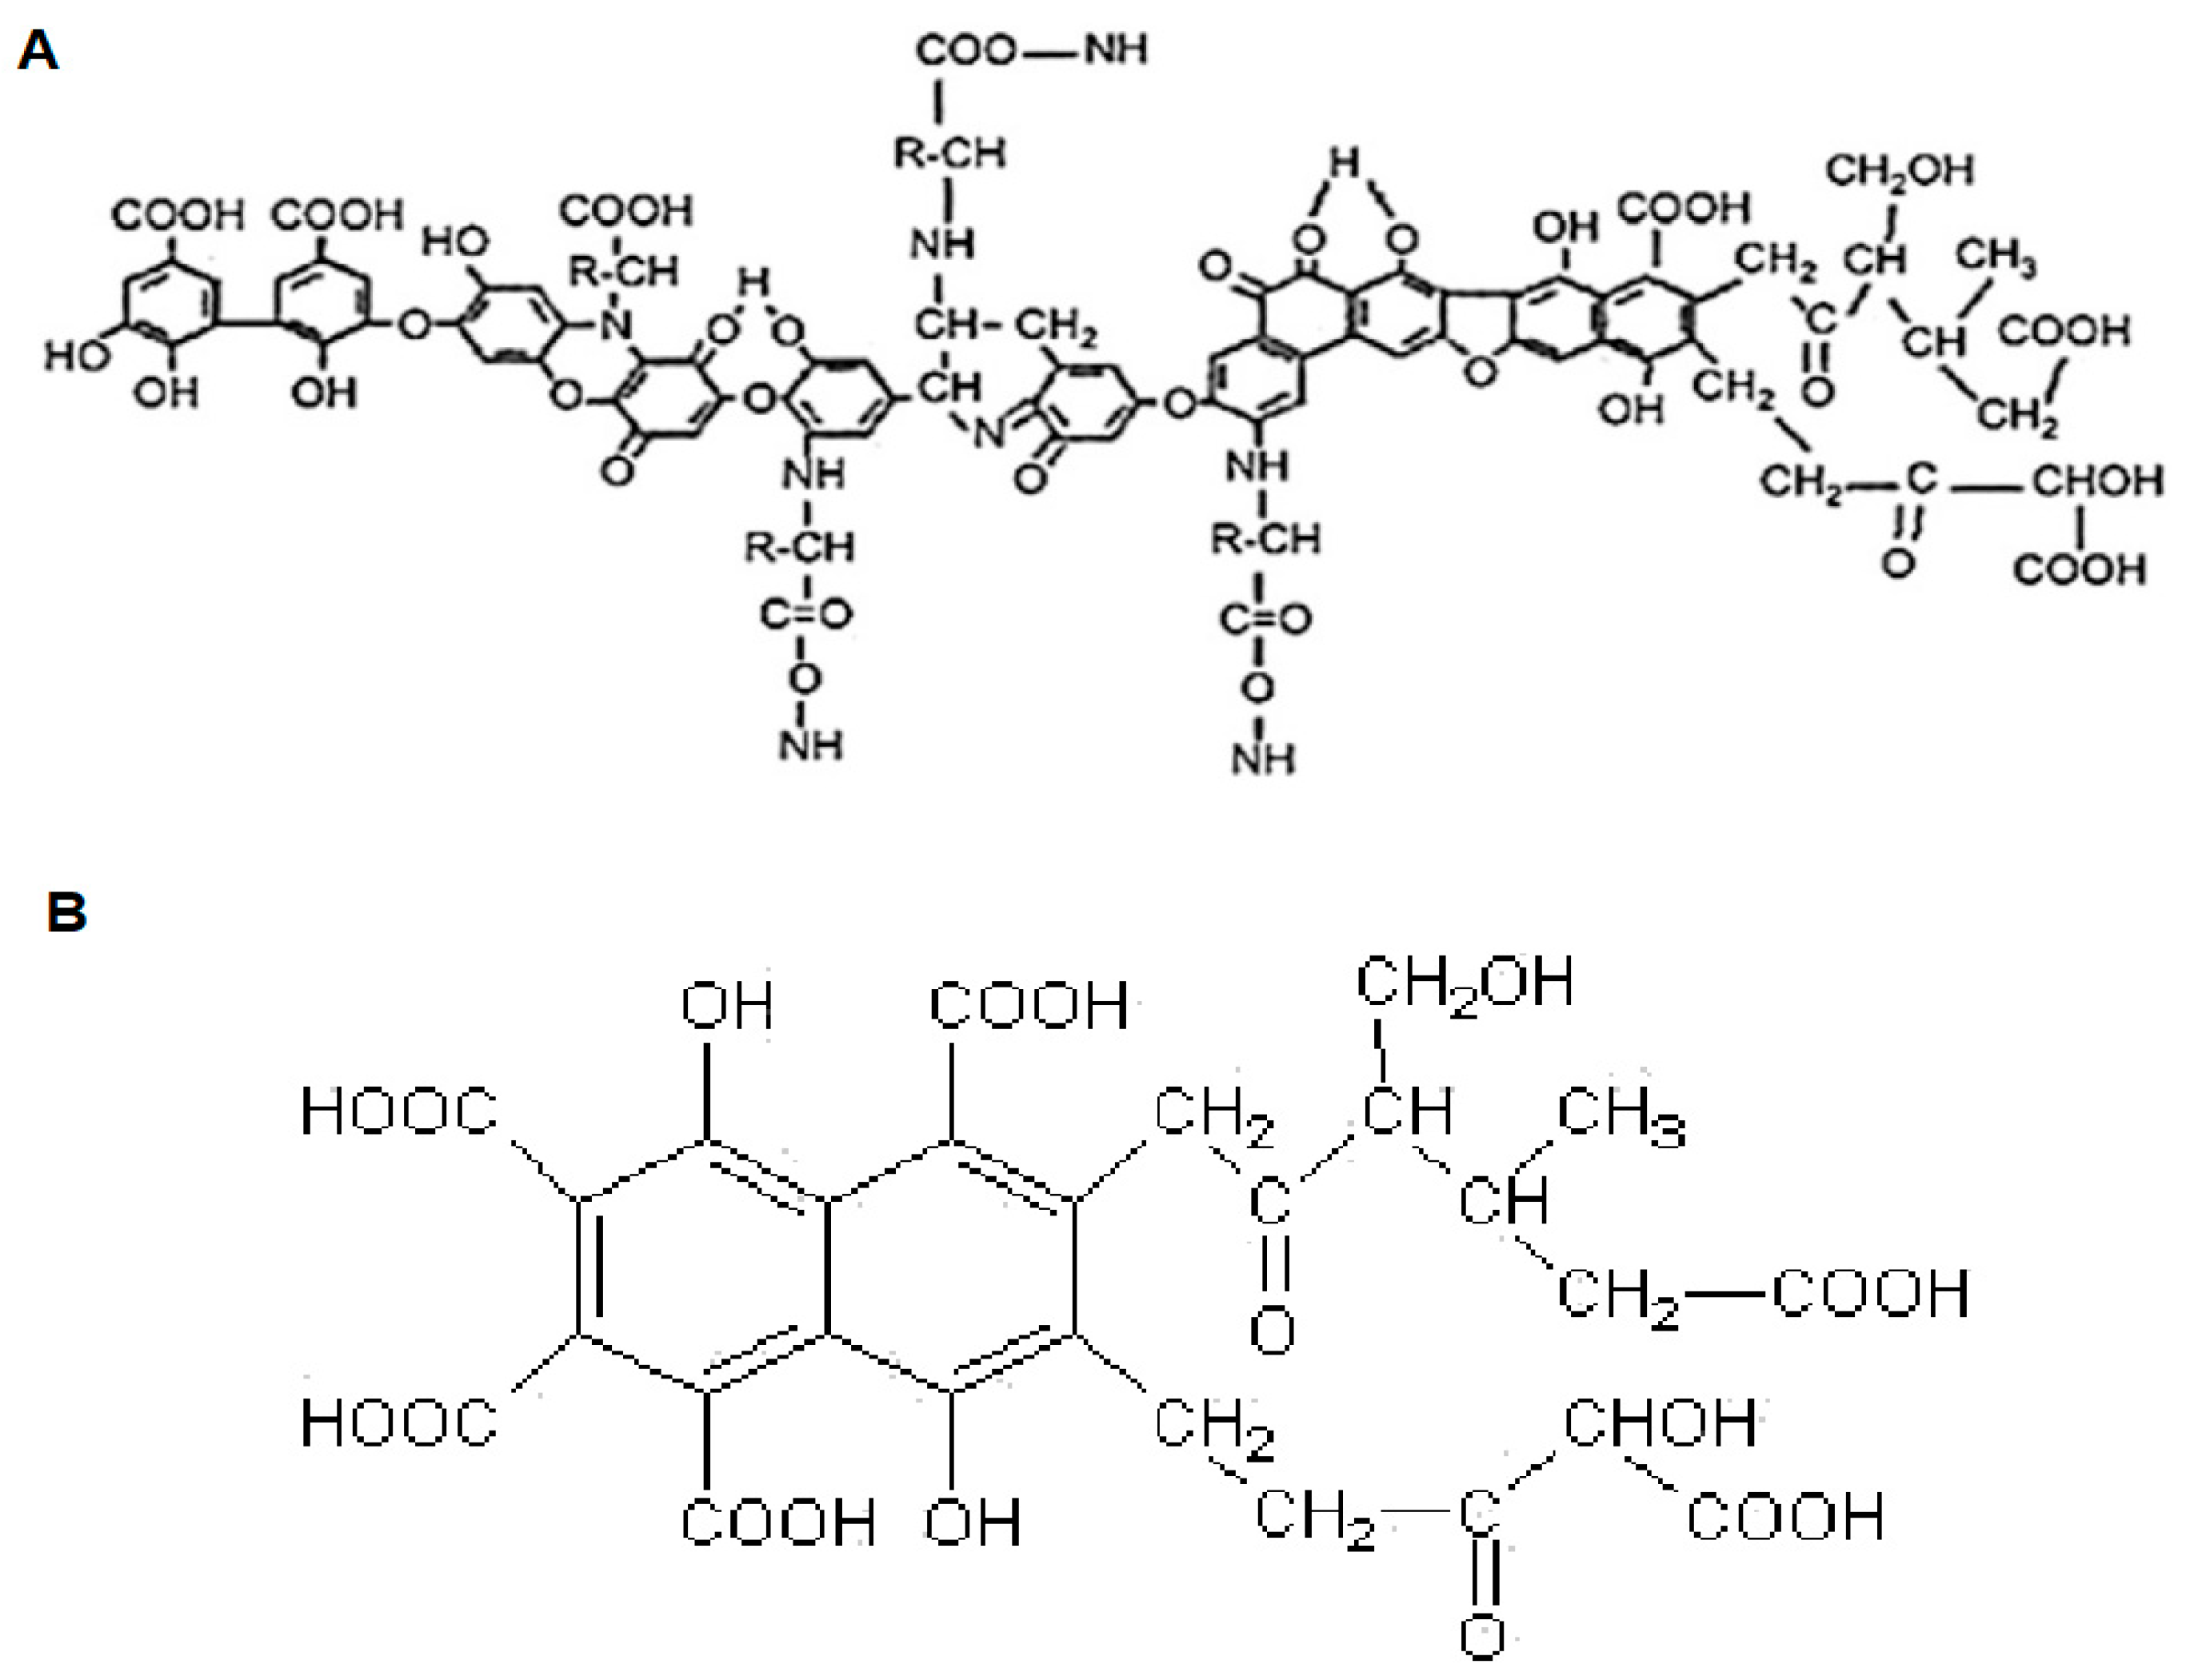
1. Introduction
2. Results and Discussion
2.1. Characterization of Wood Ash Samples and Their Extracts
2.2. Statistical Analysis
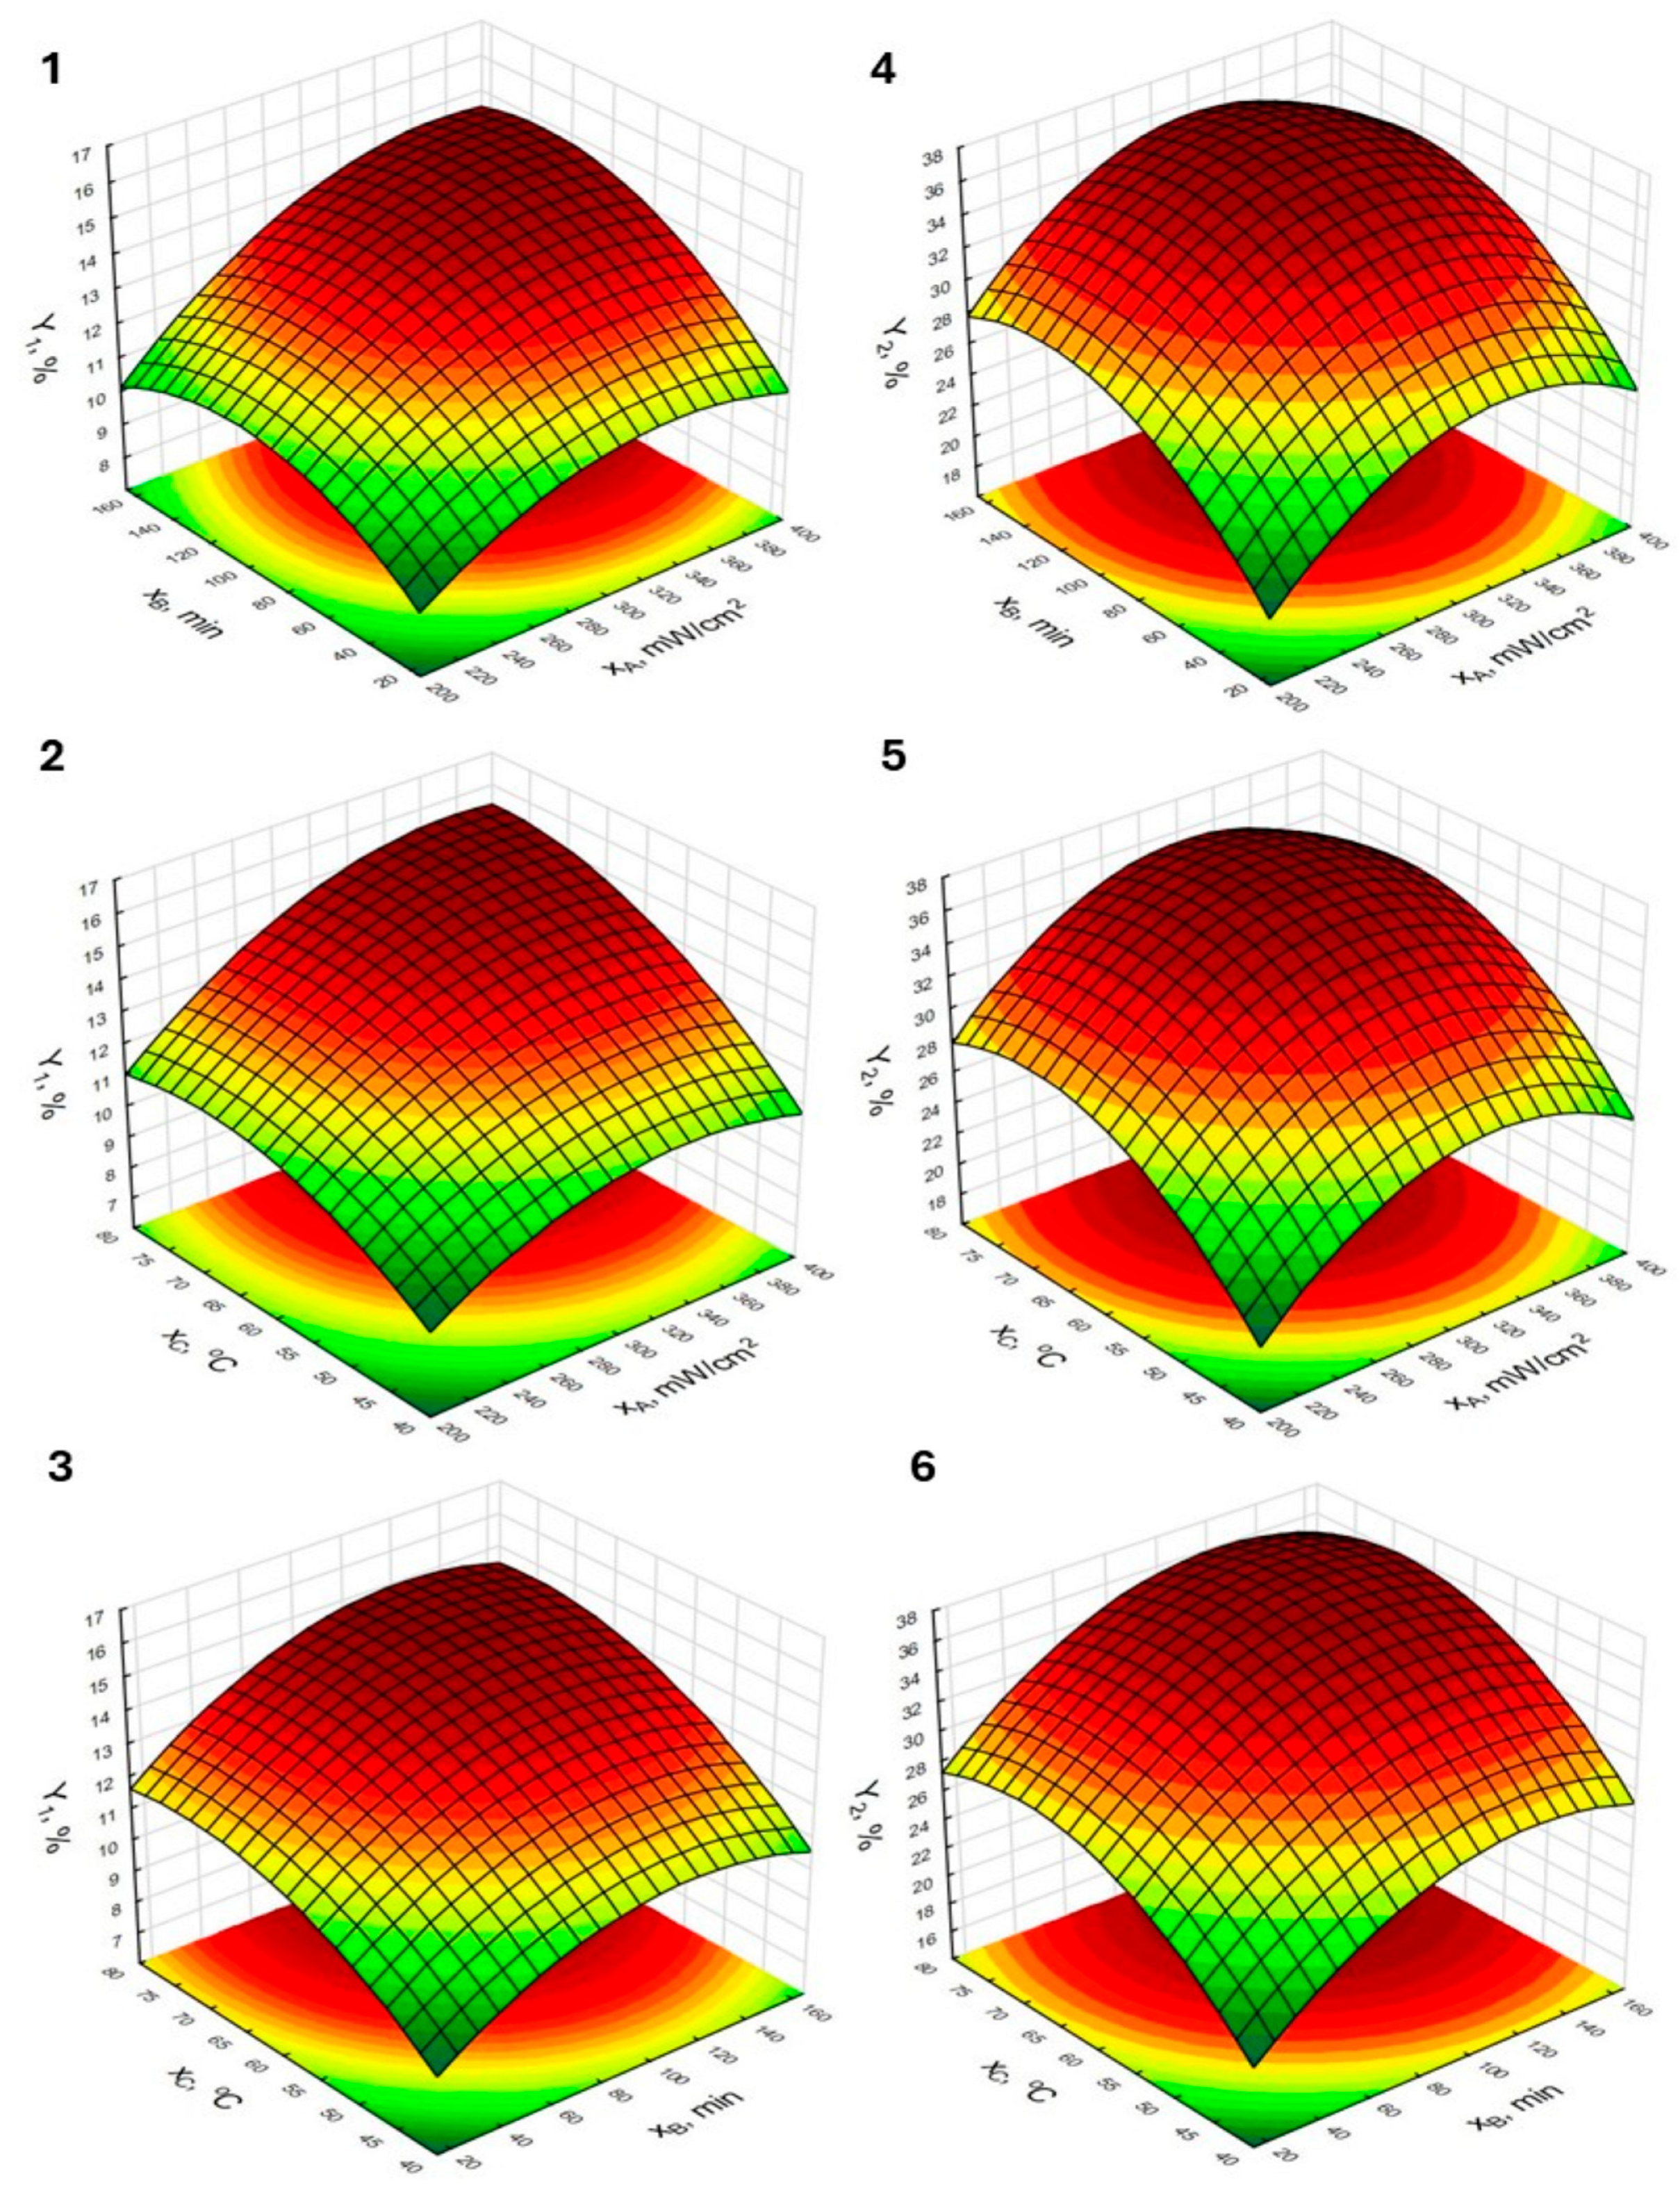
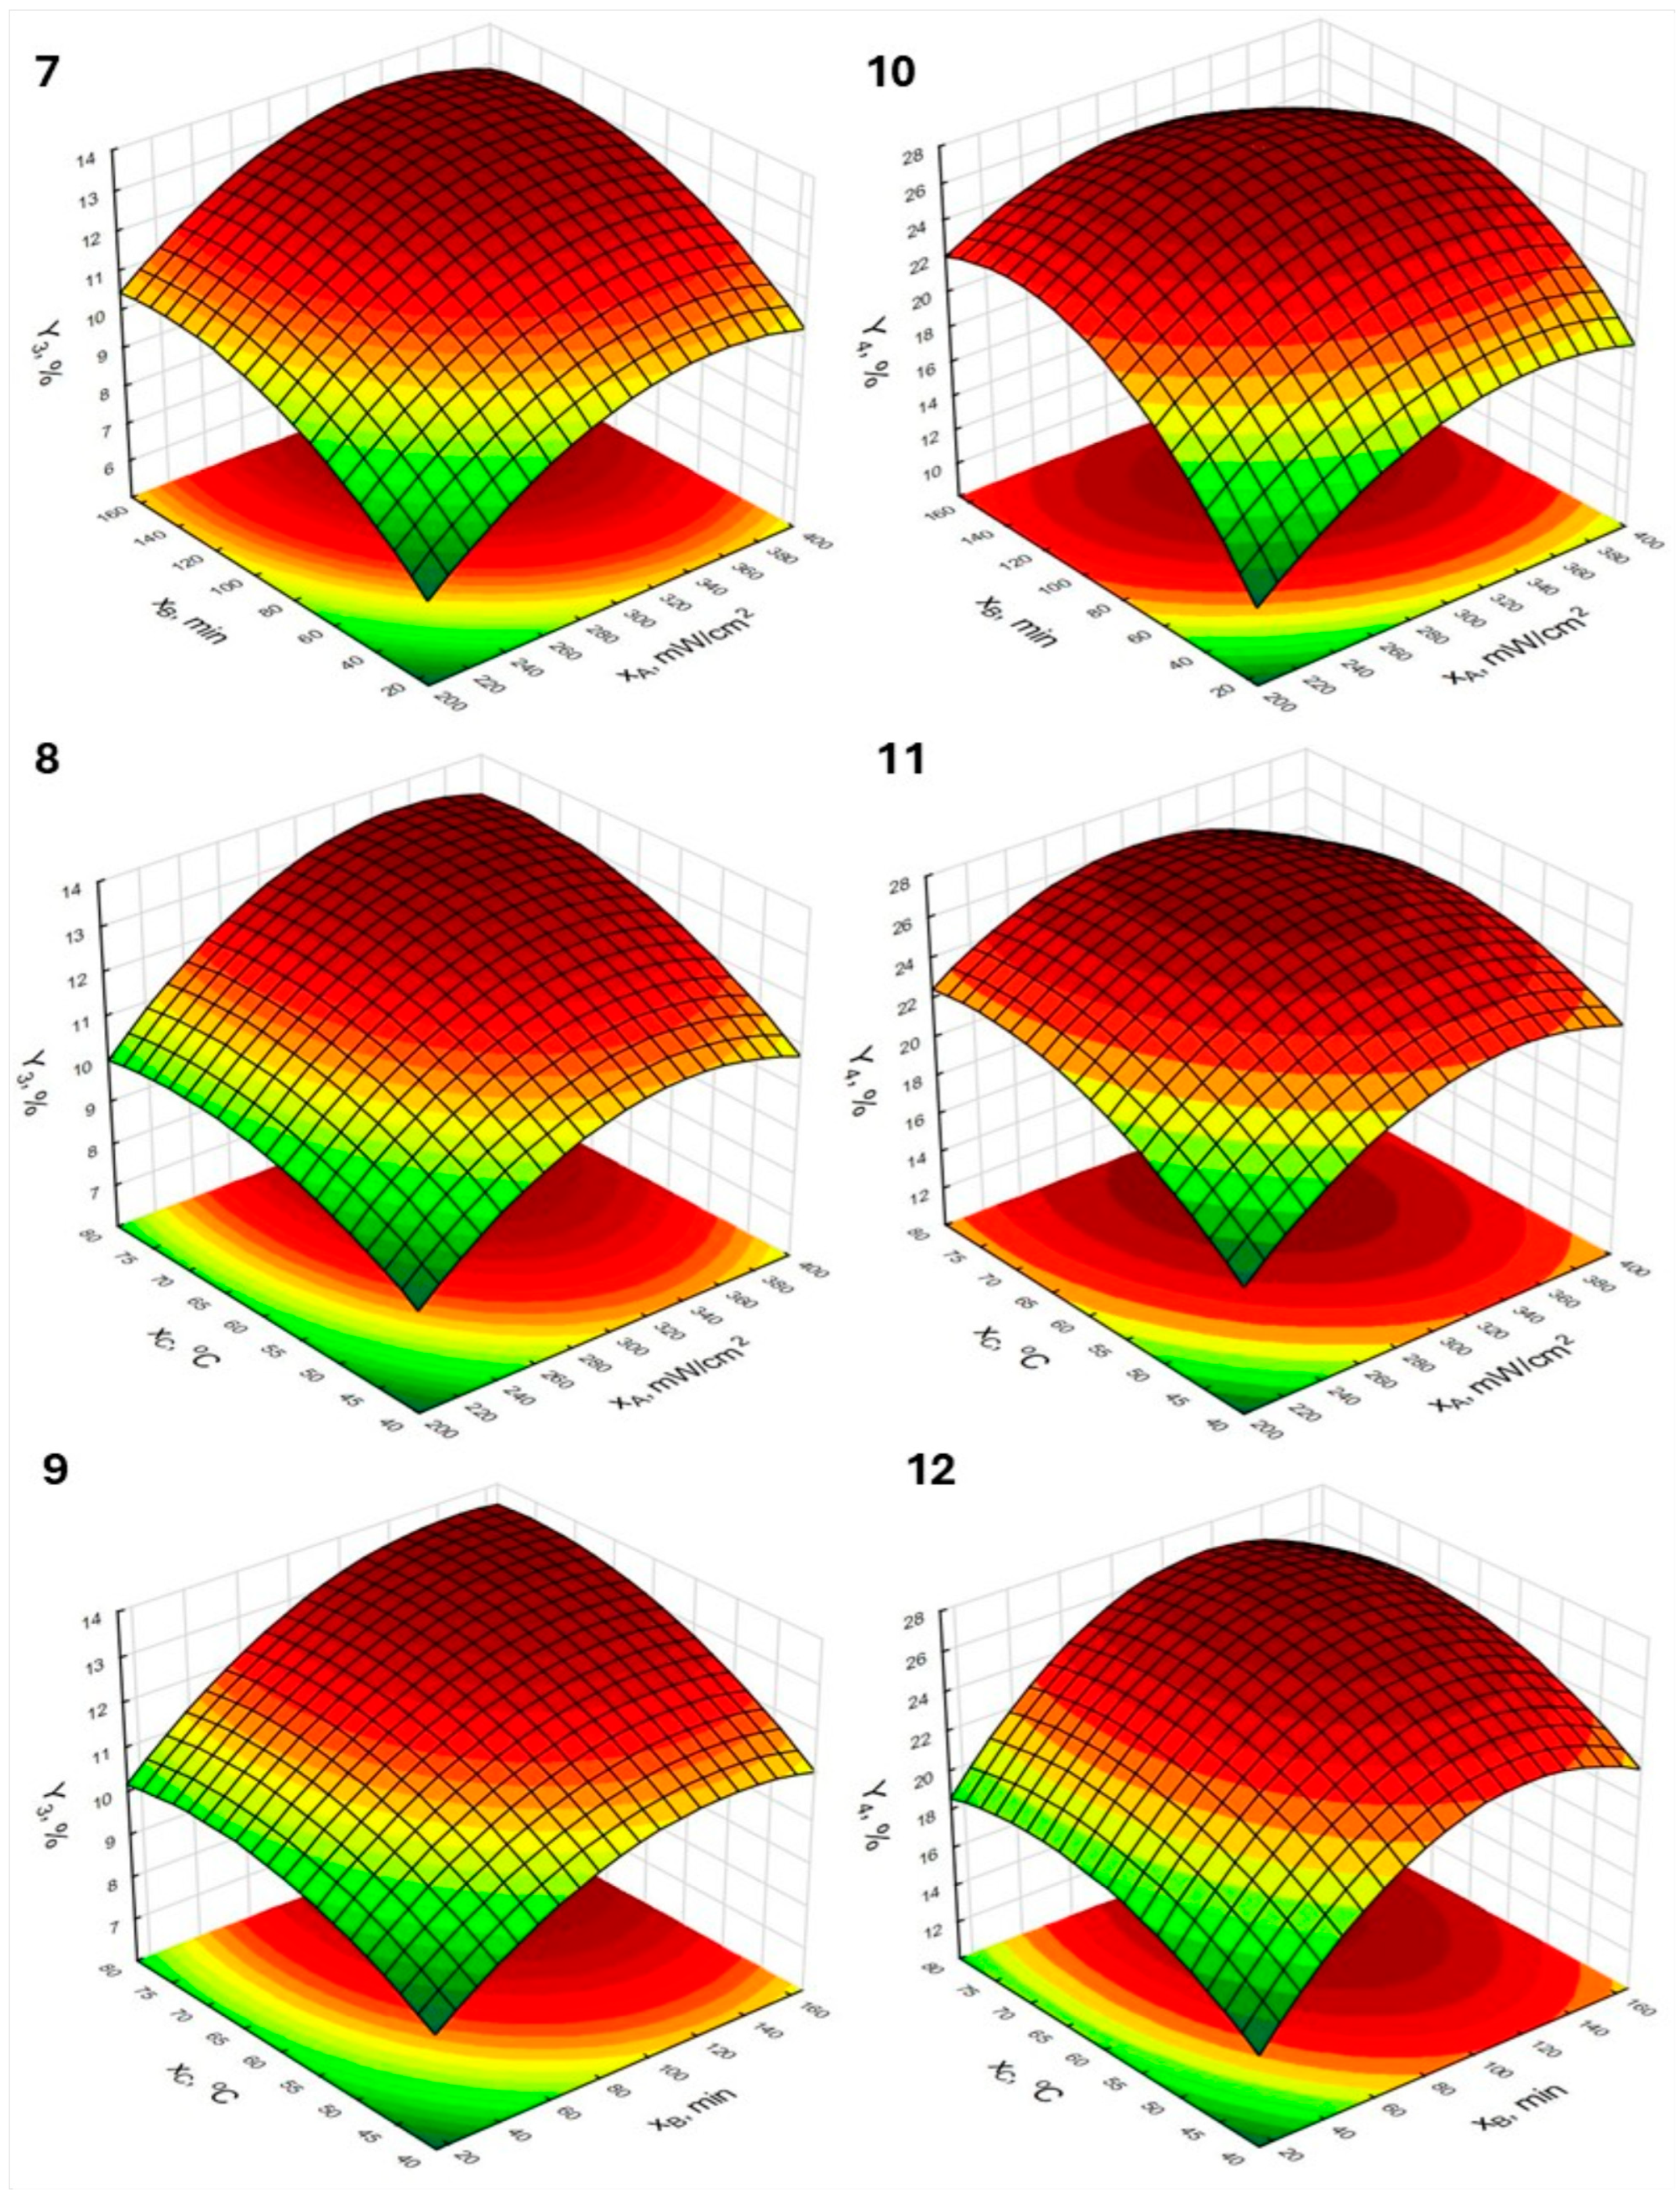
2.2.1. Effect Estimates of the Tested Variables and Response Surface Plots
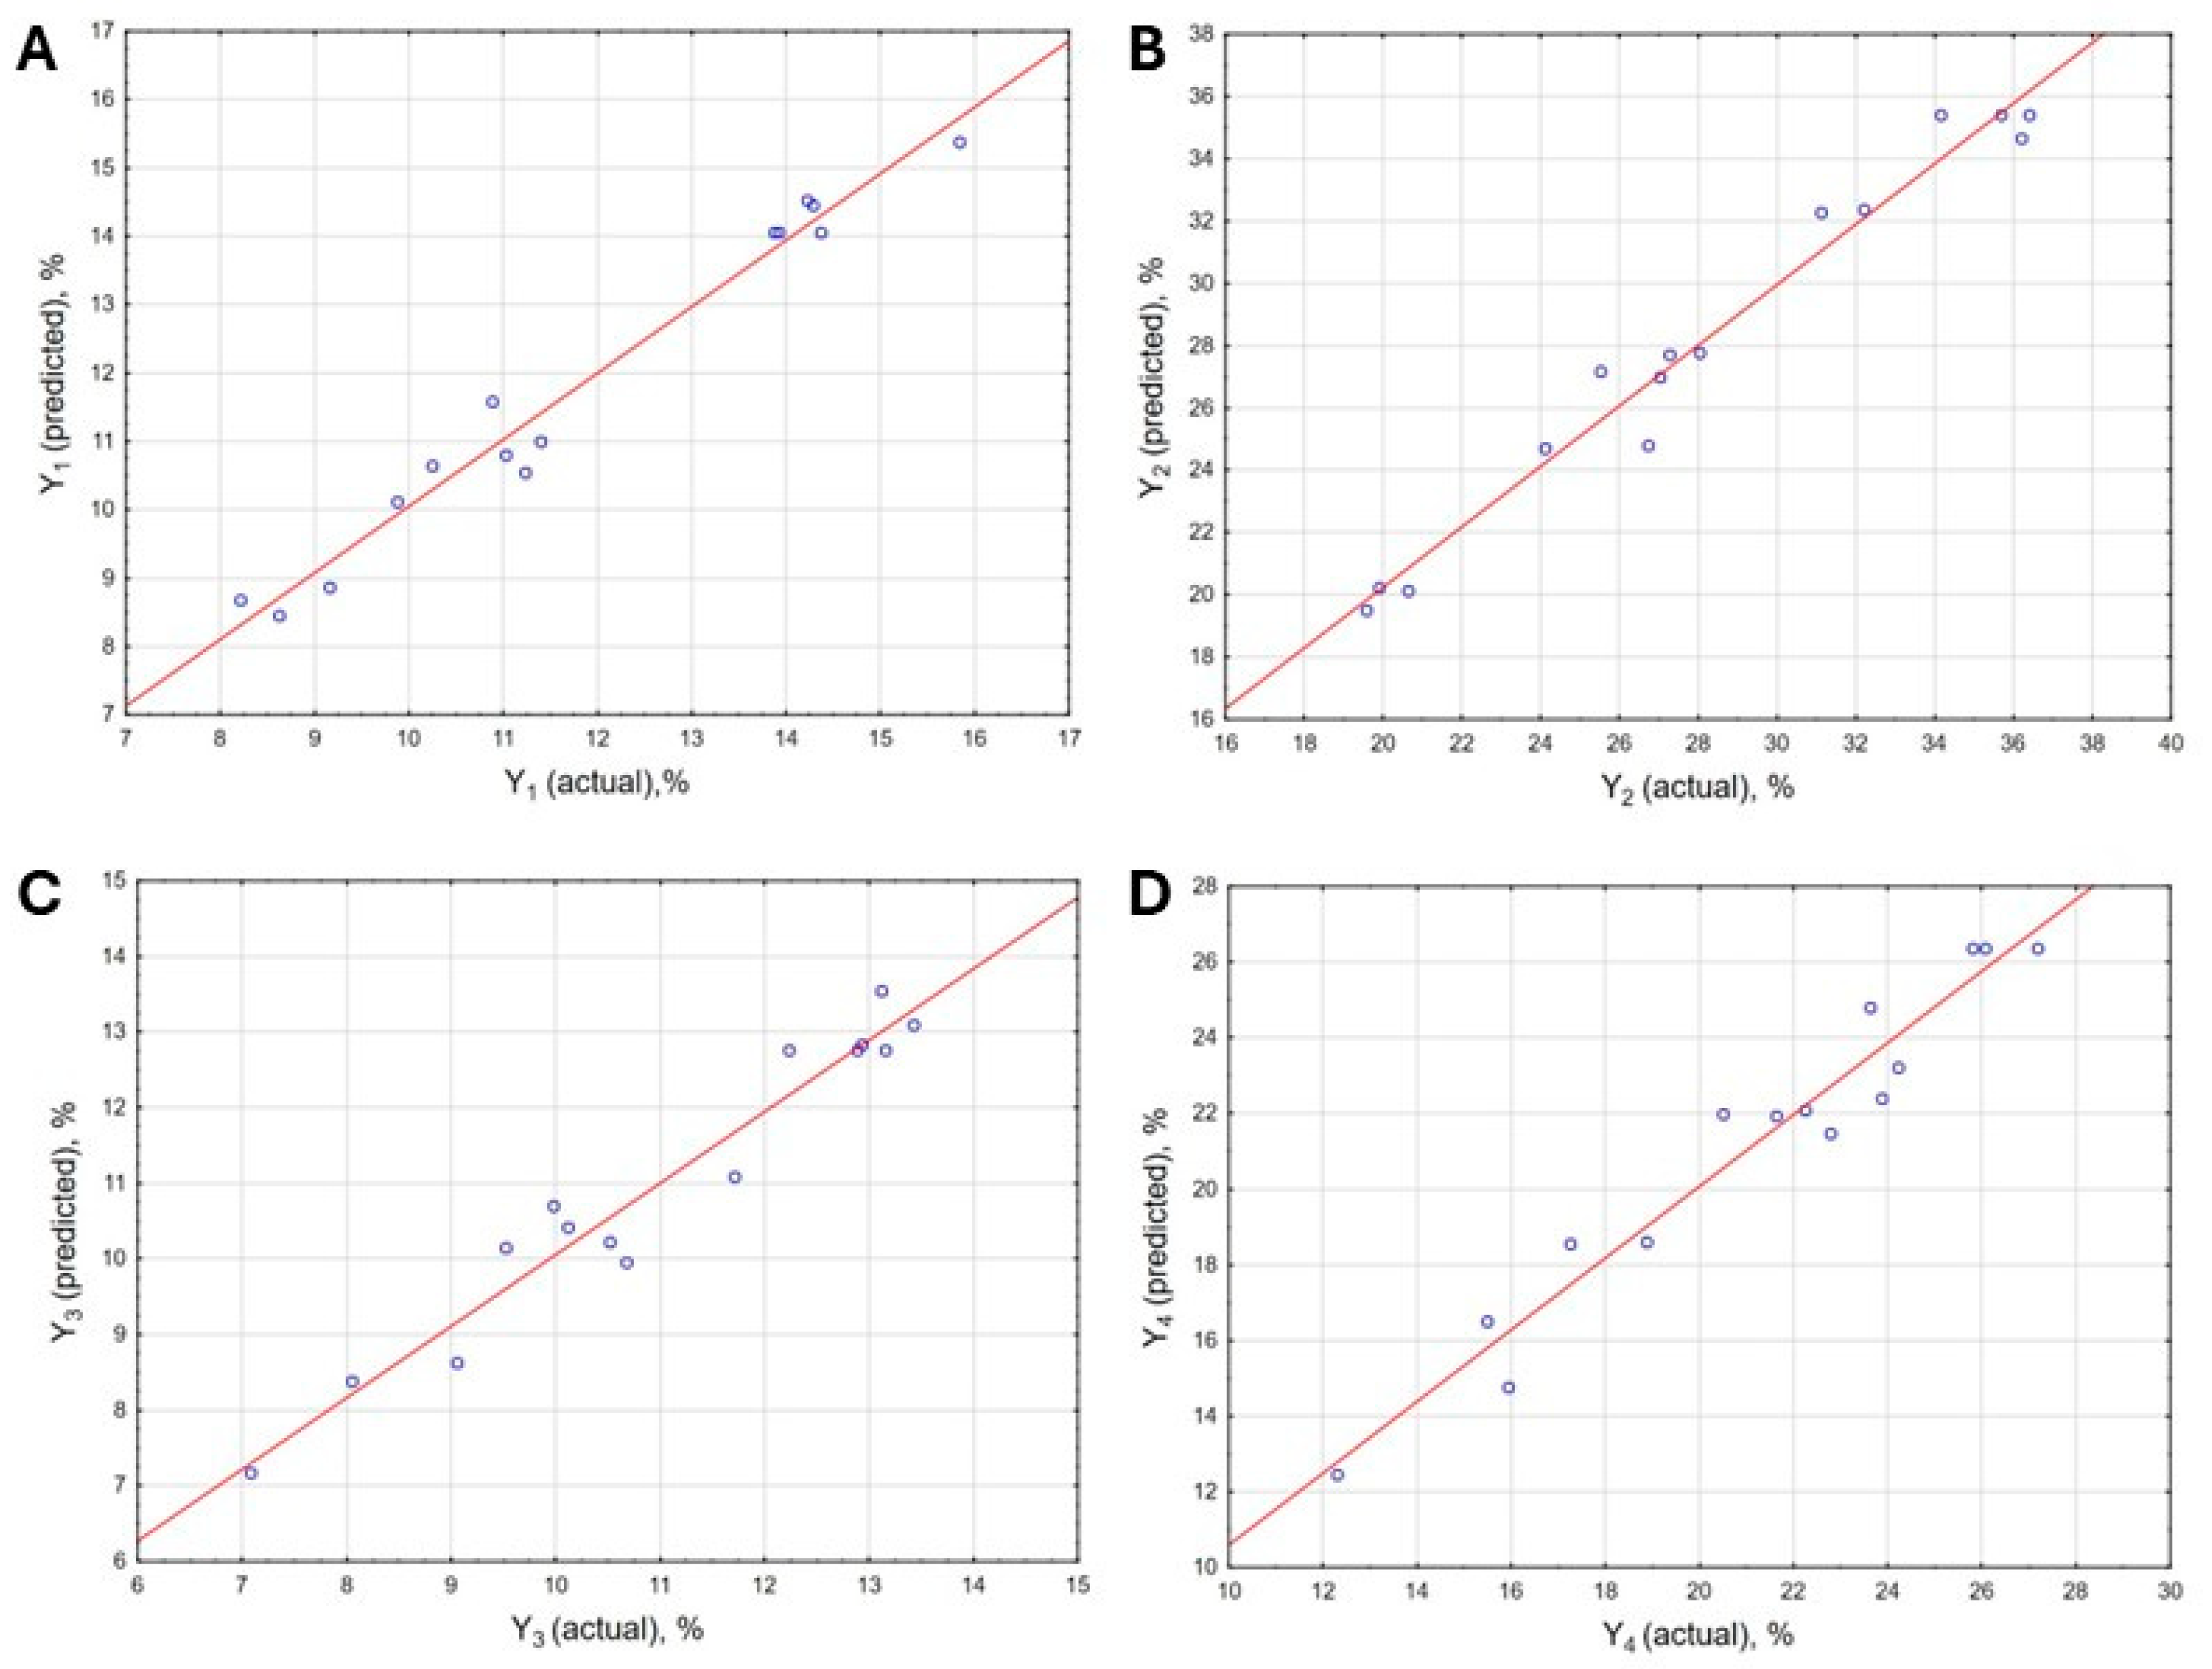
2.2.2. Modeling and Optimization
0.62 · xA · xB + 0.60 · xA · xC
2.3. Qualitative Assessment
2.3.1. Elemental Composition
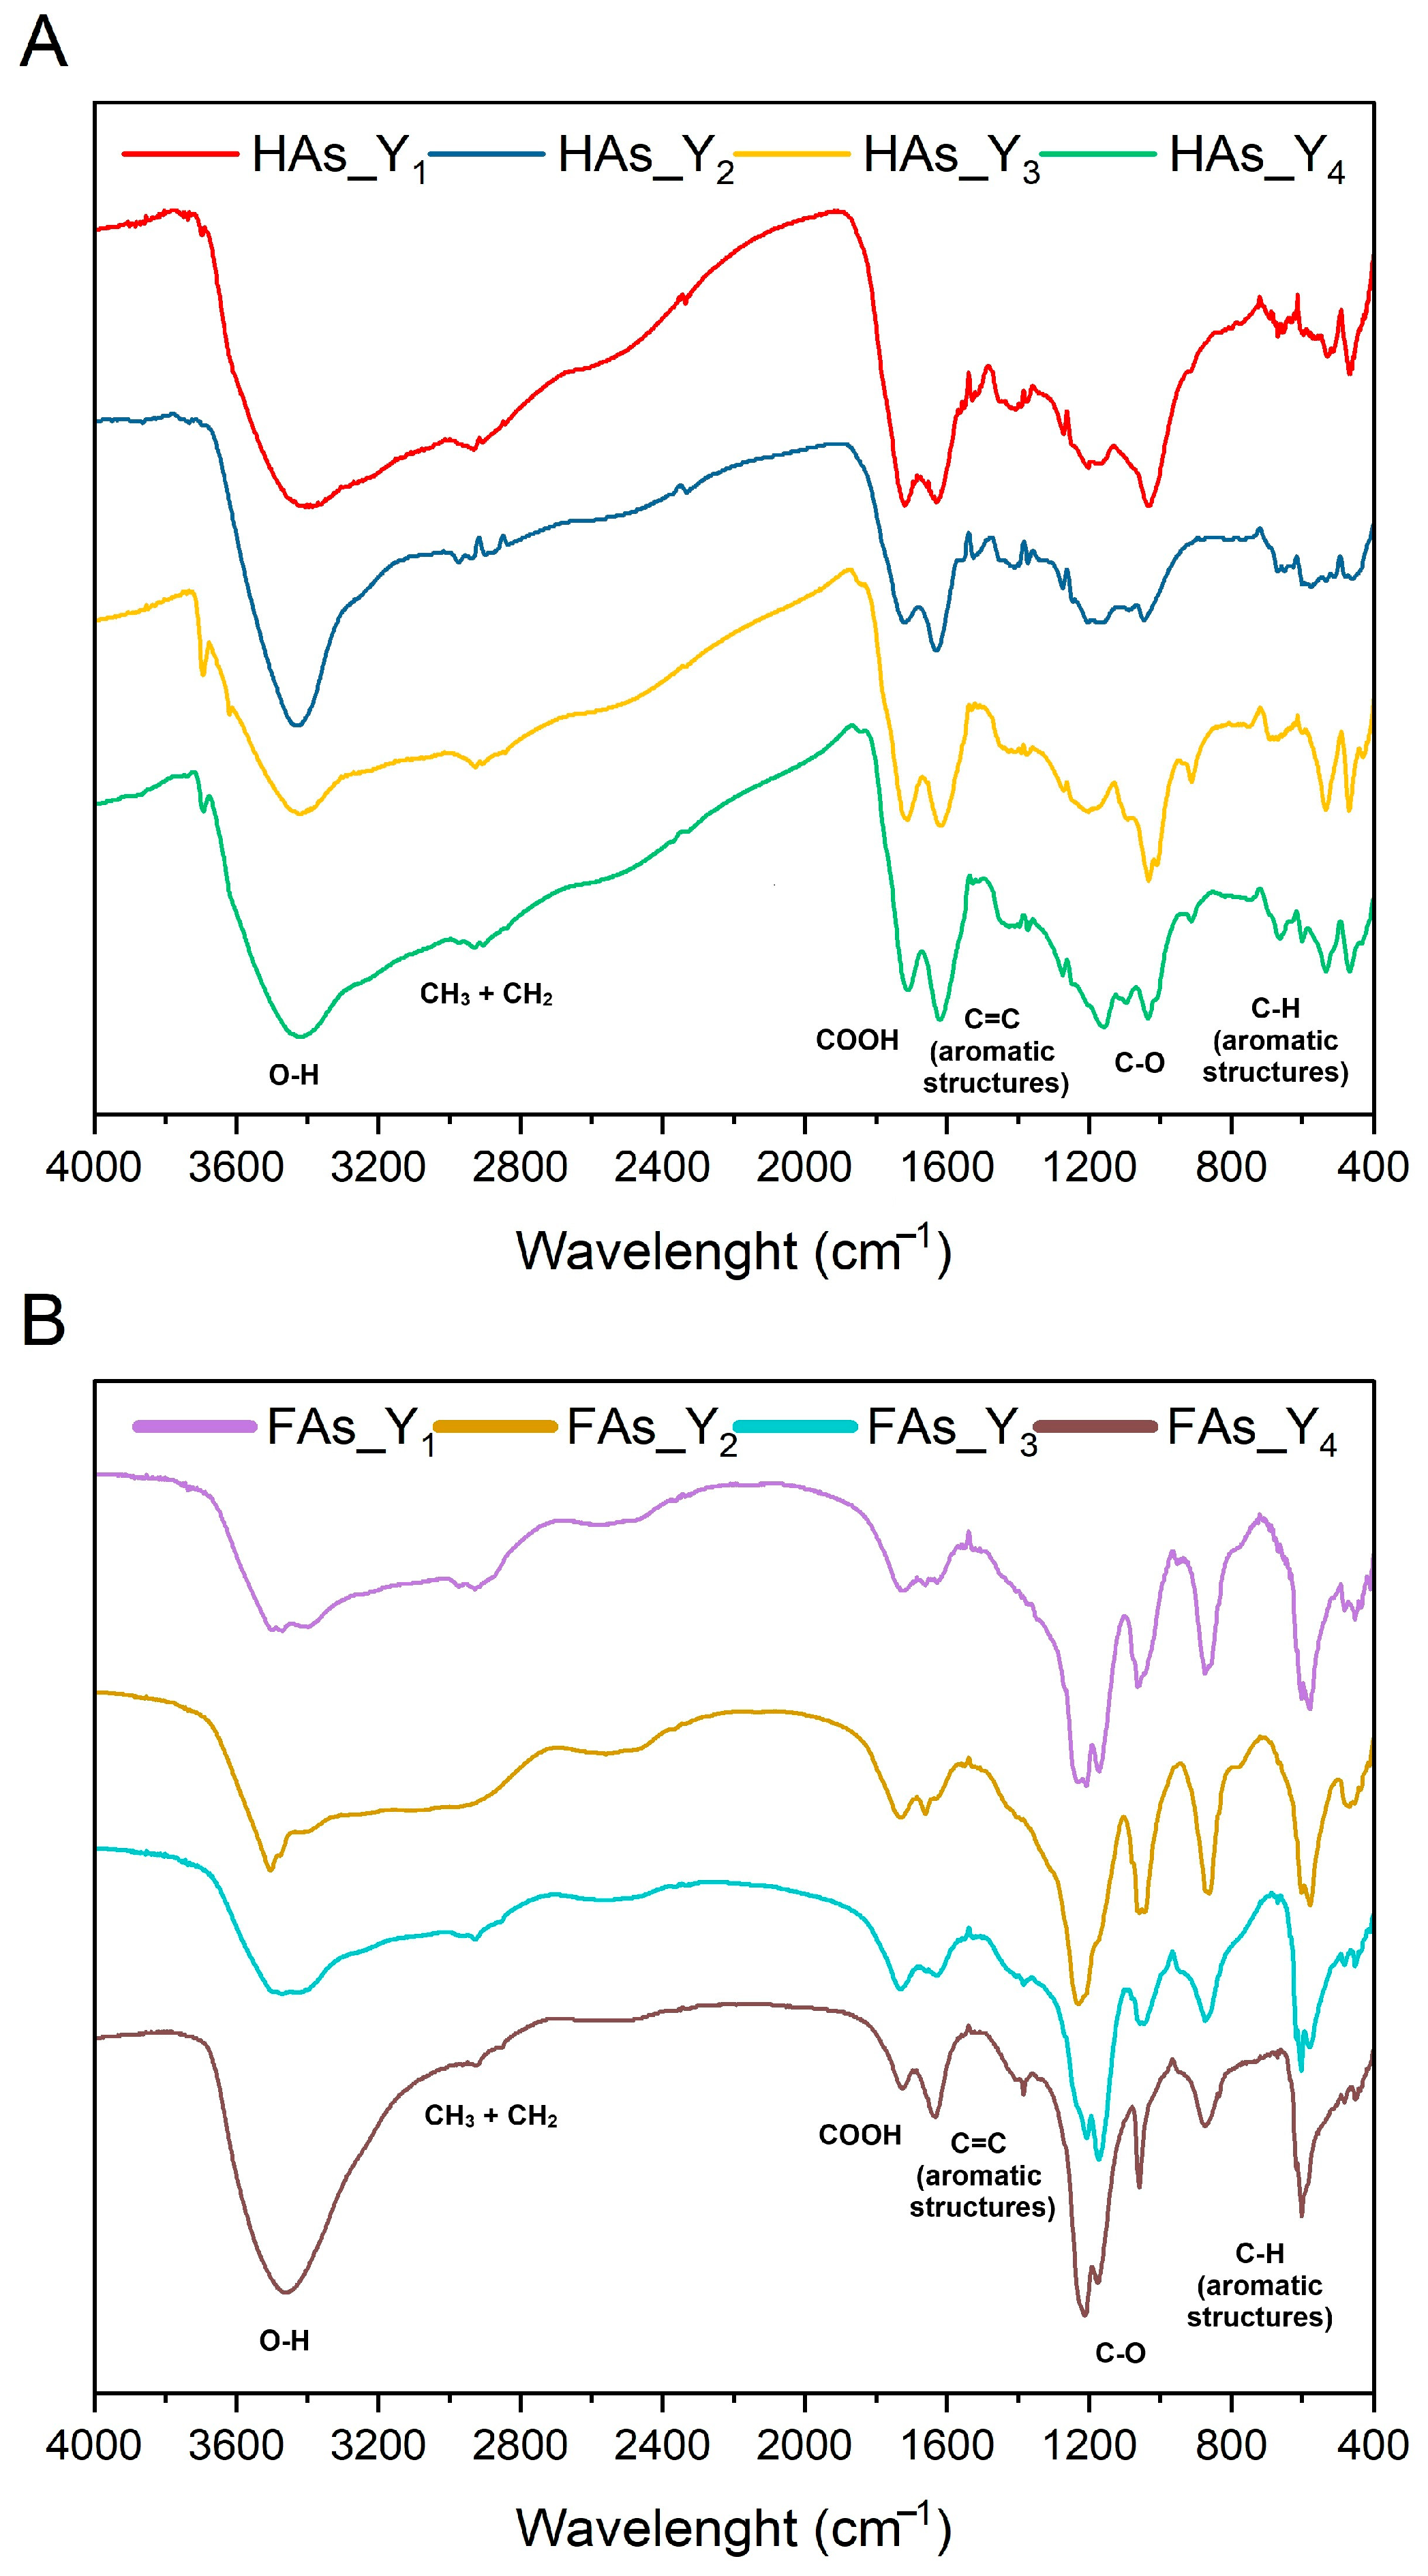
2.3.2. FTIR
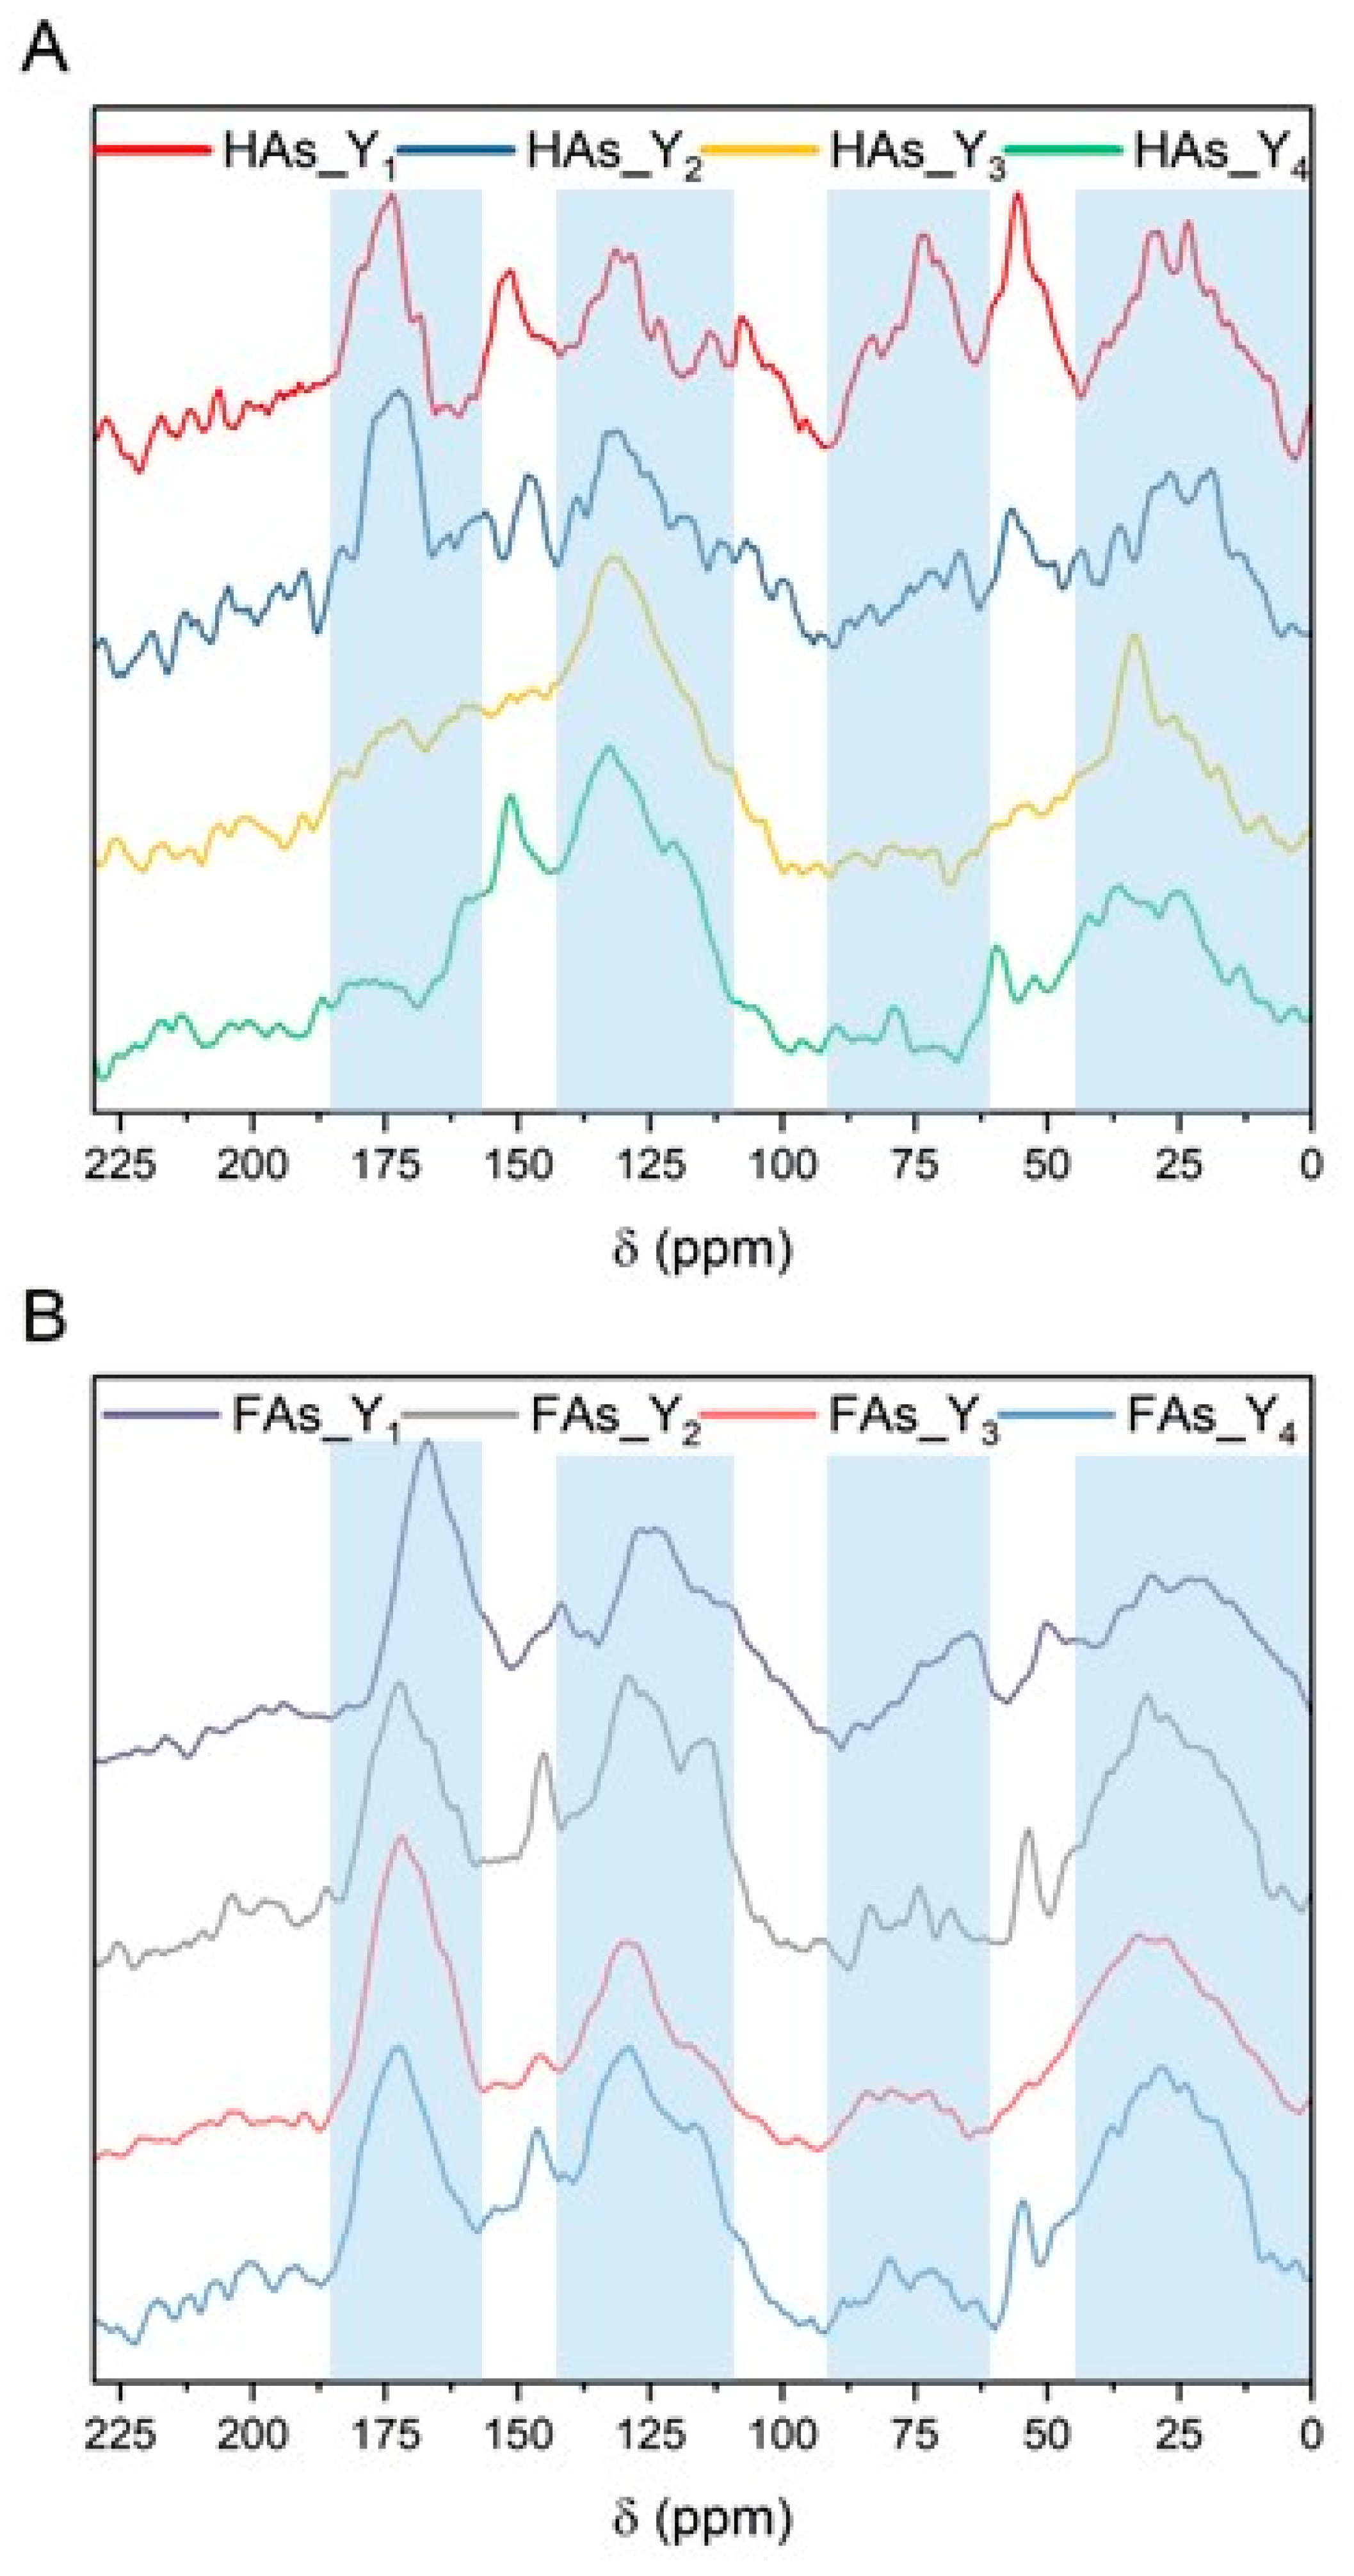
2.3.3. CP/MAS 13C NMR
3. Materials and Methods
3.1. Chemicals and Raw Materials
3.2. Analysis of Wood Ash Samples and Their Extracts
3.3. Isolation and Fractionation Procedure for Humic Substances
3.4. Quantitative Assessment
- The yield of HSs isolated from peat using birch ash extract (Y1);
- The yield of HSs isolated from peat using oak ash extract (Y2);
- The yield of HSs isolated from lignite using birch ash extract (Y3);
- The yield of HSs isolated from lignite using oak ash extract (Y4).
3.5. Qualitative Analysis of Humic Substances
4. Conclusions
Funding
Institutional Review Board Statement
Informed Consent Statement
Data Availability Statement
Acknowledgments
Conflicts of Interest
References
- Allam, M.; Radicetti, E.; Quintarelli, V.; Petroselli, V.; Marinari, S.; Mancinelli, R. Influence of organic and mineral fertilizers on soil organic carbon and crop productivity under different tillage systems: A meta-analysis. Agriculture 2022, 12, 464. [Google Scholar] [CrossRef]
- Sedlář, O.; Balík, J.; Černý, J.; Kulhánek, M.; Smatanová, M. Long-term application of organic fertilizers in relation to soil organic matter quality. Agronomy 2023, 13, 175. [Google Scholar] [CrossRef]
- Gerke, J. The central role of soil organic matter in soil fertility and carbon storage. Soil Syst. 2022, 6, 33. [Google Scholar] [CrossRef]
- Ukalska-Jaruga, A.; Bejger, R.; Smreczak, B.; Weber, J.; Mielnik, L.; Jerzykiewicz, M.; Ćwieląg-Piasecka, I.; Jamroz, E.; Debicka, M.; Kocowicz, A.; et al. The interaction of pesticides with humin fractions and their potential impact on non-extractable residue formation. Molecules 2023, 28, 7146. [Google Scholar] [CrossRef] [PubMed]
- Gao, J.; Han, H.; Gao, C.; Wang, Y.; Dong, B.; Xu, Z. Organic amendments for in situ immobilization of heavy metals in soil: A review. Chemosphere 2023, 335, 139088. [Google Scholar] [CrossRef] [PubMed]
- Organic Fertilizer Market Outlook (2024 to 2034). Available online: https://www.factmr.com/report/organic-fertilizer-market (accessed on 22 May 2025).
- Schaeffer, A.; Nannipieri, P.; Kästner, M.; Schmidt, B.; Botterweck, J. From humic substances to soil organic matter–microbial contributions. In honour of Konrad Haider and James P. Martin for their outstanding research contribution to soil science. J. Soils Sediments 2015, 15, 1865–1881. [Google Scholar] [CrossRef]
- Humic Acid Market Growth, Innovations, and Future Outlook 2034. Available online: https://www.openpr.com/news/3923090/humic-acid-market-growth-innovations-and-future-outlook-2034 (accessed on 24 May 2025).
- Michalska, J.; Turek-Szytow, J.; Dudło, A.; Kowalska, K.; Surmacz-Górska, J. Evaluation of the applicability of selected analytical techniques for determining the characteristics of humic substances sourced from by-products of the wastewater treatment process. Sci. Total Environ. 2023, 888, 164237. [Google Scholar] [CrossRef] [PubMed]
- Angelico, R.; Colombo, C.; Di Iorio, E.; Brtnický, M.; Fojt, J.; Conte, P. Humic substances: From supramolecular aggregation to fractal conformation—Is there time for a new paradigm? Appl. Sci. 2023, 13, 2236. [Google Scholar] [CrossRef]
- Saito, S. Separation approaches towards understanding supramolecular aggregate formation of humic acid. Anal. Sci. 2022, 38, 233–234. [Google Scholar] [CrossRef] [PubMed]
- Muscolo, A.; Pizzeghello, D.; Francioso, O.; Sanchez Cortes, S.; Nardi, S. Effectiveness of humic substances and phenolic compounds in regulating plant-biological functionality. Agronomy 2020, 10, 1553. [Google Scholar] [CrossRef]
- Schellekens, J.; Buurman, P.; Kalbitz, K.; Zomeren, A.V.; Vidal-Torrado, P.; Cerli, C.; Comans, R.N. Molecular features of humic acids and fulvic acids from contrasting environments. Environ. Sci. Technol. 2017, 51, 1330–1339. [Google Scholar] [CrossRef] [PubMed]
- de Melo, B.A.G.; Motta, F.L.; Santana, M.H.A. Humic acids: Structural properties and multiple functionalities for novel technological developments. Mater. Sci. Eng. C 2016, 62, 967–974. [Google Scholar] [CrossRef] [PubMed]
- Rupiasih, N.N.; Vidyasagar, P. A review: Compositions, structures, properties and applications of humic substances. J. Adv. Sci. Technol. 2005, 8, 16–25. [Google Scholar]
- Ore, O.T.; Adeola, A.O.; Fapohunda, O.; Adedipe, D.T.; Bayode, A.A.; Adebiyi, F.M. Humic substances derived from unconventional resources: Extraction, properties, environmental impacts, and prospects. Environ. Sci. Pollut. Res. 2023, 30, 59106–59127. [Google Scholar] [CrossRef] [PubMed]
- Huculak-Mączka, M.; Hoffmann, J.; Hoffmann, K. Evaluation of the possibilities of using humic acids obtained from lignite in the production of commercial fertilizers. J. Soils Sediments 2018, 18, 2868–2880. [Google Scholar] [CrossRef]
- Lanno, M.; Klavins, M.; Purmalis, O.; Shanskiy, M.; Kisand, A.; Kriipsalu, M. Properties of humic substances in composts comprised of different organic source material. Agriculture 2022, 12, 1797. [Google Scholar] [CrossRef]
- Xu, Z.; Li, R.; Wu, S.; He, Q.; Ling, Z.; Liu, T.; Wang, Q.; Zhang, Z.; Quan, F. Cattle manure compost humification process by inoculation ammonia-oxidizing bacteria. Bioresour. Technol. 2022, 344, 126314. [Google Scholar] [CrossRef] [PubMed]
- Efremenko, E.; Stepanov, N.; Senko, O.; Lyagin, I.; Maslova, O.; Aslanli, A. Artificial humic substances as biomimetics of natural analogues: Production, characteristics and preferences regarding their use. Biomimetics 2023, 8, 613. [Google Scholar] [CrossRef] [PubMed]
- Nieweś, D.; Marecka, K.; Zieliński, J.; Huculak-Mączka, M. Modelling and optimization of spent mushroom substrate valorization into humic-like substances through alkaline extraction intensified by ultrasound. Chem. Eng. Process. 2025, 212, 110261. [Google Scholar] [CrossRef]
- Aftab, K.; Javed, J.; Siddiqua, U.H.; Malik, A.; Hassan, A.; Khan, M.R.; Busquest, R.; Ahmad, N.; Haque, A. Process optimization and method validation for efficient valorization of low-grade coal into humic substances. Fuel 2024, 369, 131796. [Google Scholar] [CrossRef]
- Malyushevskaya, A.P.; Yushchishina, A.N. Intensification of the Processes of Extraction of Humic Acids from Biosubstrates under the Action of Electric Discharges. Surf. Eng. Appl. Electrochem. 2023, 59, 479–488. [Google Scholar] [CrossRef]
- Weber, J.; Jamroz, E.; Kocowicz, A.; Debicka, M.; Bekier, J.; Ćwieląg-Piasecka, I.; Ukalska-Jaruga, A.; Mielnik, L.; Bejger, R.; Jerzykiewicz, M. Optimized isolation method of humin fraction from mineral soil material. Environ. Geochem. Health 2022, 44, 1289–1298. [Google Scholar] [CrossRef] [PubMed]
- Nieweś, D. Modelling of humic acids extraction process assisted by low-intensity ultrasound with the use of three-level fractional factorial design. Korean J. Chem. Eng. 2024, 41, 681–695. [Google Scholar] [CrossRef]
- Cheng, G.; Niu, Z.; Zhang, C.; Zhang, X.; Li, X. Extraction of humic acid from lignite by KOH-hydrothermal method. Appl. Sci. 2019, 9, 1356. [Google Scholar] [CrossRef]
- Nieweś, D.; Marecka, K.; Braun-Giwerska, M.; Huculak-Mączka, M. Application of a modified method of humic acids extraction as an efficient process in the production of formulations for agricultural purposes. Pol. J. Chem. Technol. 2023, 25, 31–39. [Google Scholar] [CrossRef]
- Mghaiouini, R.; Benzibiria, N.; Monkade, M.; Bouari, A.E. Formulation of new biostimulant of plant and soil correction based on humic acids extracted by magnetized water from compost from the waste of coffee marc and cattle manure. Waste Biomass Valorization 2022, 13, 453–465. [Google Scholar] [CrossRef]
- Nieweś, D.; Marecka, K. Potential of Compost and Spent Coffee Grounds as Sources of Humic-Like Substances: Extraction Modeling and Optimization by Fractional Factorial Design. ACS Omega 2025, 10, 15762–15774. [Google Scholar] [CrossRef] [PubMed]
- Phong, N.T.; Yoon, H.Y.; Kang, M.S.; Kwon, M.; Lee, Y.; Baik, J.M.; Son, E.J.; Jang, K.S.; Han, D.W.; Jeon, J.R. Ionic Liquid-Based Extraction of Fulvic-like Substances from Wood Sawdust: Reproducing Unique Biological Activities of Fulvic Acids Using Renewable Natural Sources. J. Agric. Food Chem. 2024, 72, 20981–20990. [Google Scholar] [CrossRef] [PubMed]
- Sarmah, D.; Borah, K.K.; Bora, U. Aqueous extracts of biomass ash as an alternative class of Green Solvents for organic transformations: A review update. Sustain. Chem. Pharm. 2021, 24, 100551. [Google Scholar] [CrossRef]
- Mayer, E.; Eichermüller, J.; Endriss, F.; Baumgarten, B.; Kirchhof, R.; Tejada, J.; Kappler, A.; Thorwarth, H. Utilization and recycling of wood ashes from industrial heat and power plants regarding fertilizer use. Waste Manag. 2022, 141, 92–103. [Google Scholar] [CrossRef] [PubMed]
- Hurets, L.; Izmodenova, T.; Vakal, V.; Vakal, S.; Malovanyy, M. Utilization of Renewable Energy Waste (Wood Ash and Straw) in the Production of Mineral Fertilizers. J. Ecol. Eng. 2024, 25, 332–339. [Google Scholar] [CrossRef]
- Reimann, C.; Ottesen, R.T.; Andersson, M.; Arnoldussen, A.; Koller, F.; Englmaier, P. Element levels in birch and spruce wood ashes—Green energy? Sci. Total Environ. 2008, 393, 191–197. [Google Scholar] [CrossRef] [PubMed]
- Hossain, M.A.; Hossain, M.S. Optimization of antioxidative phenolic compound extraction from freeze-dried pulp, peel, and seed of Burmese grape (Baccaurea ramiflora Lour.) by response surface methodology. Biomass Convers. Biorefin. 2023, 13, 8123–8137. [Google Scholar] [CrossRef]
- Weremfo, A.; Abassah-Oppong, S.; Adulley, F.; Dabie, K.; Seidu-Larry, S. Response surface methodology as a tool to optimize the extraction of bioactive compounds from plant sources. J. Sci. Food Agric. 2023, 103, 26–36. [Google Scholar] [CrossRef] [PubMed]
- Wu, D.; Lu, Y.; Liang, H.; Ma, L.; Huang, T.; Li, R. Differences in humic acid structure extracted from different types of peat. Int. J. Coal Prep. Util. 2024, 45, 1516–1531. [Google Scholar] [CrossRef]
- Zara, M.; Ahmad, Z.; Akhtar, J.; Shahzad, K.; Sheikh, N.; Munir, S. Extraction and characterization of humic acid from Pakistani lignite coals. Energy Sources Part A Recovery Util. Environ. Eff. 2017, 39, 1159–1166. [Google Scholar] [CrossRef]
- Lishtvan, I.I.; Orlov, A.S.; Selyanina, S.B.; Sokolova, T.V.; Sosnovskaya, N.E.; Trufanova, M.V.; Yarygina, O.N. Formation of the organic matter of high-moor peat under conditions of the European North of Russia. Solid Fuel Chem. 2018, 52, 211–216. [Google Scholar] [CrossRef]
- Zhao, C.; Ma, F.; Wang, Y.; Li, X.; Zhang, Y.; Wang, Z.; Xiong, W.; Gao, X.; Ma, Y.; Yang, F.; et al. Enhancing humification in high-temperature composting: Insights from endogenous and exogenous heating strategies. Bioresour. Technol. 2025, 419, 132099. [Google Scholar] [CrossRef] [PubMed]
- Melloul, S.; Zehioua, R.; Meniai, A.H. Supercritical CO2 extraction of bioactive compounds from local Peganum Harmala plant seeds and optimization of the extraction yield and the antioxidant activities. Sustain. Chem. Pharm. 2022, 28, 100729. [Google Scholar] [CrossRef]
- Manzato, L.; Takeno, M.L.; Pessoa-Junior, W.A.G.; Mariuba, L.A.M.; Simonsen, J. Optimization of cellulose extraction from jute fiber by Box-Behnken design. Fibers Polym. 2018, 19, 289–296. [Google Scholar] [CrossRef]
- Symanowicz, B.; Becher, M.; Jaremko, D.; Skwarek, K. Possibilities for the use of wood ashes in agriculture. J. Ecol. Eng. 2018, 19, 191–196. [Google Scholar] [CrossRef] [PubMed]
- Yang, Y.; Li, Y.; Zhang, Y.; Wang, M.; Wang, P.; Liu, D. Process Condition Optimization and Structural Feature Analysis of Humic Acid Extraction from Weathered Lignite. ACS Omega 2024, 9, 38409–38422. [Google Scholar] [CrossRef] [PubMed]
- Bakina, L.G.; Orlova, N.E. Special features of humus acids extraction from soils by sodium pyrophosphate solutions of different alkalinity. Eurasian Soil Sci. 2012, 45, 392–398. [Google Scholar] [CrossRef]
- Ukalska-Jaruga, A.; Bejger, R.; Debaene, G.; Smreczak, B. Characterization of soil organic matter individual fractions (fulvic acids, humic acids, and humins) by spectroscopic and electrochemical techniques in agricultural soils. Agronomy 2021, 11, 1067. [Google Scholar] [CrossRef]
- Votolin, K.S.; Zherebtsov, S.I.; Shpakodraev, K.M.; Malyshenko, N.V.; Ismagilov, Z.R. Composition of humic and fulvic acids from lignite. Coke Chem. 2022, 65, 191–200. [Google Scholar] [CrossRef]
- Hakim, A.; Kobayashi, M. Charging, aggregation, and aggregate strength of humic substances in the presence of cationic surfactants: Effects of humic substances hydrophobicity and surfactant tail length. Colloid Surf. A Physicochem. Eng. Asp. 2019, 577, 175–184. [Google Scholar] [CrossRef]
- Li, T.; Xu, Z.; Han, X.; Yang, X.; Sparks, D.L. Characterization of dissolved organic matter in the rhizosphere of hyperaccumulator Sedum alfredii and its effect on the mobility of zinc. Chemosphere 2012, 88, 570–576. [Google Scholar] [CrossRef] [PubMed]
- Amoah-Antwi, C.; Kwiatkowska-Malina, J.; Szara, E.; Fenton, O.; Thornton, S.F.; Malina, G. Assessing factors controlling structural changes of humic acids in soils amended with organic materials to improve soil functionality. Agronomy 2022, 12, 283. [Google Scholar] [CrossRef]
- Bravo, C.; Toniolo, R.; Contin, M.; Nobili, M.D. Electrochemical and structural modifications of humic acids in aerobically and anaerobically incubated peat. Land 2021, 10, 1189. [Google Scholar] [CrossRef]
- Anielak, A.M.; Styszko, K.; Kwaśny, J. The importance of humic substances in transporting “chemicals of emerging concern” in water and sewage environments. Molecules 2023, 28, 6483. [Google Scholar] [CrossRef] [PubMed]
- Guo, G.; Wang, Q.; Huang, Q.; Fu, Q.; Liu, Y.; Wang, J.; Hu, S.; Mašek, O.; Wang, L.; Zhang, J. Effect of pyrolysis temperature on the characterisation of dissolved organic matter from pyroligneous acid. Molecules 2021, 26, 3416. [Google Scholar] [CrossRef] [PubMed]
- Tadini, A.M.; Goranov, A.I.; Martin-Neto, L.; Bernardi, A.C.; Oliveira, P.P.; Pezzopane, J.R.; Hatcher, P.G. Structural characterization using 2D NMR spectroscopy and TMAH-GC× GC-MS: Application to humic acids from soils of an integrated agricultural system and an Atlantic native forest. Sci. Total Environ. 2022, 815, 152605. [Google Scholar] [CrossRef] [PubMed]
- Pizzanelli, S.; Calucci, L.; Forte, C.; Borsacchi, S. Studies of organic matter in composting, vermicomposting, and anaerobic digestion by 13C solid-state NMR spectroscopy. Appl. Sci. 2023, 13, 2900. [Google Scholar] [CrossRef]
- Chai, X.L.; Shimaoka, T.; Guo, Q.; Zhao, Y.C. Characterization of humic and fulvic acids extracted from landfill by elemental composition, 13C CP/MAS NMR and TMAH-Py-GC/MS. Waste Manag. 2008, 28, 896–903. [Google Scholar] [CrossRef] [PubMed]
- Lodygin, E.; Abakumov, E. The use of spectroscopic methods to study organic matter in virgin and arable soils: A scoping review. Agronomy 2024, 14, 1003. [Google Scholar] [CrossRef]
- Baigorri, R.; Fuentes, M.; González-Gaitano, G.; García-Mina, J.M.; Almendros, G.; González-Vila, F.J. Complementary multianalytical approach to study the distinctive structural features of the main humic fractions in solution: Gray humic acid, brown humic acid, and fulvic acid. J. Agric. Food Chem. 2009, 57, 3266–3272. [Google Scholar] [CrossRef] [PubMed]
- Hybrid Procedure for the Isolation of Humic and Fulvic Acids from Solid-Phase Source Materials. Available online: https://humic-substances.org/isolation-of-ihss-soil-fulvic-and-humic-acids (accessed on 16 May 2025).
- ISO 19822:2018; Fertilizers and Soil Conditioners—Determination of Humic and Hydrophobic Fulvic Acids Concentrations in Fertilizer Materials. International Organization for Standardization (ISO): Geneva, Switzerland, 2018.
- ISO 5073:2021; Brown Coals and Lignites—Determination of Humic Acids. International Organization for Standardization (ISO): Geneva, Switzerland, 2021.
- Li, S.; Li, F.; Li, P.; Yue, Y.; Tan, J.; Jie, X.; Zhou, W.; Han, Y. Evaluation of the structure and properties of humic acids from Yunnan lignite transformed by Penicillium ortum MJ51. Process. Biochem. 2025, 155, 70–83. [Google Scholar] [CrossRef]

| Element | Unit | Birch Wood Ash | Oak Wood Ash | Birch Wood Ash Extract | Oak Wood Ash Extract |
|---|---|---|---|---|---|
| K | mg∙g−1 | 122.01 | 152.10 | 40.56 | 54.07 |
| Ca | mg∙g−1 | 289.14 | 280.70 | 0.46 | 0.78 |
| Cu | ppm | 209.21 | 324.43 | 0.02 | 0.02 |
| Fe | ppm | 1680.74 | 2412.41 | 0.02 | 0.01 |
| Zn | ppm | 366.93 | 207.38 | 0.02 | 0.04 |
| B | ppm | 630.00 | 819.60 | 9.98 | 9.31 |
| Mn | ppm | 189.00 | 177.90 | 0.03 | 0.02 |
| Run | Independent Variables 1 | Responses 2 | |||||
|---|---|---|---|---|---|---|---|
| xA | xB | xC | Y1 | Y2 | Y3 | Y4 | |
| 1 | −1 (200) | −1 (15) | 0 (60) | 9.16 | 19.90 | 7.08 | 12.30 |
| 2 | 1 (400) | −1 (15) | 0 (60) | 11.03 | 26.72 | 10.52 | 18.89 |
| 3 | −1 (200) | 1 (165) | 0 (60) | 9.88 | 27.28 | 10.12 | 21.63 |
| 4 | 1 (400) | 1 (165) | 0 (60) | 14.23 | 31.13 | 12.93 | 22.26 |
| 5 | −1 (200) | 0 (90) | −1 (40) | 8.21 | 20.63 | 8.05 | 15.49 |
| 6 | 1 (400) | 0 (90) | −1 (40) | 10.25 | 24.11 | 9.98 | 20.51 |
| 7 | −1 (200) | 0 (90) | 1 (80) | 11.40 | 28.03 | 10.68 | 23.87 |
| 8 | 1 (400) | 0 (90) | 1 (80) | 15.84 | 32.21 | 13.43 | 24.23 |
| 9 | 0 (300) | −1 (15) | −1 (40) | 8.62 | 19.58 | 9.06 | 15.94 |
| 10 | 0 (300) | 1 (165) | −1 (40) | 11.24 | 27.03 | 11.71 | 22.79 |
| 11 | 0 (300) | −1 (15) | 1 (80) | 10.89 | 25.53 | 9.52 | 17.25 |
| 12 | 0 (300) | 1 (165) | 1 (80) | 14.29 | 26.21 | 13.12 | 23.63 |
| 13 | 0 (300) | 0 (90) | 0 (60) | 13.93 | 35.68 | 12.89 | 26.07 |
| 14 | 0 (300) | 0 (90) | 0 (60) | 13.88 | 34.16 | 12.23 | 25.80 |
| 15 | 0 (300) | 0 (90) | 0 (60) | 14.37 | 36.39 | 13.16 | 27.19 |
| Source | Effect | Standard Error | Confidence Interval | p-Value | Remarks | |
|---|---|---|---|---|---|---|
| +95% | −95% | |||||
| xA | 3.17 | 0.19 | 2.35 | 4.00 | 0.004 | Significant |
| xB | 2.49 | 0.19 | 1.66 | 3.31 | 0.006 | Significant |
| xC | 3.52 | 0.19 | 2.70 | 4.35 | 0.003 | Significant |
| xA2 | 1.41 | 0.14 | 0.81 | 2.01 | 0.010 | Significant |
| xB2 | 1.57 | 0.14 | 0.97 | 2.18 | 0.008 | Significant |
| xC2 | 1.22 | 0.14 | 0.62 | 1.83 | 0.013 | Significant |
| xA∙xB | 1.24 | 0.27 | 0.08 | 2.40 | 0.044 | Significant |
| xA∙xC | 1.20 | 0.27 | 0.04 | 2.36 | 0.047 | Significant |
| xB∙xC | 0.39 | 0.27 | −0.77 | 1.55 | 0.285 | Non-significant |
| Source | Effect | Standard Error | Confidence Interval | p-Value | Remarks | |
|---|---|---|---|---|---|---|
| +95% | −95% | |||||
| xA | 4.58 | 0.81 | 1.12 | 8.05 | 0.030 | Significant |
| xB | 7.48 | 0.81 | 4.01 | 10.95 | 0.011 | Significant |
| xC | 7.66 | 0.81 | 4.19 | 11.12 | 0.011 | Significant |
| xA2 | 5.00 | 0.59 | 2.45 | 7.55 | 0.014 | Significant |
| xB2 | 4.15 | 0.59 | 1.60 | 6.71 | 0.020 | Significant |
| xC2 | 4.16 | 0.59 | 1.62 | 6.72 | 0.020 | Significant |
| xA∙xB | −1.48 | 1.14 | −6.39 | 3.42 | 0.322 | Non-significant |
| xA∙xC | 0.35 | 1.14 | −4.55 | 5.25 | 0.788 | Non-significant |
| xB∙xC | 1.61 | 1.14 | −3.28 | 6.52 | 0.292 | Non-significant |
| Source | Effect | Standard Error | Confidence Interval | p-Value | Remarks | |
|---|---|---|---|---|---|---|
| +95% | −95% | |||||
| xA | 2.73 | 0.34 | 1.28 | 4.18 | 0.015 | Significant |
| xB | 2.93 | 0.34 | 1.47 | 4.38 | 0.013 | Significant |
| xC | 1.99 | 0.34 | 0.53 | 3.44 | 0.028 | Significant |
| xA2 | 1.46 | 0.25 | 0.39 | 2.53 | 0.028 | Significant |
| xB2 | 1.14 | 0.25 | 0.07 | 2.21 | 0.045 | Significant |
| xC2 | 0.76 | 0.25 | −0.30 | 1.84 | 0.091 | Non-significant |
| xA∙xB | −0.32 | 0.48 | −2.37 | 1.74 | 0.578 | Non-significant |
| xA∙xC | 0.41 | 0.48 | −1.64 | 2.47 | 0.482 | Non-significant |
| xB∙xC | 0.48 | 0.48 | −1.58 | 2.53 | 0.425 | Non-significant |
| Source | Effect | Standard Error | Confidence Interval | p-Value | Remarks | |
|---|---|---|---|---|---|---|
| +95% | −95% | |||||
| xA | 3.15 | 0.52 | 0.91 | 5.39 | 0.026 | Significant |
| xB | 6.48 | 0.52 | 4.24 | 8.72 | 0.006 | Significant |
| xC | 3.56 | 0.52 | 1.32 | 5.80 | 0.021 | Significant |
| xA2 | 3.23 | 0.38 | 1.58 | 4.88 | 0.014 | Significant |
| xB2 | 4.35 | 0.38 | 2.70 | 6.00 | 0.008 | Significant |
| xC2 | 2.10 | 0.38 | 0.45 | 3.75 | 0.032 | Significant |
| xA∙xB | −2.98 | 0.74 | −6.15 | 0.19 | 0.056 | Non-significant |
| xA∙xC | −2.33 | 0.74 | −5.50 | 0.84 | 0.087 | Non-significant |
| xB∙xC | −0.24 | 0.74 | −3.40 | 2.94 | 0.780 | Non-significant |
| Source | Sum of Squares (SS) | Degree of Freedom (df) | Mean Square (MS) | F-Value | p-Value |
|---|---|---|---|---|---|
| Response Y1 | |||||
| Model | 82.38 | 8 | 10.30 | 26.41 | 1.14 × 10⁻⁴ |
| Residual | 2.36 | 6 | 0.39 | ||
| Lack of fit | 2.21 | 4 | 0.55 | 7.59 | 0.120 |
| Pure error | 0.15 | 2 | 0.07 | ||
| Response Y2 | |||||
| Model | 491.26 | 6 | 81.88 | 47.88 | 6.22 × 10⁻⁶ |
| Residual | 13.17 | 8 | 1.71 | ||
| Lack of fit | 11.11 | 6 | 1.85 | 1.43 | 0.467 |
| Pure error | 2.60 | 2 | 1.30 | ||
| Response Y3 | |||||
| Model | 51.55 | 5 | 10.31 | 16.11 | 1.16 × 10⁻⁴ |
| Residual | 5.73 | 9 | 0.64 | ||
| Lack of fit | 5.27 | 7 | 0.75 | 3.29 | 0.253 |
| Pure error | 0.46 | 2 | 0.23 | ||
| Response Y4 | |||||
| Model | 254.02 | 6 | 43.34 | 11.96 | 4.14 × 10⁻⁴ |
| Residual | 28.29 | 8 | 3.54 | ||
| Lack of fit | 27.20 | 6 | 4.53 | 8.34 | 0.111 |
| Pure error | 1.09 | 2 | 0.54 | ||
| Raw Material Type | Extractant Type | Optimal Conditions | Efficiency of HSs Extraction, % | |||
|---|---|---|---|---|---|---|
| xA, mW∙cm−2 | xB, min | xC, °C | Predicted | Experimental | ||
| Peat | Birch ash extract | 391 | 138 | 79 | 16.06 | 17.15 |
| Oak ash extract | 320 | 126 | 70 | 37.52 | 38.71 | |
| Lignite | Birch ash extract | 349 | 142 | 76 | 14.01 | 15.04 |
| Oak ash extract | 309 | 116 | 67 | 27.34 | 29.13 | |
| Raw Material Type | NaOH Concentration, mol∙dm−3 | Efficiency of HSs Extraction, % |
|---|---|---|
| Peat | 0.1 | 28.68 |
| 0.5 | 57.15 | |
| Lignite | 0.1 | 17.24 |
| 0.5 | 31.02 |
| Sample 1 | Elemental Composition, at. % | ||||
|---|---|---|---|---|---|
| C | H | N | S | O | |
| HAs_Y1 | 32.37 ± 0.35 | 48.56 ± 0.55 | 2.06 ± 0.03 | 0.73 ± 0.01 | 16.28 ± 0.18 |
| HAs_Y2 | 32.07 ± 0.35 | 47.90 ± 1.18 | 1.91 ± 0.03 | 0.92 ± 0.02 | 17.20 ± 0.70 |
| HAs_Y3 | 35.94 ± 0.21 | 48.58 ± 0.27 | 0.61 ± 0.01 | 0.65 ± 0.02 | 14.22 ± 0.36 |
| HAs_Y4 | 36.91 ± 1.48 | 45.44 ± 1.17 | 0.65 ± 0.08 | 0.81 ± 0.03 | 16.19 ± 0.80 |
| FAs_Y1 | 29.83 ± 0.21 | 49.82 ± 0.34 | 3.03 ± 0.03 | 1.08 ± 0.08 | 16.24 ± 0.05 |
| FAs_Y2 | 29.66 ± 1.39 | 47.86 ± 2.01 | 3.28 ± 0.12 | 1.06 ± 0.14 | 18.14 ± 0.52 |
| FAs_Y3 | 32.56 ± 0.42 | 51.06 ± 1.16 | 0.92 ± 0.02 | 0.77 ± 0.13 | 14.69 ± 0.36 |
| FAs_Y4 | 34.21 ± 1.14 | 47.97 ± 1.11 | 0.93 ± 0.01 | 0.85 ± 0.12 | 16.04 ± 0.66 |
| Sample | Percentage Distribution, % | |||||||
|---|---|---|---|---|---|---|---|---|
| Alkyl C (0–45 ppm) | O, N-Alkyl C (45–60 ppm) | O-Alkyl C (60–91 ppm) | Dioxyalkyl C (91–110 ppm) | Aromatic C (110–142 ppm) | O,N-Aromatic C (142–156 ppm) | Carboxyl-C (156–186 ppm) | Carbonyl-C (186–230 ppm) | |
| HAs_Y1 | 23.01 | 7.01 | 9.04 | 4.68 | 22.06 | 8.44 | 16.51 | 9.25 |
| HAs_Y2 | 24.73 | 4.58 | 6.36 | 4.29 | 24.87 | 7.63 | 15.73 | 11.81 |
| HAs_Y3 | 31.30 | 2.98 | 4.19 | 4.46 | 32.44 | 3.47 | 10.35 | 10.81 |
| HAs_Y4 | 26.16 | 3.33 | 5.67 | 4.25 | 32.71 | 6.92 | 9.68 | 11.28 |
| FAs_Y1 | 24.76 | 5.71 | 10.71 | 6.72 | 22.52 | 2.73 | 17.91 | 8.94 |
| FAs_Y2 | 25.40 | 5.55 | 10.15 | 6.69 | 21.26 | 6.33 | 16.81 | 7.81 |
| FAs_Y3 | 27.07 | 3.69 | 9.39 | 4.23 | 24.57 | 3.78 | 19.86 | 7.41 |
| FAs_Y4 | 27.16 | 4.02 | 8.36 | 4.98 | 23.11 | 5.53 | 17.81 | 9.03 |
Disclaimer/Publisher’s Note: The statements, opinions and data contained in all publications are solely those of the individual author(s) and contributor(s) and not of MDPI and/or the editor(s). MDPI and/or the editor(s) disclaim responsibility for any injury to people or property resulting from any ideas, methods, instructions or products referred to in the content. |
© 2025 by the author. Licensee MDPI, Basel, Switzerland. This article is an open access article distributed under the terms and conditions of the Creative Commons Attribution (CC BY) license (https://creativecommons.org/licenses/by/4.0/).
Share and Cite
Nieweś, D. Isolation of Humic Substances Using Waste Wood Ash Extracts: Multiparametric Optimization via Box–Behnken Design and Chemical Characterization of Products. Molecules 2025, 30, 3067. https://doi.org/10.3390/molecules30153067
Nieweś D. Isolation of Humic Substances Using Waste Wood Ash Extracts: Multiparametric Optimization via Box–Behnken Design and Chemical Characterization of Products. Molecules. 2025; 30(15):3067. https://doi.org/10.3390/molecules30153067
Chicago/Turabian StyleNieweś, Dominik. 2025. "Isolation of Humic Substances Using Waste Wood Ash Extracts: Multiparametric Optimization via Box–Behnken Design and Chemical Characterization of Products" Molecules 30, no. 15: 3067. https://doi.org/10.3390/molecules30153067
APA StyleNieweś, D. (2025). Isolation of Humic Substances Using Waste Wood Ash Extracts: Multiparametric Optimization via Box–Behnken Design and Chemical Characterization of Products. Molecules, 30(15), 3067. https://doi.org/10.3390/molecules30153067