Abstract
In this work, we have used both plain titania nanotubes, TNTs, and their reduced black analogues, bTNTs, that bear metallic conductivity (prepared by solid state reaction of TNTs with CaH2 at 500 °C for 2 h), as catalyst supports for the oxygen evolution reaction (OER). Ir was subsequently been deposited on them by the galvanic replacement of electrodeposited Ni by Ir(IV) chloro-complexes; this was followed by Ir electrochemical anodization to IrO2. By carrying out the preparation of the TNTs in either two or one anodization steps, we were able to produce close-packed or open-structure nanotubes, respectively. In the former case, larger than 100 nm Ir aggregates were finally formed on the top face of the nanotubes (leading to partial or full surface coverage); in the latter case, Ir nanoparticles smaller than 100 nm were obtained, with some of them located inside the pores of the nanotubes, which retained a porous surface structure. The electrocatalytic activity of IrO2 supported on open-structure bTNTs towards OER is superior to that supported on close-packed bTNTs and TNTs, and its performance is comparable or better than that of similar electrodes reported in the literature (overpotential of η = 240 mV at 10 mA cm−2; current density of 70 mA cm−2 and mass specific current density of 258 mA mgIr−1 at η = 300 mV). Furthermore, these electrodes demonstrated good medium-term stability, maintaining stable performance for 72 h at 10 mA cm−2 in acid.
1. Introduction
Ti-supported electrodes find applications in many industrial processes, most notably as dimensionally stable anodes (DSAs) in the chlor-alkali, electroplating and electrowinning industries [1,2,3] and as gas diffusion layer electrodes (GDLEs) in polymer electrolyte fuel cells (PEMFCs) and electrolyzers (PEMECs) [4,5,6,7]. When the anode reaction of interest is that of oxygen evolution (OER), IrO2 is the preferred catalyst (especially under acidic conditions) due to the typically slow kinetics and high overpotential associated with the OER [8,9,10] resulting in the need for efficient and stable electrode materials. Minimizing the Ir catalyst loading is crucial given its scarcity and high price; this can be achieved by preparing very thin continuous films or highly dispersed IrO2 particles over the Ti-based substrate [11,12,13,14,15]. In the latter case, to ensure electrode stability at high anodic potentials and/or aggressive conditions, there is a need for the presence of protective Ti oxides at uncovered locations (e.g., by thermal annealing) or the use of a TiO2 substrate itself [16,17,18,19,20]; these strategies, however, may induce particle agglomeration and/or increased ohmic losses due to thick TiO2 layer formation.
Depending on the fabrication route, titanium dioxide can exist in various morphologies, such as nanoparticles [21,22,23], nanowires [24,25], nanofibers [26,27], and nanosheets [28,29], each exhibiting distinct properties and offering a variety of potential applications. Among them, titania nanotubes (TNTs) have attracted considerable attention over the years owing to their high surface area and easily tunable geometrical parameters (nanotube length, pore size, tube orientation) [30,31,32]. In addition, electrochemical anodization of a Ti foil (the fabrication method most commonly used to produce nanotube structures), offers simplicity and low cost regarding the materials and instrumentation it requires. By adjusting the anodization parameters, such as duration, applied voltage, temperature and electrolyte composition, different nanotube morphologies can be obtained according to the preferred application [31,33,34]. Therefore, TNTs are ideal candidates to be used as OER catalyst supports, since they combine the inherent stability of titania oxides at high anodic potential values with a high surface area for the dispersion of IrO2 and an open structure for the evolved oxygen gas to escape.
One major drawback of titania nanotubes (and TiO2 in general) is the fact that they do not possess sufficient electronic conductivity and for that reason they should either be densely decorated by the conducting electrocatalyst or rendered themselves conducting. The conductivity of TiO2 can be greatly impacted by the presence of defect states (Ti3+ interstitials and oxygen vacancies) in the crystal lattice or by the incorporation of different dopants to modify its band structure [35,36]. The former can be achieved by employing methods such as hydrogenation (annealing in a hydrogen rich atmosphere [37,38,39,40] or via hydrogen plasma treatment [41,42]), chemical reduction (via the reaction with strongly reducing reagents such as NaBH4 [43,44,45] and CaH2 [46,47]) or electrochemical reduction (by applying a sufficiently negative potential in buffered solutions) [48,49,50,51].
Most of the research studies reported in the literature focus on the photoelectrochemical applications of titania nanotubes, while few have explored their application as a support material for platinum group metal (PGM) catalysts to promote the oxygen evolution reaction (OER). Dehkordi et al. fabricated IrRuOx/TNT electrodes through a modified Adams’ fusion method with 80 % w/w loading (of an Ir:Ru ratio equal to 60:40 at%), which showed enhanced activity and stability towards the OER compared to IrRuOx supported on TiO2 powder, due to the increased number of active sites and better catalyst distribution [52]. To lower the catalyst loading, it is essential to improve the electronic conductivity of the TNTs, which will facilitate the electron transfer from the catalyst surface to the substrate during the OER. With this in mind, Genova-Koleva et al. synthesized IrO2 and IrRuOx catalysts supported on plain and Nb-doped TNTs with a 50 wt% catalyst loading, where the IrO2/Nb-TNTs stood out owing to the high surface area and enhanced conductivity of the support, due to the presence of Nb(IV) species, which also allowed for a better catalyst dispersion [53]. In another study, Lu et al. used hydrogenated TNTs as support and IrO2 was electrodeposited via potential cycling of the electrode substrate. The catalyst supported on the hydrogenated TNTs showed enhanced catalytic activity towards the OER compared to its plain semiconducting analogues, due to the higher deposition rate of IrO2 that resulted in higher surface-active area electrodes [54]. Other modifications of TNTs as supports for OER include titanium oxy-nitride [55,56]. Finally, apart from the chemical/electrochemical methods of Ir deposition onto TNTs one should also mention that of single atom photodeposition [57] and Atomic Layer Deposition (ALD) [58].
Similar catalyst structures (decorated with Pt or Ir) have also been investigated for the hydrogen evolution reaction (HER). More specifically, Lačnjevac et al. fabricated hydrogenated TNTs via cathodic reduction followed by galvanic deposition of metallic Ir from its IrCl3 precursor solution to obtain Ir/H-TNTs. The authors emphasize that the strong interaction between Ir and the conductive TNT support is pivotal in enhancing the catalytic efficiency of these Ir/H-TNTs for the HER [59]. More recently, Touni et al. prepared Pt/TNT electrodes for HER by spontaneous (galvanic) deposition of Pt onto freshly reduced TNTs by solid state reaction with CaH2 [60] that has rendered it black titania (b-TNT) [61]. To the best of our knowledge, although b-TNTs are widely used in photocatalysis they have not been employed as substrates for OER (presumably due to reservations regarding the possible re-oxidation of the partially reduced titania).
Our research group has focused on the production of PGM catalysts supported on various conducting substrates through the galvanic replacement/deposition method, which is driven by the difference in the standard potentials between a noble (e.g., Ir, Pt, Ru) and a less noble metal (e.g., Ni, Ti). Through galvanic replacement, a (mixed) core–shell or (mixed) core–skin structure is formed (depending on whether the substrate is in particulate or layer form), whereby the metal shell/skin is composed of the catalytic noble metal, and the core consists of a mixture of the noble metal with abundant, less expensive non-noble metals [15,62,63,64,65,66,67]. This process enhances the precious metal mass-specific activity, allowing for a reduction in PGM loading in electrocatalyst applications. Furthermore, the interaction between the shell/skin and the core components is expected to modify the catalytic properties, potentially improving overall performance [15,62,63,64,65,66,67].
To the best of our knowledge, galvanic replacement of a sacrificial metal by a noble metal has not yet been employed for the decoration of TNTs.
In this work, we investigate the feasibility of the galvanic replacement method on semiconducting or metallic-like black titania nanotubes, with either a close-packed or open structure, using Ni as a sacrificial layer and Ir as the depositing noble metal. The goal is to produce novel, efficient and stable IrOx TNT-supported electrodes for use as OER anodes. SEM/EDS along with ICP-MS analysis was performed to assess the morphology and composition of the electrocatalysts. Electrochemical characterization was conducted by means of cyclic voltammetry (CV), near-steady state linear sweep voltammetry (LSV) and electrochemical impedance spectroscopy (EIS) measurements. Finally, the stability of the most active electrode towards the OER was investigated by means of constant current chronopotentiometry, while XPS analysis was conducted before and after the stability test to observe changes in its chemical composition. The novelty of this work has been two-fold: proving that galvanic replacement can work on TNTs as an alternative method for their decoration with noble metals and, also, that bTNTs can be used as stable substrates for OER catalysts.
2. Results
2.1. Microscopic (SEM) and Spectroscopic (EDS, ICP-MS, XPS) Analysis
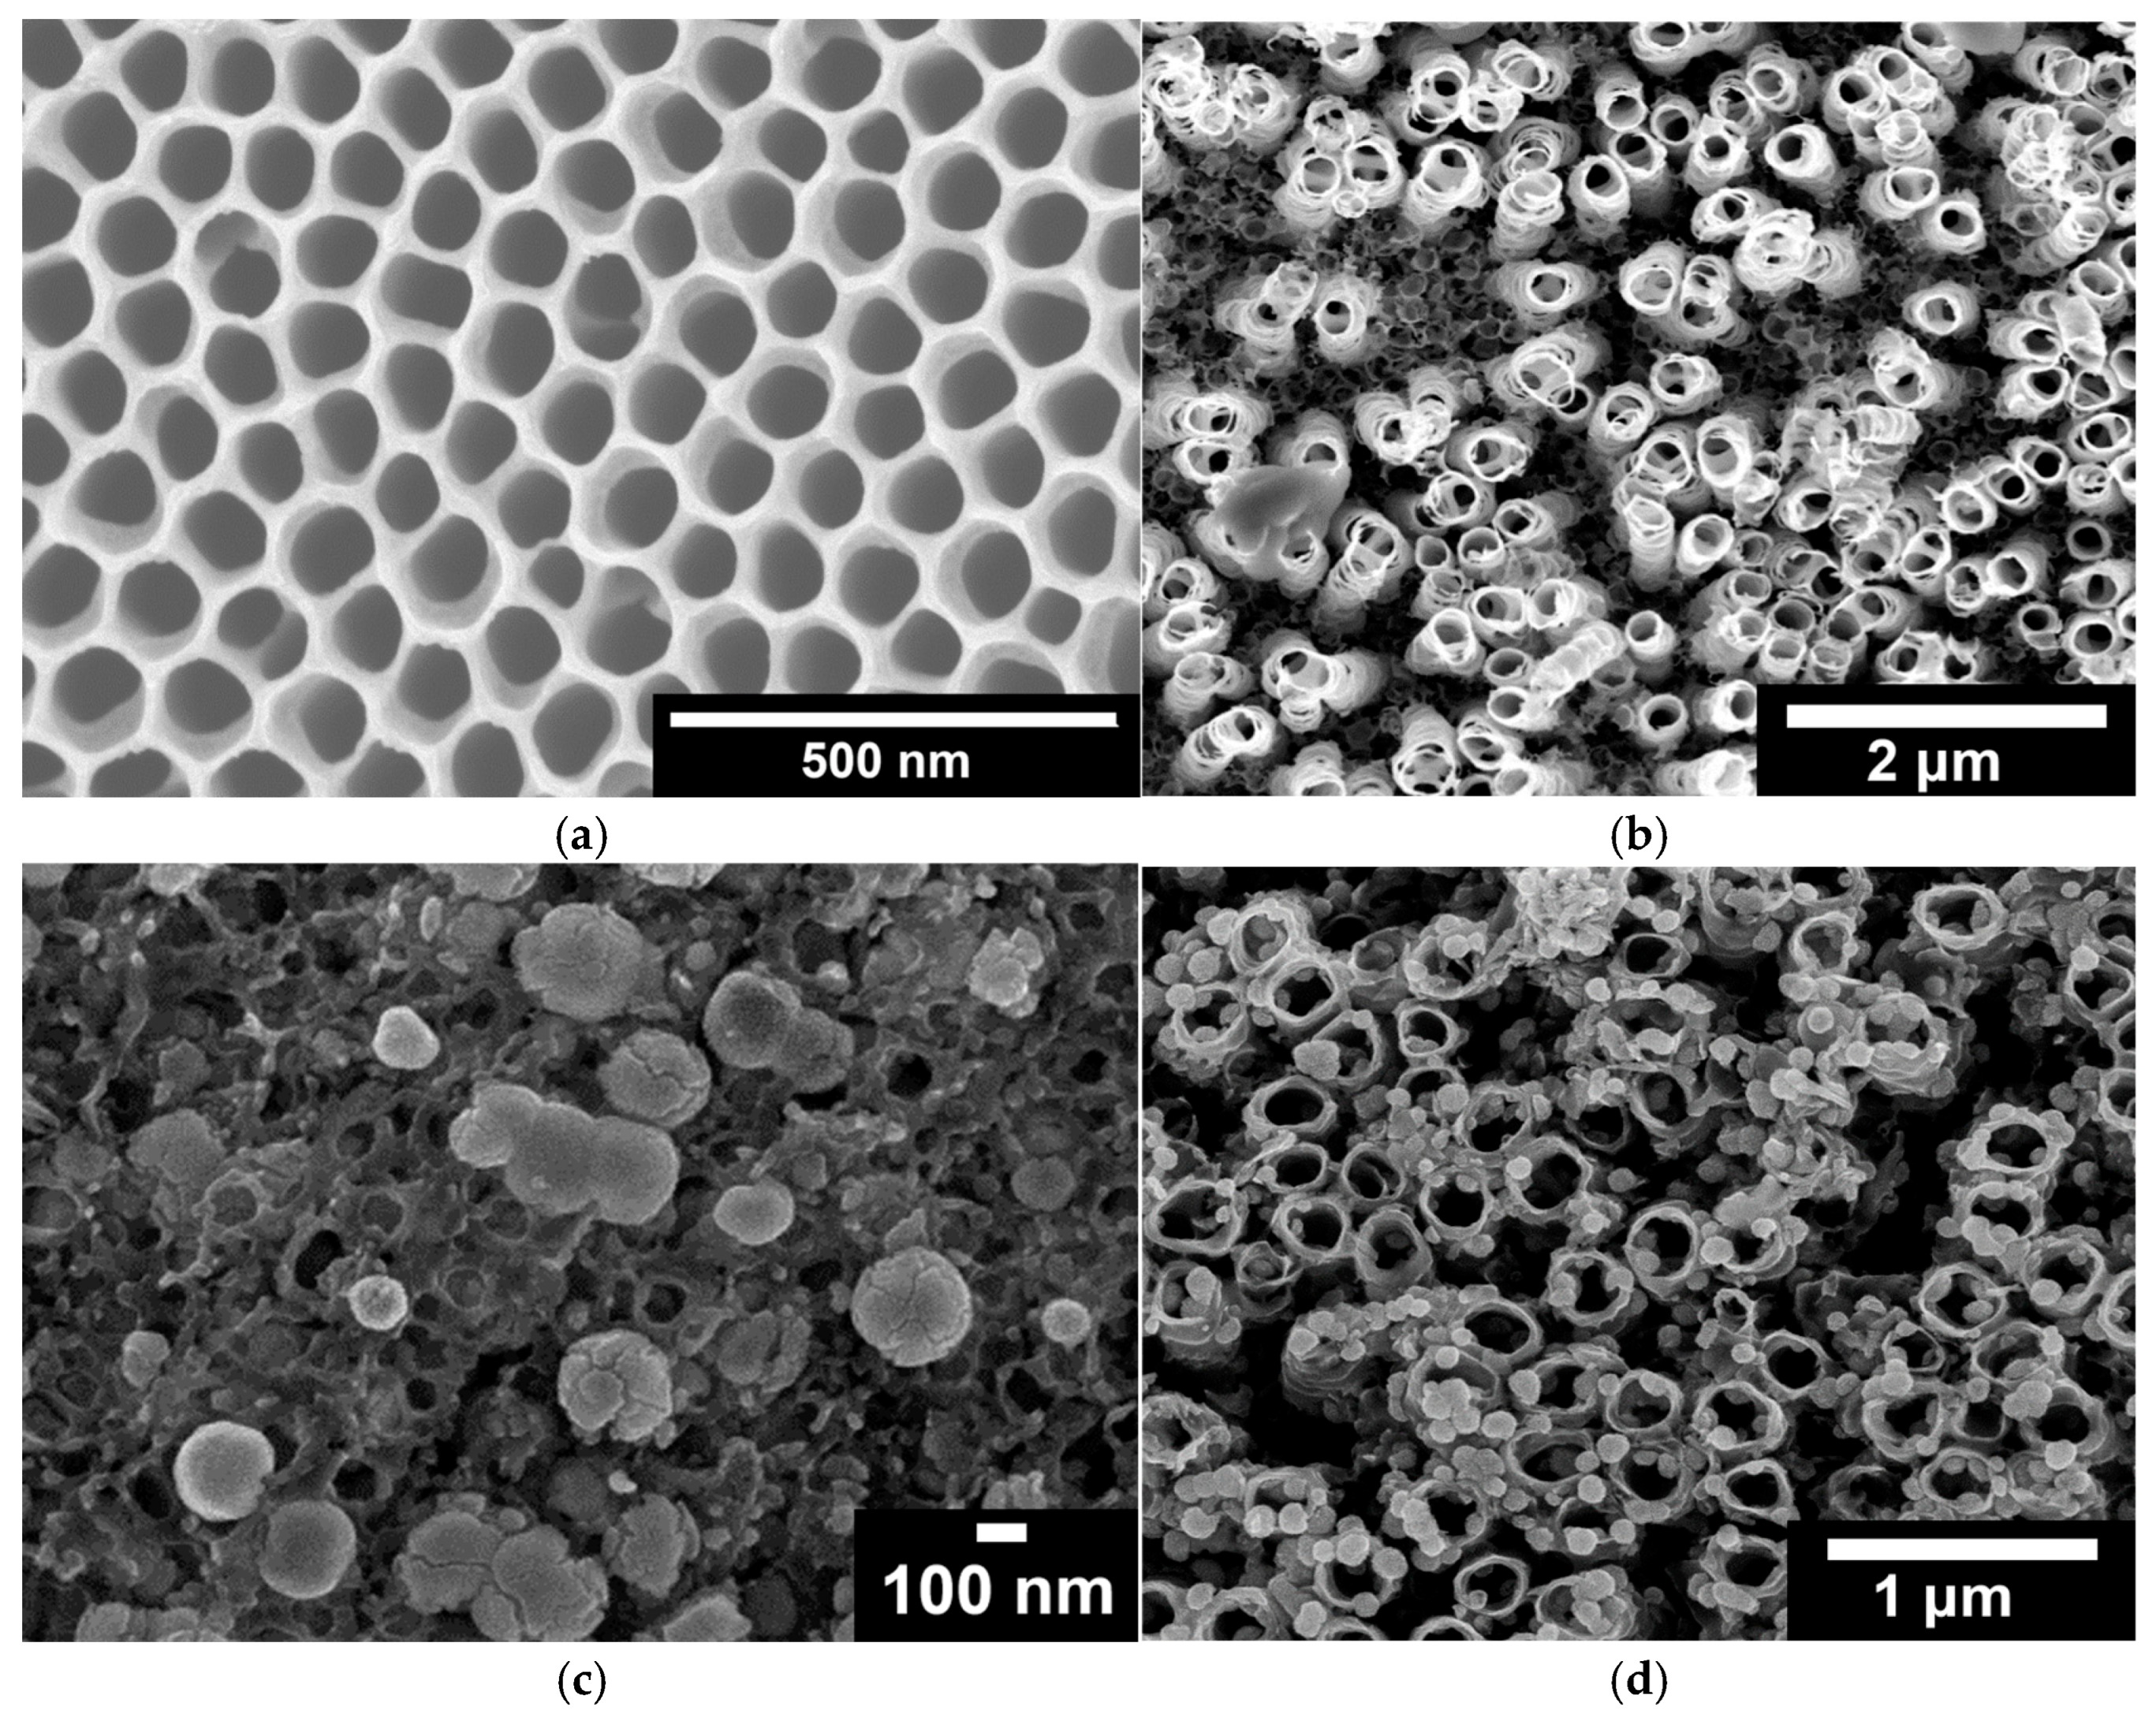
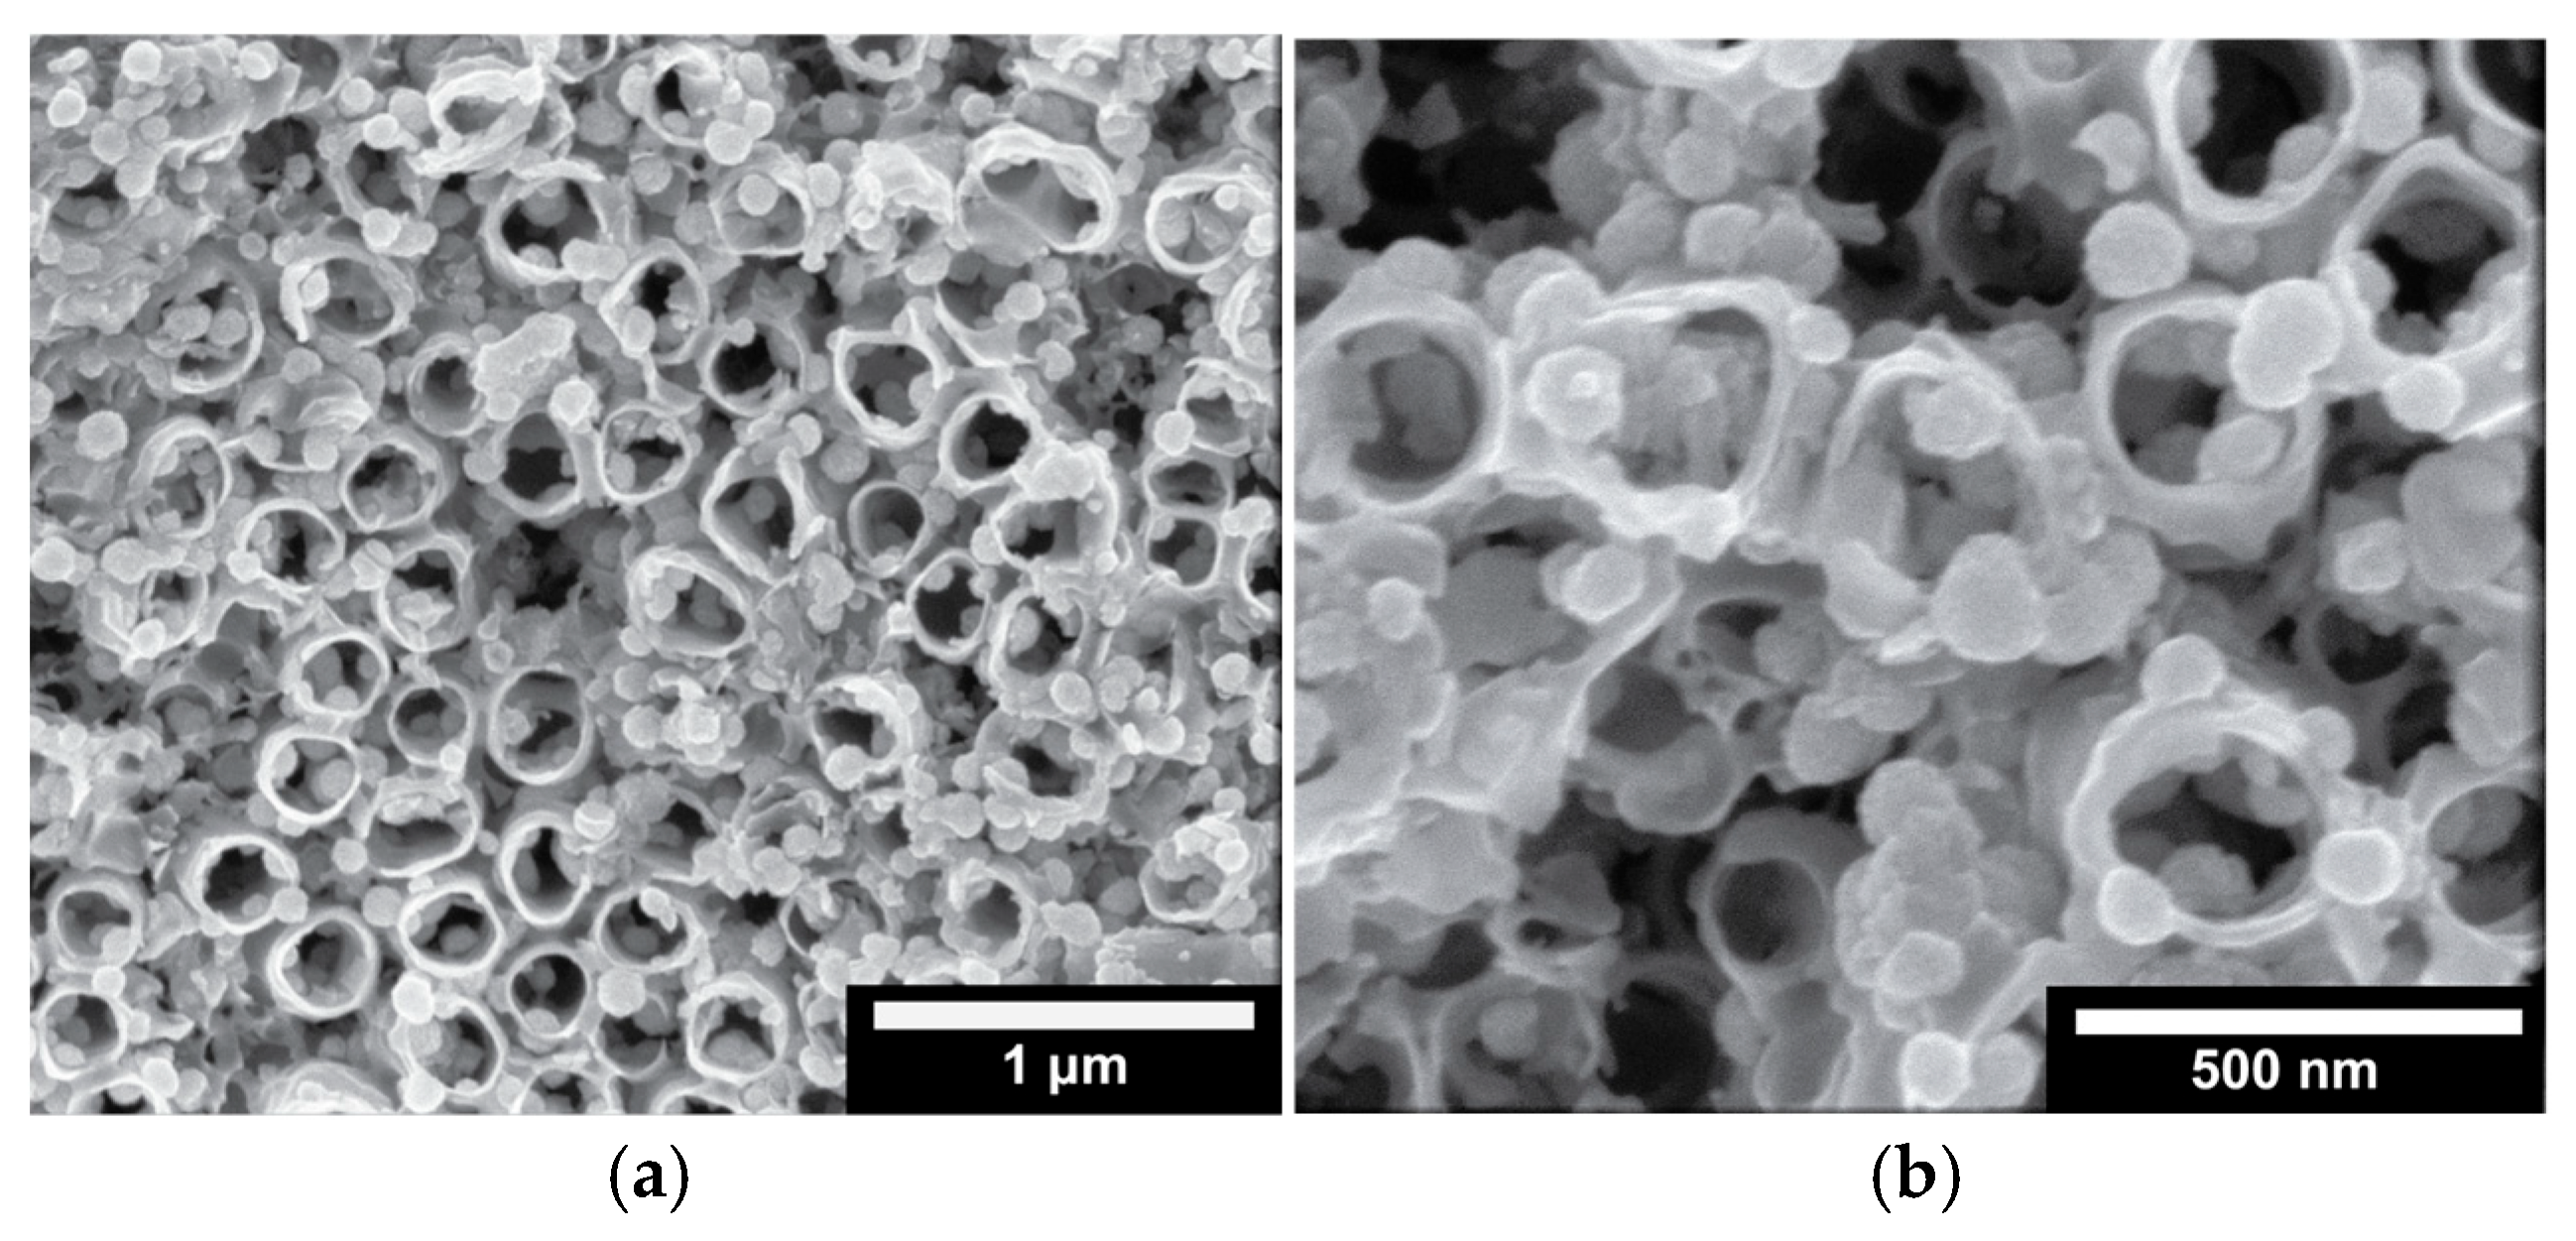
In the case of two-step bTNTs (Figure 1a), the nanotubes are close-packed, vertically oriented with a relatively smooth nanotube surface and distinct honeycomb-like morphology [46,68]. In contrast, the one-step bTNTs (Figure 1b) display a sparse arrangement of the nanotubes with an open structure. The difference in morphology may be attributed not only to the one- and two-step anodization processes but also to the use of a more water-rich anodization electrolyte in the case of open-structure nanotubes. In the two-step anodization process, the pre-formed pattern from the first step is utilized to grow highly ordered nanotubes, whereas in the one-step process, strict control over orientation is more challenging [69,70]. In addition, variations in the electrolyte composition further influence the structure. The water-rich electrolyte used to obtain open-structure TNTs results in increased solubility of the fluoride-rich layer of the nanotube walls, leading to a more open-structure with thinner walls [71,72,73]. Hence, the average nanotube diameter was 193 nm for the one-step/open structure (Figure 1b) and 92 nm for the two-step/close-packed (Figure 1a) TNTs.

Figure 1.
SEM micrographs of: (a) two-step/close-packed TNTs; (b) one-step/open-structure TNTs; (c) close-packed IrOx(Ni)/bTNTs and (d) open-structure IrOx(Ni)/bTNTs.
Following electrodeposition of Ni and galvanic replacement by Ir, it appears that the surface of the close-packed bTNTs (Figure 1c) and TNTs (Figure 2) is covered by large (>100 nm) Ir-Ni particles/aggregates that are blocking most/all the pores of the nanotubes. EDS elemental analysis of these close-packed electrodes gave an Ir:Ni atomic ratio of ca. 6 for the bTNTs and 0.13 for the TNTs substrates, indicating a larger remaining Ni content in the latter case, in line with the larger quantity of initially electrodeposited Ni that was needed to grow Ni from the more conducting bottom of the TNTs to their top surface (see discussion in Section 4.1.2 below and Figure S1). Also, in the case of the semiconducting-low electronic conductivity TNTs, Ir electron uptake/deposition is expected to occur only at conducting Ni sites (“protecting” them against further dissolution) and not on titania sites (as should be the case for electron-conducting bTNT sites, thereby leading to excessive Ni dissolution from neighboring uncovered Ni locations).
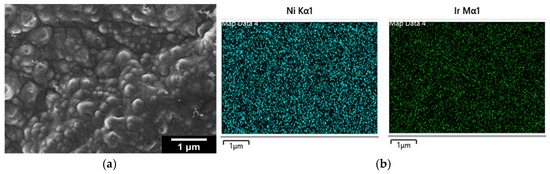
Figure 2.
(a) SEM micrographs of close-packed IrOx(Ni)/TNTs; (b) the corresponding EDS mapping analysis.
For the open-structure IrOx(Ni)/bTNTs (Figure 1d), Ir nanoparticles with an average diameter of 74 nm (56–93 nm) can be seen, some residing at the rim or the interior of the pores (where sacrificial Ni apparently could be pre-deposited) and no Ni was detected by EDS, indicating its complete dissolution/replacement. To confirm that all Ni has been dissolved even from the surface of the open-structure bTNTs (and therefore, that Ir has been deposited on conducting open-structure bTNT sites), XPS analysis was also carried out for the as-prepared sample and no Ni was detected, whereas Ir was detected at 4–7% atomic concentration depending on location.
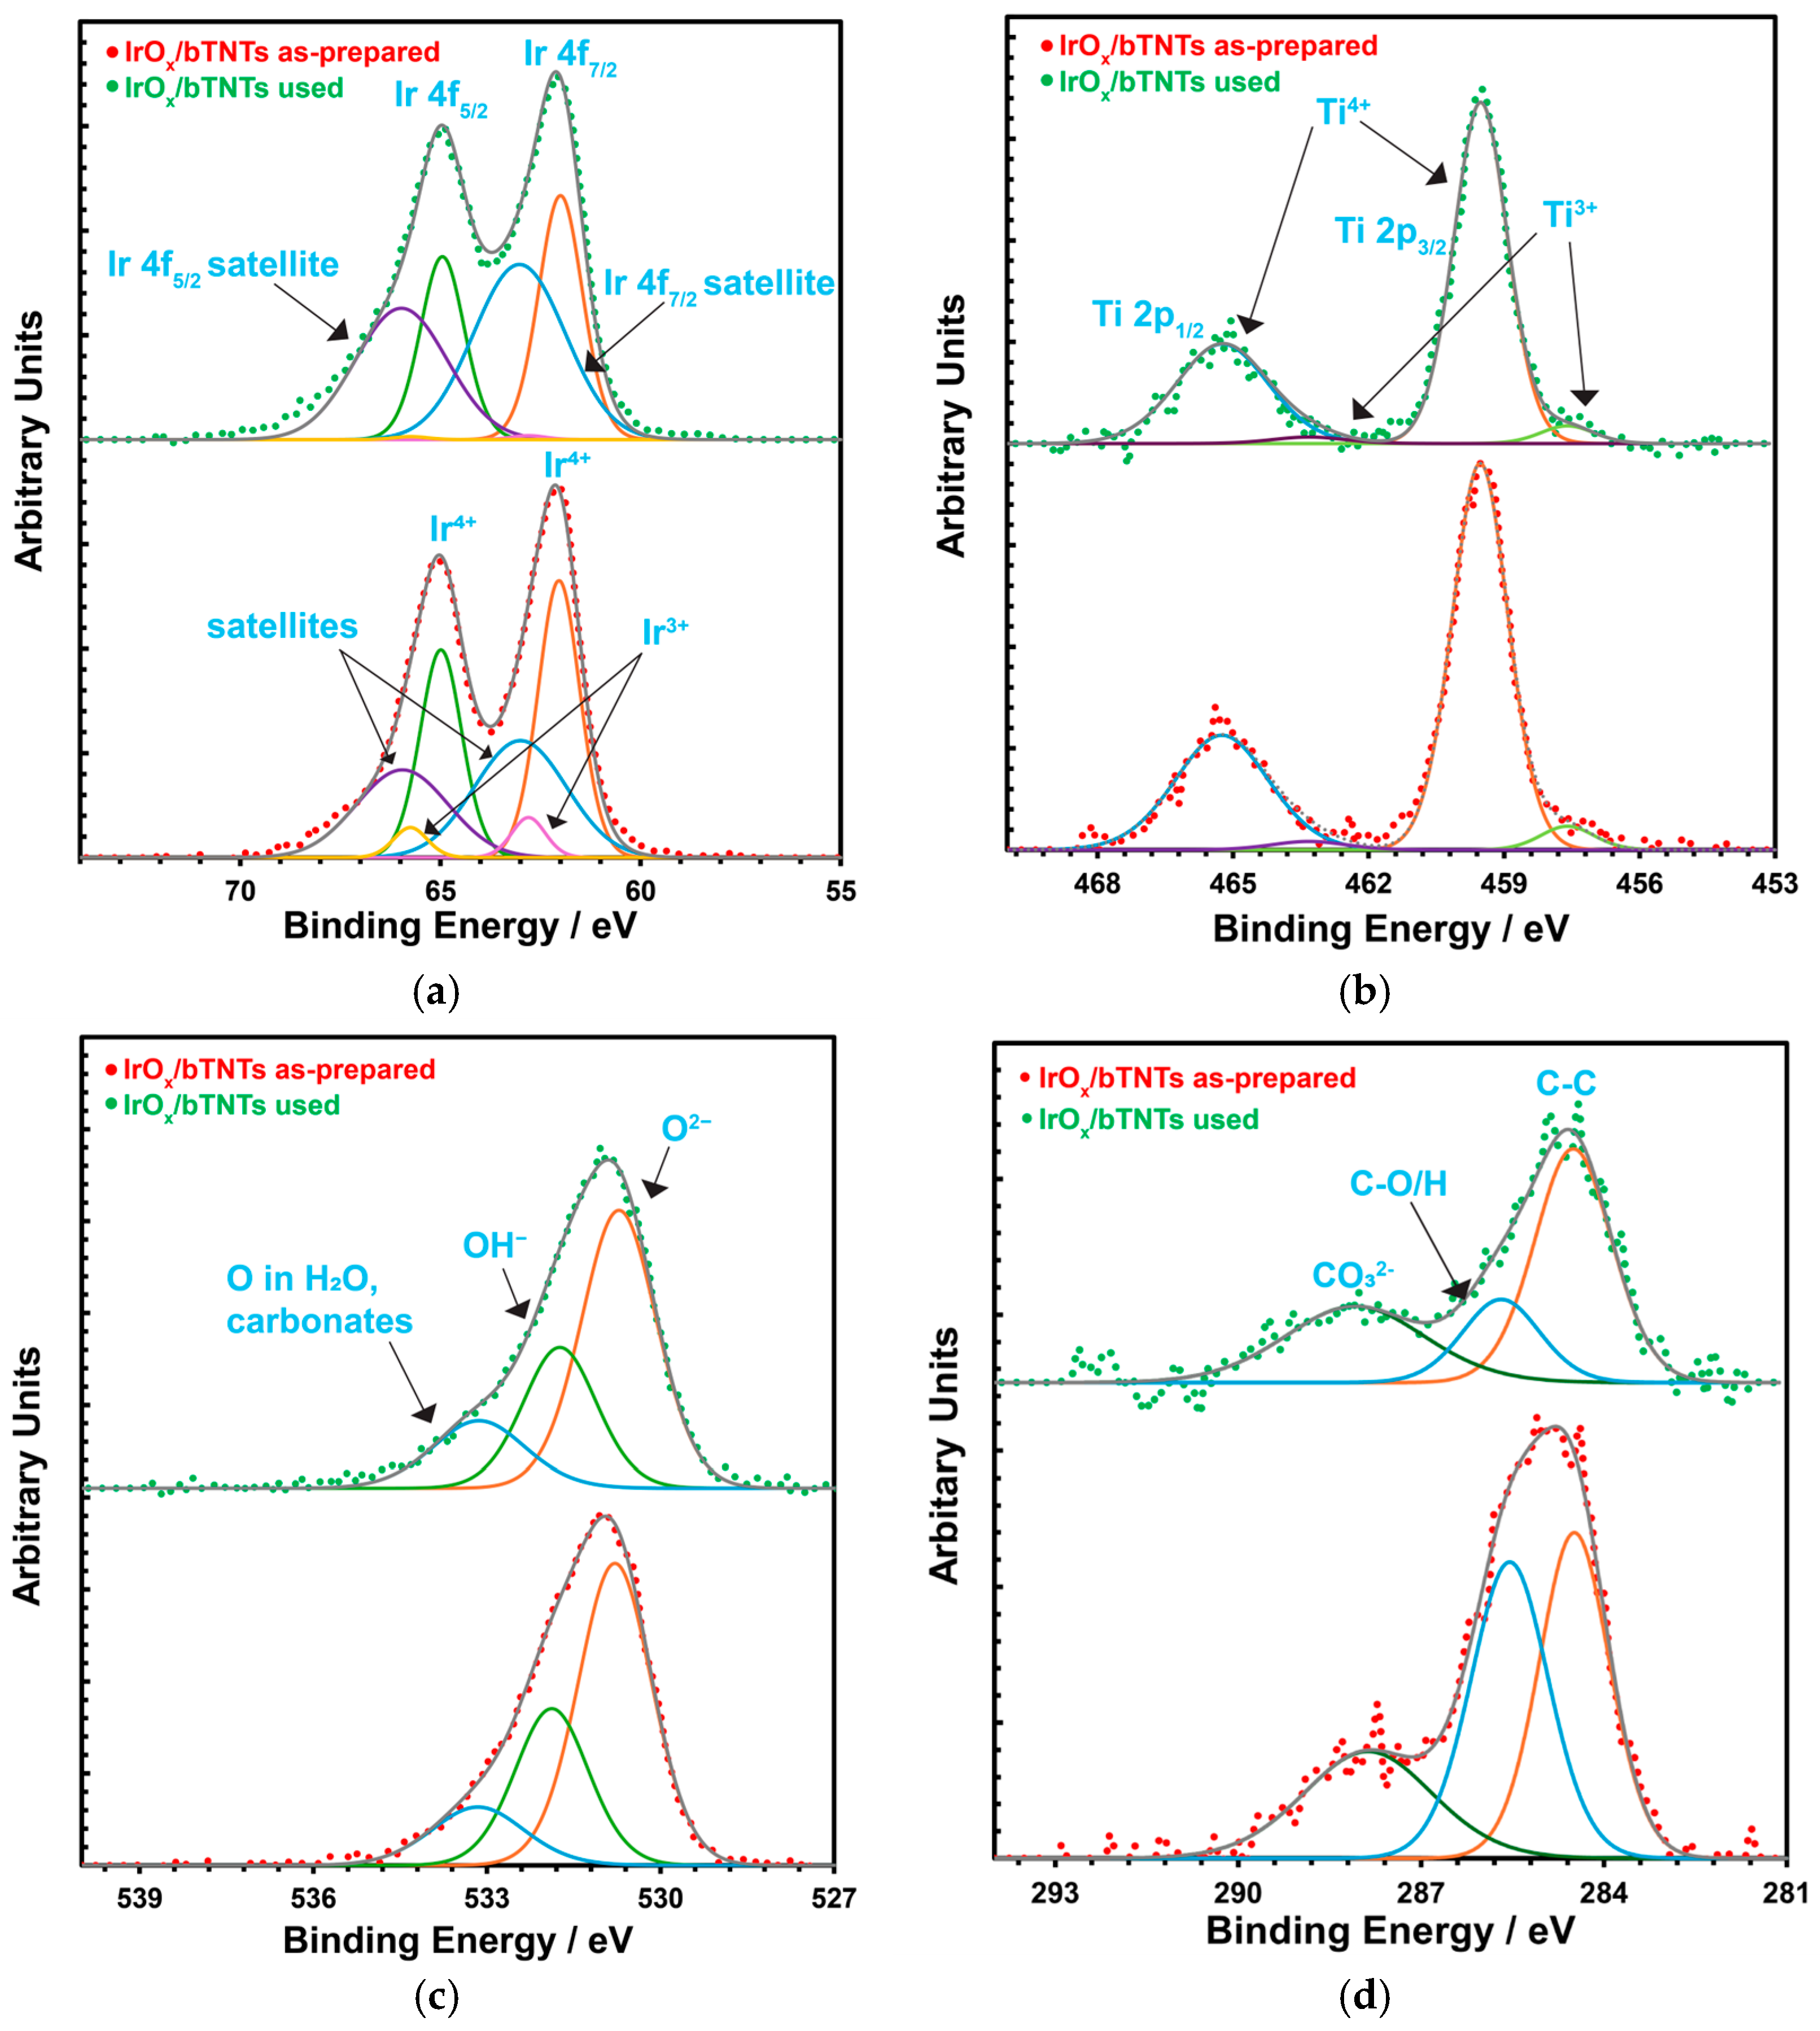
XPS measurements were also performed after the stability test of the open-structure IrOx/bTNT sample and no significant changes were observed in the surface chemical composition of the electrode. The corresponding XPS spectra for the as-prepared and used IrOx/bTNTs electrodes are shown in Figure 3. Figure 3a shows the Ir 4f spectrum, which consists of four main components. The 4f7/2 and 4f5/2 doublet corresponding to the main XPS 4f peaks for Ir4+ (IrO2) and their two associated satellite peaks (at a binding energy ~1 eV above the main peaks), which have their origin in the excitation of Fermi energy (EF) electrons to unoccupied state at ~1 eV above the EF of IrO2. The main difference between the two samples is the satellite-to-main peak intensity ratio, which is higher for the “used” sample. This can indicate that IrO2 in the “used” sample has more available unoccupied states just above the Fermi level. Other possible interpretations could in principle be the presence of Ir3+, as its binding energy has been reported to be at a higher value than for Ir4+ [74] or the presence of hydroxides of Ir4+ [75]. However, and although there does not seem to be a consensus on the peak position and shape of the 4f peaks for Ir3+ [74,75], its presence is more likely in the as-prepared sample that has not been exposed to positive potentials/oxidative conditions, as also indicated by the need to include two additional peaks at 62.6 and 65.6 eV in that case (Figure 3a, bottom) to account for hydrated Ir3+ [75]. Figure 3b shows the Ti 2p spectrum, which corresponds to Ti4+ and Ti3+. The 4+/3+ peak intensity (area) ratio seems almost unchanged between the two samples. Figure 3c shows the O 1s spectrum, showing components attributed to oxides, hydroxides and compounds containing adsorbed oxygen species. No significant differences between the two samples are observed. Finally, Figure 3d gives the C1s spectrum, as this peak was used to slightly correct the energy scale after charge compensation by setting the C-C component to 284.5 eV. The “used” sample has less oxidized C, suggesting its removal during OER operation in the acidic environment.
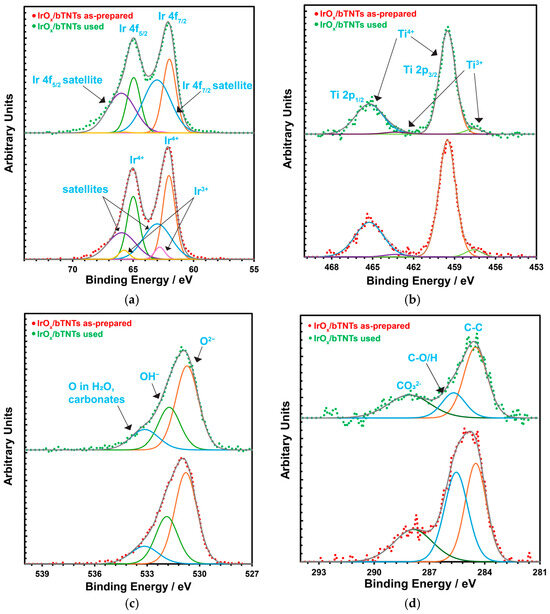
Figure 3.
XPS spectra for the as-prepared (red dotted line) and used (green dotted line) for OER after 72 h IrOx/bTNTs electrode: (a) Ir 4f; (b) Ti 2p; (c) O 1s; and (d) C 1s spectra.
Finally, Ir loading was determined as 0.3 mg cm−2 for the open-structure IrOx(Ni)/bTNTs by the ICP-MS technique (following electrode etching as described in Section 4.3). Since both XPS, EDS, and ICP-MS analysis revealed that Ni is not present in the open-structure bTNTs catalyst, it will henceforth be referred to as IrOx/bTNTs instead of IrOx(Ni)/bTNTs.
2.2. Electrochemical Characterization
2.2.1. Surface Electrochemistry of the Catalysts
For the as-prepared Ir/Ni-, Ir-loaded electrodes were scanned multiple times in a 0.1 M HClO4 deaerated solution with a scan rate of 50 mV s−1, until stable voltammetry was recorded, in the potential range of
- 0.0 VRHE to +0.6 VRHE, corresponding to the potential range between the onset of hydrogen evolution and the end of Ir double layer potential region [76,77], for the electrochemical dissolution of any surface uncovered/unreacted Ni and the formation of an Ir(Ni) mixed core–skin structure [65] in the samples that contain Ni, until only the peaks attributed to the adsorption and desorption of an under-potentially deposited hydrogen (UPD-H) layer on metallic Ir could be clearly recorded, as depicted indicatively in Figure 4 for the case of open-structure Ir/bTNTs. The electrochemical surface area (ECSA) of metallic Ir is related to the charge associated with the adsorption of a H monolayer on Ir; the former could be calculated from the voltammograms of Figure 4 (by integration of the anodic/H-desorption peak between −0.05 and 0.30 V) as 21.8, 49.4, and 239 cm2Ir cm−2 for the close-packed Ir(Ni)/TNTs, the close-packed Ir(Ni)/bTNTs, and the open-structure Ir/bTNTs, respectively [15,64,78], in line with the increase in IrO2 coating roughness/particle dispersion depicted in Figure 2, Figure 1c, and Figure 1d, respectively, that correspond to these three different electrode types.
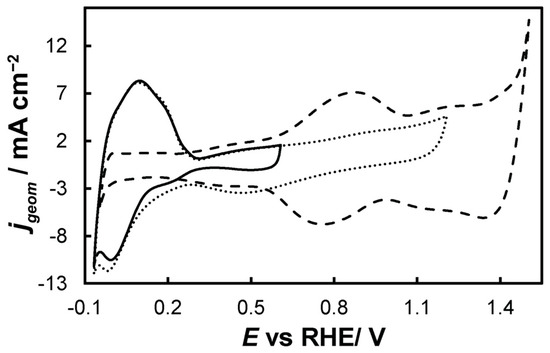 Figure 4. Stabilized cyclic voltammograms (obtained at 50 mV s−1, in deaerated 0.1 M HClO4) of the open-structure IrOx/bTNTs recorded in three potential windows, with an upper potential limit of +0.6 VRHE (solid line), +1.2 VRHE (dotted line), and +1.5 VRHE (dashed line).
 - 0.0 VRHE to +1.2 VRHE, where the characteristic reversible Ir surface oxide/hydroxide peaks of the Ir (III) ⇌ Ir (IV) redox transformations are recorded at Ea = 0.85 VRHE and Ec = 0.75 VRHE [67,77], as can be seen in Figure 5 for all electrode types.
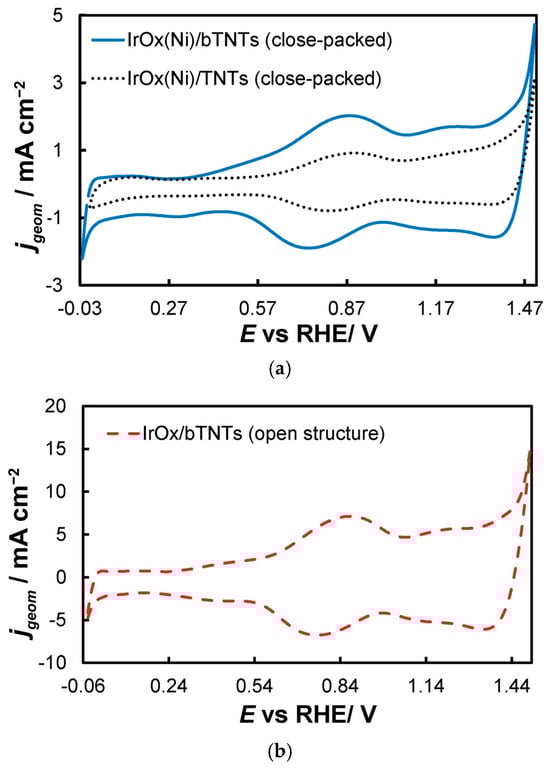 Figure 5. Stabilized cyclic voltammograms (obtained at 50 mV s−1, in deaerated 0.1 M HClO4) recorded in the potential window between hydrogen and oxygen evolution for the (a) close-packed IrOx(Ni)/bTNTs and TNTs and (b) open-structure IrOx/bTNTs. Current density, jgeom, is per electrode substrate projected geometric area.
 - 0.0 VRHE to +1.5 VRHE, for the electrochemical anodization of metallic Ir to different oxidation states (IV, V) in order to form stable, porous 3D-IrOx, which also extends to the interior of the material [79,80,81]. In Figure 5, the electrochemistry due to anodically generated IrOx appears above +1.0 VRHE [67,82,83]. From the CVs, the charge corresponding to Ir oxides, which is representative of the electroactive surface area available for OER [84,85,86], was calculated (by integration of the anodic/IrOx formation peaks between 0.30 and 1.40 V) as 16.6, 26, and 80 mC cm−2 for the close-packed IrOx(Ni)/TNT and IrOx(Ni)/bTNTs, as well as the open-structure IrOx/bTNTs, respectively (again, in line with coating roughness/particle dispersion shown in the SEM micrographs of Figure 1 and Figure 2). Taking into account the mass loading of Ir (see Section 2.1 above), the mass specific electroactive area/oxide charge of the IrOx/bTNT electrode can thus be estimated as 267 C gIr−1, a value that compares favorably with those of commercial IrO2 powder electrodes (100–200 C gIr−1 [19,85]) and IrO2 supported on TiO2 powder electrodes (54–125 C gIr−1 [19]).
2.2.2. Oxygen Evolution Reaction
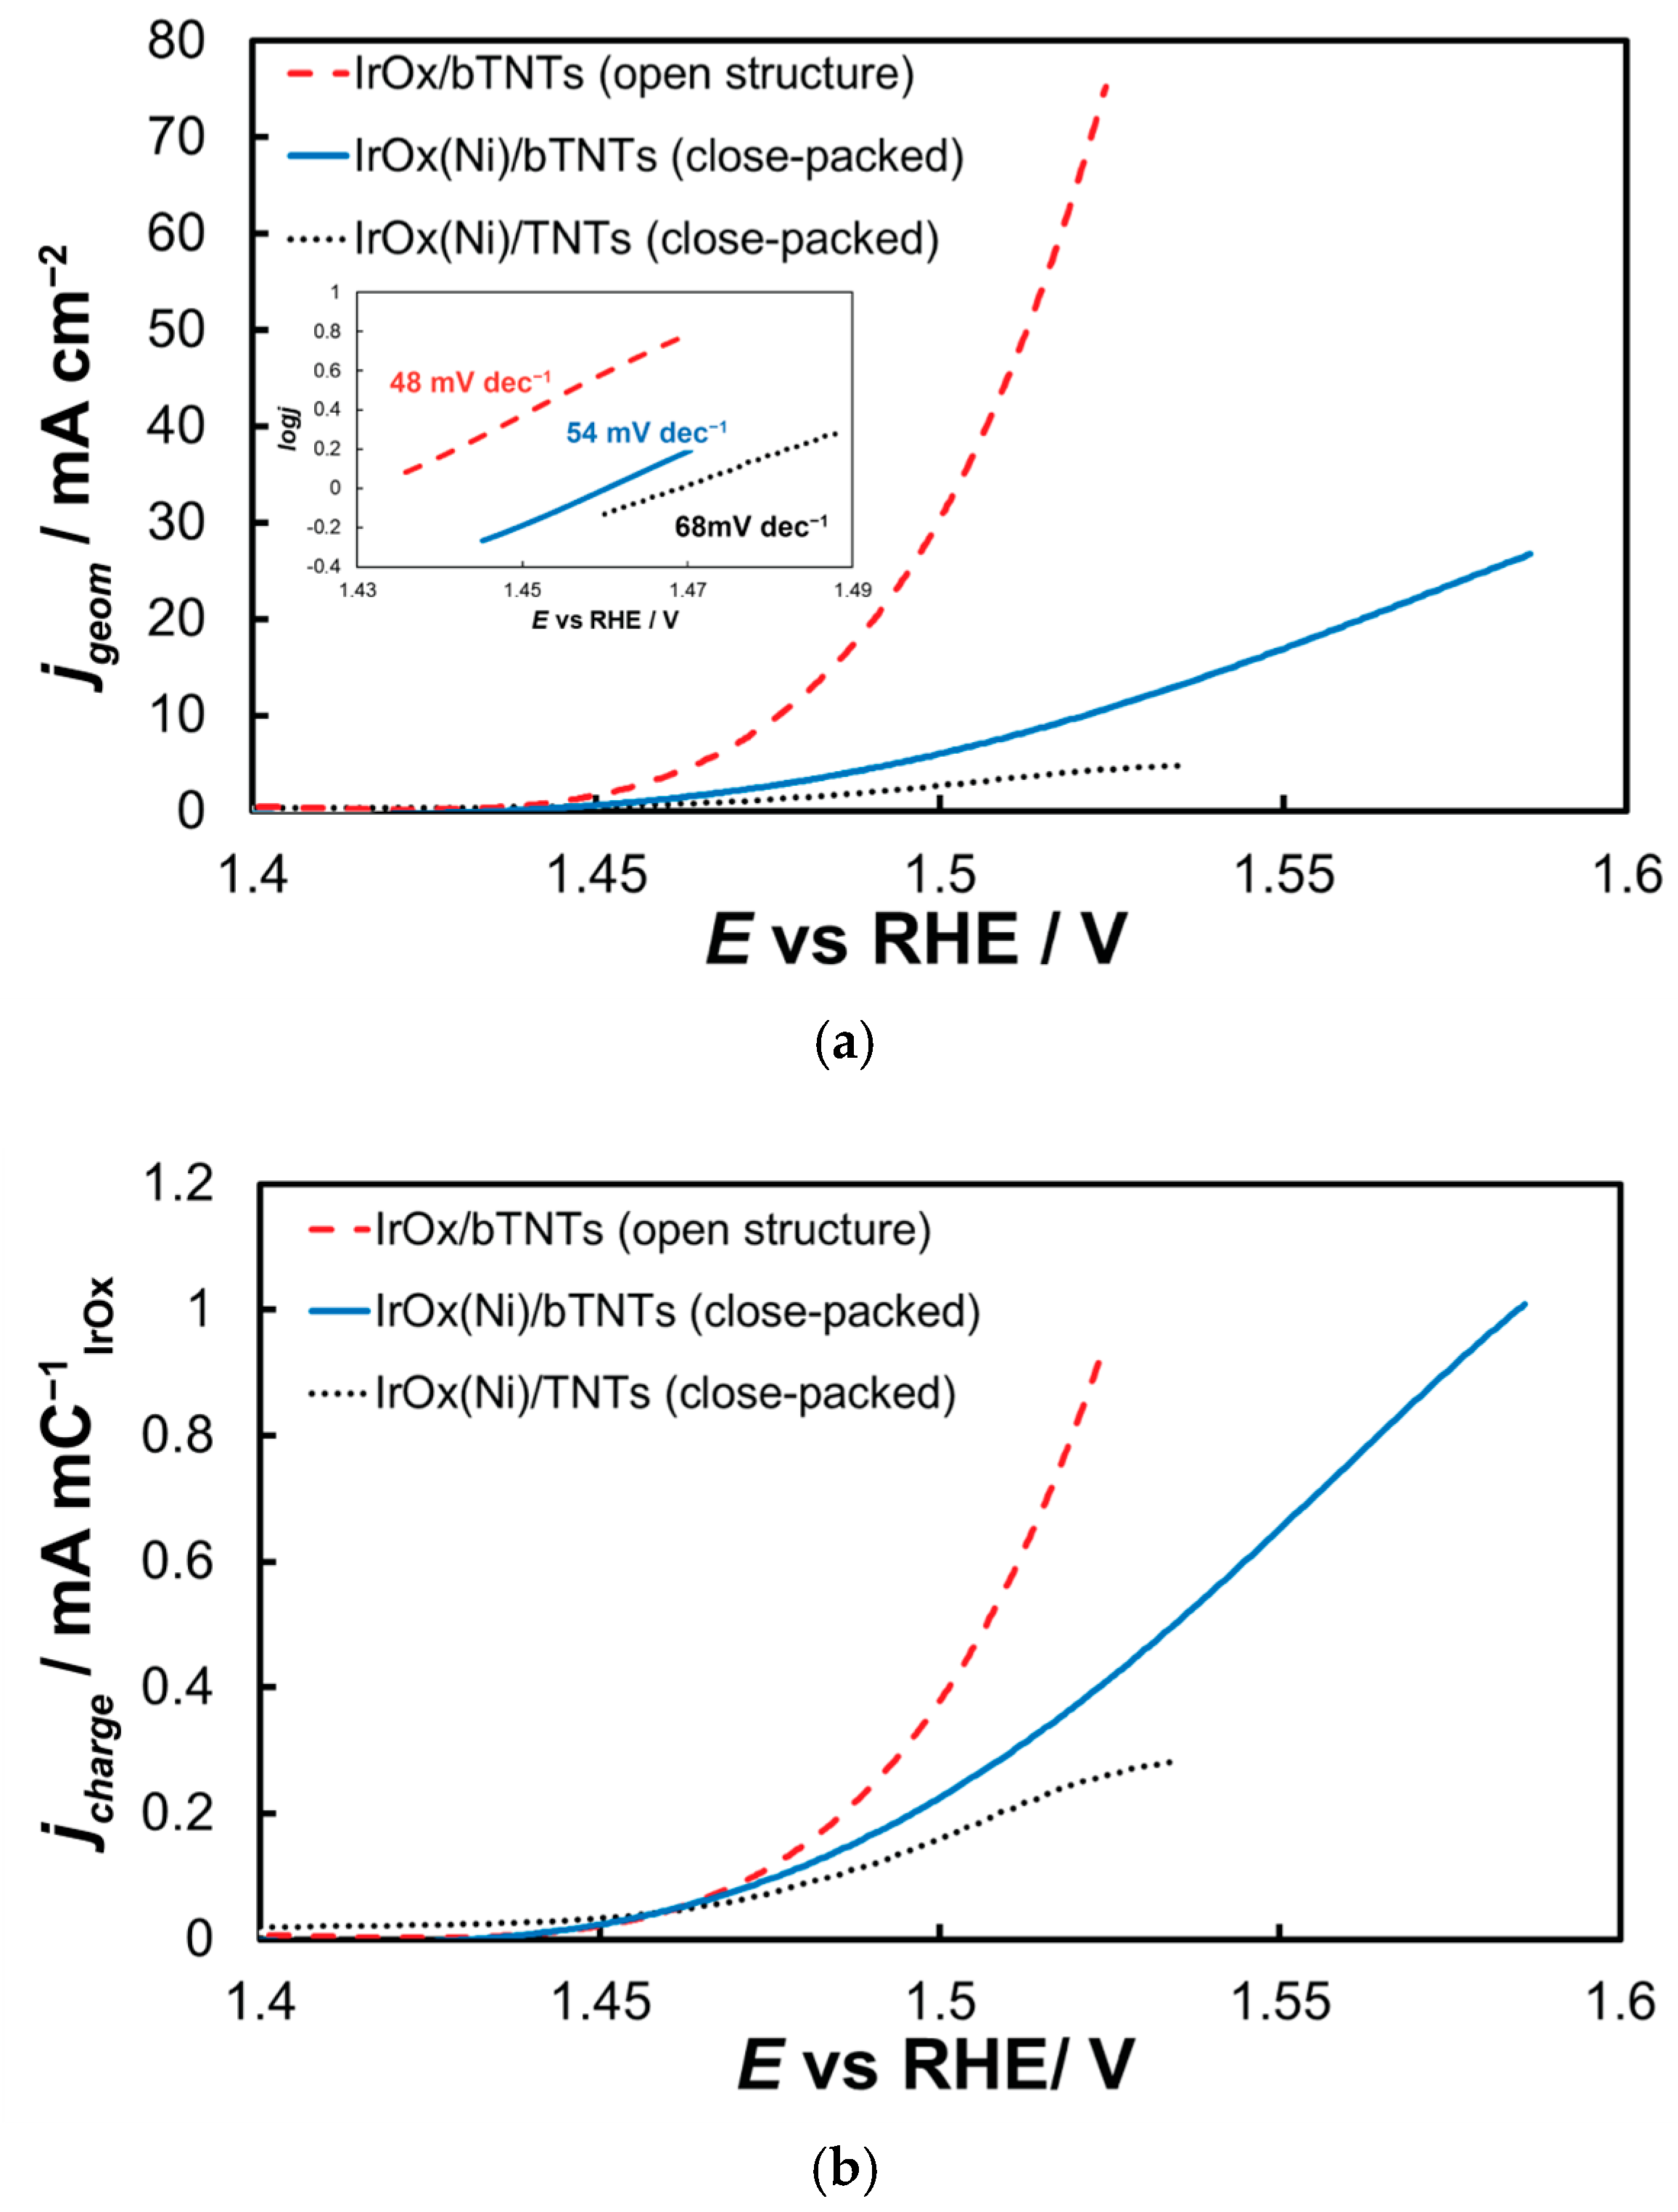
The electrocatalytic electrodes were tested towards the OER by means of near-steady state experiments comprising LSV curves recorded at 5 mV s−1, from +1.2 to +1.7 VRHE. The current interrupt method was applied at +1.2, +1.3, +1.4, +1.5, and +1.6 VRHE to estimate the uncompensated resistance and correct the applied potential for ohmic losses. The overall activity of IrOx supported on untreated-semiconducting-low conductivity TNTs towards OER (Figure 6a) is inferior to that of IrOx supported on reduced-conducting bTNTs, in line with its lower oxide electroactive surface area depicted in Figure 5 above and the continuous/non-particulate morphology of the corresponding deposit depicted in the SEM micrograph of Figure 2 above. Τhe IrO2 catalyst supported on the open-structure bTNTs exhibited the highest currents-activity towards OER. This can be attributed again to the higher electroactive surface area of IrO2 on these substrates (again, in accordance with its calculated IrOx charge and its higher catalyst particle dispersion). Also, its open substrate morphology even after the introduction of the IrO2 nanoparticle catalyst, should prevent clogging of the nanotubes with generated O2 during the OER (which may be the case for the close-packed substrate electrodes). The Tafel slope for OER (Inset of Figure 6a) was estimated as 48, 54, and 68 mV dec−1 for the three electrode types, which is common for IrOx supported electrodes and a mechanism based on a rds that entails the chemical activation of adsorbed OH species (produced after the first, one-electron transfer step from H2O to the anode electrode) [65,87,88].
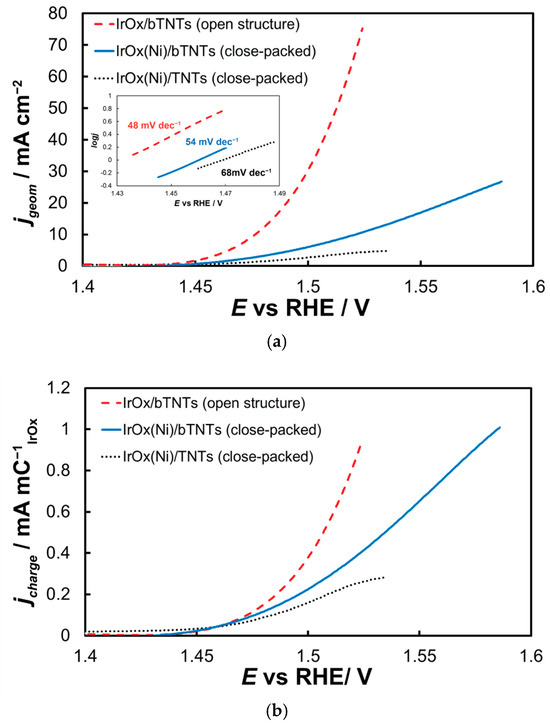
Figure 6.
(a) Current density (per electrode substrate geometric area) vs. applied potential curves corrected for the uncompensated solution resistance (obtained at 5 mVs−1, in deaerated 0.1 M HClO4) and their corresponding Tafel plots (Inset). Current density, jgeom, is per electrode substrate projected geometric area; (b) same as above but with current density, jcharge, normalized per electroactive IrOx charge.
Figure 6b presents data normalized for IrO2 quantity and dispersion as described by the charge related to its surface electrochemistry (by integration of the anodic part of Figure 5). Hence, current values reported in this way take into account differences in electroactive area between samples and are therefore representative of samples’ intrinsic activity (in the absence of any other parameters such as mass transfer limitations). Although the onset potential for OER appears to be similar for all electrodes studied, the superiority of the open-structure IrOx/bTNT electrode at higher overpotentials becomes apparent, pointing to the beneficial effect of the Ir-bTNT interactions (higher in the absence of remaining Ni on these samples-see Microscopic and Spectroscopic Characterization above) and/or of its open structure (see Figure 1d above) that limits extensive surface blockage by large oxygen bubbles.
2.2.3. Electrochemical Impedance Spectroscopy (EIS)
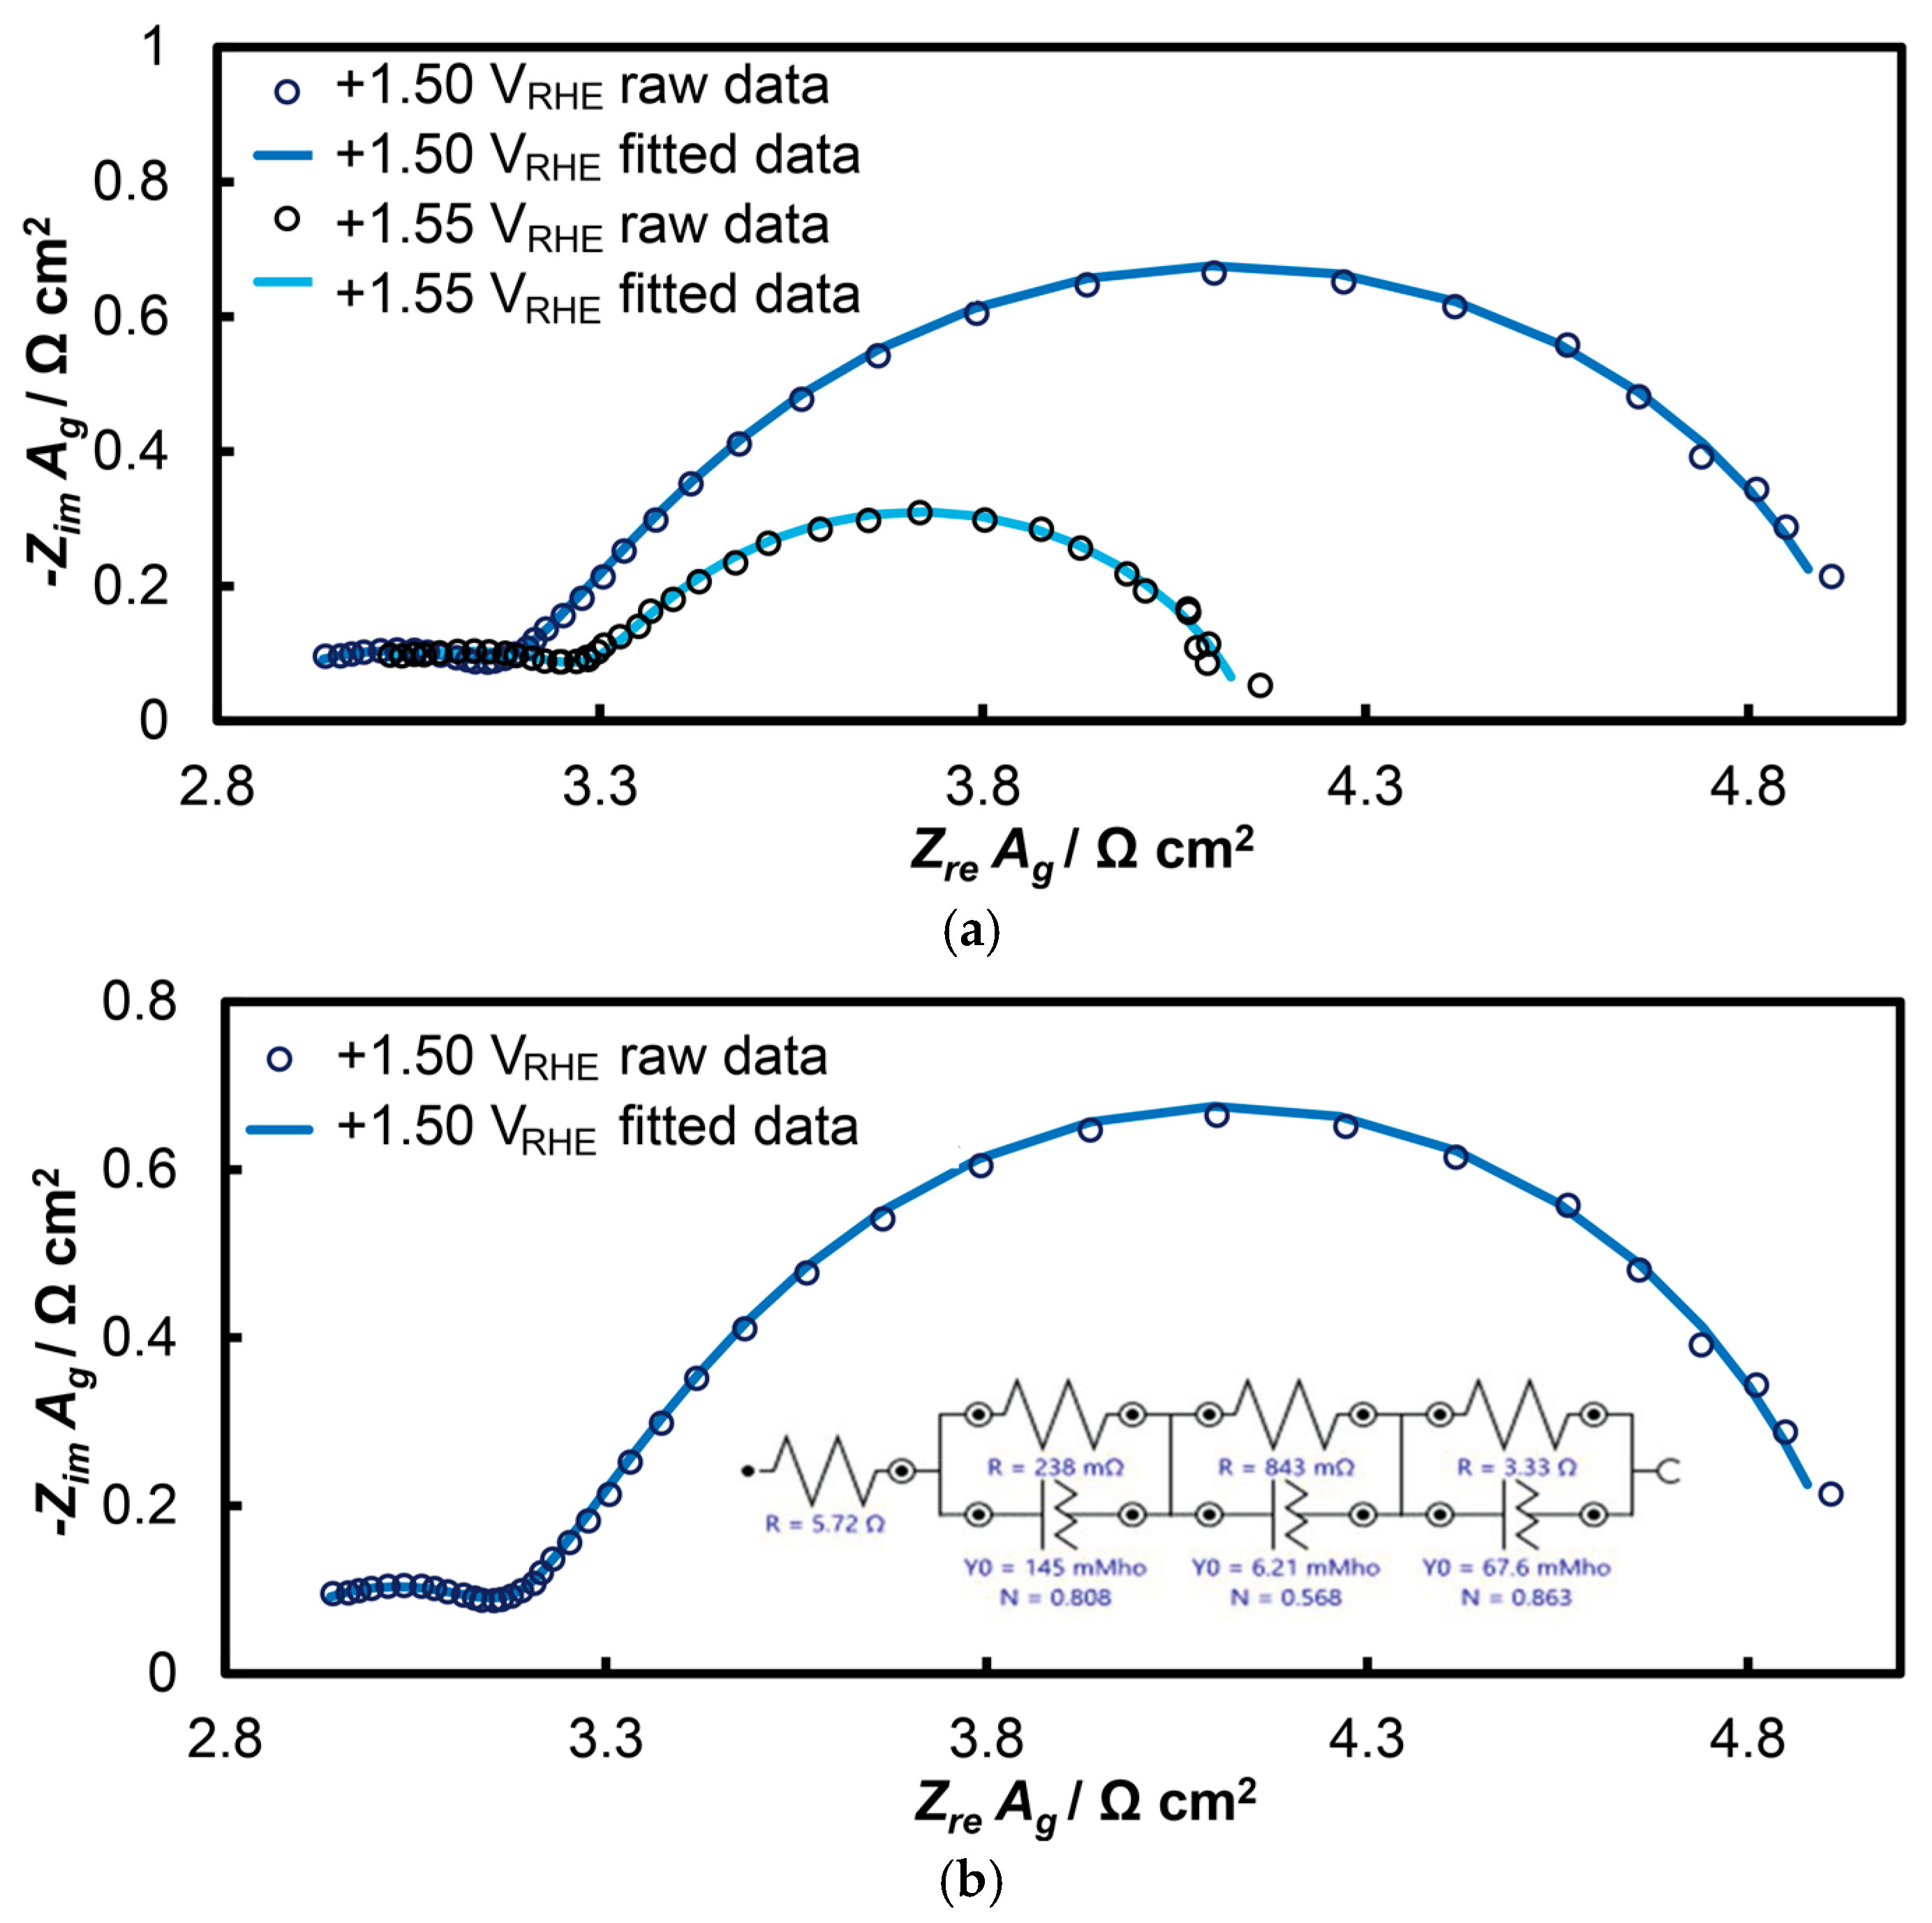
The response of the open-structure IrOx/bTNTs electrode is presented in Figure 7 (as Nyquist diagrams) at potentials of +1.50 and +1.55 VRHE within the potential range of the OER. In these diagrams, two distinct semicircles can be observed, with the second (larger) semicircle showing slight deformation at higher frequencies, a phenomenon more pronounced in other similar systems [65,85]. This suggests the co-existence of three semicircles that can be modeled using the equivalent electrical circuit Rsol(RtQt)(RpQp)(RctQdl). At very high oscillation frequencies, the solution resistance (Rsol) was determined where the first semicircle intersects the real axis (Zre). Electrode porosity was also analyzed, with the first semicircle (modeled by RtQt) attributed to the porosity of the IrOx/bTNTs system (as depicted by SEM), and the second semicircle (RpQp) reflecting the nano-porosity of the 3D IrO2 oxides themselves. The pore resistance of iridium oxide is expected to be low, since the dispersed fine Ir particles cannot accommodate dense and thick IrOx layers. At lower frequencies, the third circuit (RctQdl) corresponds to the OER, representing the electron transfer resistance to the IrO2 catalyst during OER and charging of the electroactive material double layer (i.e., associated with phenomena at the electroactive surface area/electrolyte solution interface where electron exchange during the OER occurs).
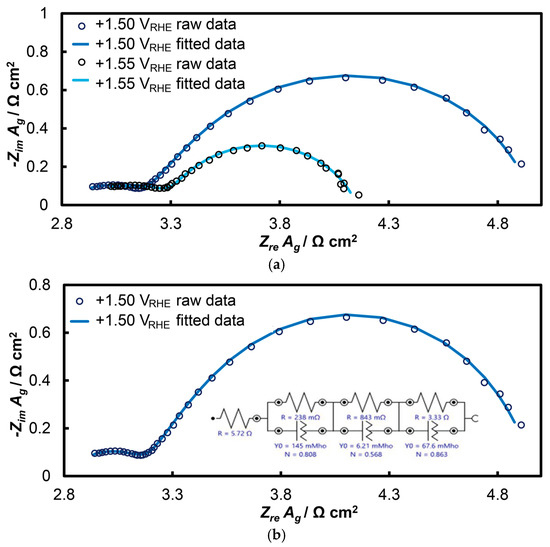
Figure 7.
Nyquist plots of electrochemical impedance spectroscopy at the open-structure IrOx/bTNTs electrode: (a) at potentials of +1.50 and +1.55 VRHE and (b) at the potential of E = +1.50 VRHE, as adapted to the equivalent electrical circuit Rsol(RtQt)(RpQp)(RctQdl).
Table 1 below presents all the parameters of the equivalent electrical circuit Rsol(RtQt)(RpQp)(RctQdl) fitted to the EIS data. The Rct is inversely related to the OER rate. When multiplied by the double layer capacitance, Cdl (which is indicative of the actual surface of the electroactive material during the charge transfer of OER), it becomes the inverse of a time constant, representing in an inverse manner the intrinsic electrocatalytic activity of an electrode [85]. Qdl (the constant phase element, CPE, circuit component) was converted to Cdl using the Mansfeld-Hsu equation [89,90] (Equation (1)):

Table 1.
Parameters of the equivalent circuit shown in Figure 7b at applied potential values of +1.50 and +1.55 VRHE for the open-structure IrOx/bTNTs electrode.
2.2.4. Stability Testing
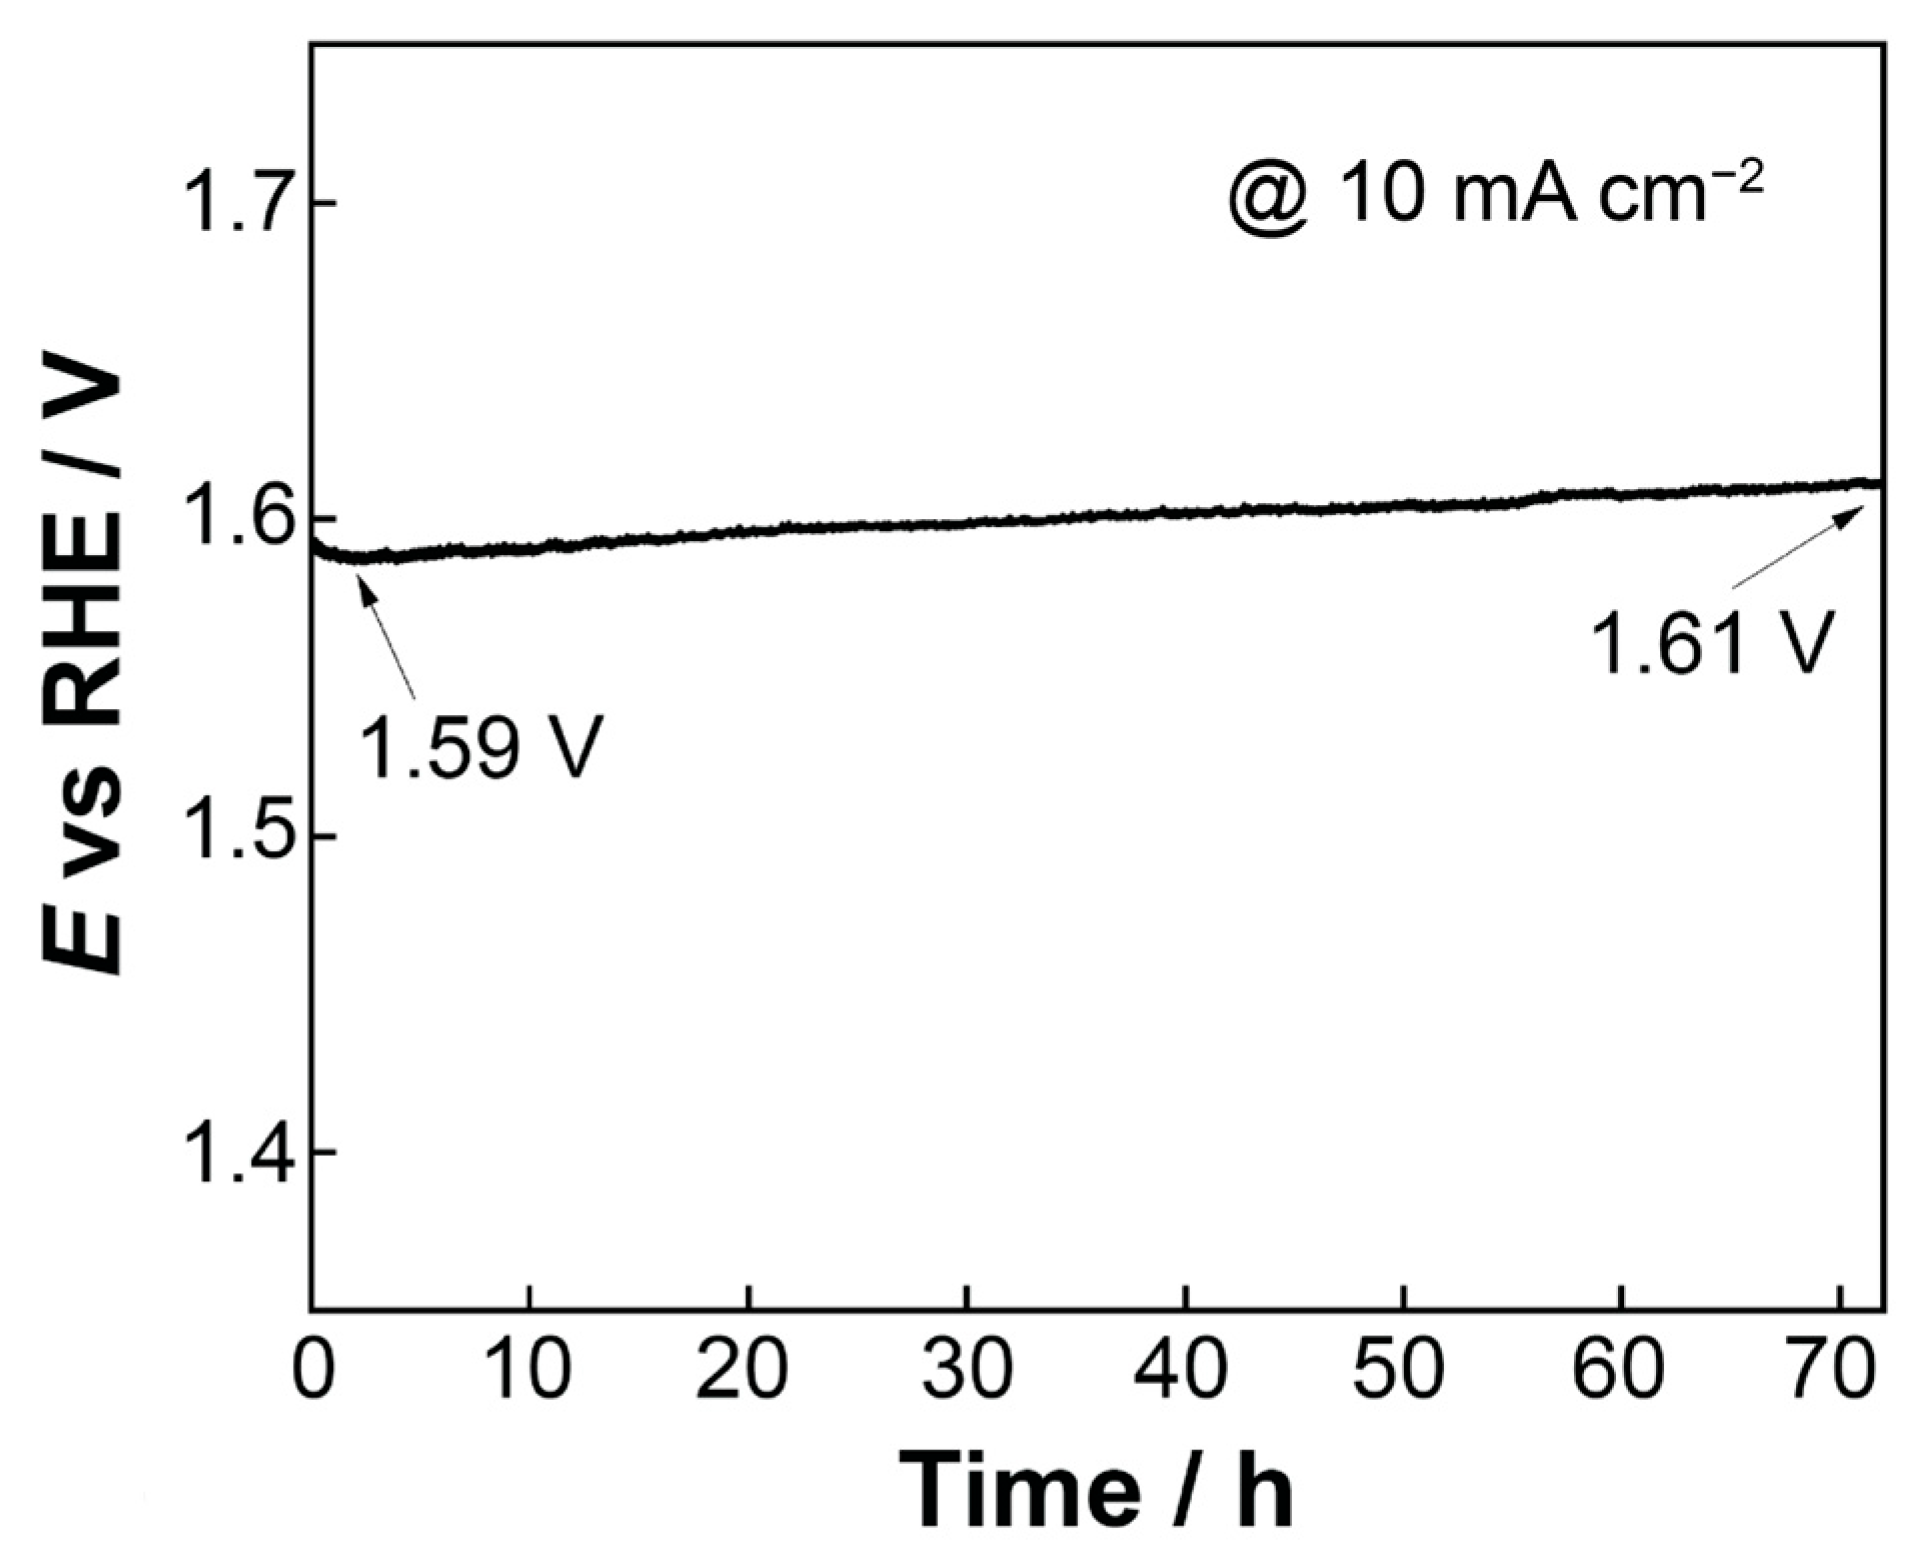
To assess the stability of the most electrochemically active electrode (open-structure IrOx/bTNTs) towards the OER, chronopotentiometry was employed and a current density equal to 10 mA cm−2 was applied for 72 h in 0.1 M HClO4 electrolyte. As can be seen from Figure 8, the electrode showed significant stability in the harsh acidic conditions during the OER and only a small shift in the potential equal to ca 20 mV was recorded.
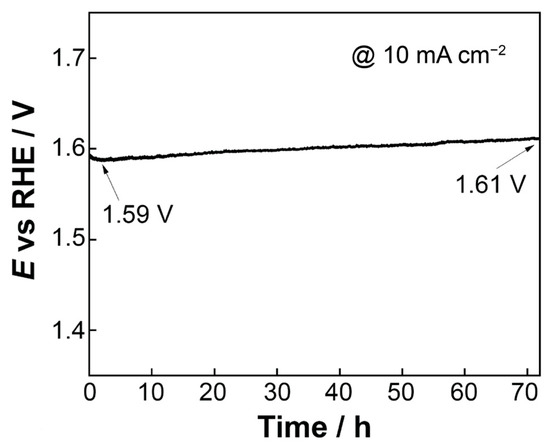
Figure 8.
Potential vs. time curve (chronopotentiometry) at a constant current density of 10 mA cm−2 for 72 h in 0.1 M HClO4 electrolyte.
Furthermore, from the XPS measurements before and after the stability test (Figure 3) no significant changes in the chemical composition of the surface of the as-prepared and used electrode (IrOx/bTNTs) were observed, indicating the stability of both the substrate (bTNT) and the catalyst (IrOx) that ensures sustained conductivity and catalytic activity, respectively. This is also confirmed by the SEM micrographs of the sample, shown in Figure 9 below, whereby the morphology of the sample has not been changed when compared to that before the experiment, shown in Figure 1d. (Close inspection of the high resolution image of Figure 9b infers the partial filling of the nanotubes by Ir particles).
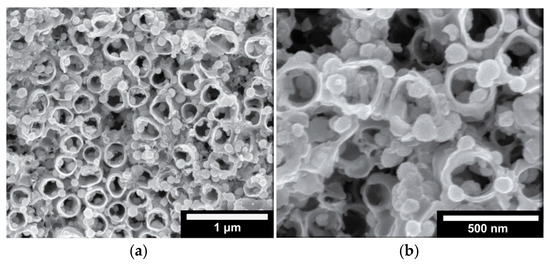
Figure 9.
SEM micrographs of an open-structure IrOx(Ni)/bTNT after 72 h of continuous operation at 10 mA cm−2 in 0.1 M HClO4 electrolyte, at two different magnifications (a) and (b) as indicated by the scale bars (1 μm and 500 nm, respectively).
3. Discussion
3.1. Catalytic Electrode Morphology
As can be seen from the SEM micrograph of Figure 1d, it is the combination of good electronic conductivity (bTNT substrate) and open structure (one-step anodization) that ensures the formation of well-dispersed IrO2 nanoparticles on top of and inside the mouth of the pores of such samples. In all other cases (close-packed bTNTs and TNTs), a densely populated surface or a continuous IrO2 film is formed (Figure 1c and Figure 2a, respectively). In the former case, the open structure ensures solution contact with the entire substrate surface, hence facilitating the dissolution of pre-deposited Ni from all locations and the concurrent Ir deposition onto multiple conducting bTNT sites (during the galvanic replacement step). In the latter cases, the closed structure dictates Ni replacement preferentially on the surface of the substrate where it comes into contact with the Ir replacement solution. This interpretation is further supported by the fact that complete Ni dissolution was confirmed both by EDS, XPS, and ICP-MS experiments in the case of the open-structure bTNT substrates.
3.2. Catalytic Electrode Performance
As can be seen in Figure 6a OER catalytic activity per substrate (nominal-projected) geometric electrode area follows the trend: IrO2/bTNT > IrO2(Ni)/bTNT > IrO2(Ni)/TNT. This trend is due to a combination of surface area, intrinsic catalytic activity and mass transfer effects. Indeed, the same trend can be confirmed for catalyst dispersion/roughness by the corresponding SEM images of Figure 1 and Figure 2, as well as by the electroactive surface area itself, as estimated by the surface voltammetry shown in Figure 4 and Figure 5.
Normalizing for/removing the simple effect of surface area variation (Figure 6b) the trend remains the same and coincides with a decrease in Ni content/increase in direct IrO2-bTNT interactions. It seems, therefore, that these IrO2-bTNT interactions are more favorable to OER than those already reported for IrO2-Ni [63,65,67,86]. As stated in [60] and reported in references therein, bTNTs prepared via solid state reduction by CaH2 are characterized by the presence of neutral oxygen vacancies (with both the positive charge and electron polarons located at nearby Ti sites). These vacancies could act as sinks for O atoms of the IrOx network destabilizing/activating the Ir-O-Ir bonds [86], a prerequisite of both the cation- and anion-type of mechanisms proposed for OER at IrO2 [91].
As far as mass transfer effects are concerned (expected to intervene at potentials higher than those of pure kinetic control, i.e., the ones within the potential range of the Tafel plots of the inset of Figure 6a, these are also expected to diminish as one moves from a film to a particulate and finally to a catalyst-decorated electrode, since oxygen bubbles formed during OER at various locations are less likely to coalesce and form a mass transfer barrier to reacting H2O. Indeed, the LSV curves corresponding to the IrO2(Ni)/TNT electrode (Figure 6) show clear signs of the onset of a current plateau at the more positive potential values studied, which is characteristic of mass-transfer limitations.
When it comes to comparison with external standards, the best performing electrode of this work (open-structure IrO2/bTNT) is estimated to show an overpotential of η = 240 mV at 10 mA cm−2 and current densities of 70 mA cm−2 and 258 mA mgIr−1 at η = 300 mV. These values are comparable or better than similar electrodes reported in the literature (see Table 2).
Table 2.
Comparison of the area and mass specific activity towards OER of electrodes prepared in this work with similar electrodes reported in the literature.
As far as the EIS results are concerned, the existence of two semi-circles for the open-structure IrO2/bTNT electrodes (unlike film IrO2 or polymer-embedded IrO2 particle electrodes that give rise to a single, deformed semicircle [85]) is indicative for the existence of two types of porosity of different scales in our samples, one of the TNT-supported IrO2 and that of the porous 3D IrO2 itself that has not been previously reported. RctCdl values (bearing units of a time constant and being representative-in a reverse manner-of intrinsic catalytic activity [85]) have been estimated to be in the 178–71 Ω mF (ms) range, which translates to TOF values of 5.62–14.08 s−1 for potentials in the +1.50–+1.55 VRHE range. These TOF values are higher than the ones reported for anodically grown IrO2/Ir (0.4–0.286 s−1) [85] and IrOx(Ni)/GC electrodes prepared by galvanic replacement (0.496 s−1) [65], and comparable or better than those for IrOx(Ni)/Ti (11.48 s−1 [15]), confirming again the beneficial effect of the bTNT (and, to a smaller extent, of the TNT) substrate in enhancing the catalytic activity of IrO2 towards OER.
Finally, any reservations regarding the stability of the reduced bTNT support (that had to be used for best catalytic activity instead of TNTs) at the high anodic potentials of OER should be attenuated following the 72 h stable operation of these electrodes under OER in acidic conditions and the unchanged chemical states of both Ti and Ir, as confirmed by the XPS data of Figure 3.
4. Materials and Methods
4.1. Preparation of IrO2 Catalysts Supported on TNTs and bTNTs
4.1.1. Preparation of Open-Structure and Close-Packed TNTs and bTNTs Substates
A Ti foil (0.25 mm thick, 99.5%, Thermo Fisher Scientific, Waltham, MA, USA) was cut into 1 cm × 1 cm squares and was sonicated for 10 min in acetone, ethanol, and doubly distilled (d.d.) H2O, to remove surface contaminants. After sonication, the Ti foil was left to dry in air before further use. The anodization took place in a one compartment cell, with Pt foil (2.5 cm × 1.3 cm) as the counter electrode/cathode, which was placed 2 cm away from the working electrode/anode (Ti foil). By applying 60 V through a DC power supply (Model DP60-15H, DSC Electronics, Bonn, Germany) in one anodization step for 120 min in glycerol solution (≥99.0%, Sigma Aldrich, Burlington, MA, USA) containing 0.5%wt NH4F (analytical grade, Sigma Aldrich), 10%wt d.d. H2O, we were able to obtain open-structure TNTs (ca 2 μm long) [73]. The close-packed TNTs were fabricated in two anodization steps by applying 60 V for 30 min + 90 min in ethylene glycol solution (analytical grade, Sigma Aldrich), containing 0.25wt% NH4F and 2wt% d.d. H2O [95] (resulting in 10 ± 2 μm long nanotubes). After the first anodization step, scotch tape was used to remove the nanotube film, and the patterned Ti foil was sonicated for 10 min in ethanol and left to dry before the second step. Throughout the experiment, the temperature was kept at 25 °C using a thermostat. To enhance the adhesion of the nanotubes to the Ti foil, the electrodes were kept in the anodization solution for 1 h [46]. The as-prepared TNT/Ti foils were annealed at 500 °C for 2 h in a muffle furnace with a heating rate of 1.7 °C min−1 to obtain TNTs with anatase structure. In the case of bTNTs, the substrate was annealed under the same heating conditions but in a sealed quartz ampoule in direct contact with CaH2 (CaH2 ≥ 97.0% powder, Sigma Aldrich), which resulted in the preparation of metallic-like conductive bTNTs [47,96].
4.1.2. Preparation of IrOx(Ni)/TNTs and bTNTs
Initially, galvanostatic electrodeposition of Ni took place, in a one-unit cell in a Watt’s type of bath (30 g NiSO4•6H2O, 2.8 g NiCl2•6H2O, 4 g H3BO3 in 100 mL d.d. H2O), with Pt as the auxiliary electrode and saturated calomel electrode (SCE) as the reference electrode. The applied current density was equal to −5 mA cm−2 for close-packed TNTs, −3.7 mA cm−2 for close-packed bTNTs and −2 mA cm−2 for open-structure bTNTs, and it was selected based on the results of preliminary cyclic voltammetry (CV) scans to ensure Ni deposition occurred within the kinetic region/charge transfer control regime. The total charge density of the electrodeposited Ni was equal to 34–36 mC cm−2 for bTNTs and 29.2 C cm−2 for TNTs (with an expected 100% current efficiency for this type of Watts bath) and the temperature was held at 25 °C (bTNTs) and at 55 °C (TNTs) with constant magnetic stirring. The near thousand-fold higher charge density of electrodeposited Ni on the semiconducting TNTs was employed to achieve Ni penetration through the porous TNT substrate and down to its more conducting thin oxide/metal Ti base. In contrast to bTNTs, whereby nanotubes show good electronic conductivity along the nanotube walls, filling/partial filling of the pores of TNTs is essential to ensure electronic conductivity between the IrO2-decorated electrode surface and the Ti base current collector (with Ti at the bottom of the TNTs expected to possess higher conductivity due to a thinner surface oxide layer). Figure S1 of the Supplementary Material presents a SEM top-view micrograph of the bottom part of a Ni/TNT film (originally in contact with its Ti base), detached from a Ni/TNT/Ti electrode. It can be seen that deposited Ni at the bottom of TNTs follows the size and well-ordered pattern of the TNT matrix grown on the Ti basis, thus confirming that the filling of those TNTs starts from the TNT/Ti interface. This is in line with what has been reported for other annealed TNTs [97] and electrochemically treated amorphous TNTs [98].
Immediately following Ni deposition, the Ni/TNTs and Ni/bTNTs electrodes were immersed in a freshly prepared deaerated exchange solution (pH ≈ 3), consisting of 1 mM HCl + 1 mM K2IrCl6 (≥99.9% trace metal basis, Sigma Aldrich) for 15 min at 65 °C, for the galvanic replacement of Ni particles or layers by Ir. During galvanic replacement, metallic Ni is oxidized and dissolves as Ni2+ in the solution while Ir4+ is reduced to metallic Ir on the substrate surface (by electron uptake at Ni or conducting bTNT sites; Equation (2)), due to the positive difference in the standard reduction potentials of the Ir(IV)/Ir(III) (E0 = +0.86 V vs. SHE) and Ni(II)/Ni (E0 = –0.257 V vs. SHE) redox couples [62].
xNi + IrCl62– → Ir(x − 2)Ni + 2Ni2+ + 6Cl–
Finally, electrochemical anodization of metallic Ir was conducted by means of potential cycling with CV in 0.1 M HClO4 (70%, Merck, Darmstadt, Germany), in the potential range between H2/O2 evolution, to form porous IrOx and dissolve any surface Ni not covered by Ir [15]. A three-electrode cell was used for this purpose, with Pt as the counter and SCE as the reference electrode.
4.2. Electrochemical Setup and Procedures
The electrochemical characterization of the as-prepared electrodes was conducted in a three-electrode cell, with Pt as the counter electrode and SCE as the reference electrode, which were separated from the working electrode by porous glass frits, to facilitate ionic conductivity in the bulk electrolyte solution. Cyclic and linear sweep voltammograms as well as EIS spectra were recorded with the help of an Autolab PGSTAT302N (Eco Chemie, Utrecht, The Netherlands) workstation, controlled via NOVA 1.11.2 software (Eco Chemie, Utrecht, The Netherlands). All electrochemical processes were carried out at room temperature.
CV was employed to investigate the surface electrochemistry of the catalysts, using consecutive scans in three potential ranges at a scan rate of 50 mV s−1 in 0.1 M HClO4 until stable voltammetry was recorded. The first range (−0.3 V to +0.3 VSCE) targeted the dissolution of unreacted Ni and the formation of an Ir(Ni) core–shell structure [65]. The electrode was transferred in a fresh deaerated 0.1 M HClO4 solution and scanned again. In the second range (−0.3 V to +0.9 VSCE), the formation of reversible Ir(III)/Ir(IV) oxides/hydroxides occurred, while in the third range (+0.3 V to +1.2 VSCE), anodization of Ir to higher oxidation states (Ir(IV) and Ir(V)) formed a stable, porous 3D-IrOx structure [79,80,81].
Electrocatalytic activity towards the OER was evaluated using linear sweep voltammetry (LSV) at a potential sweep rate of 5 mV s−1 between +0.9 V and +1.4 VSCE. The current interrupt method was applied at 100 mV intervals in the +0.9 to +1.3 VSCE potential range, during the potential scan, to estimate uncompensated resistance and correct the applied potential for ohmic losses. Chronopotentiometry was used to assess the stability of the electrodes for the OER by applying a constant current of 10 mA cm−2 for 72 h.
Finally, EIS measurements were carried out to verify the value of the solution resistance (Rs) that was previously determined using the current interrupt technique during the LSV, and to calculate both the charge transfer resistance (Rct), characteristic of OER activity, and the double-layer capacitance (Cdl), which is representative of the electroactive surface of the catalyst. EIS studies were conducted in the frequency range between 6 kHz and 0.1 Hz at DC potential values of +1.20 and +1.25 VSCE, recording the current response at an AC voltage amplitude of 10 mV. To find the equivalent circuit and determine values for the associated components, the NOVA 2.1 software was used.
The potential values reported are converted to the reversible hydrogen electrode (RHE) using the equation
ERHE = ESCE + 0.244 + (0.059 × pH)
The equilibrium potential for the oxygen evolution reaction in 0.1 M HClO4 at room temperature is calculated as +0.927 VSCE.
4.3. Microscopic and Spectroscopic Characterization
The as-prepared TNTs and their modified bTNTs analogues were observed with Field-Emission Scanning Electron Microscopy (FESEM, JSM-7610F PLUS, JEOL Ltd., Akishima, Japan) supported by an Energy Dispersive X-ray Spectroscopy system (EDS, Oxford, Instruments Ltd., Oxford, UK), to obtain information about the morphology and the relative composition of the samples. Poorly conducting TNT samples were carbon-sputtered before measurements, while conducting bTNT samples were pictured as-prepared. In order to determine the quantity of deposited Ir supported on the best performing open-structure bTNTs, trace metal analysis was carried out with Inductively Coupled Plasma-Mass Spectroscopy (ICP-MS). The electrode was dissolved in boiling aqua regia (37% HCl, ChemLab; 65% HNO3, Merck) for 20 min and after reaching room temperature, the leachate was diluted in 2% v/v HNO3. The analysis was conducted by a Thermo Scientific iCAP Q ICP-MS, controlled via Q Tegra software (version 2.14.5122.158, Thermo Scientific). In addition, X-ray Photoelectron Spectroscopy (XPS) analysis was conducted to assess the surface atomic composition and the analysis was performed in a Thermo Scientific Thetaprobe X-ray Photoelectron Spectrometer, with a monochromated Al-Ka1 X-ray beam (hν = 1486.6 eV) and an analysis area of approximately 400 µm diameter.
5. Conclusions
- Electrodeposition of sacrificial Ni on conducting bTNTs and its subsequent galvanic replacement by Ir resulted (depending on substrate type) in Ir particles (<100 nm) for open-structure bTNTs or in larger aggregates for close-packed, bTNTs; in the case of open-structure bTNTs, these particles were highly dispersed (some residing inside the nanotubes), thus increasing the electroactive area while at the same time retaining an open electrode structure.
- For the semiconducting TNTs, an increase in the charge of electrodeposited Ni was necessary to rectify their original low electrical conductivity and resulting in the filling of the nanotubes for Ni deposits to act also as a current collector. The eventual formation of a continuous Ir(Ni) film on the surface following galvanic replacement, resulted in a significant decrease in the electroactive surface area.
- The open-structure IrOx(Ni)/bTNTs (more precisely, IrOx/bTNTs since no Ni has been detected after the galvanic replacement/metal exhange process), exhibited an enhanced activity towards the OER. This can be attributed to the higher surface area of the support, higher Ir dispersion and catalytic activity (due to IrO2-bTNT interactions) as well as less pore clogging during O2 evolution. An overpotential of η = 240 mV at 10 mA cm−2 and a mass-specific current density of 258 mA mgIr−1 at η = 300 mV has been recorded, rendering them comparable or better than similar electrodes reported in the literature (in the 30–140 mA mgIr−1 range at η = 300 mV and in the η = 240–360 mV range at 10 mA cm−2 [54,58,92,93]). Furthermore, the optimized electrodes, when tested for prolonged periods of time under OER conditions, were characterized by good short-term (72 h) stability.
Supplementary Materials
The following supporting information can be downloaded at: https://www.mdpi.com/article/10.3390/molecules30142921/s1, Figure S1: SEM top-view micrograph of the bottom part of an as-prepared Ni/TNT film peeled off the Ti support, Figure S2: SEM cross-sectional view micrograph of an Ir/Ni/TNT film, Figure S3: EDS spectrum of the Ir/Ni/TNT film depicted in Figure 2 [99].
Author Contributions
Conceptualization, S.S.; methodology, A.T. and E.M.; formal analysis, A.T., E.M. and S.S.; investigation, A.T., E.M., P.C., M.N., E.P., D.A.L.; writing—original draft preparation, E.M.; writing—review and editing, E.M. and S.S.; supervision, S.S.; project administration, S.S.; funding acquisition, S.S. and A.T. All authors have read and agreed to the published version of the manuscript.
Funding
A.T. received financial support from the Hellenic Foundation for Research and Innovation (HFRI) under the 3rd Call for HFRI PhD Fellowships (Fellowship Number: 6431). This project was funded by the European Union HORIZON Research and Innovation Actions under grant agreement ID 101122323.
Institutional Review Board Statement
Not applicable.
Informed Consent Statement
Not applicable.
Data Availability Statement
The raw data supporting the conclusions of this article will be made available by the authors on request.
Acknowledgments
The authors thank Athanasios Chatzitakis for carrying out the stability testing and for valuable discussions and Xin Liu for black titania (bTNT) preparation (Department of Chemistry, Centre for Materials Science and Nanotechnology, University of Oslo, Gaustadalléen 21, NO-0349 Oslo, Norway); they also wish to thank Martin F. Sunding for carrying out the XPS measurements (SINTEF Industry, Forskningsveien 1, NO-0373 Oslo, Norway).
Conflicts of Interest
Author Patricia Carvahlo was employed by the company SINTEF. The remaining authors declare that the research was conducted in the absence of any commercial or financial relationships that could be construed as a potential conflict of interest.
Abbreviations
The following abbreviations are used in this manuscript:
| TNTs | Titania Nanotubes |
| bTNTS | Titania Black Nanotubes |
| CV | Cyclic Voltammogram/Voltammetry |
| LSV | Linear Sweep Voltammogram/Voltammetry |
| EIS | Electrochemical Impedance Spectroscopy |
| ICP-MS | Inductively Coupled Plasma Mass Spectrometry |
| SEM | Scanning Electron Microscopy |
| EDS | Energy Dispersive Spectroscopy |
| XPS | X-ray Photoelectron Spectroscopy |
References
- Duby, P. The History of Progress in Dimensionally Stable Anodes. JOM 1993, 45, 41–43. [Google Scholar] [CrossRef]
- Pavlović, M.G.; Dekanski, A. On the Use of Platinized and Activated Titanium Anodes in Some Electrodeposition Processes. J. Solid. State Electrochem. 1997, 1, 208–214. [Google Scholar] [CrossRef]
- Zhang, W.; Ghali, E.; Houlachi, G. Review of Oxide Coated Catalytic Titanium Anodes Performance for Metal Electrowinning. Hydrometallurgy 2017, 169, 456–467. [Google Scholar] [CrossRef]
- Choi, H.; Kim, O.H.; Kim, M.; Choe, H.; Cho, Y.H.; Sung, Y.E. Next-Generation Polymer-Electrolyte-Membrane Fuel Cells Using Titanium Foam as Gas Diffusion Layer. ACS Appl. Mater. Interfaces 2014, 6, 7665–7671. [Google Scholar] [CrossRef] [PubMed]
- Yasutake, M.; Kawachino, D.; Noda, Z.; Matsuda, J.; Lyth, S.M.; Ito, K.; Hayashi, A.; Sasaki, K. Catalyst-Integrated Gas Diffusion Electrodes for Polymer Electrolyte Membrane Water Electrolysis: Porous Titanium Sheets with Nanostructured TiO2 Surfaces Decorated with Ir Electrocatalysts. J. Electrochem. Soc. 2020, 167, 124523. [Google Scholar] [CrossRef]
- Xu, X.; Sun, H.; Jiang, S.P.; Shao, Z. Modulating Metal–Organic Frameworks for Catalyzing Acidic Oxygen Evolution for Proton Exchange Membrane Water Electrolysis. SusMat 2021, 1, 460–481. [Google Scholar] [CrossRef]
- Sun, H.; Xu, X.; Kim, H.; Jung, W.C.; Zhou, W.; Shao, Z. Electrochemical Water Splitting: Bridging the Gaps Between Fundamental Research and Industrial Applications. Energy Environ. Mater. 2023, 6, e12441. [Google Scholar] [CrossRef]
- Cherevko, S.; Geiger, S.; Kasian, O.; Kulyk, N.; Grote, J.-P.; Savan, A.; Shrestha, B.R.; Merzlikin, S.; Breitbach, B.; Ludwig, A.; et al. Oxygen and Hydrogen Evolution Reactions on Ru, RuO2, Ir, and IrO2 Thin Film Electrodes in Acidic and Alkaline Electrolytes: A Comparative Study on Activity and Stability. Catal. Today 2016, 262, 170–180. [Google Scholar] [CrossRef]
- Alia, S.M.; Rasimick, B.; Ngo, C.; Neyerlin, K.C.; Kocha, S.S.; Pylypenko, S.; Xu, H.; Pivovar, B.S. Activity and Durability of Iridium Nanoparticles in the Oxygen Evolution Reaction. J. Electrochem. Soc. 2016, 163, F3105–F3112. [Google Scholar] [CrossRef]
- Liang, Q.; Brocks, G.; Bieberle-Hütter, A. Oxygen Evolution Reaction (OER) Mechanism under Alkaline and Acidic Conditions. J. Physics Energy 2021, 3, 026001. [Google Scholar] [CrossRef]
- Ledendecker, M.; Geiger, S.; Hengge, K.; Lim, J.; Cherevko, S.; Mingers, A.M.; Göhl, D.; Fortunato, G.V.; Jalalpoor, D.; Schüth, F.; et al. Towards Maximized Utilization of Iridium for the Acidic Oxygen Evolution Reaction. Nano Res. 2019, 12, 2275–2280. [Google Scholar] [CrossRef]
- Oh, H.S.; Nong, H.N.; Reier, T.; Bergmann, A.; Gliech, M.; Ferreira De Araújo, J.; Willinger, E.; Schlögl, R.; Teschner, D.; Strasser, P. Electrochemical Catalyst-Support Effects and Their Stabilizing Role for IrOx Nanoparticle Catalysts during the Oxygen Evolution Reaction. J. Am. Chem. Soc. 2016, 138, 12552–12563. [Google Scholar] [CrossRef]
- Reier, T.; Teschner, D.; Lunkenbein, T.; Bergmann, A.; Selve, S.; Kraehnert, R.; Schlögl, R.; Strasser, P. Electrocatalytic Oxygen Evolution on Iridium Oxide: Uncovering Catalyst-Substrate Interactions and Active Iridium Oxide Species. J. Electrochem. Soc. 2014, 161, F876–F882. [Google Scholar] [CrossRef]
- Yu, S.; Xie, Z.; Li, K.; Ding, L.; Wang, W.; Yang, G.; Zhang, F.Y. Morphology Engineering of Iridium Electrodes via Modifying Titanium Substrates with Controllable Pillar Structures for Highly Efficient Oxygen Evolution Reaction. Electrochim. Acta 2022, 405, 139797. [Google Scholar] [CrossRef]
- Touni, A.; Grammenos, O.A.; Banti, A.; Karfaridis, D.; Prochaska, C.; Lambropoulou, D.; Pavlidou, E.; Sotiropoulos, S. Iridium Oxide-Nickel-Coated Titanium Anodes for the Oxygen Evolution Reaction. Electrochim. Acta 2021, 390, 138866. [Google Scholar] [CrossRef]
- Kariman, A.; Marshall, A.T. Improving the Stability of DSA Electrodes by the Addition of TiO2 Nanoparticles. J. Electrochem. Soc. 2019, 166, E248–E251. [Google Scholar] [CrossRef]
- Oakton, E.; Lebedev, D.; Povia, M.; Abbott, D.F.; Fabbri, E.; Fedorov, A.; Nachtegaal, M.; Copéret, C.; Schmidt, T.J. IrO2-TiO2: A High-Surface-Area, Active, and Stable Electrocatalyst for the Oxygen Evolution Reaction. ACS Catal. 2017, 7, 2346–2352. [Google Scholar] [CrossRef]
- Reier, T.; Weidinger, I.; Hildebrandt, P.; Kraehnert, R.; Strasser, P. Electrocatalytic Oxygen Evolution Reaction on Iridium Oxide Model Film Catalysts: Influence of Oxide Type and Catalyst Substrate Interactions. ECS Trans. 2013, 58, 39–51. [Google Scholar] [CrossRef]
- Banti, A.; Zafeiridou, C.; Charalampakis, M.; Spyridou, O.N.; Georgieva, J.S.; Binas, V.D.; Mitrousi, E.; Sotiropoulos, S. IrO2 Oxygen Evolution Catalysts Prepared by an Optimized Photodeposition Process on TiO2 Substrates. Molecules 2024, 29, 2392. [Google Scholar] [CrossRef]
- Bagheri, S.; Muhd Julkapli, N.; Bee Abd Hamid, S. Titanium Dioxide as a Catalyst Support in Heterogeneous Catalysis. Sci. World J. 2014, 2014, 727496. [Google Scholar] [CrossRef]
- Hamad, S.; Catlow, C.R.A.; Woodley, S.M.; Lago, S.; Mejías, J.A. Structure and Stability of Small TiO2 Nanoparticles. J. Phys. Chem. B 2005, 109, 15741–15748. [Google Scholar] [CrossRef]
- Zhao, Y.; Li, C.; Liu, X.; Gu, F.; Jiang, H.; Shao, W.; Zhang, L.; He, Y. Synthesis and Optical Properties of TiO2 Nanoparticles. Mater. Lett. 2007, 61, 79–83. [Google Scholar] [CrossRef]
- Viana, M.M.; Soares, V.F.; Mohallem, N.D.S. Synthesis and Characterization of TiO2 Nanoparticles. Ceram. Int. 2010, 36, 2047–2053. [Google Scholar] [CrossRef]
- Jitputti, J.; Suzuki, Y.; Yoshikawa, S. Synthesis of TiO2 Nanowires and Their Photocatalytic Activity for Hydrogen Evolution. Catal. Commun. 2008, 9, 1265–1271. [Google Scholar] [CrossRef]
- Wang, G.; Wang, H.; Ling, Y.; Tang, Y.; Yang, X.; Fitzmorris, R.C.; Wang, C.; Zhang, J.Z.; Li, Y. Hydrogen-Treated TiO2 Nanowire Arrays for Photoelectrochemical Water Splitting. Nano Lett. 2011, 11, 3026–3033. [Google Scholar] [CrossRef]
- Chuangchote, S.; Jitputti, J.; Sagawa, T.; Yoshikawa, S. Photocatalytic Activity for Hydrogen Evolution of Electrospun TiO2 Nanofibers. ACS Appl. Mater. Interfaces 2009, 1, 1140–1143. [Google Scholar] [CrossRef] [PubMed]
- Song, J.; Guan, R.; Xie, M.; Dong, P.; Yang, X.; Zhang, J. Advances in Electrospun TiO2 Nanofibers: Design, Construction, and Applications. Chem. Eng. J. 2022, 431, 134343. [Google Scholar] [CrossRef]
- Chen, F.; Fang, P.; Liu, Z.; Gao, Y.; Liu, Y.; Dai, Y.; Luo, H.; Feng, J. Dimensionality-Dependent Photocatalytic Activity of TiO2-Based Nanostructures: Nanosheets with a Superior Catalytic Property. J. Mater. Sci. 2013, 48, 5171–5179. [Google Scholar] [CrossRef]
- Yu, J.; Fan, J.; Lv, K. Anatase TiO2 Nanosheets with Exposed (001) Facets: Improved Photoelectric Conversion Efficiency in Dye-Sensitized Solar Cells. Nanoscale 2010, 2, 2144–2149. [Google Scholar] [CrossRef]
- Fleischer, C.; Chatzitakis, A.; Norby, T. Intrinsic Photoelectrocatalytic Activity in Oriented, Photonic TiO2 Nanotubes. Mater. Sci. Semicond. Process. 2018, 88, 186–191. [Google Scholar] [CrossRef]
- Macak, J.M.; Tsuchiya, H.; Ghicov, A.; Yasuda, K.; Hahn, R.; Bauer, S.; Schmuki, P. TiO2 Nanotubes: Self-Organized Electrochemical Formation, Properties and Applications. Curr. Opin. Solid. State Mater. Sci. 2007, 11, 3–18. [Google Scholar] [CrossRef]
- Roy, P.; Berger, S.; Schmuki, P. TiO2 Nanotubes: Synthesis and Applications. Angew. Chem. Int. Ed. 2011, 50, 2904–2939. [Google Scholar] [CrossRef] [PubMed]
- Mor, G.K.; Varghese, O.K.; Paulose, M.; Shankar, K.; Grimes, C.A. A Review on Highly Ordered, Vertically Oriented TiO2 Nanotube Arrays: Fabrication, Material Properties, and Solar Energy Applications. Sol. Energy Mater. Sol. Cells 2006, 90, 2011–2075. [Google Scholar] [CrossRef]
- Smith, Y.R.; Ray, R.S.; Carlson, K.; Sarma, B.; Misra, M. Self-Ordered Titanium Dioxide Nanotube Arrays: Anodic Synthesis and Their Photo/Electro-Catalytic Applications. Materials 2013, 6, 2892–2957. [Google Scholar] [CrossRef]
- Tighineanu, A.; Albu, S.P.; Schmuki, P. Conductivity of Anodic TiO2 Nanotubes: Influence of Annealing Conditions. Phys. Status Solidi-Rapid Res. Lett. 2014, 8, 158–162. [Google Scholar] [CrossRef]
- Nah, Y.C.; Paramasivam, I.; Schmuki, P. Doped TiO2 and TiO2 Nanotubes: Synthesis and Applications. ChemPhysChem 2010, 11, 2698–2713. [Google Scholar] [CrossRef]
- Lu, X.; Wang, G.; Zhai, T.; Yu, M.; Gan, J.; Tong, Y.; Li, Y. Hydrogenated TiO2 Nanotube Arrays for Supercapacitors. Nano Lett. 2012, 12, 1690–1696. [Google Scholar] [CrossRef] [PubMed]
- Naldoni, A.; Allieta, M.; Santangelo, S.; Marelli, M.; Fabbri, F.; Cappelli, S.; Bianchi, C.L.; Psaro, R.; Dal Santo, V. Effect of Nature and Location of Defects on Bandgap Narrowing in Black TiO2 Nanoparticles. J. Am. Chem. Soc. 2012, 134, 7600–7603. [Google Scholar] [CrossRef]
- Li, S.; Qiu, J.; Ling, M.; Peng, F.; Wood, B.; Zhang, S. Photoelectrochemical Characterization of Hydrogenated TiO2 Nanotubes as Photoanodes for Sensing Applications. ACS Appl. Mater. Interfaces 2013, 5, 11129–11135. [Google Scholar] [CrossRef]
- Malik, H.; Barrera, K.; Mohanty, S.; Carlson, K. Enhancing Electrochemical Properties of TiO2 Nanotubes via Engineered Defect Laden Crystal Structures. Mater. Lett. 2020, 273, 127956. [Google Scholar] [CrossRef]
- Wu, H.; Xu, C.; Xu, J.; Lu, L.; Fan, Z.; Chen, X.; Song, Y.; Li, D. Enhanced Supercapacitance in Anodic TiO2 Nanotube Films by Hydrogen Plasma Treatment. Nanotechnology 2013, 24, 455401. [Google Scholar] [CrossRef] [PubMed]
- Siuzdak, K.; Szkoda, M.; Lisowska-Oleksiak, A.; Karczewski, J.; Ryl, J. Highly Stable Organic-Inorganic Junction Composed of Hydrogenated Titania Nanotubes Infiltrated by a Conducting Polymer. RSC Adv. 2016, 6, 33101–33110. [Google Scholar] [CrossRef]
- Li, H.; Chen, J.; Xia, Z.; Xing, J. Microwave-Assisted Preparation of Self-Doped TiO2 Nanotube Arrays for Enhanced Photoelectrochemical Water Splitting. J. Mater. Chem. A Mater. 2015, 3, 699–705. [Google Scholar] [CrossRef]
- Andronic, L.; Enesca, A. Black TiO2 Synthesis by Chemical Reduction Methods for Photocatalysis Applications. Front Chem 2020, 8, 565489. [Google Scholar] [CrossRef]
- Kang, Q.; Cao, J.; Zhang, Y.; Liu, L.; Xu, H.; Ye, J. Reduced TiO2 Nanotube Arrays for Photoelectrochemical Water Splitting. J. Mater. Chem. A Mater. 2013, 1, 5766–5774. [Google Scholar] [CrossRef]
- Liu, X.; Carvalho, P.; Getz, M.N.; Norby, T.; Chatzitakis, A. Black Anatase TiO2 Nanotubes with Tunable Orientation for High Performance Supercapacitors. J. Phys. Chem. C 2019, 123, 21931–21940. [Google Scholar] [CrossRef]
- Touni, A.; Liu, X.; Kang, X.; Papoulia, C.; Pavlidou, E.; Lambropoulou, D.; Tsampas, M.N.; Chatzitakis, A.; Sotiropoulos, S. Methanol Oxidation at Platinum Coated Black Titania Nanotubes and Titanium Felt Electrodes. Molecules 2022, 27, 6382. [Google Scholar] [CrossRef] [PubMed]
- Xu, C.; Song, Y.; Lu, L.; Cheng, C.; Liu, D.; Fang, X.; Chen, X.; Zhu, X.; Li, D. Electrochemically Hydrogenated TiO2 Nanotubes with Improved Photoelectrochemical Water Splitting Performance. Nanoscale Res. Lett. 2013, 8, 391. [Google Scholar] [CrossRef]
- Fabregat-Santiago, F.; Barea, E.M.; Bisquert, J.; Mor, G.K.; Shankar, K.; Grimes, C.A. High Carrier Density and Capacitance in TiO2 Nanotube Arrays Induced by Electrochemical Doping. J. Am. Chem. Soc. 2008, 130, 11312–11316. [Google Scholar] [CrossRef]
- Zhou, H.; Zhang, Y. Electrochemically Self-Doped TiO2 Nanotube Arrays for Supercapacitors. J. Phys. Chem. C 2014, 118, 5626–5636. [Google Scholar] [CrossRef]
- Zhang, Z.; Hedhili, M.N.; Zhu, H.; Wang, P. Electrochemical Reduction Induced Self-Doping of Ti3+ for Efficient Water Splitting Performance on TiO2 Based Photoelectrodes. Phys. Chem. Chem. Phys. 2013, 15, 15637–15644. [Google Scholar] [CrossRef] [PubMed]
- Dehkordi, H.B.; Zhiani, M.A. Novel Ir–Ru-Based Nanoparticle Supported on Ordered Electrochemically Synthesized TiO2-Nanotube as a Highly Active and Stable Oxygen Evolution Reaction Catalyst for Water Splitting in Acidic Media. Int. J. Hydrogen Energy 2023, 48, 33042–33061. [Google Scholar] [CrossRef]
- Genova-Koleva, R.V.; Alcaide, F.; Álvarez, G.; Cabot, P.L.; Grande, H.J.; Martínez-Huerta, M.V.; Miguel, O. Supporting IrO2 and IrRuOx Nanoparticles on TiO2 and Nb-Doped TiO2 Nanotubes as Electrocatalysts for the Oxygen Evolution Reaction. J. Energy Chem. 2019, 34, 227–239. [Google Scholar] [CrossRef]
- Lu, Z.X.; Shi, Y.; Yan, C.F.; Guo, C.Q.; Wang, Z. Da Investigation on IrO2 Supported on Hydrogenated TiO2 Nanotube Array as OER Electro-Catalyst for Water Electrolysis. Int. J. Hydrogen Energy 2017, 42, 3572–3578. [Google Scholar] [CrossRef]
- Bele, M.; Jovanovič, P.; Marinko, Ž.; Drev, S.; Simon Šelih, V.; Kovač, J.; Gaberšček, M.; Koderman Podboršek, G.; Dražić, G.; Hodnik, N.; et al. Increasing the Oxygen Evolution Reaction Performance of Nanotubular Titanium Oxynitride Supported Ir Nanoparticles by Strong Metal-Support Interaction. ACS Catal. 2020, 10, 13688–13700. [Google Scholar] [CrossRef]
- Koderman Podborsek, G.; Suhadolnik, L.; Loncar, A.; Bele, M.; Hrnjic, A.; Marinko, Z.; Kovac, J.; Kokalj, A.; Gasparic, L.; Surca, A.K.; et al. Iridium Stabilizes Ceramic Titanium Oxynitride Support for Oxygen Evolution Reaction. ACS Catal. 2022, 12, 15135–15145. [Google Scholar] [CrossRef] [PubMed]
- Zhou, X.; Hwang, I.; Tomanec, O.; Fehn, D.; Mazare, A.; Zboril, R.; Meyer, K.; Schmuki, P. Advanced Photocatalysts: Pinning Single Atom Co-Catalysts on Titania Nanotubes. Adv. Funct. Mater. 2021, 31, 2102843. [Google Scholar] [CrossRef]
- Schlicht, S.; Büttner, P.; Bachmann, J. Highly Active Ir/TiO2 Electrodes for the Oxygen Evolution Reaction Using Atomic Layer Deposition on Ordered Porous Substrates. ACS Appl. Energy Mater. 2019, 2, 2344–2349. [Google Scholar] [CrossRef]
- Lačnjevac, U.; Vasilić, R.; Dobrota, A.; Đurđić, S.; Tomanec, O.; Zbořil, R.; Mohajernia, S.; Nguyen, N.T.; Skorodumova, N.; Manojlović, D.; et al. High-Performance Hydrogen Evolution Electrocatalysis Using Proton-Intercalated TiO2 nanotube Arrays as Interactive Supports for Ir Nanoparticles. J. Mater. Chem. A Mater. 2020, 8, 22773–22790. [Google Scholar] [CrossRef]
- Touni, A.; Liu, X.; Kang, X.; Carvalho, P.A.; Diplas, S.; Both, K.G.; Sotiropoulos, S.; Chatzitakis, A. Galvanic Deposition of Pt Nanoparticles on Black TiO2 Nanotubes for Hydrogen Evolving Cathodes. ChemSusChem 2021, 14, 4993–5003. [Google Scholar] [CrossRef]
- Hou, X.; Li, Y.; Zhang, H.; Lund, P.D.; Kwan, J.; Tsang, S.C.E. Black Titanium Oxide: Synthesis, Modification, Characterization, Physiochemical Properties, and Emerging Applications for Energy Conversion and Storage, and Environmental Sustainability. Chem. Soc. Rev. 2024, 53, 10660–10708. [Google Scholar] [CrossRef] [PubMed]
- Papaderakis, A.; Mintsouli, I.; Georgieva, J.; Sotiropoulos, S. Electrocatalysts Prepared by Galvanic Replacement. Catalysts 2017, 7, 80. [Google Scholar] [CrossRef]
- Touni, A.; Papaderakis, A.; Karfaridis, D.; Vourlias, G.; Sotiropoulos, S. Oxygen Evolution Reaction at IrO2/Ir(Ni) Film Electrodes Prepared by Galvanic Replacement and Anodization: Effect of Precursor Ni Film Thickness. Molecules 2019, 24, 2095. [Google Scholar] [CrossRef]
- Papaderakis, A.; Pliatsikas, N.; Patsalas, P.; Tsiplakides, D.; Balomenou, S.; Touni, A.; Sotiropoulos, S. Hydrogen Evolution at Ir-Ni Bimetallic Deposits Prepared by Galvanic Replacement. J. Electroanal. Chem. 2018, 808, 21–27. [Google Scholar] [CrossRef]
- Papaderakis, A.; Pliatsikas, N.; Prochaska, C.; Vourlias, G.; Patsalas, P.; Tsiplakides, D.; Balomenou, S.; Sotiropoulos, S. Oxygen Evolution at IrO2 Shell-Ir-Ni Core Electrodes Prepared by Galvanic Replacement. J. Phys. Chem. C 2016, 120, 19995–20005. [Google Scholar] [CrossRef]
- Papaderakis, A.; Pliatsikas, N.; Prochaska, C.; Papazisi, K.M.; Balomenou, S.P.; Tsiplakides, D.; Patsalas, P.; Sotiropoulos, S. Ternary Pt-Ru-Ni Catalytic Layers for Methanol Electrooxidation Prepared by Electrodeposition and Galvanic Replacement. Front. Chem. 2014, 2, 29. [Google Scholar] [CrossRef] [PubMed]
- Papaderakis, A.; Matouli, I.; Spyridou, O.N.; Grammenos, A.O.; Banti, A.; Touni, A.; Pliatsikas, N.; Patsalas, P.; Sotiropoulos, S. Ternary IrO2-Pt-Ni Deposits Prepared by Galvanic Replacement as Bifunctional Oxygen Catalysts. J. Electroanal. Chem. 2020, 877, 114499. [Google Scholar] [CrossRef]
- Getz, M.N.; Chatzitakis, A.; Liu, X.; Carvalho, P.A.; Bjørheim, T.S.; Norby, T. Voids in Walls of Mesoporous TiO2 Anatase Nanotubes by Controlled Formation and Annihilation of Protonated Titanium Vacancies. Mater. Chem. Phys. 2020, 239, 121953. [Google Scholar] [CrossRef]
- Yan, S.; Chen, Y.; Wang, Z.; Han, A.; Shan, Z.; Yang, X.; Zhu, X. Essential Distinction between One-Step Anodization and Two-Step Anodization of Ti. Mater. Res. Bull. 2017, 95, 444–450. [Google Scholar] [CrossRef]
- Zeng, H.; Li, C.; Dan, Y.; Lu, Y.; Sun, W.; Zhang, S.; Song, Y. A Comparative Study of Two-Step Anodization with One-Step Anodization at Constant Voltage. Nanotechnology 2023, 34, 065603. [Google Scholar] [CrossRef]
- Kowalski, D.; Kim, D.; Schmuki, P. TiO2 Nanotubes, Nanochannels and Mesosponge: Self-Organized Formation and Applications. Nano Today 2013, 8, 235–264. [Google Scholar] [CrossRef]
- Valota, A.; LeClere, D.J.; Skeldon, P.; Curioni, M.; Hashimoto, T.; Berger, S.; Kunze, J.; Schmuki, P.; Thompson, G.E. Influence of Water Content on Nanotubular Anodic Titania Formed in Fluoride/Glycerol Electrolytes. Electrochim. Acta 2009, 54, 4321–4327. [Google Scholar] [CrossRef]
- Chatzitakis, A.; Papaderakis, A.; Karanasios, N.; Georgieva, J.; Pavlidou, E.; Litsardakis, G.; Poulios, I.; Sotiropoulos, S. Comparison of the Photoelectrochemical Performance of Particulate and Nanotube TiO2 Photoanodes. Catal. Today 2017, 280, 14–20. [Google Scholar] [CrossRef]
- Pfeifer, V.; Jones, T.E.; Velasco Vélez, J.J.; Massué, C.; Arrigo, R.; Teschner, D.; Girgsdies, F.; Scherzer, M.; Greiner, M.T.; Allan, J.; et al. The Electronic Structure of Iridium and Its Oxides. Surf. Interface Anal. 2016, 48, 261–273. [Google Scholar] [CrossRef]
- Freakley, S.J.; Ruiz-Esquius, J.; Morgan, D.J. The X-Ray Photoelectron Spectra of Ir, IrO2 and IrCl3 Revisited. Surf. Interface Anal. 2017, 49, 794–799. [Google Scholar] [CrossRef]
- Tegou, A.; Armyanov, S.; Valova, E.; Steenhaut, O.; Hubin, A.; Kokkinidis, G.; Sotiropoulos, S. Mixed Platinum-Gold Electrocatalysts for Borohydride Oxidation Prepared by the Galvanic Replacement of Nickel Deposits. J. Electroanal. Chem. 2009, 634, 104–110. [Google Scholar] [CrossRef]
- Mozota, J.; Conway, B.E. Modification of Apparent Electrocatalysis for Anodic Chlorine Evolution on Electrochemically Conditioned Oxide Films at Iridium Anodes. J. Electrochem. Soc. 1981, 128, 2142–2149. [Google Scholar] [CrossRef]
- Mozota, J.; Conway, B.E. Surface and Bulk Processes at Oxidized Iridium Electrodes—I. Monolayer Stage and Transition to Reversible Multilayer Oxide Film Behaviour. Electrochim. Acta 1983, 28, 1–8. [Google Scholar] [CrossRef]
- Birss, V.; Myers, R.; Angerstein-Kozlowska, H.; Conway, B.E. Electron Microscopy Study of Formation of Thick Oxide Films on Ir and Ru Electrodes. J. Electrochem. Soc. 1984, 131, 1502–1510. [Google Scholar] [CrossRef]
- Michell, D.; Rand, D.A.J.; Woods, R. Analysis of the Anodic Oxygen Layer on Iridium by X-Ray Emission, Electron Diffraction and Electron Microscopy. J. Electroanal. Chem. Interfacial Electrochem. 1977, 84, 117–126. [Google Scholar] [CrossRef]
- Conway, B.E.; Mozota, J. Surface and Bulk Processes at Oxidized Iridium Electrodes—II. Conductivity-Switched Behaviour of Thick Oxide Films. Electrochim. Acta 1983, 28, 9–16. [Google Scholar] [CrossRef]
- Juodkazyte, J.; Šebeka, B.; Valsiunas, I.; Juodkazis, K. Iridium Anodic Oxidation to Ir(III) and Ir(IV) Hydrous Oxides. Electroanalysis 2005, 17, 947–952. [Google Scholar] [CrossRef]
- Kötz, R.; Neff, H.; Stucki, S. Anodic Iridium Oxide Films: XPS-Studies of Oxidation State Changes and O2-Evolution. J. Electrochem. Soc. 1984, 131, 72–77. [Google Scholar] [CrossRef]
- Spöri, C.; Briois, P.; Nong, H.N.; Reier, T.; Billard, A.; Kühl, S.; Teschner, D.; Strasser, P. Experimental Activity Descriptors for Iridium-Based Catalysts for the Electrochemical Oxygen Evolution Reaction (OER). ACS Catal. 2019, 9, 6653–6663. [Google Scholar] [CrossRef]
- Papaderakis, A.; Tsiplakides, D.; Balomenou, S.; Sotiropoulos, S. Electrochemical Impedance Studies of IrO2 Catalysts for Oxygen Evolution. J. Electroanal. Chem. 2015, 757, 216–224. [Google Scholar] [CrossRef]
- Reier, T.; Pawolek, Z.; Cherevko, S.; Bruns, M.; Jones, T.; Teschner, D.; Selve, S.; Bergmann, A.; Nong, H.N.; Schlögl, R.; et al. Molecular Insight in Structure and Activity of Highly Efficient, Low-Ir Ir-Ni Oxide Catalysts for Electrochemical Water Splitting (OER). J. Am. Chem. Soc. 2015, 137, 13031–13040. [Google Scholar] [CrossRef]
- Hu, J.M.; Zhang, J.Q.; Cao, C.N. Oxygen Evolution Reaction on IrO2-Based DSA® Type Electrodes: Kinetics Analysis of Tafel Lines and EIS. Int. J. Hydrogen Energy 2004, 29, 791–797. [Google Scholar] [CrossRef]
- De Oliveira-Sousa, A.; Da Silva, M.A.S.; Machado, S.A.S.; Avaca, L.A.; De Lima-Neto, P. Influence of the Preparation Method on the Morphological and Electrochemical Properties of Ti/IrO2-Coated Electrodes. Electrochim. Acta 2000, 45, 4467–4473. [Google Scholar] [CrossRef]
- Hsu, C.H.; Mansfeld, F. Technical Note: Concerning the Conversion of the Constant Phase Element Parameter Y 0 into a Capacitance. Corrosion 2001, 57, 747–748. [Google Scholar] [CrossRef]
- Lazanas, A.C.; Prodromidis, M.I. Electrochemical Impedance Spectroscopy─A Tutorial. ACS Meas. Sci. Au 2023, 3, 162–193. [Google Scholar] [CrossRef]
- Lončar, A.; Escalera-López, D.; Cherevko, S.; Hodnik, N. Inter-Relationships between Oxygen Evolution and Iridium Dissolution Mechanisms. Angew. Chem.-Int. Ed. 2022, 61, e202114437. [Google Scholar] [CrossRef] [PubMed]
- Cao, H.; Zhang, L.; Chen, M. Characteristics of Anodic TiO2 Nanotube Arrays Mediated IrO2 Active Anode in the Oxygen Evolution Reaction. Int. J. Electrochem. Sci. 2022, 17, 220461. [Google Scholar] [CrossRef]
- Shi, Y.; Lu, Z.; Guo, L.; Wang, Z.; Guo, C.; Tan, H.; Yan, C. Fabrication of IrO2 Decorated Vertical Aligned Self-Doped TiO2 Nanotube Arrays for Oxygen Evolution in Water Electrolysis. Int. J. Hydrogen Energy 2018, 43, 9133–9143. [Google Scholar] [CrossRef]
- Suhadolnik, L.; Bele, M.; Čekada, M.; Jovanovič, P.; Maselj, N.; Lončar, A.; Dražić, G.; Šala, M.; Hodnik, N.; Kovač, J.; et al. Nanotubular TiOxNy-Supported Ir Single Atoms and Clusters as Thin-Film Electrocatalysts for Oxygen Evolution in Acid Media. Chem. Mater. 2023, 35, 2612–2623. [Google Scholar] [CrossRef] [PubMed]
- Chatzitakis, A.; Grandcolas, M.; Xu, K.; Mei, S.; Yang, J.; Jensen, I.J.T.; Simon, C.; Norby, T. Assessing the Photoelectrochemical Properties of C, N, F Codoped TiO2 Nanotubes of Different Lengths. Catal. Today 2017, 287, 161–168. [Google Scholar] [CrossRef]
- Liu, X.; Risbakk, S.; Almeida Carvalho, P.; Yang, M.; Hoff Backe, P.; Bjørås, M.; Norby, T.; Chatzitakis, A. Immobilization of FeFe-Hydrogenase on Black TiO2 Nanotubes as Biocathodes for the Hydrogen Evolution Reaction. Electrochem. Commun. 2022, 135, 107221. [Google Scholar] [CrossRef]
- Liang, F.; Zhang, J.; Zheng, L.; Tsang, C.K.; Li, H.; Shu, S.; Cheng, H.; Li, Y.Y. Selective Electrodeposition of Ni into the Intertubular Voids of Anodic TiO2 Nanotubes for Improved Photocatalytic Properties. J. Mater. Res. 2013, 28, 405–410. [Google Scholar] [CrossRef]
- Macak, J.M.; Gong, B.G.; Hueppe, M.; Schmuki, P. Filling of TiO2 Nanotubes by Self-Doping and Electrodeposition. Adv. Mater. 2007, 19, 3027–3031. [Google Scholar] [CrossRef]
- Xu, B.; He, Y.; Zhang, Y.; Ma, Z.; Zhang, Y.; Song, W. In Situ Growth of Tunable Gold Nanoparticles by Titania Nanotubes Templated Electrodeposition for Improving Osteogenesis through Modulating Macrophages Polarization. ACS Appl. Mater. Interfaces 2022, 14, 50520–50533. [Google Scholar] [CrossRef]


Disclaimer/Publisher’s Note: The statements, opinions and data contained in all publications are solely those of the individual author(s) and contributor(s) and not of MDPI and/or the editor(s). MDPI and/or the editor(s) disclaim responsibility for any injury to people or property resulting from any ideas, methods, instructions or products referred to in the content. |
© 2025 by the authors. Licensee MDPI, Basel, Switzerland. This article is an open access article distributed under the terms and conditions of the Creative Commons Attribution (CC BY) license (https://creativecommons.org/licenses/by/4.0/).