Article

New Tools in Heavy Metal Detection: Synthesis, Spectroscopic, and Quantum Chemical Characterization of Selected Water-Soluble Styryl Derivatives of Quinoline and 1,10-Phenanthroline

by
Jacek E. Nycz
1,*,
Jolanta Kolińska
1,2,
Nataliya Karaush-Karmazin
3,*,
Tieqiao Chen
4,*,
Maria Książek
5 and
Joachim Kusz
5
1
Institute of Chemistry, Faculty of Science and Technology, University of Silesia in Katowice, ul. Szkolna 9, 40-006 Katowice, Poland
2
Institute of Polymer and Dye Technology, Faculty of Chemistry, Lodz University of Technology, Stefanowskiego 12/16, 90-924 Lodz, Poland
3
Department of Chemistry and Nanomaterials Science, Bohdan Khmelnytsky National University, 18031 Cherkasy, Ukraine
4
Ministry of Education Key Laboratory of Advanced Materials for Tropical Island Resources, Hainan Provincial Key Laboratory of Fine Chem, Hainan Provincial Fine Chemical Engineering Research Center, Hainan University, Haikou 570228, China
5
Institute of Physics, Faculty of Science and Technology, University of Silesia in Katowice, 75 PułkuPiechoty 1a, 41-500 Chorzów, Poland
*
Authors to whom correspondence should be addressed.
Molecules 2025, 30(12), 2659; https://doi.org/10.3390/molecules30122659
Submission received: 12 May 2025 / Revised: 12 June 2025 / Accepted: 17 June 2025 / Published: 19 June 2025

Abstract

:
A series of water-soluble molecules based on 8-isopropyl-2-methyl-5-nitroquinoline and 1,10-phenanthroline core were designed by introducing a π-conjugated bridge, vinyl unit –CH=CH–. We present the selective conversion of methyl groups located on the C2 and C9 positions in the constitution of selected quinoline or 1,10-phenanthroline derivatives, respectively, into vinyl (or styryl) products by applying Perkin condensation. The two groups of ligands differ in the presence of one or two arms. The structure of the molecule ((1E,1′E)-(1,10-phenanthroline-2,9-diyl)bis(ethene-2,1-diyl))bis(benzene-4,1,3-triyl) tetraacetate was determined by single-crystal X-ray diffraction measurements. The X-ray, NMR, and DFT computational studies indicate the influence of rotation (rotamers) on the physical properties of studied styryl molecules. The results show that the styryl molecules with the vinyl unit –CH=CH– exhibit significant static and dynamic hyperpolarizabilities. Quantum chemical calculations using density functional theory and B3LYP/6-311++G(d,p) with Grimme’s dispersion correction approach predict the existence and relative stability of different spatial cis(Z)- and trans(E)-conformers of styryl derivatives of quinoline and 1,10-phenanthroline, which exhibit different electronic distribution and conjugation within the molecular skeleton, dipole moments, and steric interactions, leading to variations in their photophysical behavior and various applications. Our studies indicate that the rotation and isomerization of aryl groups can significantly influence the electronic and optical properties of π-conjugated systems, such as vinyl units (–CH=CH–). The rotation of aryl groups around the single bond that connects them to the vinyl unit can lead to changes in the effective π-conjugation between the aryl group and the rest of the π-conjugated system. The rotation and isomerization of aryl groups in π-conjugated systems significantly impact their electronic and optical properties. These changes can modify the efficiency of π-conjugation, affecting charge transfer processes, absorption properties, light emission, and electrical conductivity. In designing optoelectronic materials, such as organic dyes, organic semiconductors, or electrochromic materials, controlling the rotation and isomerization of aryl groups can be crucial for optimizing their functionality.

1. Introduction

Quinoline and 1,10-phenanthroline derivatives represent highly versatile photoactive compounds that demonstrate distinct properties in coordination chemistry [1,2,3,4,5], medicinal chemistry [6,7,8,9,10,11,12,13,14,15], chemical engineering [16,17], electrochemistry [18,19], industrial chemistry [20,21], etc., [22,23]. Despite their importance, water-soluble ligands based on quinoline or 1,10-phenanthroline core are relatively poorly studied compounds. Developing efficient and convenient syntheses for such ligands could open new avenues for functional material and complex design [24,25].
Our studies describe novel and practical ways to introduce a polyphenol group under mild reaction conditions. In particular, we apply Perkin condensation to synthesize a vinyl (or styryl) analog of 1,10-phenanthroline and quinoline derivatives with a phenol function. This reaction also demonstrates a new, simple, and efficient strategy for converting methyl derivatives of 1,10-phenanthroline or quinoline into more reactive styryl derivatives [24]. We anticipate that the new way of converting methyl will find wide application in chemical synthesis.
The synthesized styryl derivatives of quinoline and 1,10-phenanthroline possess a specific π-conjugated structure, containing a vinyl that functions as a bridge between an azoquinoline or phenanthroline moiety and an additional phenyl ring. Such extended π-conjugation increases the stability of the molecule and ensures efficient π-delocalization throughout the whole structure.
Quantum chemical calculations using density functional theory (DFT) support the existence of multiple spatial cis(Z)- and trans(E)-conformers of these styryl derivatives of quinoline and 1,10-phenanthroline, which exhibit different electronic distribution and conjugation within the molecular skeleton, dipole moments, and steric interactions, leading to variations in their photophysical behavior. The presence of nitrogen atoms within the molecular system enables it to bind to specific ions selectively. As a result, styryl derivatives of quinolines and 1,10-phenanthrolines are utilized in chemical sensors for detecting heavy metal ions, such as copper and mercury, which is significant in environmental protection and chemical analysis [26,27,28,29,30].
For example, Aatif and Kumar designed a novel phenanthroline-benzothiazole fluorescent sensor (L) for detecting Hg2+ in both biological and environmental samples [27]. Fernandes et al. developed a self-contained, portable iron measurement system based on spectroscopic absorption using the phenanthroline complex for the detection of Fe2+ in water [31]. The device demonstrated high sensitivity (2.5 µg Fe2+/L) and a linear response in the 25–1000 µg Fe2+/L range [31]. Mula et al. reported a BODIPY-phenanthroline conjugate that allows highly selective, fluorescence turn-off detection of Cu2+ ions [32]. The sensor demonstrated 1:1 complex formation with Cu2+ and was successfully applied in live-cell imaging and serum sample analysis [32]. Riela et al. developed a hectorite/phenanthroline nanohybrid material as a selective and stable fluorescent sensor for Zn2+ detection in aqueous solution [33]. This material exhibited strong interaction with Zn2+ ions and was characterized by combined spectroscopic, microscopic, and theoretical techniques to confirm its sensing potential and structural stability [33]. Zhou et al. presented a dual-function fluorescence sensor based on the inner filter effect between NaYF4:Yb,Er@NaYF4@PAA and the Fe(II)-1,10-phenanthroline complex for the sensitive detection of Sn(II) and ascorbic acid (AA) [34]. The system exhibited excellent selectivity and linear response with detection limits of 1.08 μM for Sn(II) and 0.97 μM for AA, and was successfully applied to tap and spring water samples [34]. Soleymani et al. reported a dual-emission ratiometric fluorescent sensor based on terbium-1,10-phenanthroline–nitrogen-doped-graphene quantum dots for the sensitive detection of metformin in biological samples [35].
In this paper, we demonstrate how our newly synthesized water-soluble ligands align with these design principles and explore their photophysical and coordination properties in depth. In this context, a series of spectroscopic investigations were carried out to evaluate the response of the ligands toward various metal ions, focusing on changes in absorbance behavior and fluorescence intensity (quenching). Among the tested ions, Cu2+ induced the most significant spectral changes, highlighting the high specificity of the phenanthroline derivative.

2. Results and Discussion

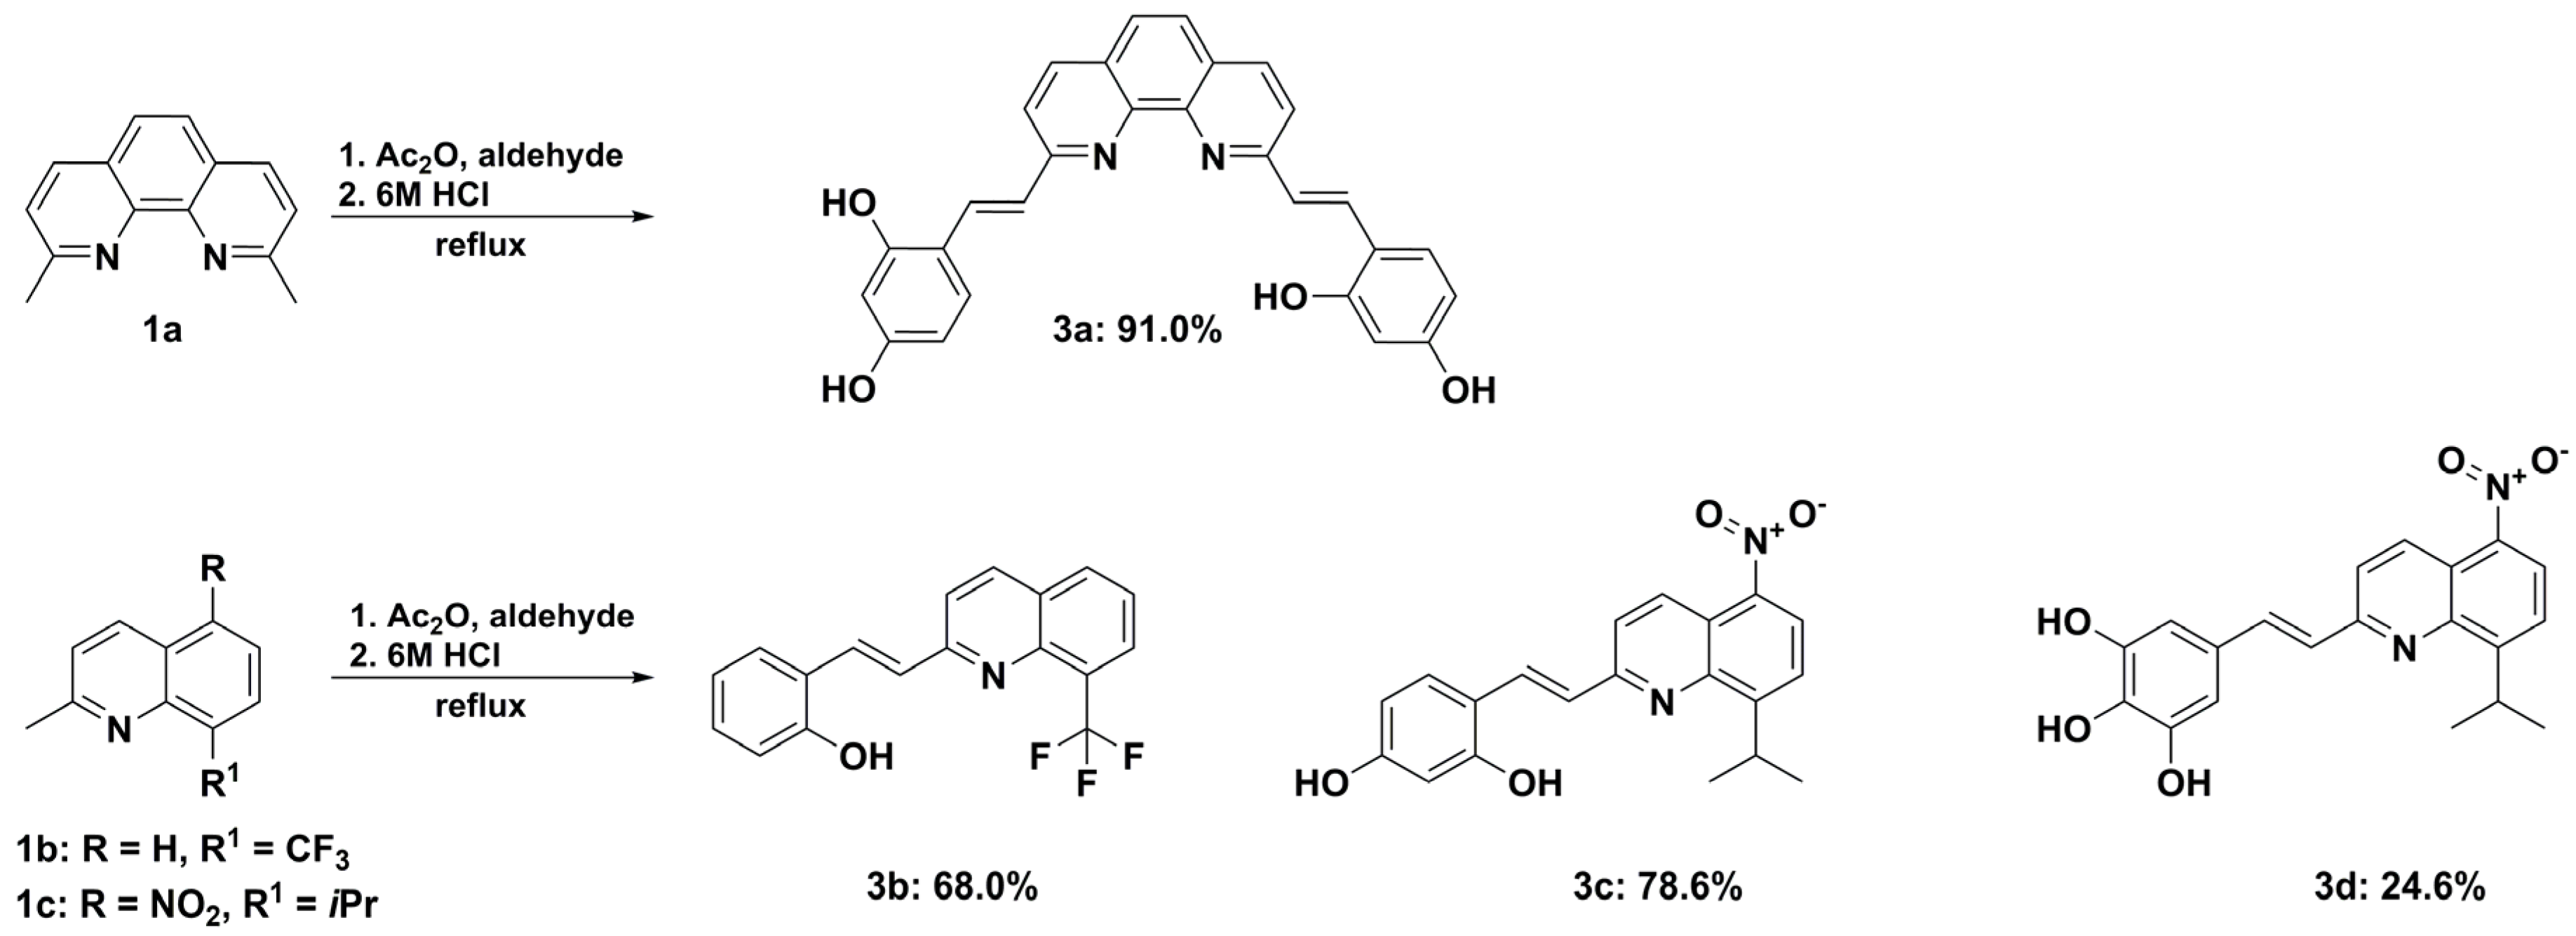
2.1. Synthesis and Structural Characterization

Recently, we reported the synthesis of a vinyl analog of 1,10-phenanthroline based on Perkin condensation [24]. In the present study, we successfully obtained a similar molecule 2,2′-((1E,1′E)-(1,10-phenanthroline-2,9-diyl)bis(ethene-2,1-diyl))diphenol, a vinyl analog of 1,10-phenanthroline, which, like our previously published molecule, has a phenolic group. This prompted us to obtain an analog with a polyphenol group, providing better solubility in water. For this purpose, we used a previously developed procedure in which we replaced 2-hydroxybenzaldehyde with 2,4-dihydroxybenzaldehyde. We received the product with 91% efficiency (Scheme 1). Since quinolines, like 1,10-phenanthrolines, are commonly used as ligands, we have expanded our research work to include this group of molecules. We chose the less commonly used, i.e., molecules 2-methyl-8-(trifluoromethyl)quinoline (1b) and 8-isopropyl-2-methyl-5-nitroquinoline (1c) as models. An analog with a trifluoromethyl group can be used as an NMR probe. The second model, on the other hand, refers to the isopropyl group of the first one, and the nitro group was chosen because, after reduction, the amino analogs will allow for further functionalization of the obtained compounds.

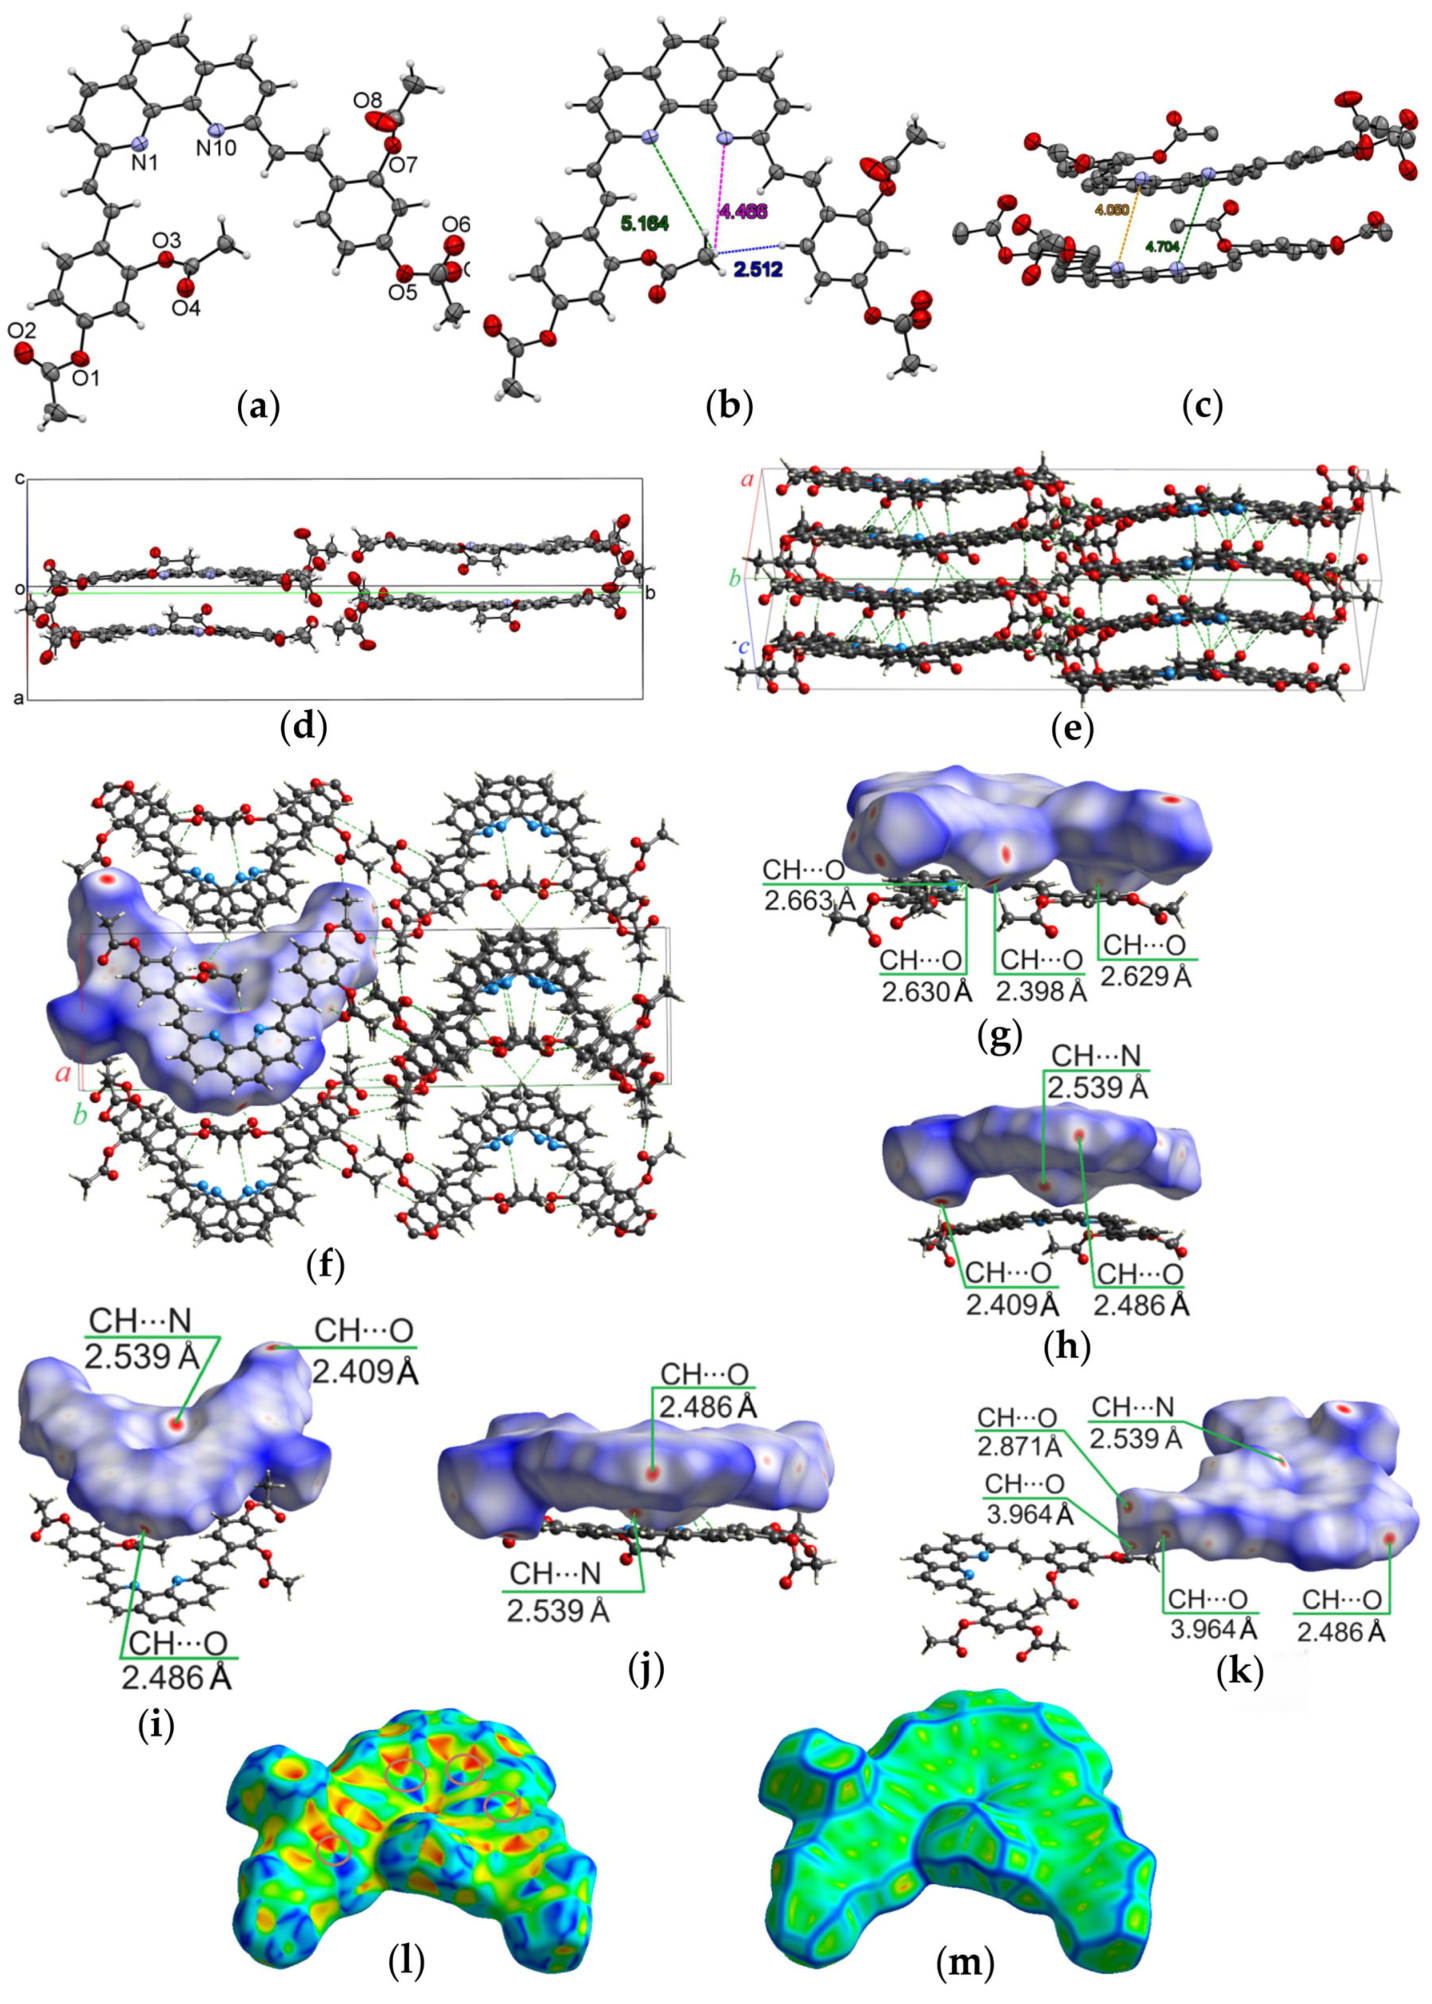
2.2. Single-Crystal X-Ray Data and Hirshfeld Surface Analysis

((1E,1′E)-(1,10-Phenanthroline-2,9-diyl)bis(ethene-2,1-diyl))bis(benzene-4,1,3-triyl) tetraacetate (2a)(Figure 1a) crystallizes in the monoclinic system, P21/c, with unit cell dimensions of a = 9.5864(6) Å, b = 36.0174(19) Å, c = 8.6135(5) Å, cell volume V = 2973.01Å3, and Z = 4; the monoclinic angle (β) is 91.514(6), and the unit cell contains four molecules (Figure 1b–d). There is one molecule in the asymmetric part of the unit cell. The atom numbering of the selected atoms is shown in Figure 1a. The selected intra- and intermolecular interactions in 2a presented in Figure 1b,c affect molecular conformation and crystal packing. The shortest intramolecular distance, 2.512 Å, belongs to the H···H contact, indicating very close proximity between the two hydrogen atoms in the 2a molecule. The 5.164 Å and 4.466 Å distances correspond to long-range CH···N intramolecular contacts in 2a. These contacts stabilize the molecular conformation and crystal packing, albeit at relatively weak interaction distances. The intermolecular N···N distances are 4.050 Å and 4.704 Å (Figure 1c).
Crystals of 2a consist of closely spaced continuous columns of molecules (Figure 1e) linked together by numerous CH···O intermolecular interactions, which can be classified as weak hydrogen contacts according to the characteristics proposed by Desiraju and Steiner [36]. Each column consists of mutually parallel molecules with plane-to-plane distances between the centroids in parallel phenanthroline fragments of 3.954 Å and 4.007 Å. Although these distances are slightly larger than the optimal range for strong π···π interactions (3.3–3.8 Å), they still suggest weak π···π interactions due to the overlap of p-orbitals between the closely aligned phenanthroline cores in a face-to-face arrangement (Figure 1d). The detailed analysis of intermolecular interactions was performed with Hirshfeld dnorm surfaces of selected dimer configurations within the crystal of 2a (Figure 1f). The red spots on dnorm indicate numerous CH···O and CH···N intermolecular interactions, which involve acetate groups and phenanthroline core (Figure 1g–k); these contacts contribute mainly to stability and well-ordered crystal packing motif of 2a
The shape index map (Figure 1l) uses concave (red) and convex (blue) regions to represent areas where molecules fit into each other, similar to a lock-and-key principle. The presence of the red and blue triangles displays the areas where the π-system of one molecule intercalates or overlaps with another through van der Waals forces. It confirms the weak π···π stacking interactions between phenanthroline cores placed one above the other in neighboring molecules of 2a.
The curvedness map in Figure 1m displays areas with different packing densities, where green regions represent flat molecular surfaces with low curvature and correspond to the π–π stacking regions in 2a.

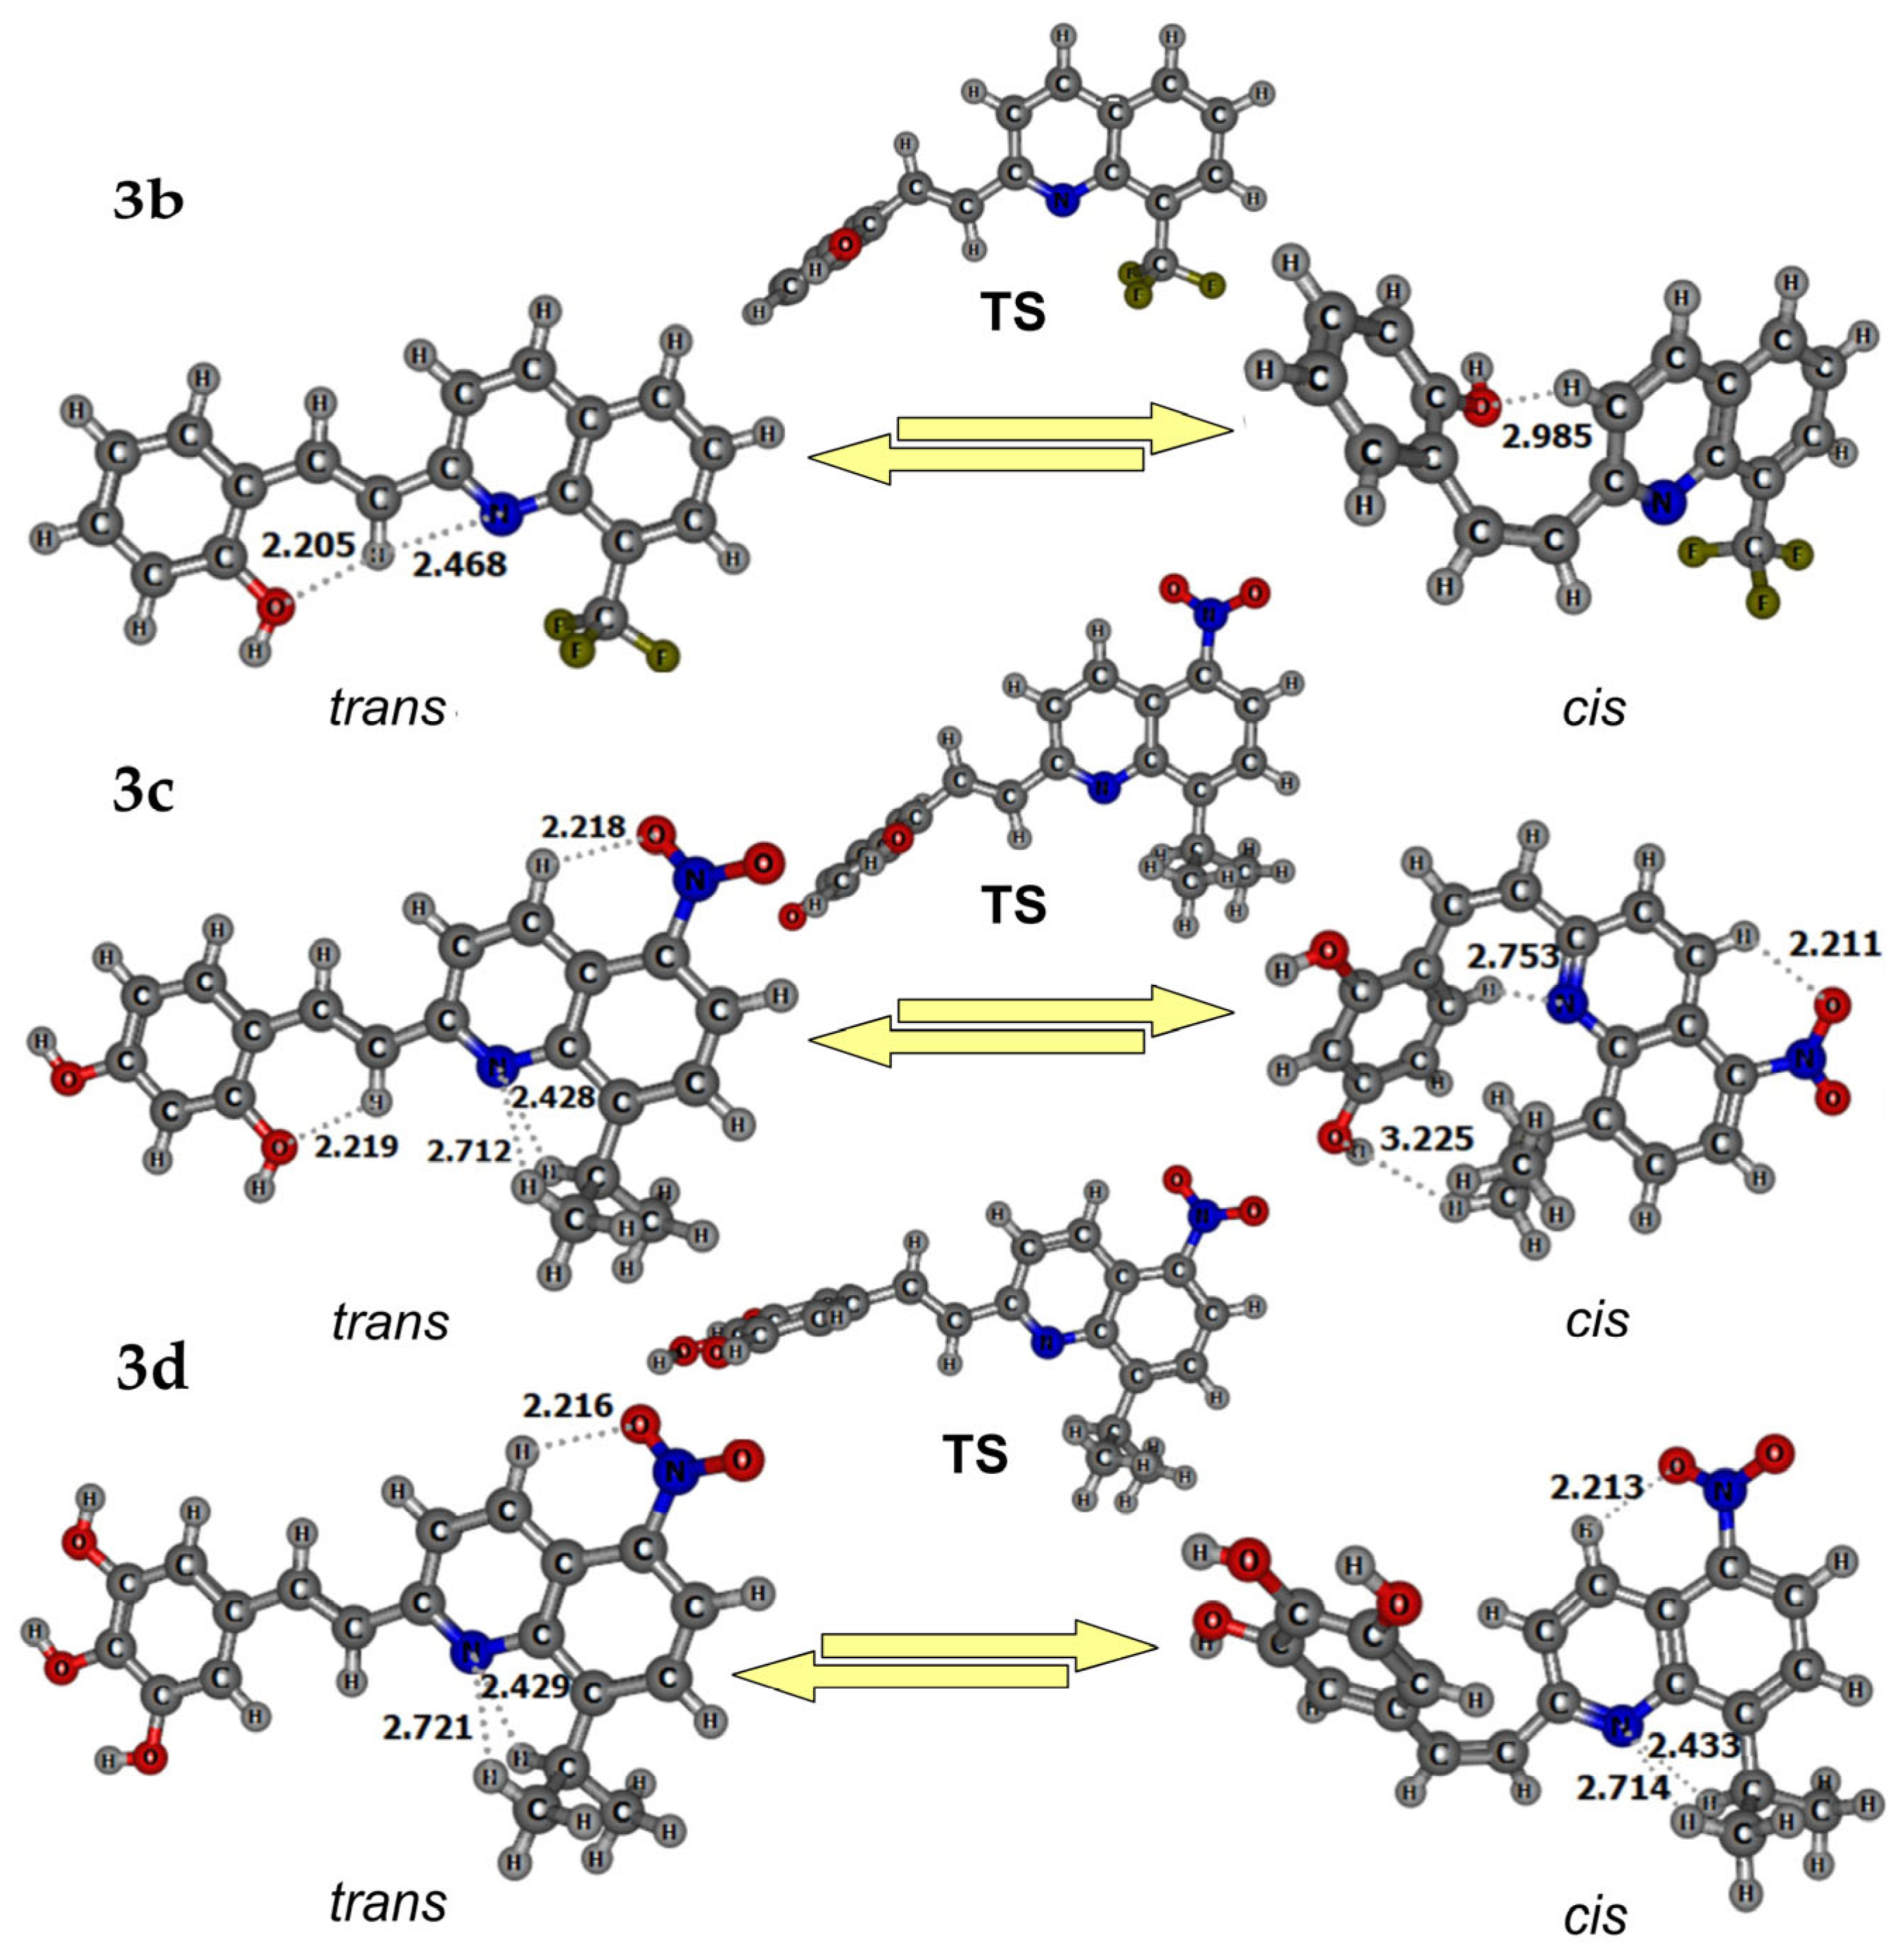
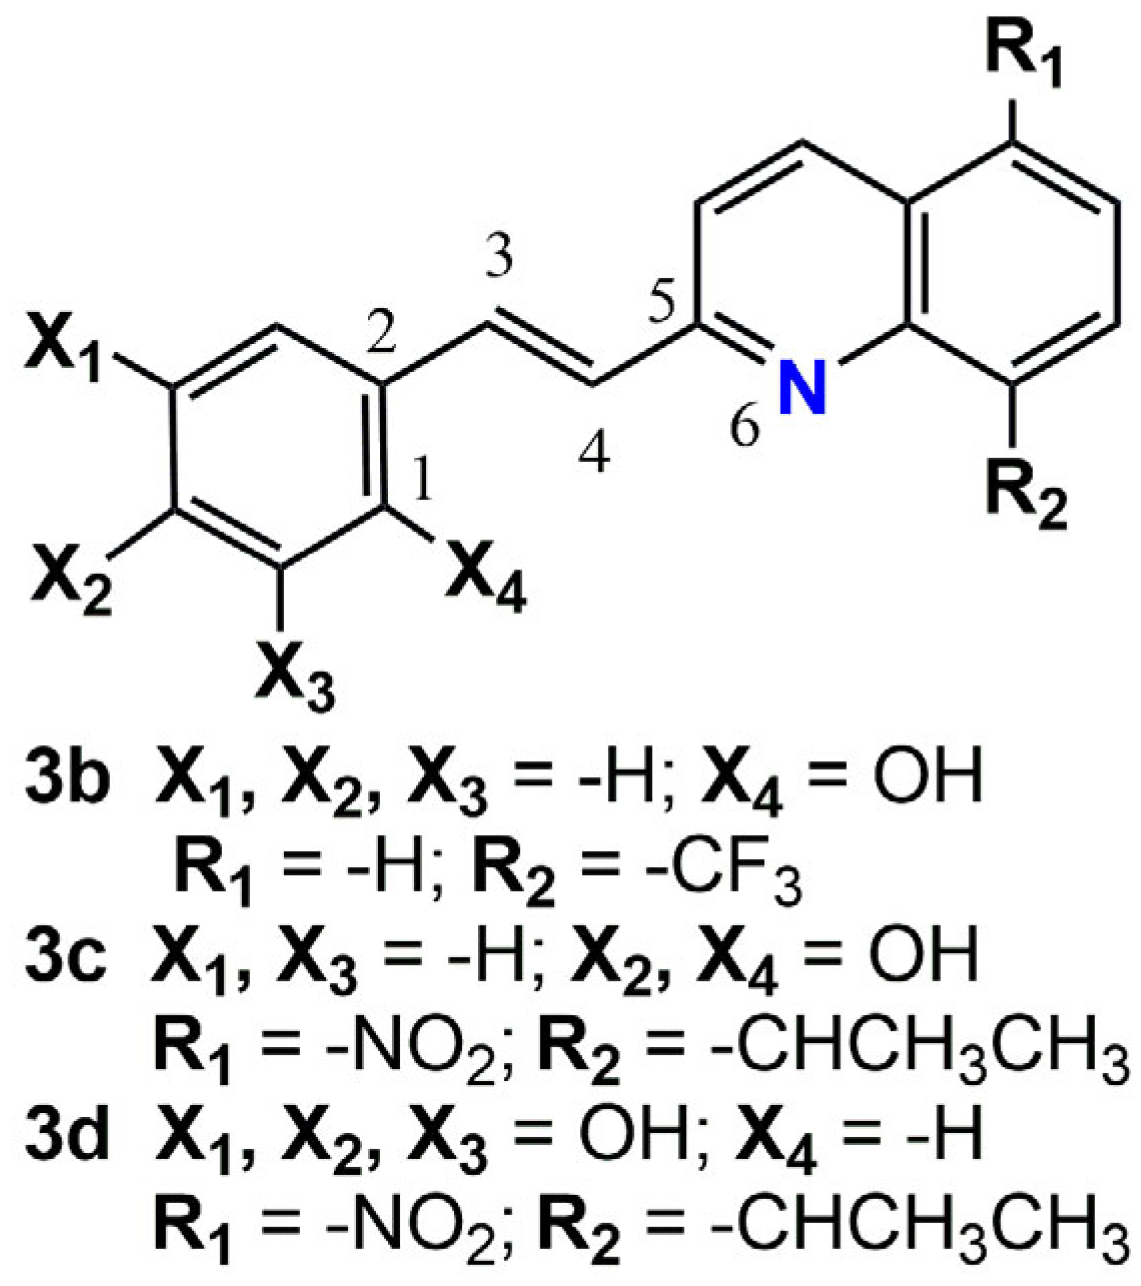
2.3. Structural Characterization of the Quinoline Derivatives 3b, 3c, and 3d

The B3LYP/6-311G++G(d,p), including Grimme’s dispersion correction optimized ground state structures of the trans-, cis-isomers, and the transition states (TS) with indicated intramolecular O···H, and N···H interactions for 3b, 3c, and 3d are presented in Figure 2. The selected angles and energy barriers are summarized in Table 1 and Table 2. The structure of 3b, 3c, and 3d trans-isomers is planar with dihedral angles D(C1C2C3C4) and D(C2C3C4C5) close to 0° and 180°, respectively (Figure 3, Table 1). Planarity facilitates π-conjugation of 3b, 3c, and 3d structures, increasing their stability. The 3b, 3c, and 3d cis-isomers exhibit significant geometrical distortions with non-planar D(C1C2C3C4) and D(C2C3C4C5) dihedral angle values (Table 1). The bond angles (A(C2C3C4), A(C3C4C5) vary slightly between the trans- and cis-isomers, but remain close to 120°, reflecting the sp2 hybridization of these carbon atoms.
The structure of the 3b trans-isomer is stabilized by weak intramolecular O···H and N···H interactions with distances 2.205 Å and 2.468 Å (Figure 2). In the cis-isomer of the 3b, the O···H distance increases to 2.985 Å, indicating a weaker interaction compared to the trans form. The 3c and 3d trans- and cis-isomers are also stabilized by intramolecular O···H and N···H interactions (Figure 2). All the compounds 3b, 3c, and 3d possess structural trend that trans form exhibits relatively shorter and stronger O···H and N···H interactions compared to the corresponding cis-isomer. The energy differences (ΔE) between the cis- and trans-isomers indicate that the trans-isomers are energetically more stable, consistent with their planar and less strained structure. The energy differences relative to the trans-isomer are 3.81 kcal mol−1 for 3b, 1.61 kcal mol−1 for 3c, and 3.61 kcal mol−1 for 3d (Table 1).
The TS structures of 3b, 3c, and 3d exhibit distorted geometries with intermediate O···H and N···H distances, consistent with partial bond breaking/forming during the isomerization process. The cis–trans isomerization reaction proceeds primarily via an inversion pathway, as indicated by the significant increase in the dihedral angle D(C1C2C3C4) in the TS. As one can see from Table 1 and Table 2, the D(C1C2C3C4) changes from nearly 0° in the trans-isomers to around ±140° in the cis-isomers, and to ~83–86° in the TS. This structural feature supports the predominance of inversion over a pure rotation mechanism around the C=C bond. However, the rotation process plays a role in the changes in other torsional and bond angles (Table 1 and Table 2), which suggests that the process also involves a rotational component, consistent with a combined inversion-rotation mechanism.
The TS energy barriers for 3b, 3c, and 3d vary significantly among the compounds; 3b shows the highest energy barrier (13.56 kcal mol−1, Table 2), which reflects the higher stability of the trans-isomer. Energy barriers for 3c and 3d are much lower (4.72 kcal mol−1 and 5.43 kcal mol−1, respectively, Table 2) due to weaker intramolecular interactions and increased torsion in the TS. The lower energy barriers for 3c and 3d suggest a higher probability of cis–trans interconversion, leading to nonradiative decay pathways that quench photoluminescence.

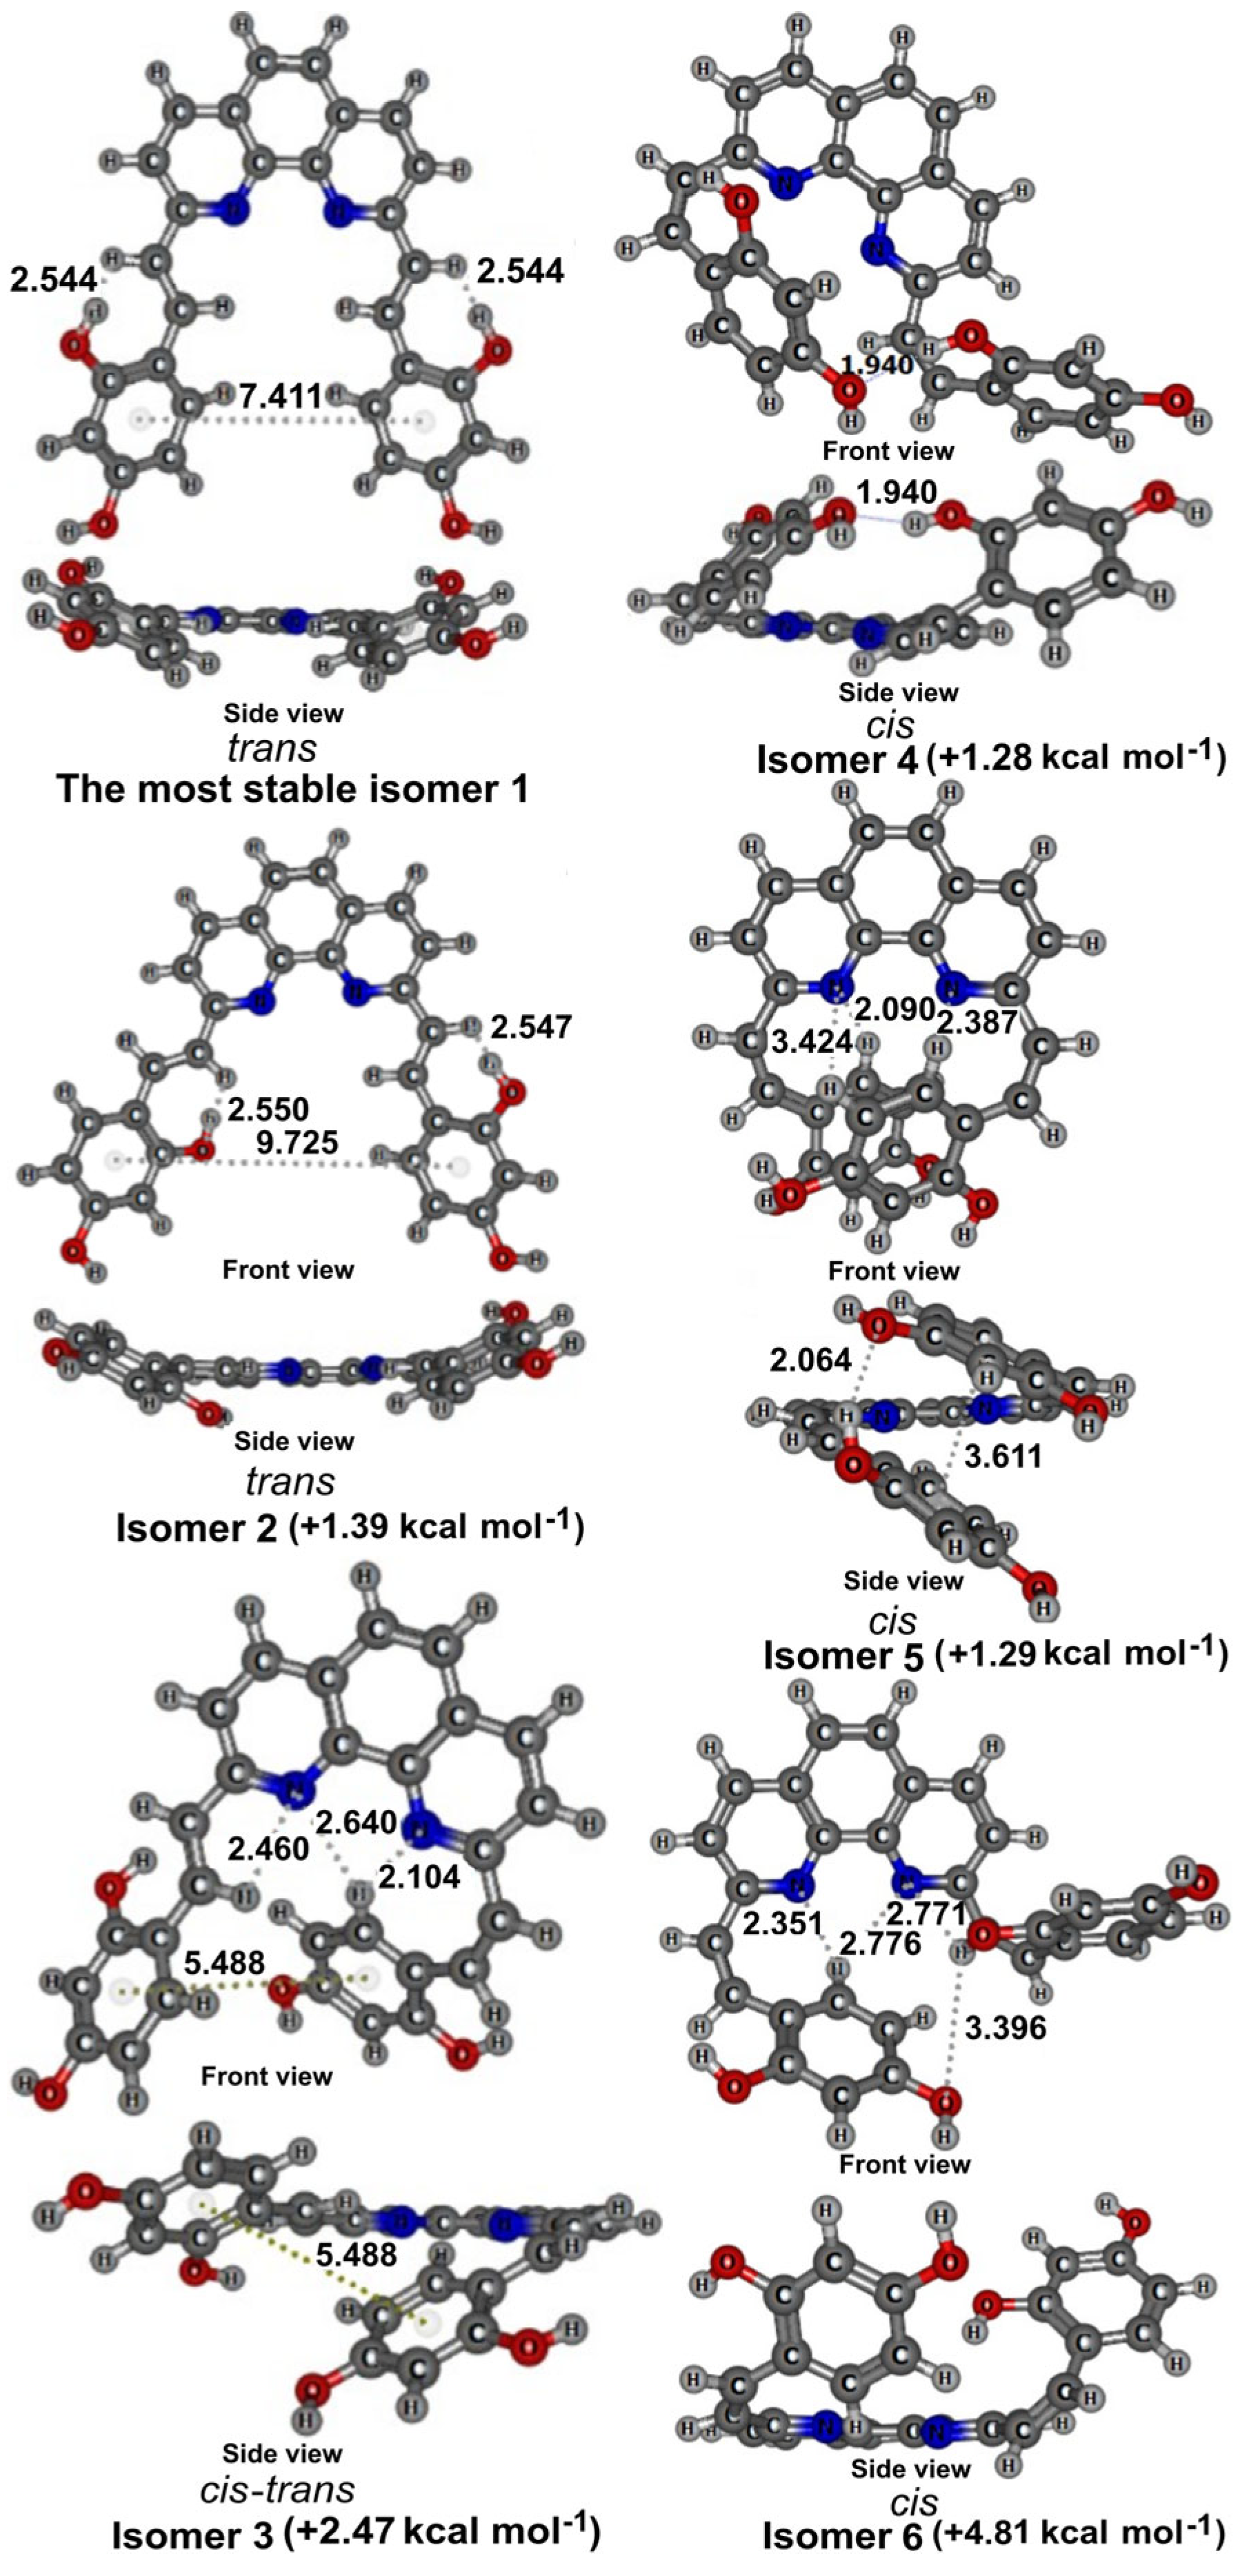
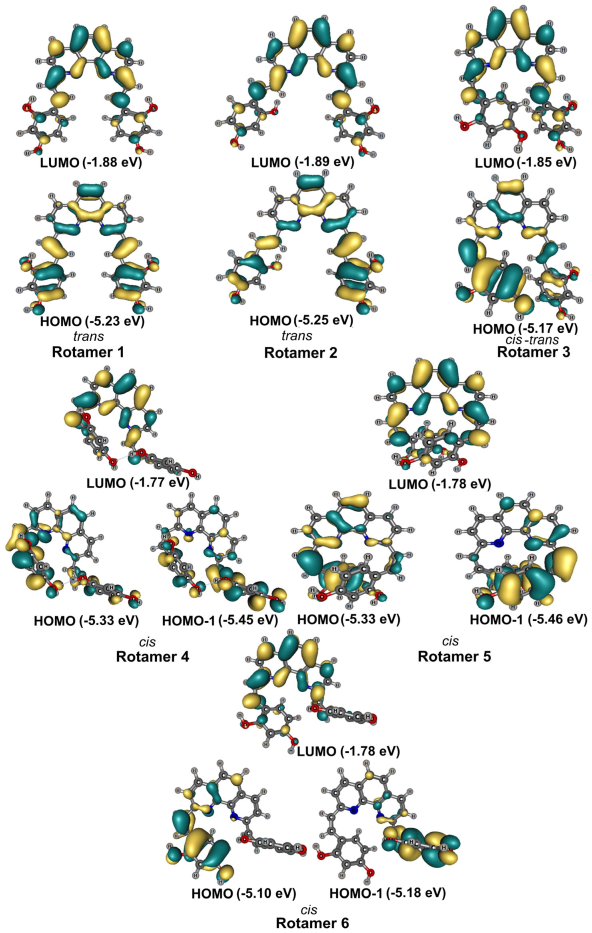
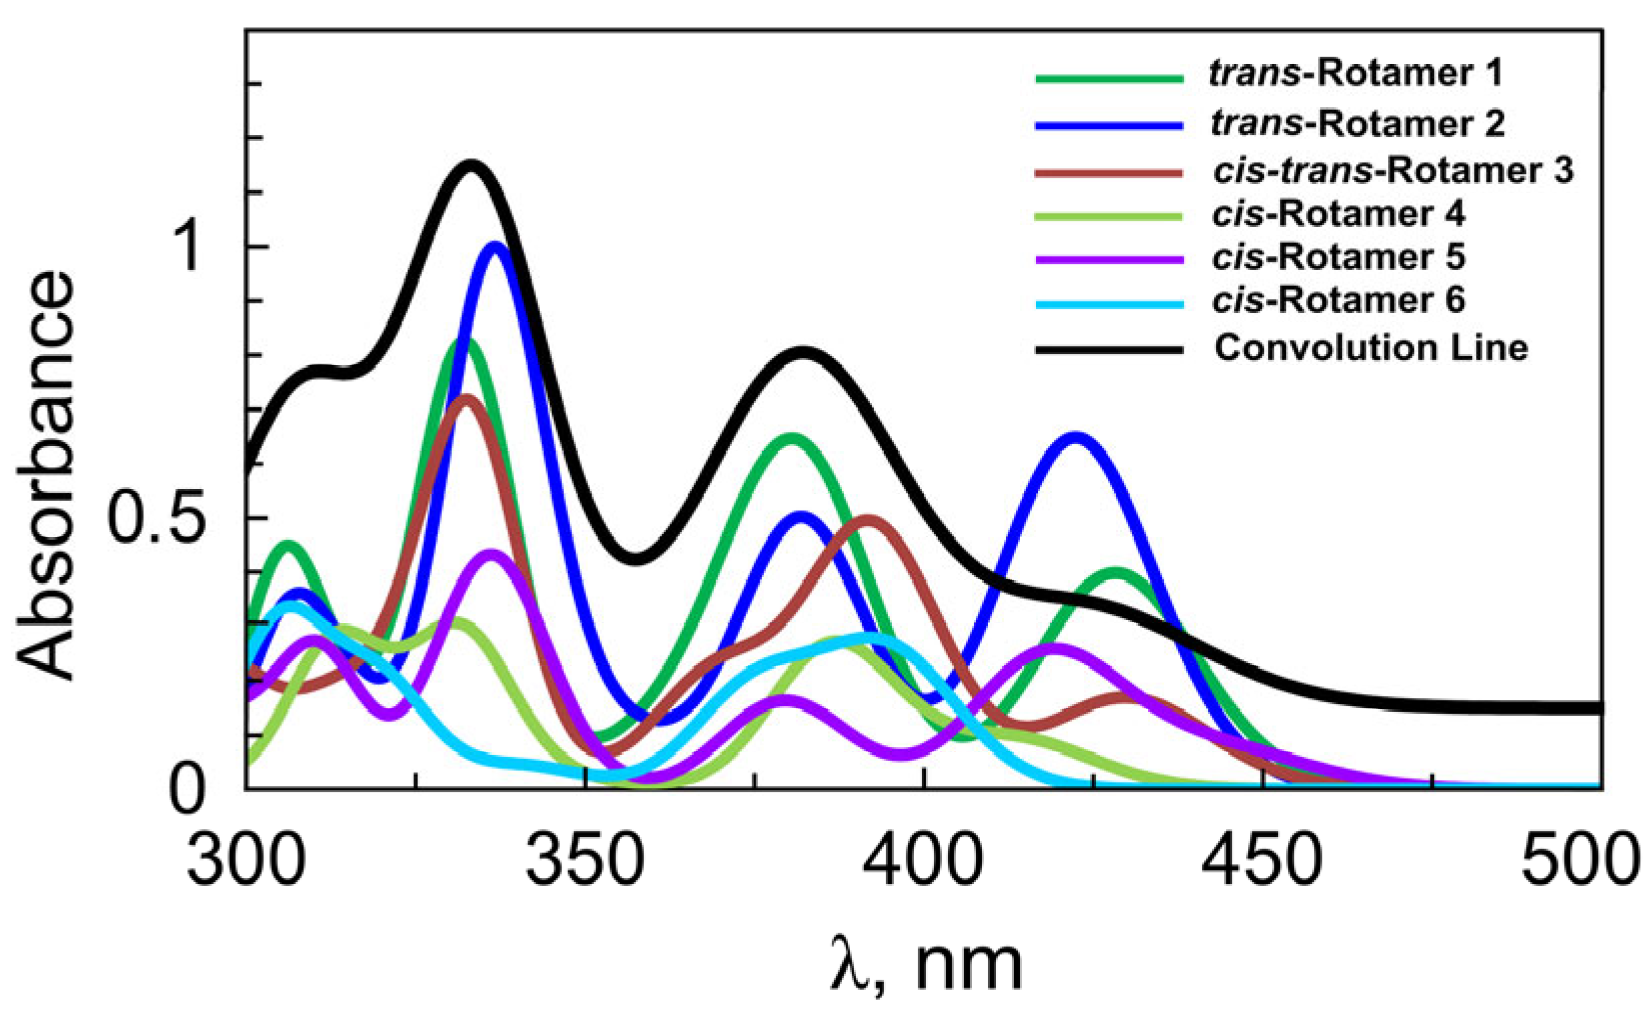
2.4. Conformational Analysisof 3a

We simulated six structural trans-, cis-, and cis–trans rotamers 16 for 3a (Figure 4 and Figure S2), and their highest occupied molecular orbital (HOMO) and lowest unoccupied molecular orbital (LUMO) are shown in Figure 5, and Table S1. The trans rotamer 1 of 3a is energetically the most stable, due to minimized steric hindrance, and a centroid-to-centroid distance of 7.411 Å between the two terminal benzene rings with OH groups placed in opposite directions. The HOMO–LUMO gap for this rotamer 1 is 3.35eV.
The other two cis rotamers, 4 and 5 of 3a, are only 1.28 and 1.29 kcal·mol−1 higher in energy than trans rotamer 1. Rotamer 4, with the unidirectional orientation of the terminal substituents, is stabilized by an intramolecular O···H interaction 1.940 Å, which appears between the OH groups on the terminal benzene rings. It exhibits a HOMO–LUMO gap of 3.56 eV which suggests a more localized electronic distribution and slightly reduced π-conjugation compared to trans rotamer 1 of 3a. Rotamer 5, with bidirectional branches, adopts a helical shape, with a centroid-to-centroid distance of 3.611 Å between the terminal benzene rings. This rotamer is stabilized by a network of intramolecular O···H and N···H interactions 2.064 Å, 2.090 Å, 2.387 Å, and 3.424 Å (Figure 4). Rotamer 5 has a HOMO–LUMO gap of 3.55 eV, similar to that of cis rotamer 4, indicating the same π-delocalization principle.
Trans rotamer 2, with unilaterally placed OH groups on the terminal benzene rings, lies higher by 1.39 kcal·mol−1 compared to trans rotamer 1. While the HOMO–LUMO gap of rotamer 2 is only slightly larger (3.36 eV) than that of rotamer 1 (3.35 eV), this minor energy difference between the two rotamers originates primarily from subtle steric and conformational effects related to the orientation of the OH groups, rather than from differences in electronic delocalization, as evidenced by the similar shapes of the HOMO and LUMO shown in Figure 5.
Cis-trans rotamer 3 lies 2.47 kcal·mol−1 higher in energy than trans rotamer 1; the structure adopts an intermediate conformation in which one terminal OH-substituted benzene ring is oriented in a cis fashion (toward the phenanthroline core), while the other is trans-oriented (away from the phenanthroline core). This mixed conformation leads to a more compact geometry than fully trans rotamers 1 and 2. The HOMO–LUMO gap (3.32 eV) is narrower than that of rotamers 1 (3.35 eV) and 2 (3.36 eV), indicating slightly better π–π overlap in this intermediate geometry (Figure 5). The slightly higher HOMO energy (–5.17 eV), compared to rotamers 1 (−5.23 eV) and 2 (−5.25 eV), suggests reduced stabilization due to increased intramolecular steric strain, although its electronic properties are relatively similar.
Cis rotamer 6 is higher in energy than trans rotamer 1, with a relative energy difference of 4.81 kcal·mol−1 (Figure 4). This rotamer adopts a fully cis conformation, where both OH-substituted terminal benzene rings are oriented toward the phenanthroline core. This geometry leads to distortion of the π-conjugated system, which reduces planarity and increases molecular strain. The HOMO–LUMO gap of rotamer 6 is 3.32 eV, the same as for cis–trans rotamer 3 (Figure 5). This suggests that despite the steric strain and non-planarity in rotamer 6, the π–π* interactions remain moderately preserved, due to local orbital overlap between adjacent aromatic fragments. The HOMO energy level of rotamer 6 is higher (–5.10 eV) compared to the other rotamers 15 in Figure 5, which suggests reduced stabilization of the HOMO. This supports that intramolecular repulsion and conformational strain in rotamer 6 dominate electronic delocalization.

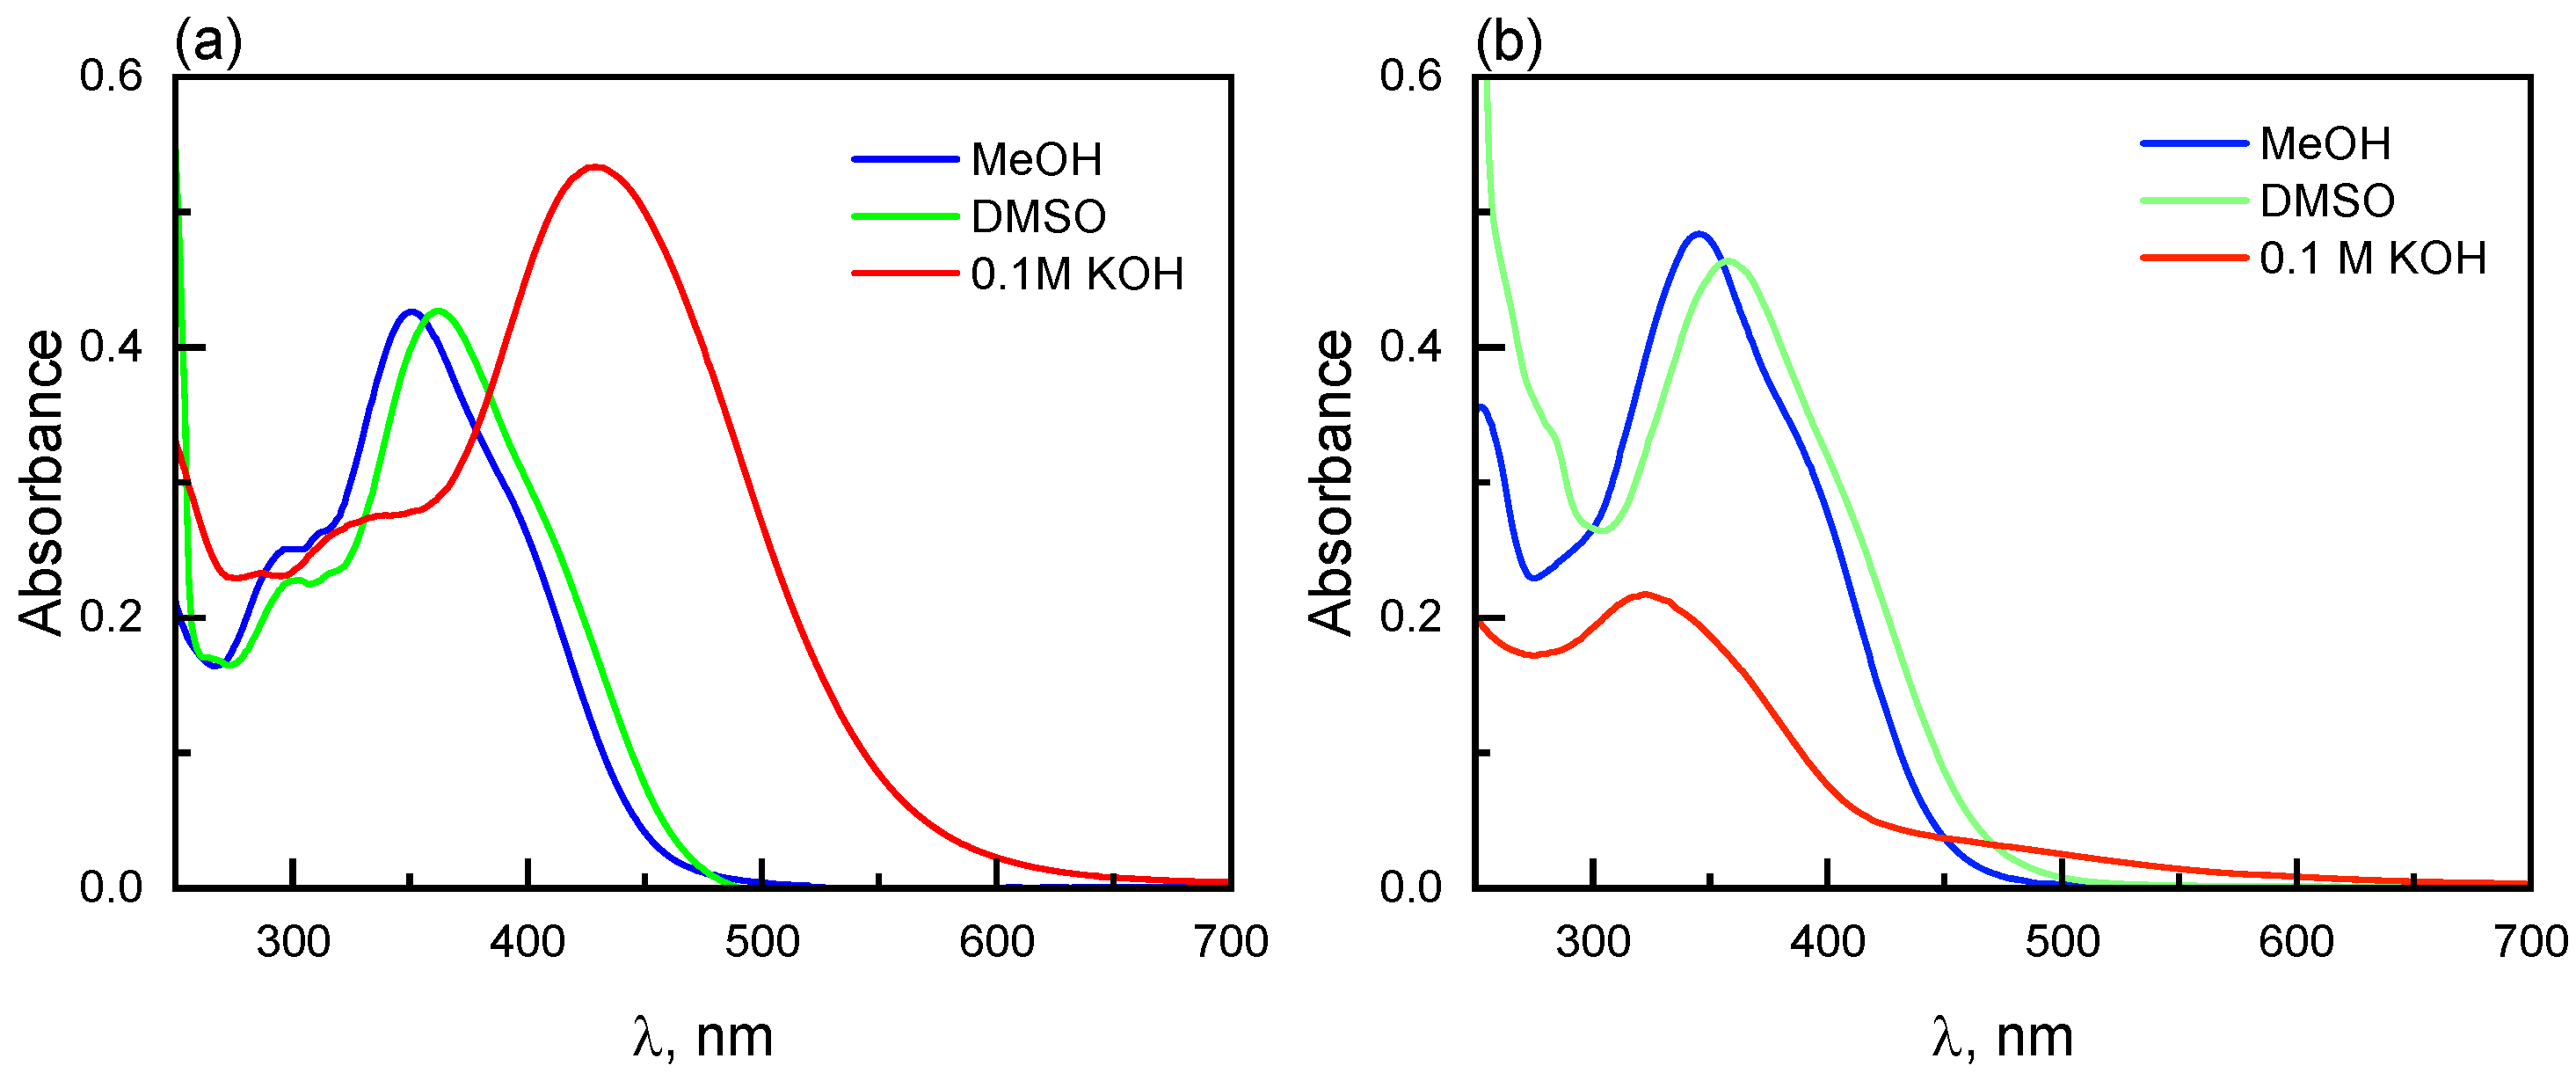
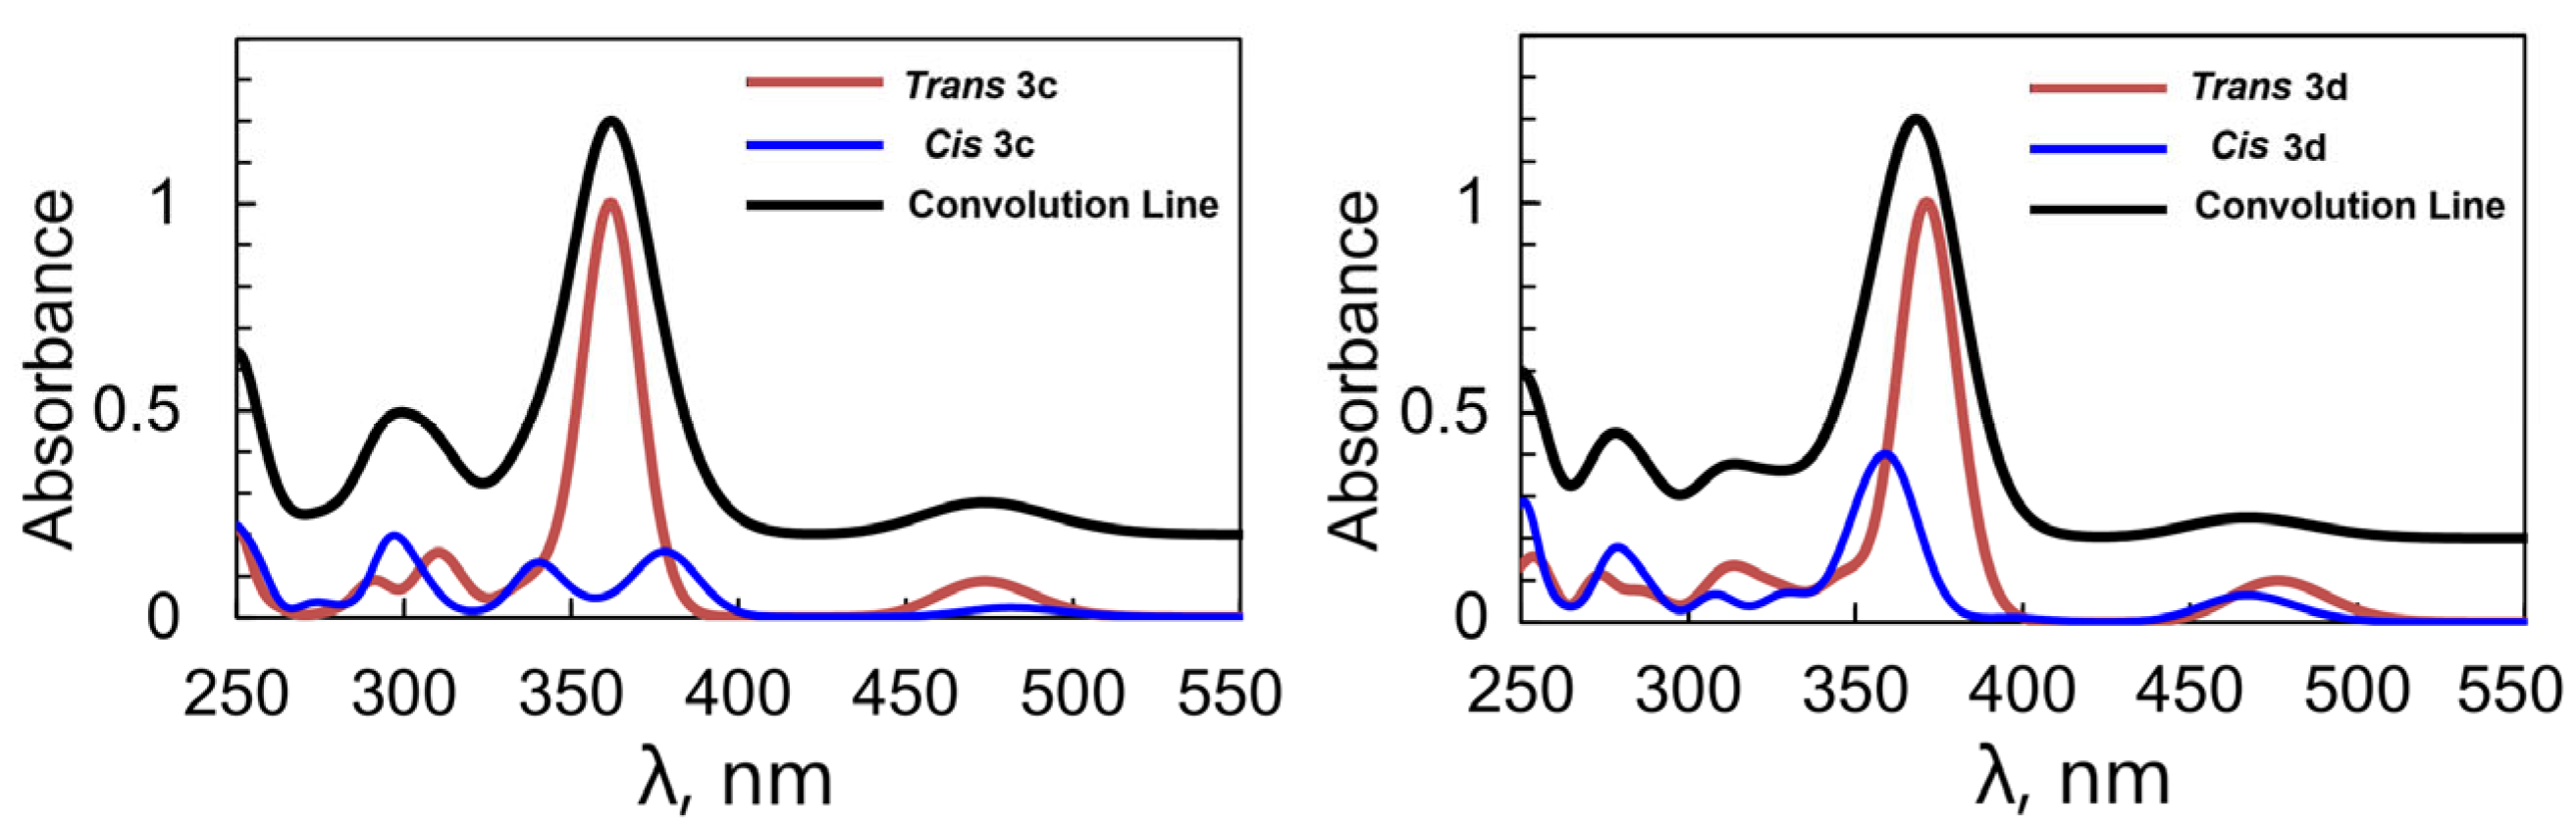
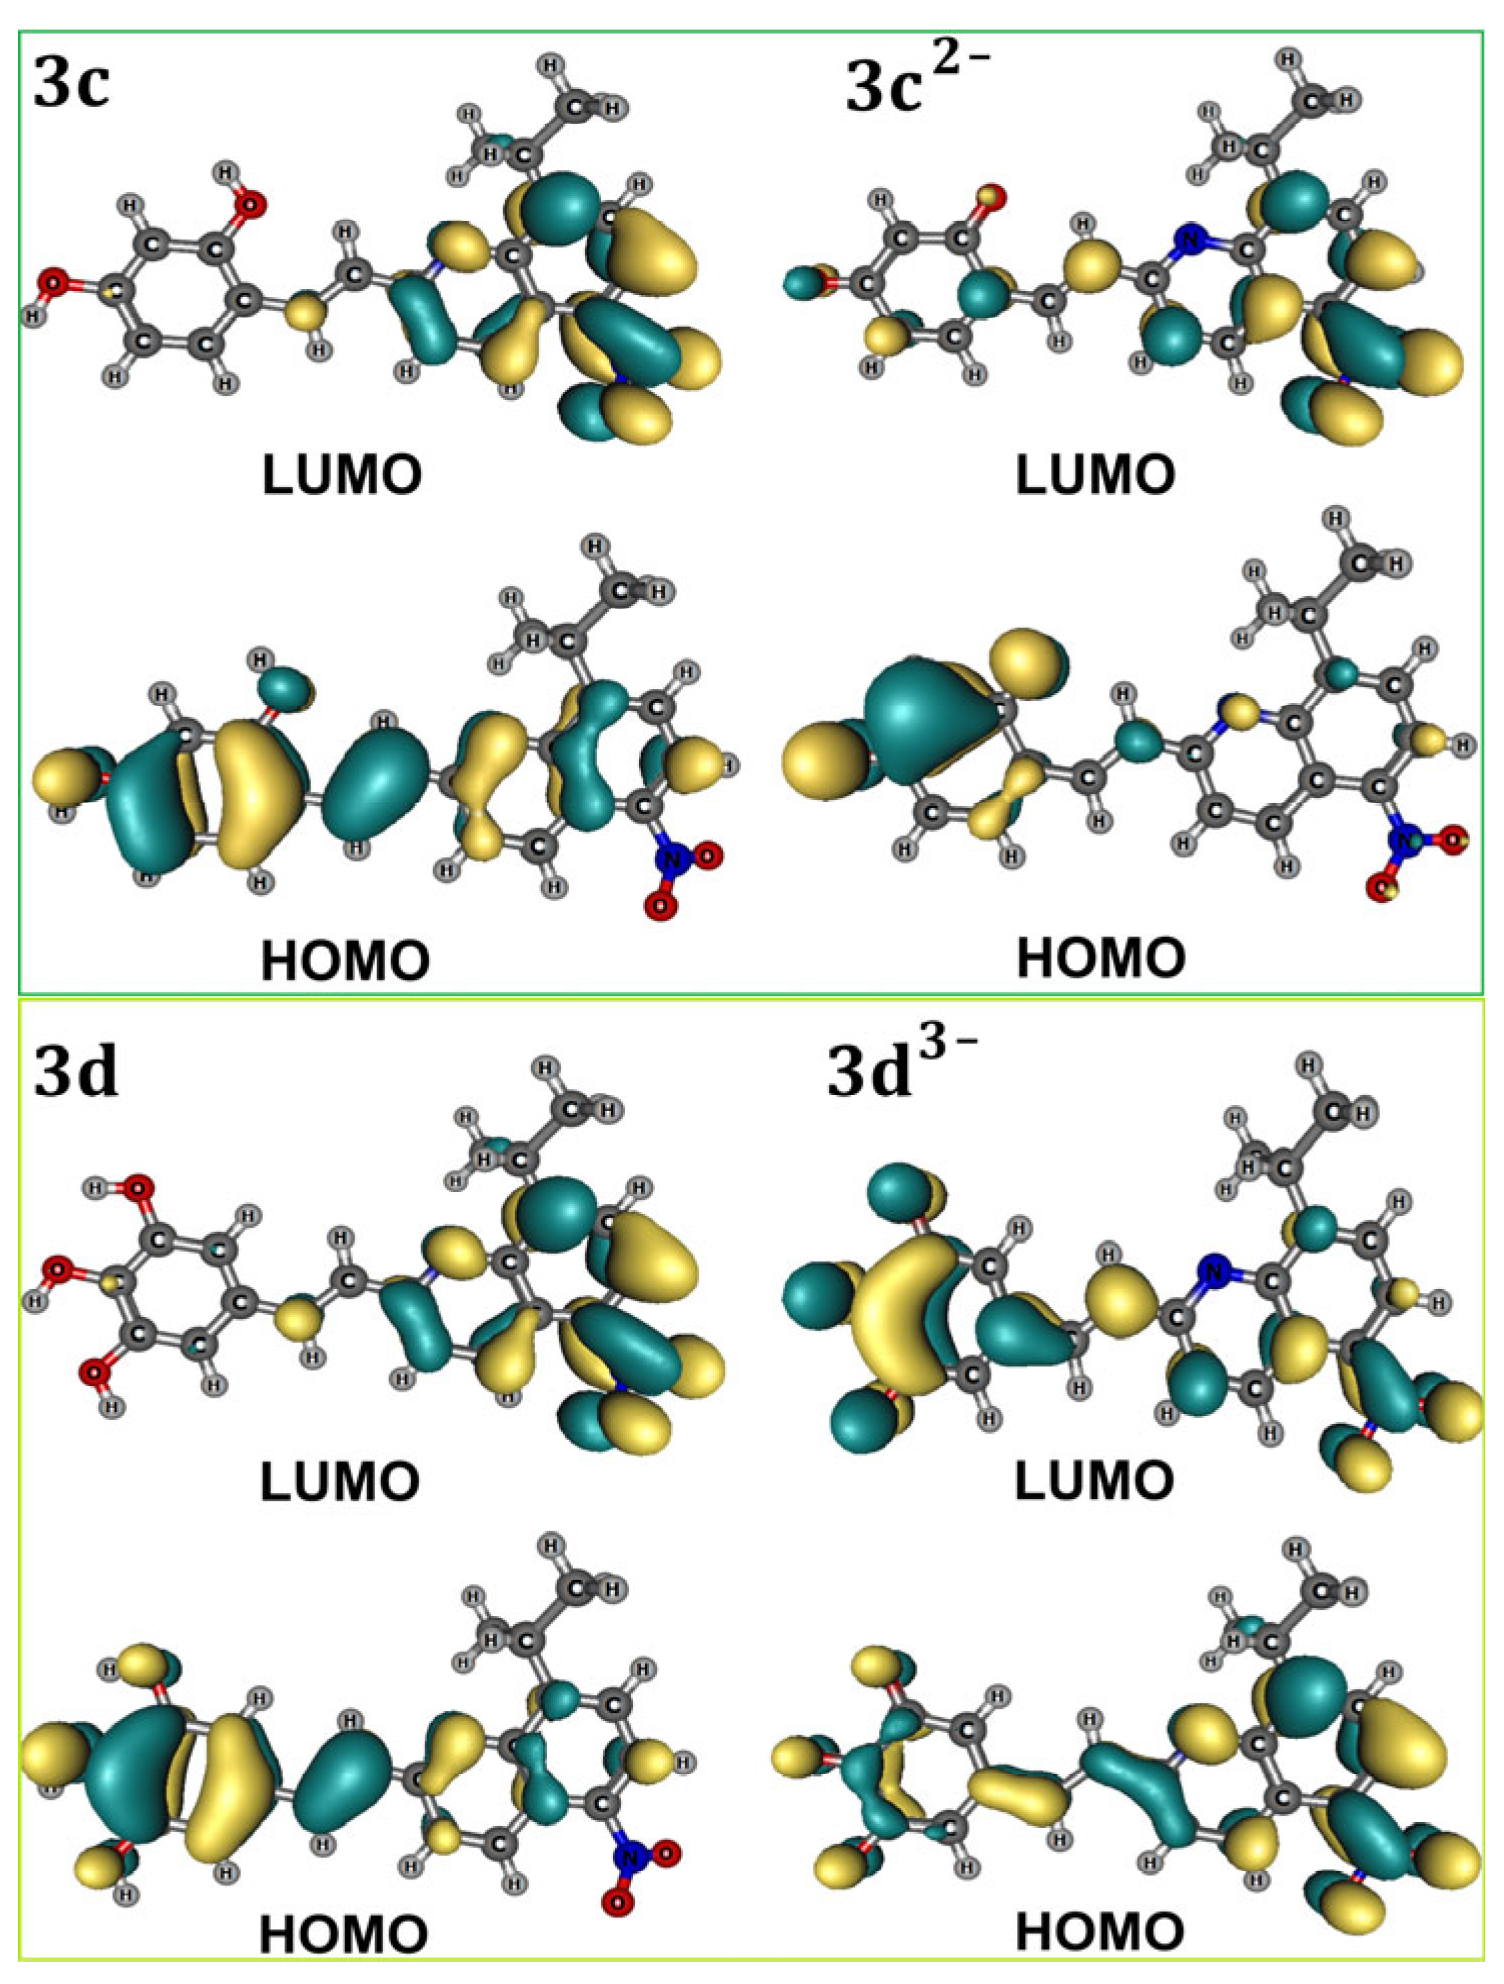
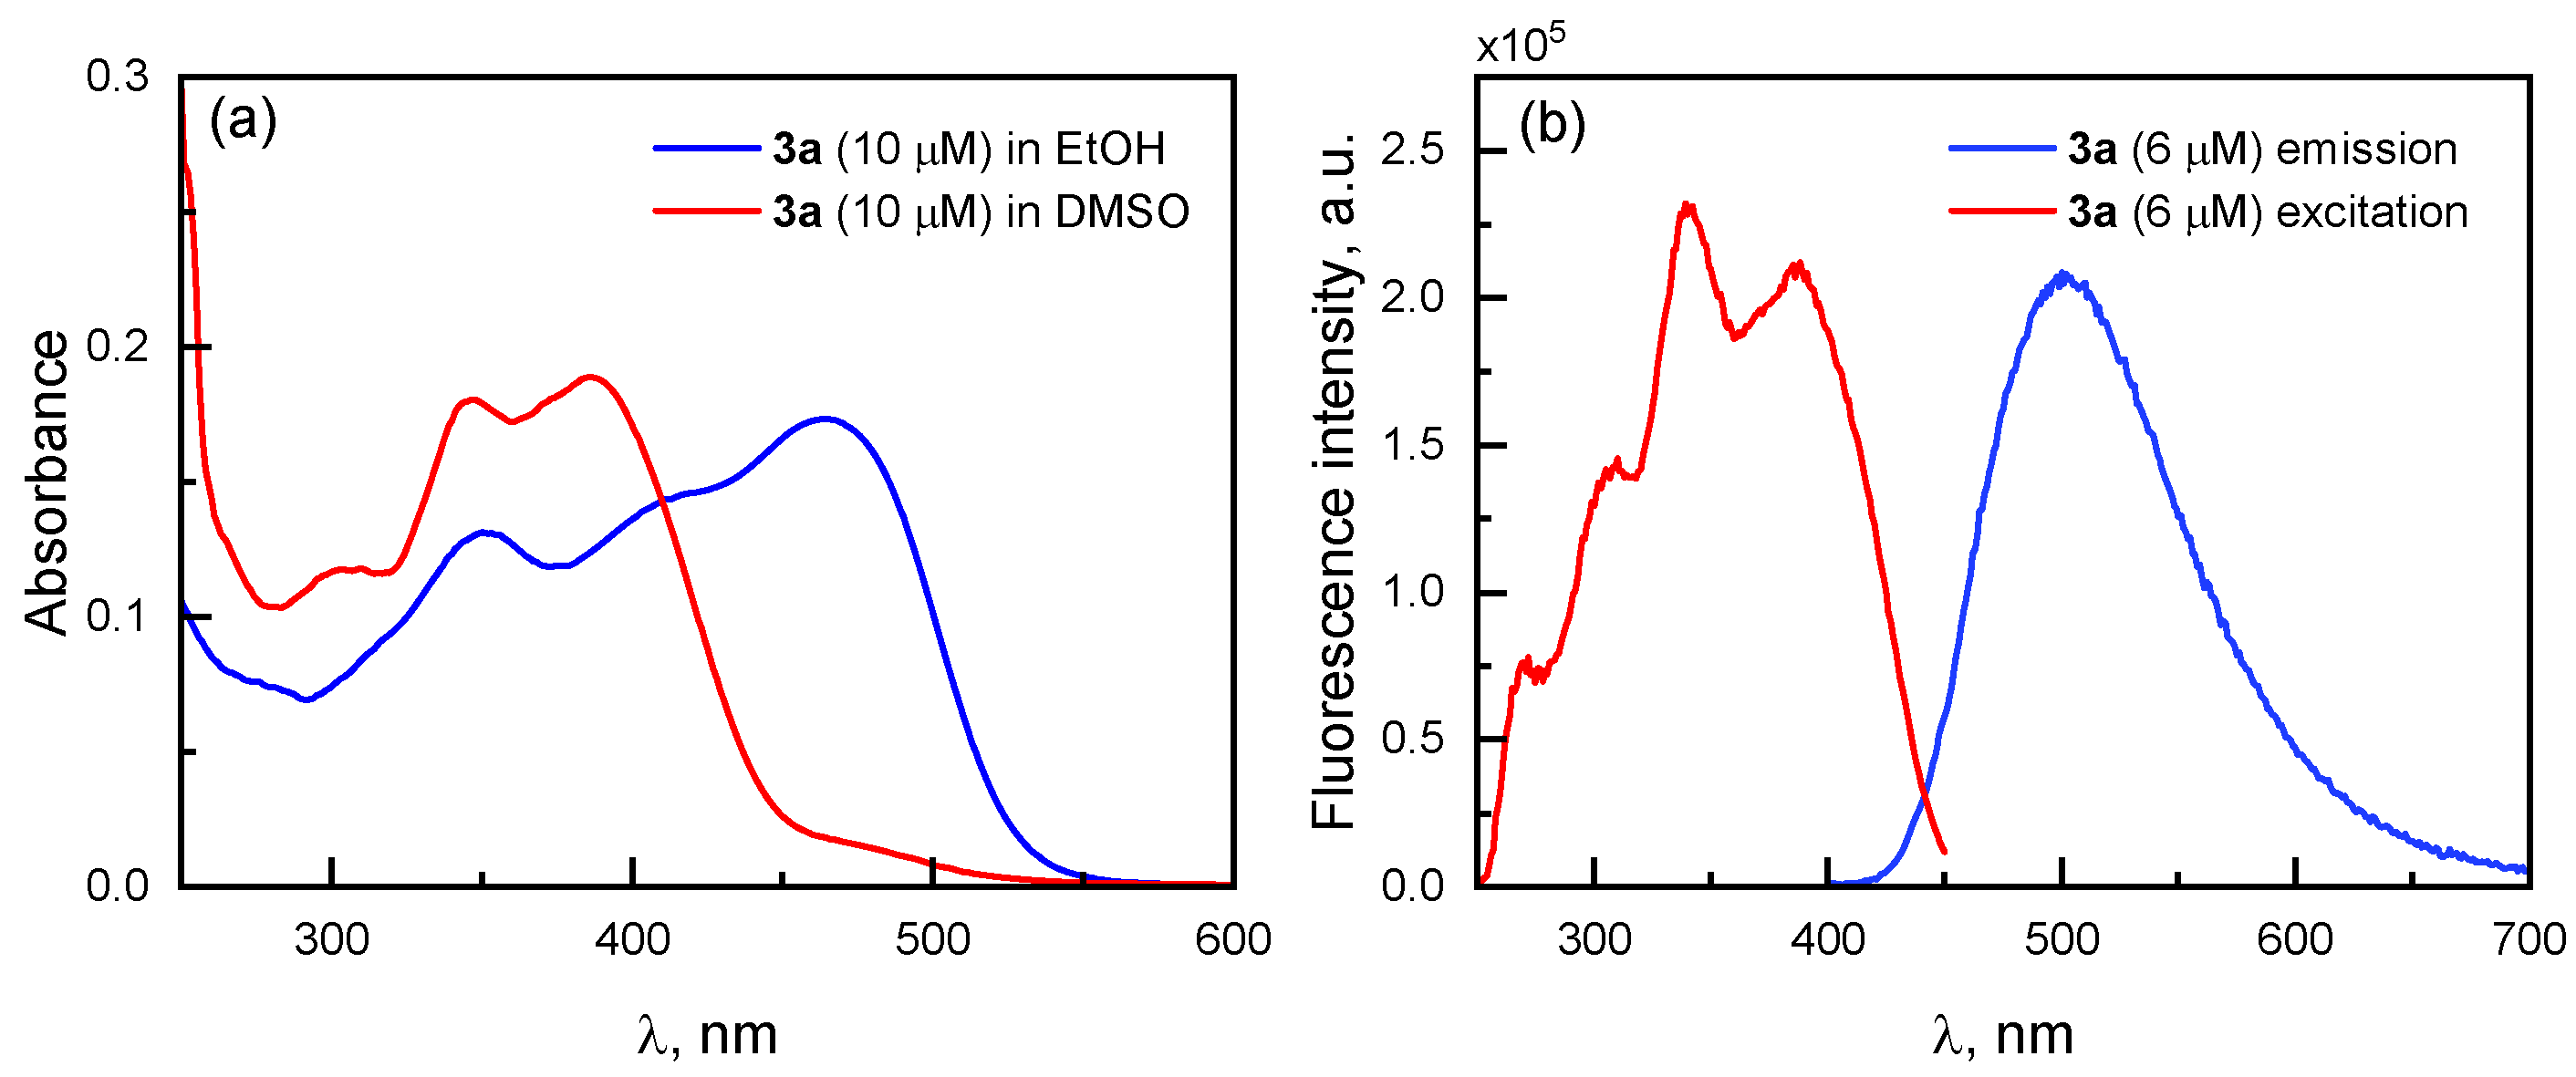
2.5. Spectroscopic Characterizationof the Phenanthroline Derivative 3a and of the Quinoline Derivatives 3c and 3d

The derivatives 1,10-phenanthroline (3a) and quinolines (3c and 3d) were spectroscopically characterized, and their photoluminescence properties, such as absorption maximum, molar extinction coefficient, excitation, emission, and luminescence decay time, were investigated. The data obtained are summarized in Table 3 and Tables S1–S3. In addition, the optimized geometries using different functionals, absorption, excitation, and emission spectra of the studied compounds 3a, 3c,and 3d are presented in Figure 6, Figure 7, Figure 8, Figure 9 and Figure 10 and Figures S3–S5. The 1,10-phenanthroline derivative (3a) shows two absorption bands in ethanol (463 nm and 351 nm) and dimethylsulfoxide (DMSO) (387 nm and 346 nm) and exhibits fluorescence with an emission maximum in the 500–550 nm range (Table 3).
The solvent’s polarity significantly affects the spectroscopic properties of compound 3a, with a bathochromic shift in the absorption and emission maxima observed as the solvent polarity decreases, indicating that the excited state of 3a is stabilized more effectively in less polar solvents. In ethanol, 3a shows the emission peak at 550 nm, resulting in a moderate Stokes shift of 87 nm. This indicates minimal structural reorganization between the ground singlet state (S₀) and the first excited singlet state (S₁), which is confirmed by quantum-chemical calculations (Figure S2); 3a efficiently relaxes from the S₁ state to the S₀ state before emission. In DMSO, the emission peak shifts to 500 nm, reducing the emission wavelength and increasing the Stokes shift to 113 nm. This larger shift reflects solvent polarity effects, as DMSO stabilizes the excited state differently than ethanol. Depending on the solvent used, the fluorescence quantum yield (Φf) of compound 3a ranges from less than 1% to 8.17%. The obtained fluorescence intensity decays were fitted by biexponential and triexponential models for DMSO and EtOH, respectively (Figure S7). In ethanol, the excited-state lifetime of 3a is 2.75 ns, consistent with weak fluorescence. In DMSO, the lifetime decreases to 0.99 ns despite the higher Φf. This indicates faster decay pathways in DMSO due to a more stabilized S₁ state and enhanced radiative decay rates. The noticeable shifts in absorption and emission maxima for 3a with changes in solvent polarity demonstrate its solvatochromic behavior, making it potentially useful for sensing applications.
The quinoline derivative (3c) has an absorption band with a near-ultraviolet maximum at 350 nm in methanol and 362 nm in DMSO, with slightly higher ε values than 3a. The presence of a third hydroxyl group in the benzene ring of the quinoline derivative (3d) did not cause any significant changes in the absorption spectra in the presence of MeOH and DMSO (Figure 6).
The quantum-chemical time-dependent (TD) DFT/B3LYP/6-31G(d,p) calculations of the absorption spectra for the trans and cis rotamers of 3c and 3d in DMSO confirm the experimental observations, with absorption maxima in the near-UV region calculated at 364 nm for 3c and 366 nm for 3d in the convolution profiles (Figure 7). This band corresponds to the HOMO→LUMO+1 transition for both trans and cis forms of 3c and 3d (Tables S1 and S2). The first low-intensity S0→S1 transition is due to HOMO→LUMO configuration and was calculated at 474 nm (f =0.1051) for trans3c, 482 nm (f = 0.0283) for cis3c, 476 nm (f =0.1078) for trans3d, 467 nm (f =0.0699) for cis3d (Table S2).
The alkaline environment strongly affects the electronic charge distribution of 3c and 3d, as can be seen from the UV-Vis spectra (Figure 6), as the hydroxyl groups deprotonate to form phenolate anions. For the two hydroxyl groups in the structure of compound 3c, a shift in the absorption maximum towards longer wavelengths is observed (Figure 6), since the two phenolate anions increase the charge delocalization in the aromatic system, thus reducing the energy difference between HOMO and LUMO. In contrast, in the case of three ionized hydroxyl groups, there is an excessive accumulation of negative charge, leading to a destabilization of the excited state and an associated increase in the difference between HOMO and LUMO. The effect is a shift in the absorption maximum towards shorter wavelengths (Figure 6).
The frontier molecular orbitals (FMO) of 3c and 3d and their ionized anionic forms 3c2− and 3d3− are presented in Figure 8. For the neutral 3c and 3d, the HOMO is mainly delocalized over the conjugated aromatic system with additional electron density extending to the hydroxyl groups. This reflects the π-conjugation across the whole system of 3c and 3d involving electron-donating hydroxyl groups. The LUMO is localized on the quinoline fragment and extends to the electron-withdrawing nitro group, which reflects its ability to accept electron density in electron-deficient (electrophilic) regions of the molecule (Figure 8). Such spatial separation between the HOMO (on electron-rich region) and LUMO (on electron-deficient region) suggests a pronounced intramolecular charge transfer (ICT) character in the excited state for neutral molecules of 3c and 3d.
After deprotonation of both hydroxyl groups in 3c, the HOMO becomes significantly more localized, with electron density strongly concentrated on the negatively charged oxygen atoms. In contrast, the LUMO exhibits a broadened distribution across the molecular system of 3c2, primarily extending over the electron-deficient nitro group, as well as the quinoline core and phenolate ring. This spatial extension of the LUMO reflects enhanced charge delocalization in the 3c2− excited state. The increased separation of charge between the localized HOMO and delocalized LUMO reduces the HOMO-LUMO energy gap and improves the ICT. This decrease in excitation energy correlates directly with the experimentally observed red shift in the UV-visible absorption spectrum of 3c2– compared to the neutral 3c.
For the three ionized hydroxyl derivative of 3d, the HOMO becomes more localized, and its electron density is asymmetric due to the excess negative charge from the deprotonated phenolate groups (Figure 8); this leads to destabilization of the HOMO energy level. The LUMO also undergoes a significant dual localization effect, being concentrated on the ionized hydroxyl group and the electron-withdrawing nitro group (Figure 8). Such spatial distribution, which is affected by the Coulomb repulsion and the altered electrostatic potential throughout the molecular system, leads to a more destabilized LUMO than the HOMO. This localization effect affects the orbital overlap and the nature of electronic transitions, contributing to the observed blue shift in the experimental absorption spectrum of 3d in the alkaline environment.
Quinoline derivatives 3c and 3d with the nitro group do not exhibit photoluminescent properties that are typical for nitroaromatic compounds due to the nitro group effect, which introduces non-radiative decay mechanisms and distorts the electronic structure [37,38,39,40,41].
For a detailed analysis of the observed spectrum of 3a in Figure 9, we performed TD DFT calculations of vertical electronic transitions simulated in DMSO for six rotamers 16, which can coexist and affect the absorption and emission spectra of 3a. The weak absorption observed experimentally in the 520–430 nm region in Figure 9a corresponds to the S0→S1 transitions calculated at 428 nm for trans rotamer 1 (oscillator strength, f = 0.3689), 422 nm for trans rotamer 2 (f = 0.5993), 433 nm for cis–transrotamer 3 (f = 0.1561), 414 nm for cis rotamer 4 (f = 0.0838), 444 nm for cis rotamer 5 (f = 0.0637), and 395 nm for cis rotamer 6 (f = 0.2308). Among these, the trans rotamer 2 makes the largest contribution to this absorption. For rotamers 13, the S0→S1 transition predominantly involves the HOMO→LUMO excitation, whereas for rotamers 46, it involves a mixture of HOMO→LUMO and HOMO−1→LUMO transitions (Figure 5).
The observed absorption band at 387 nm in DMSO (Table 3, Figure 9a) is well reproduced by the TDDFT-calculated convolution line (black line in Figure 10) with a maximum at 383 nm. This band (383 nm) has a complex nature and corresponds to the absorption mainly from the trans rotamers 1 and 2, with a minor contribution from the cis–trans rotamer 3, and the cis rotamers 46 (Figure 10). For the trans rotamers of 3a, this absorption arises from the S0→S2 transition calculated at 385 nm for rotamer 1 and 382 nm rotamer 2 (Figure 10). The observed absorption band at 346 nm (Figure 9a, Table 3) corresponds to the calculated maximum at 335 nm in the convolution line (Figure 10). This band arises mainly from transition S0→S4 at 346 nm of trans rotamer 2 and transition S0→S5 at 332 nm of trans rotamer 1, with trans rotamer 2 being the major contributor.
The fluorescence of 3a corresponds to the S₁→S₀ transition from the LUMO to the HOMO and was calculated for rotamers 16. The emission maxima were found at 527 nm (f = 0.5685) for trans rotamer 1, 521 nm (f = 0.8771) for trans rotamer 2, 568nm (f = 0.1271) for cis–trans rotamer 3, 539nm (f = 0.1578) for cis rotamer 4, 536nm (f = 0.2937) for cis rotamer 5, 525nm (f = 0.5939) and for cis rotamer 6 (Table S3). These results confirm that all six rotamers 16 contribute to the emission profile, with trans rotamer 2 showing the most intense fluorescence due to the highest oscillator strength.

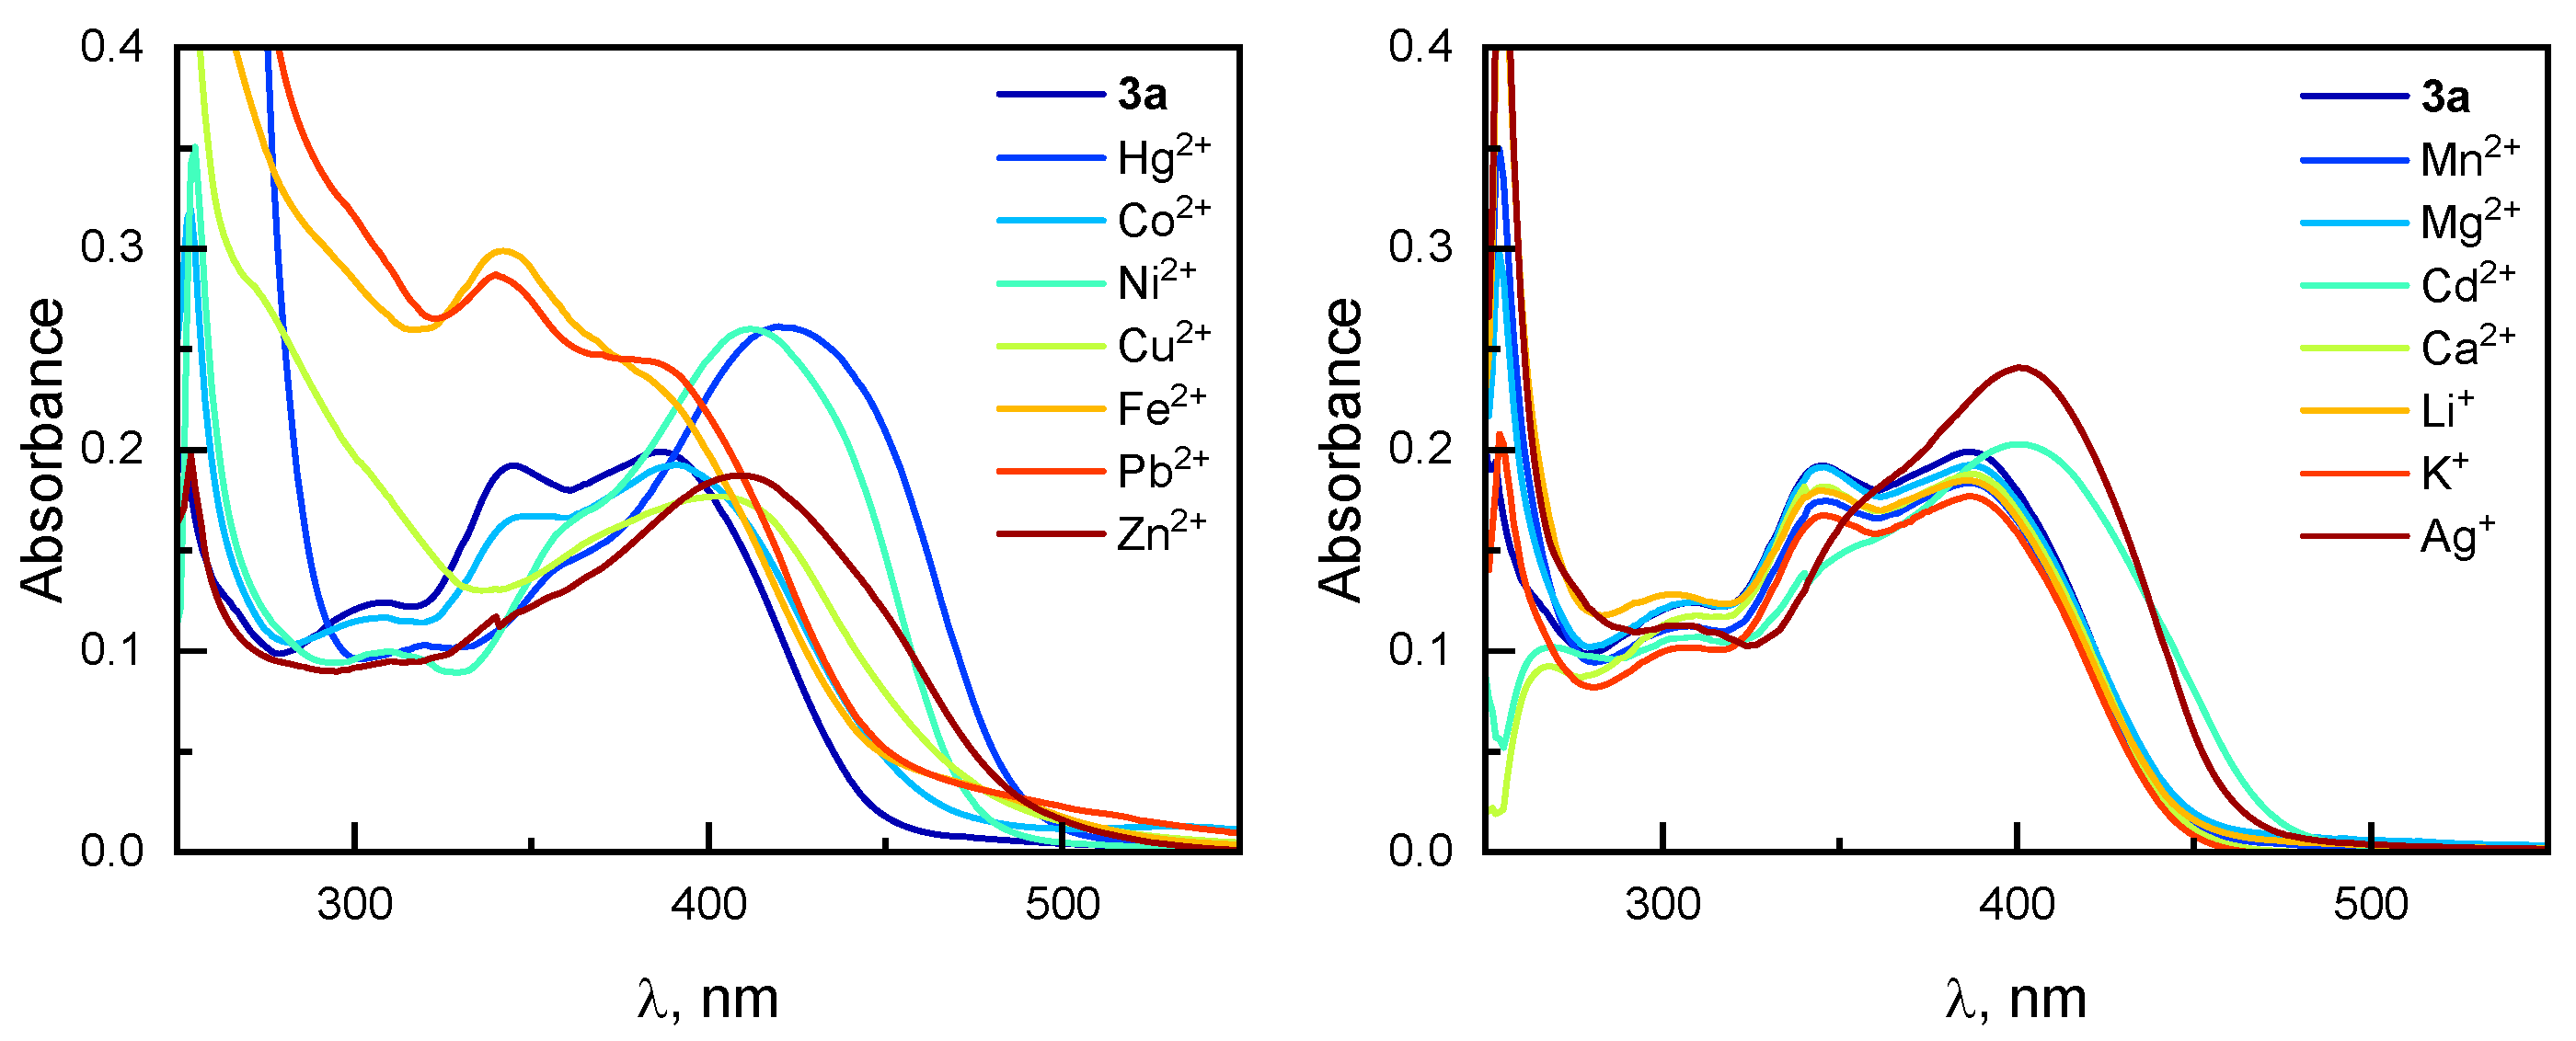
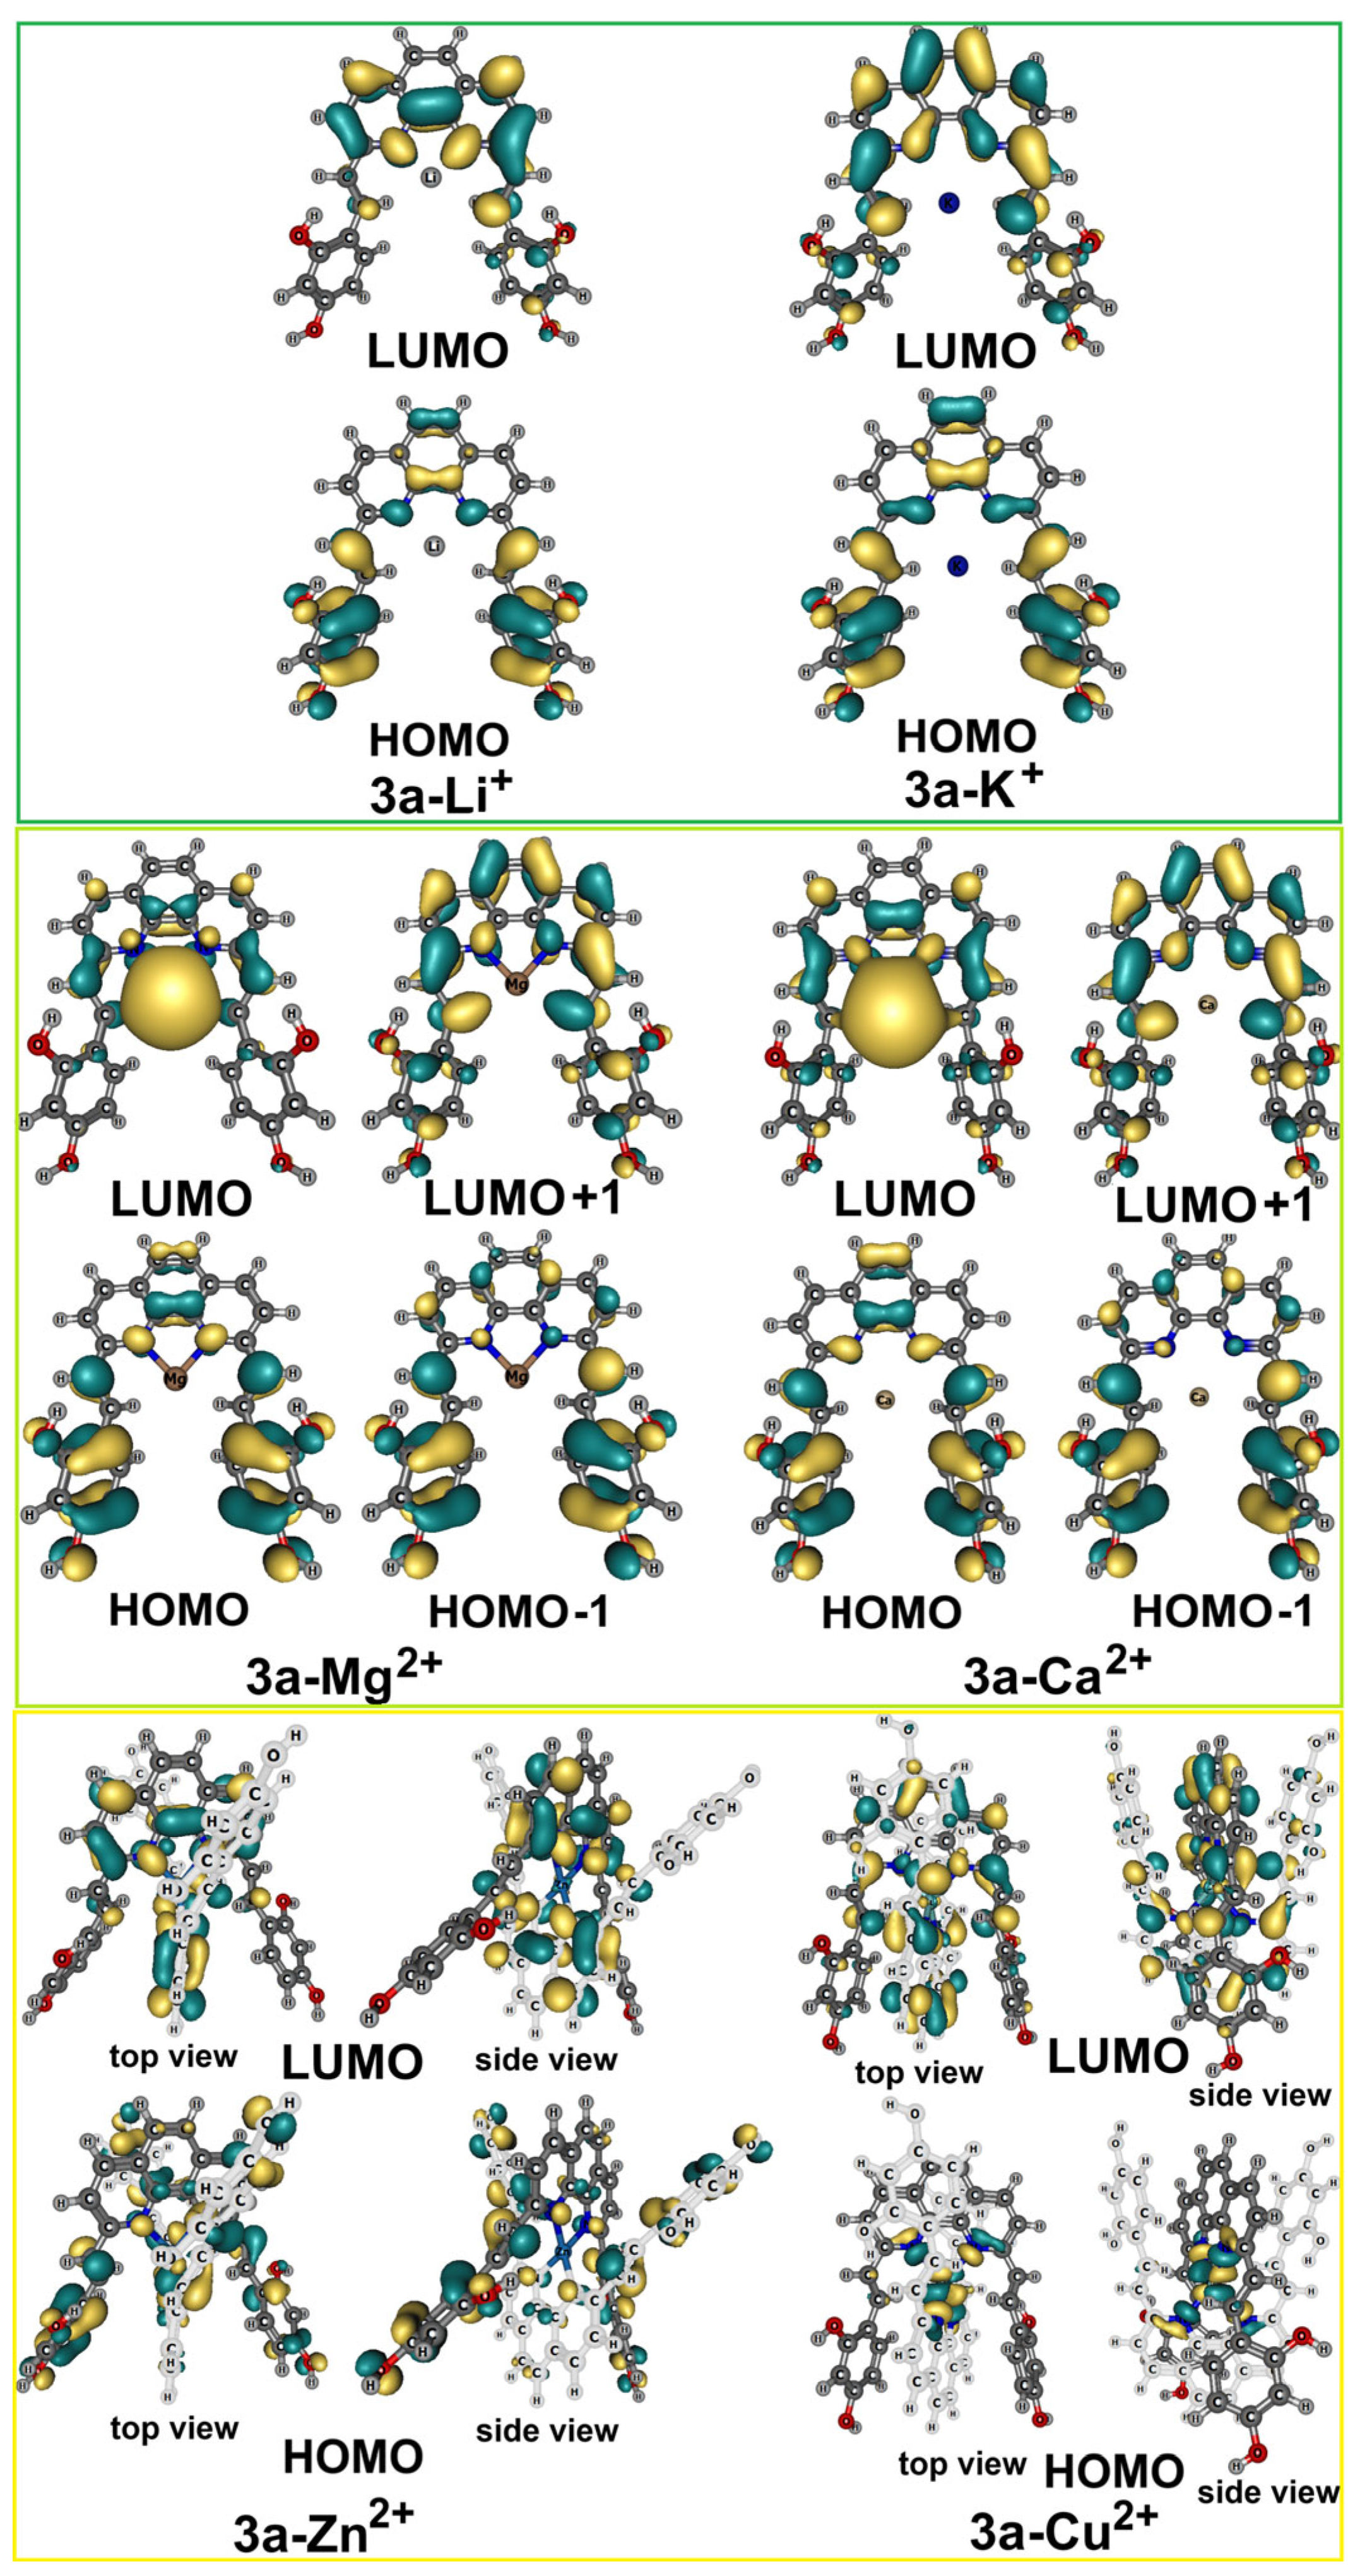
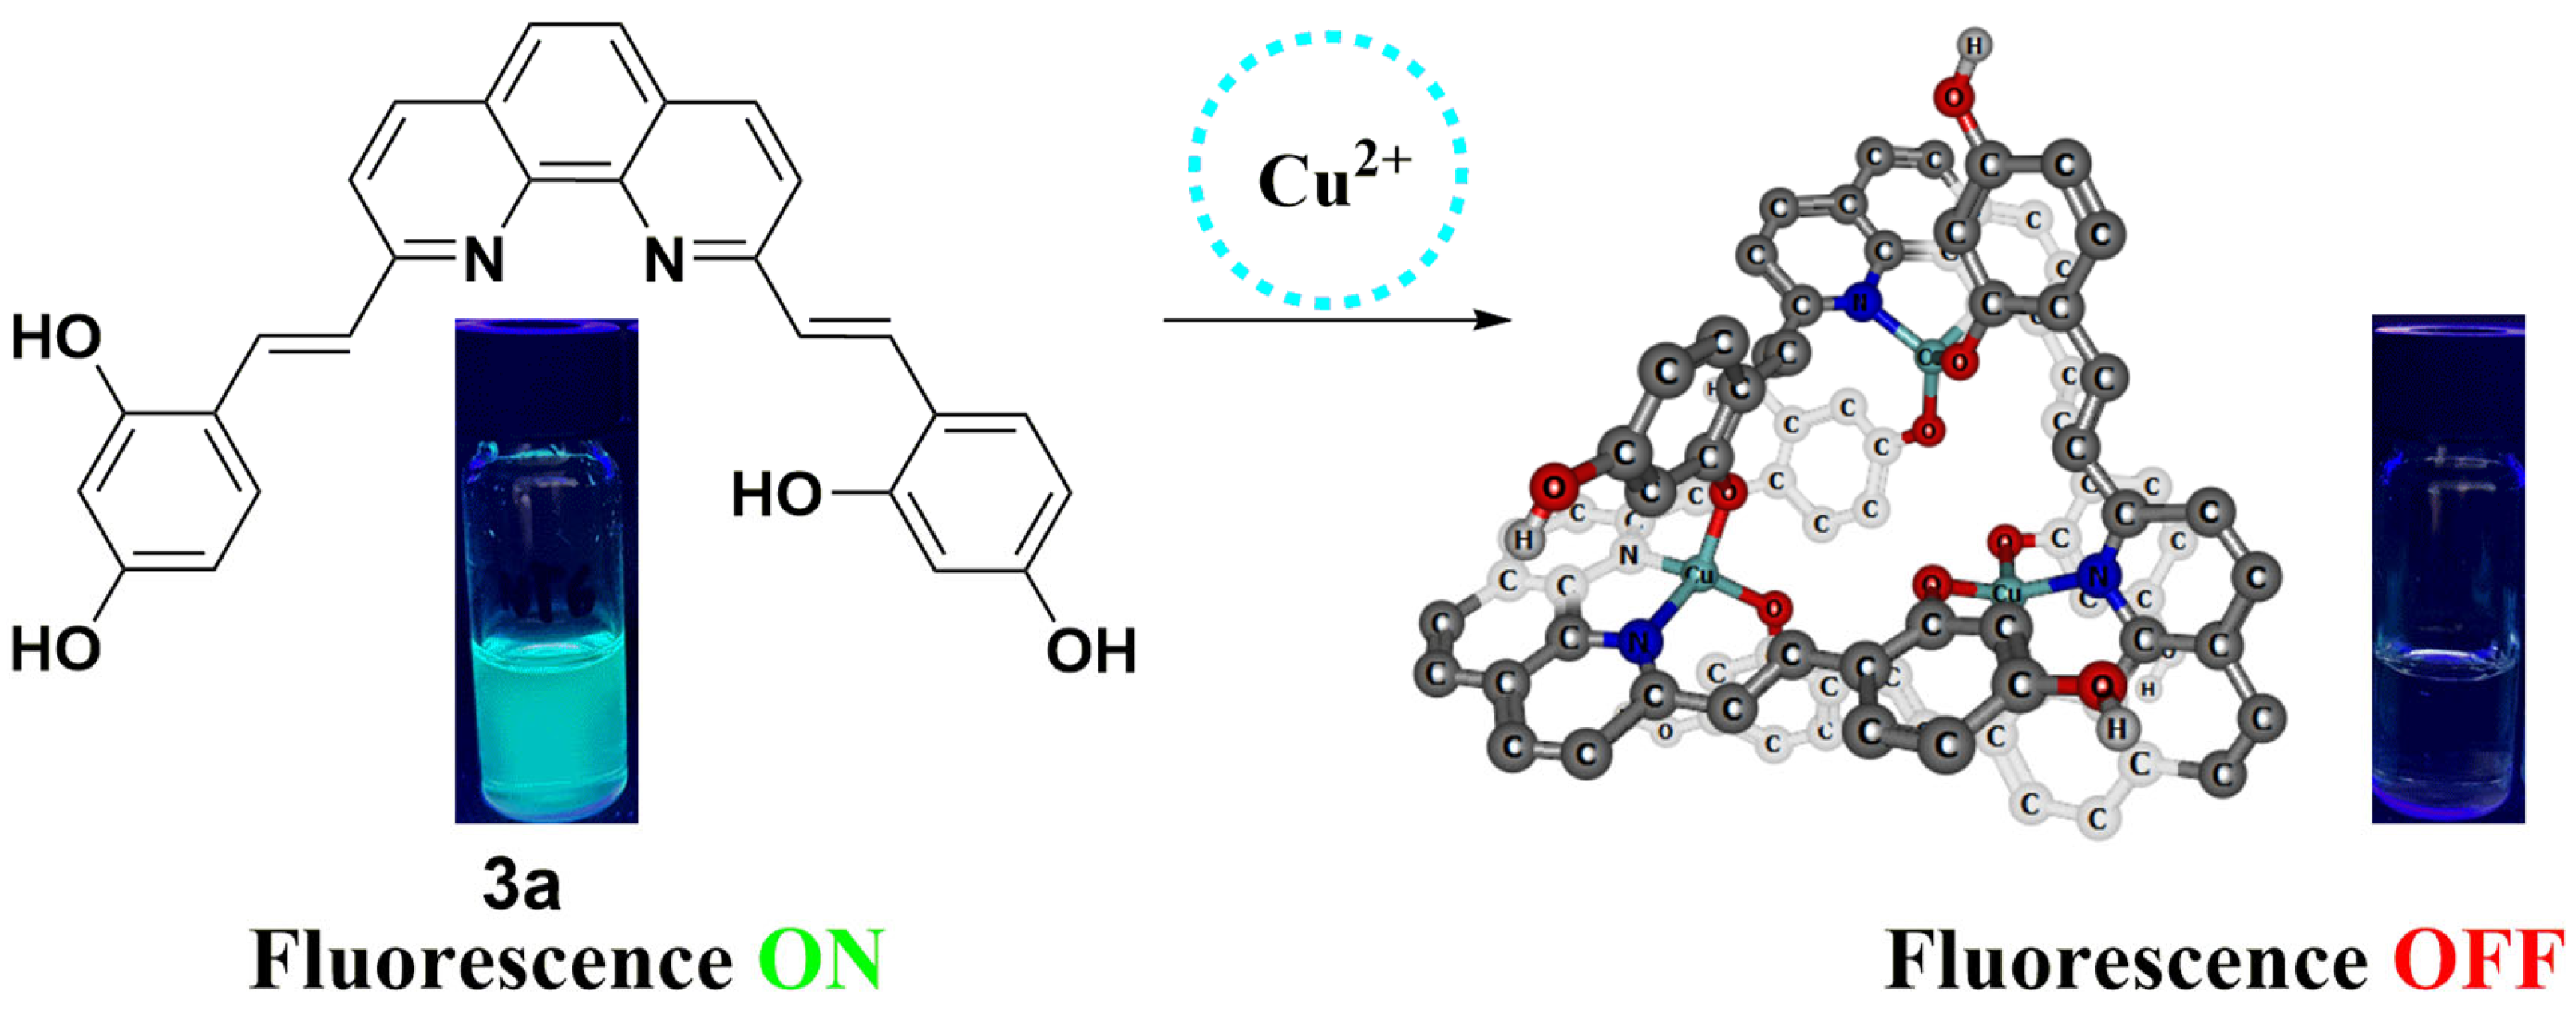
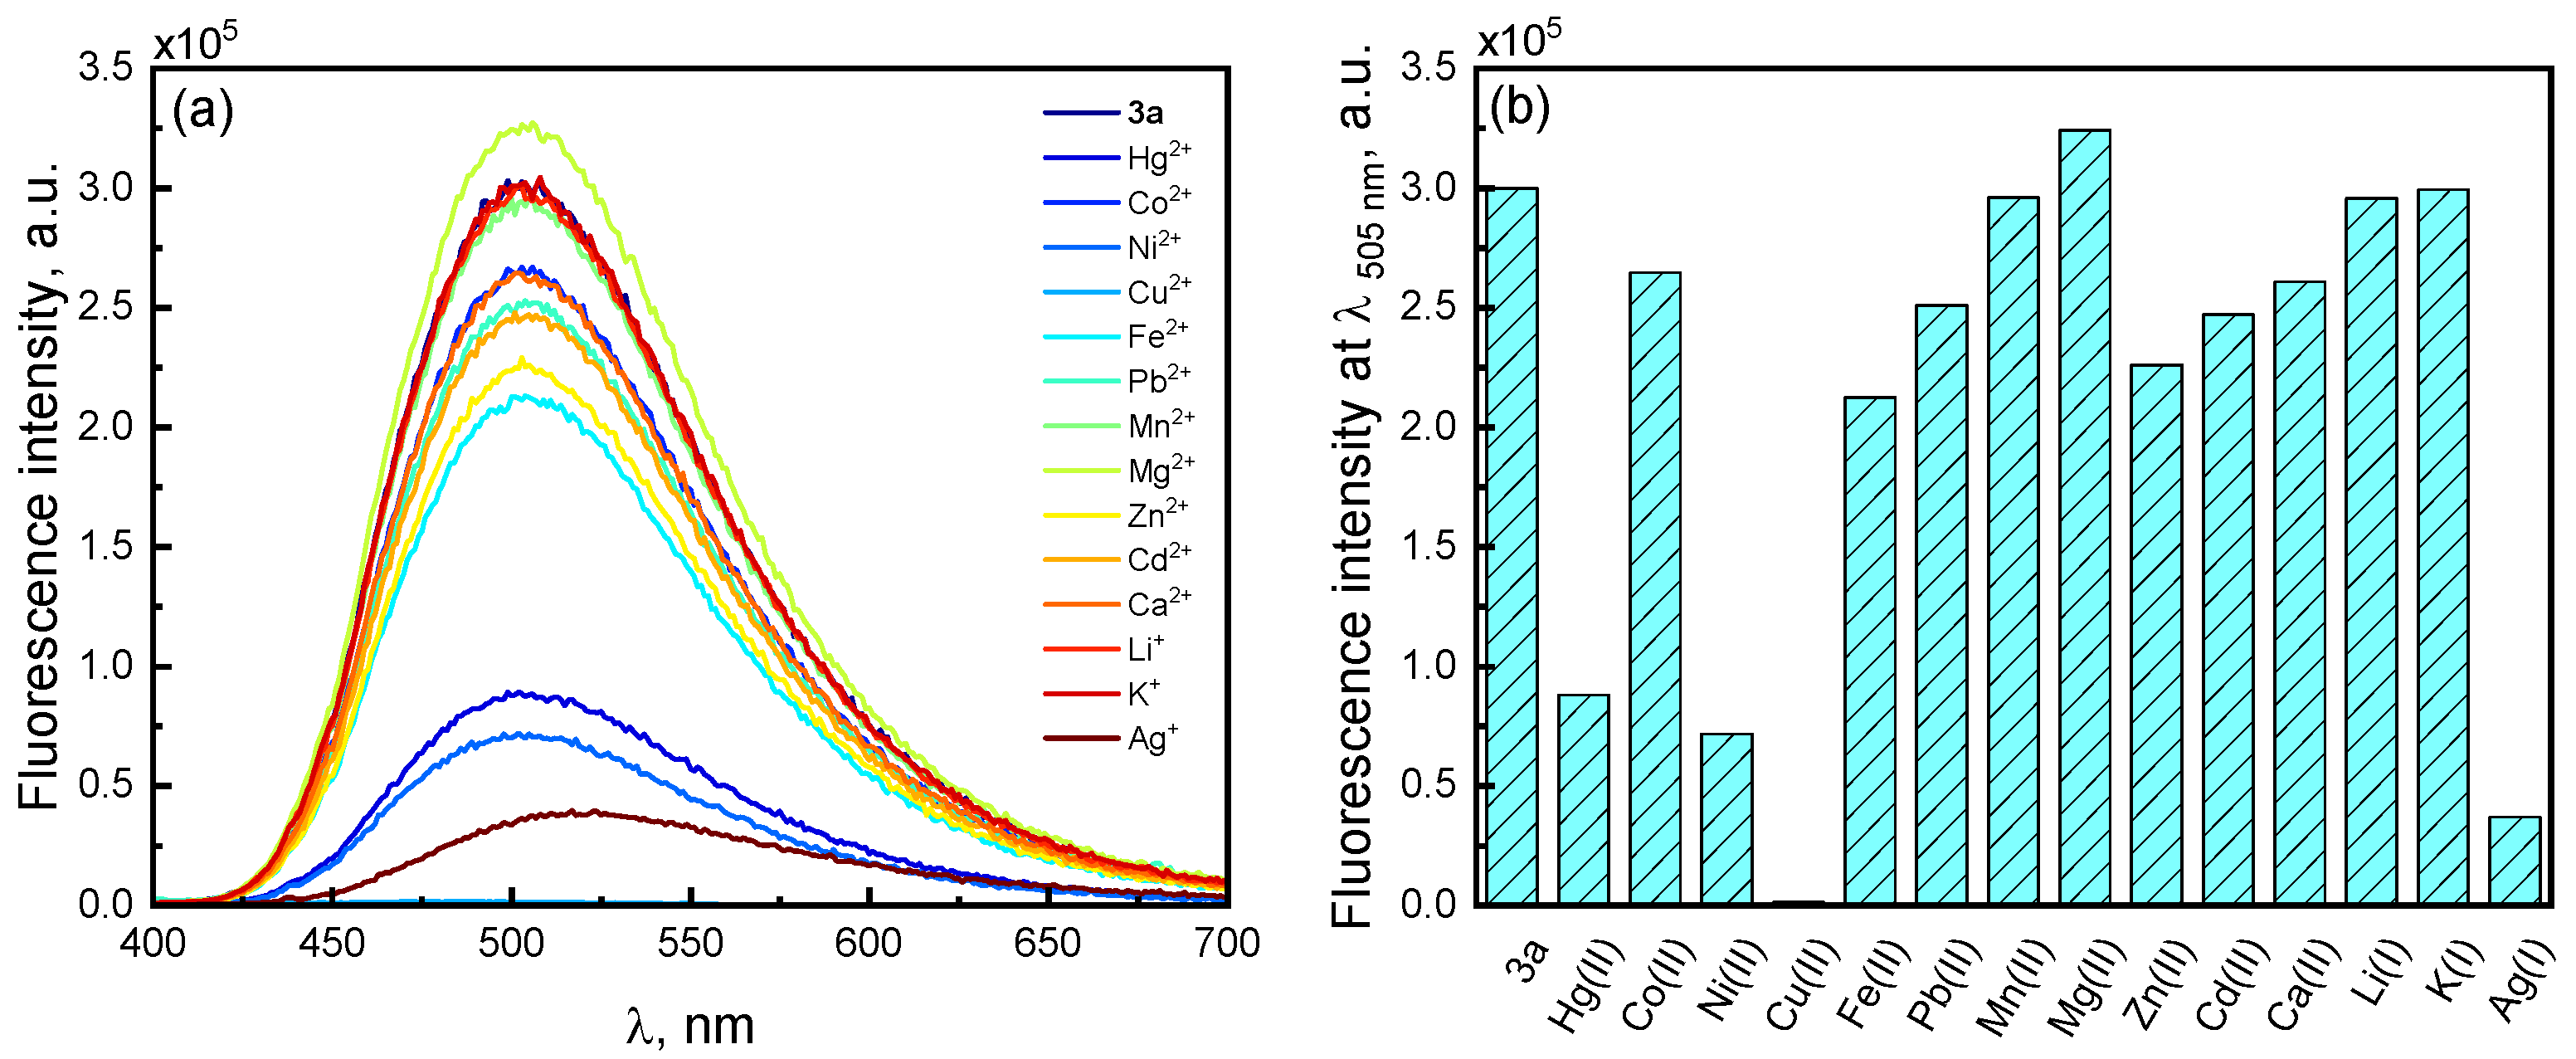
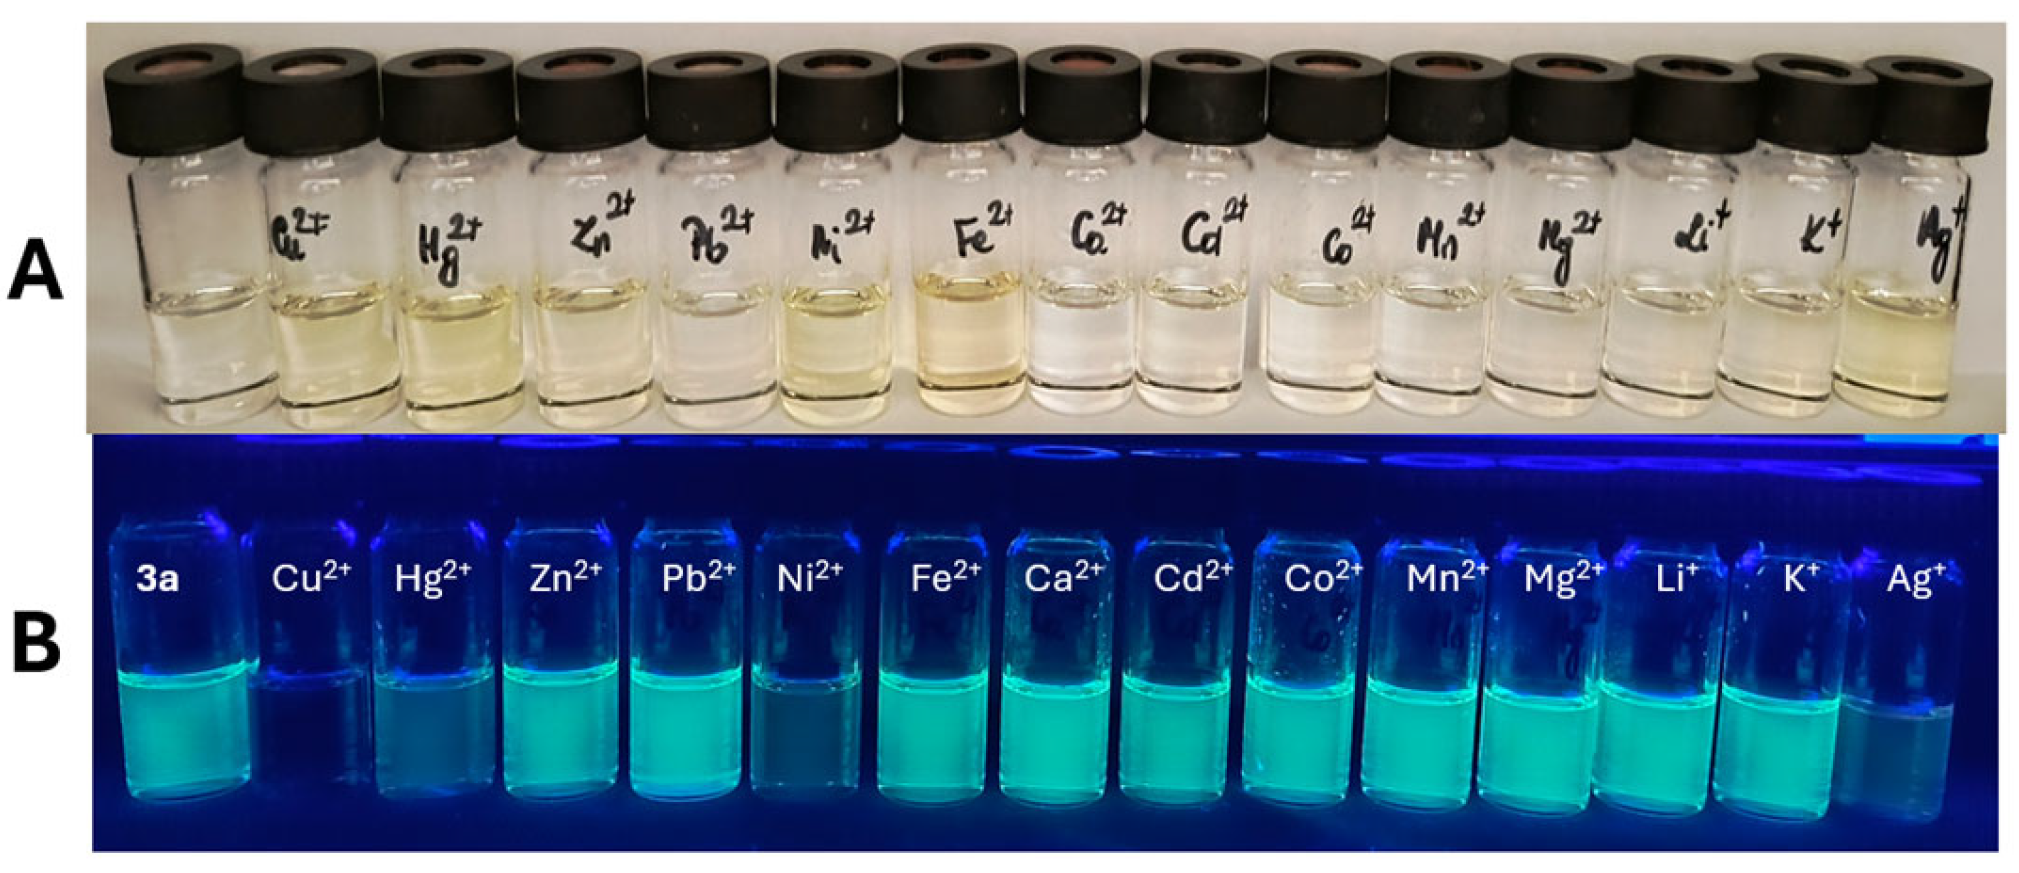
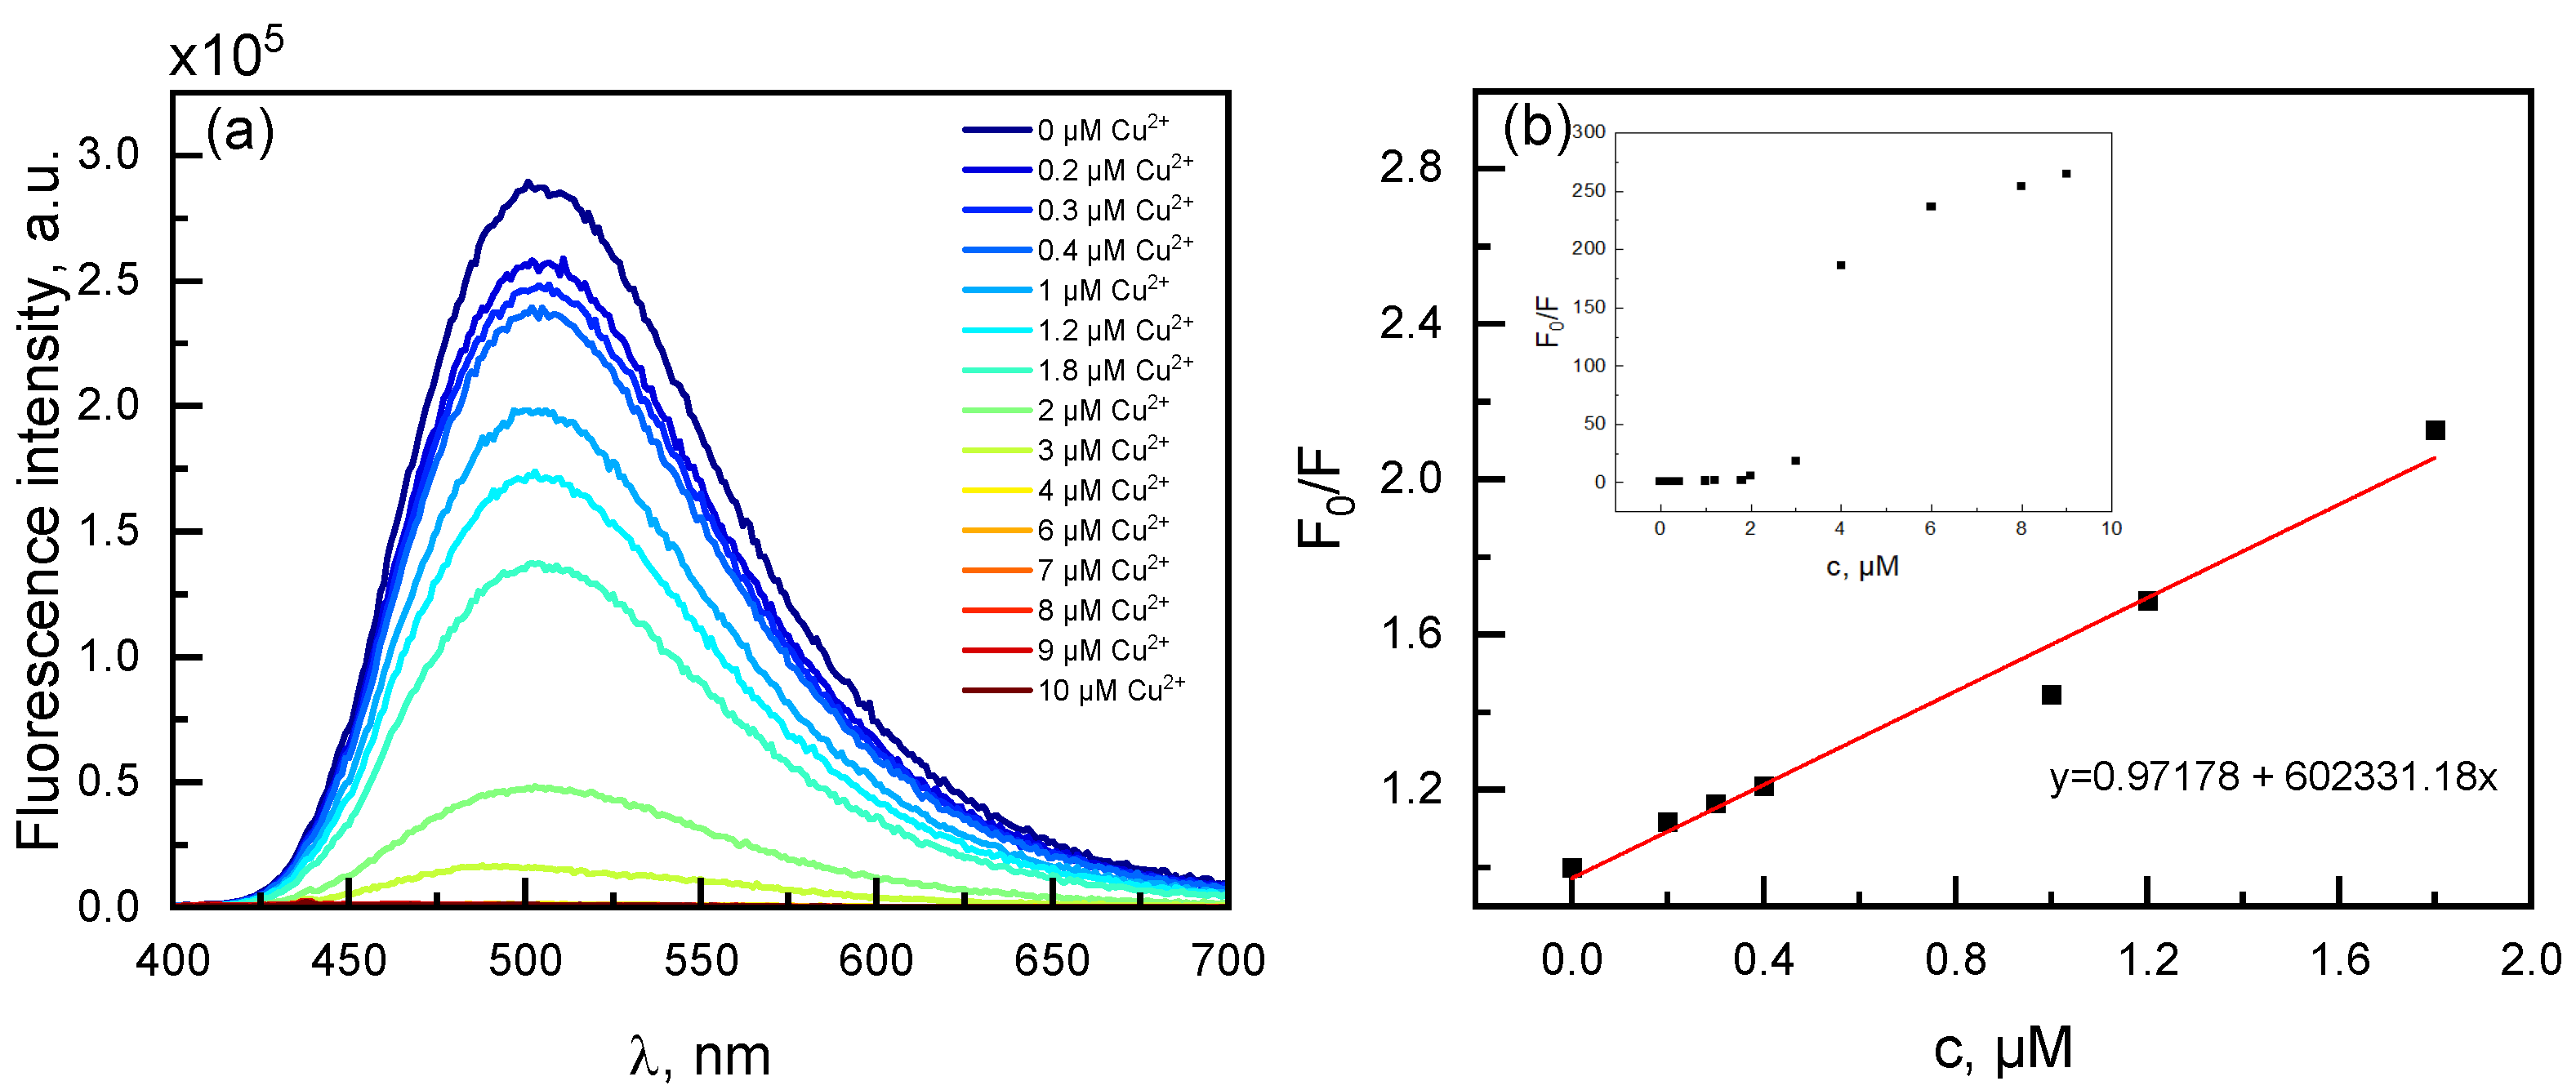
2.6. Spectroscopic Evaluation of Phenanthroline Derivative 3a Towards Metal Ions

The chemical reactivity of chemical probe 3a towards different ions was measured in a DMSO: H2O (9:1, v/v) solution using colorimetric and fluorimetric methods. A number of changes were observed in the absorption spectra in the presence of test ions, as shown in Figure 11. Chemical probe 3a shows characteristic absorption peaks at 345 and 386 nm, which are shifted towards longer wavelengths (bathochromic effect) and enhanced absorption intensity (hyperchromic effect) in the presence of Hg2+, Ni2+, and Ag+ ions. Only a bathochromic shift in the absorption maximum is observed for Cd2+ and Zn2+ ions. However, a shift in the maximum towards shorter wavelengths, combined with a hyperchromic effect, is observed for Fe2+ and Pb2+ ions. In contrast, Cu2+ ions show a bathochromic shift with a decrease in absorption intensity (hypochromic effect).
The bathochromic shift in spectra of complexes of 3a with Hg2+, Ni2+, Ag+, Cd2+, Zn2+, and Cu2+ is due to the stabilization of the LUMO energy level, which reduces the HOMO-LUMO energy gap and thus lowers the energy of electronic transitions. This shift is influenced by the electronic properties of the metal ions, including their charge density, coordination behavior, and ability to participate in π-bonds or accept electron density from a ligand. For example, as shown in Figure 11, the absorption spectra of 3a and its complexes with Li+, K+, Mg2+, and Ca2+ ions are nearly identical, i.e., there are no significant shifts in band positions or changes in spectral shape. These experimental data are supported by TDDFT calculations using the B3LYP/6-31G(d,p) method performed for the most stable trans-isomer of 3a with Li+, K+, Mg2+, and Ca2+ ions (Figure S6). For the complexes 3a-Li+ and 3a-K+, the first absorption band, calculated in the 450–420 nm range, corresponds to the S0→S1 transition and arises from a single HOMO→LUMO excitation, similar to the free trans-isomer of 3a. In contrast, for the divalent metal complexes 3a-Mg2+ and 3a-Ca2+, the S0→S1 transition exhibits mixed character, arising predominantly from the HOMO→LUMO+1 with an additional HOMO−1→LUMO contribution (Figure 12). This orbital mixing reflects the influence of Mg2+ and Ca2+ coordination on the electronic structure of 3a, through electrostatic interaction and polarization effects rather than direct involvement of the metal orbitals in the π-π* system.
Similar spectral profiles suggest that the coordination of these metal ions does not substantially change the electronic structure of 3a, which indicates the absence of effective electronic interaction between the Li+ or K+ metal cations and the π-system of 3a orweak complexation in the case of Mg2+ and Ca2+ cations. Such behavior is typical of electronically inert ions that form complexes without significant orbital overlap with the ligand (Figure 12). For the 3a-Li+, 3a-K+, 3a-Mg2+ and 3a-Ca2+ complexes, the HOMO is localized on the OH-substituted benzene fragments, vinyl groups, and particularly involves phenanthroline moiety. The LUMO for 3a-Li+ and 3a-K+ complexes and LUMO+1 for 3a-Mg2+ and 3a-Ca2+ complexes is concentrated on a phenanthroline core (Figure 12). The molecular orbitals (MOs) involved in the electronic transitions of 3a-Li+, 3a-K+, 3a-Mg2+ and 3a-Ca2+ show a similar spatial distribution to those of the free trans-isomer of 3a (Figure 5), which explains the similarity and minimal spectral shift observed in their absorption spectra (Figure 11).
Transition metals are well known for their ability to form polynuclear complexes with chelating ligands such as phenanthroline. As suggested in Scheme 2, such coordination can lead to cage-like or extended structures. Although TDDFT calculations of absorption spectra of large polynuclear complexes are resource-intensive, we have simulated representative bidentate (3a)2-Zn2+ and (3a)2-Cu2+ complexes, where coordination involves the two nitrogen atoms from two phenanthroline units (Figure 12). These simplified systems serve to illustrate the influence of the transition metal center on the charge transport and electronic structure of the complex. For the (3a)2-Zn2+ complex, the HOMO is localized on the OH-substituted benzene rings and vinyl groups, while the LUMO is concentrated on phenanthroline core, especially around the nitrogen atoms (Figure 12). In the case of the (3a)2-Cu2+, the chelation mode facilitates metal-to-ligand charge transfer (MLCT) and/or ligand-to-metal charge transfer (LMCT) interactions. These interactions lower the energy of π→π* transitions, which contributes to the bathochromic shift in the spectrum of the (3a)2-Cu2+ complex (Figure 11). Cu2+, being a paramagnetic d⁹ metal center, introduces significant spin–orbit coupling (SOC). This SOC perturbs the electronic structure and promotes non-radiative decay pathways, like intersystem crossing and vibrational relaxation. This results in both a reduction in absorption intensity (hypochromic effect) and effective fluorescence quenching, consistent with the role of Cu2+ as a strong fluorescence quencher [42].
The fluorescence response of the derivative 3a toward various metal ions was investigated in solution to evaluate its potential as a selective chemosensor. Figure 13a presents the emission spectra of 3a in the absence and presence of different metal ions (100 μM), whereas the corresponding fluorescence intensities at the emission maximum are summarized in the bar chart (Figure 13b). Of all the tested cations, Cu2+ caused the most significant fluorescence quenching. This effect is attributed to strong coordination between Cu2+ and ligand 3a, which may involve the nitrogen atoms of the phenanthroline core and the phenolic oxygen atoms. Notably, the Ag+ ion also induced significant quenching of fluorescence, although to a lesser extent than Cu2+. This may be attributed to Ag+ forming coordination interactions with the ligand via nitrogen and/or oxygen donor atoms. Therefore, the response to Ag+ should be considered in applications where silver contamination may be relevant. Other transition metal ions, such as Fe2+, Hg2+, and Ni2+, also reduced the emission intensity to a lesser extent, indicating a moderate binding affinity. In contrast, alkali and alkaline earth metals (e.g., K+, Ca2+, Mg2+, and Li+) had a negligible influence on fluorescence. These results confirm that compound 3a exhibits high selectivity and sensitivity towards Cu2+, consistent with the Irving–Williams series [43], where Cu2+ typically forms the most stable complexes with first-row transition metal ions.
In addition, the changes observed in the absorption and emission spectra of compound 3a in the presence of various metal ions are visible to the naked eye (Figure 14A) and under UV illumination at 365 nm (Figure 14B). The results obtained suggest that compound 3a can be used as a new tool for detecting copper ions.
In the presence of the analytes tested, no changes were observed in the absorption spectra of the quinoline 3c and 3d derivatives.
The limits of detection (LOD) and quantification (LOQ) for the selected metal ions (Cu2+, Ag+, Hg2+, and Ni2+) were determined based on changes observed in the emission spectra. LOD and LOQ were calculated using the following equations, with the standard deviation of the blank signal (σ) and the slope of the calibration curve (s) substituted in
LOD = 3.3 σ/s → → LOQ = 10 σ/s
The results are summarized in Table 4, and the corresponding calibration plots of fluorescence intensity versus metal ion concentration are presented in Figure S10. The LOD and LOQ values indicate that derivative 3a exhibits the highest sensitivity toward Cu2+ and Ag+ ions, as evidenced by their significantly lower detection and quantification limits compared to Hg2+ and Ni2+. In particular, the low LOD values for Cu2+ (0.97 µM) and Ag+ (2.68 µM) suggest that derivative 3a is well-suited for the detection of these metal ions at trace levels in solution. In contrast, the markedly higher LOD and LOQ values observed for Hg2+ (28.8 µM and 87.3 µM, respectively) and Ni2+ (29.8 µM and 90.4 µM) indicate a substantially lower sensitivity toward these ions.
Further studies focused exclusively on Cu2+ ions because they caused complete fluorescence quenching of derivative 3a at the lowest concentration of all the tested metal analytes. Furthermore, Cu2+ ions yielded the lowest limits of detection (LOD) and quantification (LOQ), establishing them as the most promising analyte.
To determine whether the mechanism of fluorescence quenching of derivative 3a by Cu2+ ions is dynamic (collision) or static (complex formation), studies of the changes in fluorescence intensity of derivative 3a towards Cu2+ ions at different concentrations were carried out (Figure 15a). A Stern–Volmer plot was made from the data obtained, which was linear in the concentration range 0.2 to 1.8 µM and was described by this equation:
F0/F = 1 + KSV [Cu2+]
where F0 and F are the fluorescence intensities in the absence and presence of Cu2+, respectively, and [Cu2+] is the quencher concentration. From the slope of the linear region, the Stern–Volmer constant was determined to be KSV = 6.0 × 10¹¹ M−1 (Figure 15b).
At higher concentrations of Cu2+, a deviation from linearity was observed, with the plot exhibiting an exponential increase (see inset in Figure 15b), suggesting a change in the quenching mechanism. Such a deviation is characteristic of static quenching, likely caused by the formation of a ground-state non-fluorescent complex between 3a and Cu2+. This hypothesis is further supported by changes in the absorption spectrum (Figure 11), which are commonly associated with complex formation in static quenching [44].
To further evaluate the nature of the quenching, the fluorescence lifetime (τ) of the 3a derivative was considered. Using the Stern–Volmer constant and the known fluorescence lifetime of 3a (τ = 0.99 ns), the bimolecular quenching rate constant kq was calculated as follows:
kq = KSV/τ = 6.06 × 10²⁰ M−1s−1
This value greatly exceeds the diffusion controlled quenching rate in aqueous media (typically kdiff ≈ 109–1010 M−1s−1), clearly ruling out a purely dynamic (collisional) quenching mechanism. Therefore, the quenching observed for the 3a-Cu2+ system is best explained by a static quenching mechanism involving the formation of a non-emissive ground-state complex between 3a and Cu2+. The formation of this complex is facilitated by photoinduced electron transfer (PET) or ligand-to-metal charge transfer (LMCT) processes, wherein electron density from the donor-rich ligand system of 3a is transferred to the redox-active Cu2+ ion, effectively quenching fluorescence.
The modified logarithmic Stern–Volmer plot was used to calculate the complex formation constant between derivative 3a and Cu2+ ions (Figure S7). The obtained value of the constant was 9.73 × 10⁸ M−1, indicating the high affinity of the chemosensor for copper ions and the stability of the formed complex.
The saturation method was used to determine the stoichiometry of the complex by analyzing the dependence of the fluorescence intensity on the Cu2+ concentration (Figure S8). The maximum fluorescence quenching was observed at a Cu2+ mole fraction of 0.4, which corresponds to a molar ratio of 1:2 (3a:Cu2+). This result suggests that one ligand 3a binds two copper ions, leading to the formation of a complex with a stoichiometry of 1:2.
Based on the literature reports for polynuclear phenanthroline-metal complexes [45], we propose a cage-like coordination structure (Scheme 2), in which both the nitrogen atoms of the phenanthroline core and the hydroxyl oxygen atoms act as donor sites. The two Cu2+ ions are stabilized through bridging interactions, resulting in a rigid architecture that efficiently quenches fluorescence via static quenching.

3. Materials and Methods

3.1. Materials

All experiments were carried out in an atmosphere of dry argon, and flasks were flame-dried. Solvents were dried by usual methods (diphenyl ether, diethyl ether, and THF over benzophenone ketyl, CHCl3, and CH2Cl2 over P4O10, hexane, and pyridine over sodium-potassium alloy) and distilled. Chromatographic purification was carried out on silica gel 60 (0.15–0.3 mm, Macherey-Nagel GmbH & Co. KG, Dueren, Germany). 2,9-Dimethyl-1,10-phenanthroline (neocuproine), 2-hydroxybenzaldehyde, 2,4-dihydroxybenzaldehyde, and 3,4,5-trihydroxybenzaldehyde were purchased from Sigma–Aldrich (Poznań, Poland), and were used without further purification.

3.2. Instrumentation

NMR spectra were obtained with Avance 400 and 500 spectrometers (Bruker, Billerica, MA, USA) operating at 500.2 or 400.2 MHz (1H), 125.8 or 100.6 MHz (13C), and 470.5 MHz (19F) at 21 °C. Chemical shifts referenced to ext. TMS (tetramethylsilane) (1H, 13C), CFCl3 (19F) or using the residual CHCl3 signal (δH 7.26 ppm), and CDCl3C 77.1 ppm) as internal references, and ext. DSS for 1H and 13C-NMR, respectively. Coupling constants are given in Hz. The LCMS-IT-TOF analysis was performed on an Agilent 1200 Series binary LC system coupled to a micrOTOF-Q system mass spectrometer (BrukerDaltonics, Bremen, Germany). High-resolution mass spectrometry (HRMS) measurements were performed using a Synapt G2-Si mass spectrometer (Waters, New Castle, DE, USA) equipped with an ESI source and quadrupole-time-of-flight mass analyzer. To ensure accurate mass measurements, data were collected in centroid mode, and mass was corrected during acquisition using leucine enkephalin solution as an external reference (Lock-Spray) (Waters, New Castle, DE, USA). The measurement results were processed using the MassLynx4.1 software (Waters, Milford, MA, USA) incorporated within the instrument. A Nicolet iS50 FTIR spectrometer was used to record spectra in the IR range of 4000–400 cm−1. FTIR spectra were recorded on a Perkin Elmer (Schwerzenbach, Switzerland) spectrophotometer in the spectral range of 4000–450 cm−1 with the samples in the form of KBr pellets. Elementary analysis was performed using a Vario EL III apparatus (Elementar, Langenselbold, Germany). Differential scanning calorimetry (DSC) measurements were performed using a Q2000 calorimeter (TA Instruments, New Castle, DE, USA) in a nitrogen stream at a scanning rate of 10 °C/min. Samples were analyzed in aluminum pans in the temperature range of 50 to 350 °C. Melting points were determined on an MPA100 OptiMelt melting point apparatus (Stanford Research Systems, Sunnyvale, CA, USA) and were uncorrected. Absorption spectra were recorded using a JASCO V-670 spectrophotometer (Jasco, Japan). The determination of the molar extinction coefficient was verified by linear least squares fitting of the values obtained from five independent solutions at different concentrations ranging from 2 µmol/L to 20 µmol/L. Fluorescence spectra were measured on an FLS-920 spectrofluorometer (Edinburgh Instruments, Livingston, UK) in a 10 mm quartz cuvette. The slit width was 1.0 nm. All samples for steady-state measurements were excited in optical dilution. Absorbance values at the selected excitation wavelengths were less than or equal to 0.1.

3.3. Photophysical Measurements

The stock solutionof chemosensor3a was prepared in DMSO at a concentration of 1 mM. All cation solutions were prepared in distilled water at a concentration of 10 mM. All spectroscopic experiments were carried out in DMSO:H2O (9:1, v/v). The concentration of probe 3a was 10 µM in all spectroscopic studies. An excitation wavelength of 388 nm was used to record the fluorescence emission spectra. UV-Vis absorbance and fluorimetric experiments were performed on chemosensor3a in the presence of different ions. The concentrations were 1 mM for Hg2+, Co2+, Ni2+, Ca2+, Cd2+, Mn2+, Mg2+, Zn2+, Li+, K+, Ag+ and 0.1 mM for Cu2+, Fe2+, Pb2+. In addition, the optical properties of 3a were investigated in the presence of 0 to 10 µM Cu2+ to evaluate the performance of the chemical sensor.

3.4. Photochemical Experiments

Fluorescence quantum yields of 3a were calculated using quinine sulfate (in 0.1 M H2SO4 solution) as a standard (Φref = 0.54) [46] quantum yield was calculated accordingly to Equation (1), in which Φref is the absolute quantum yield of the reference, η is the refractive index of the solvent, and Grad is the gradient obtained from the plot of the integrated fluorescence intensity as a function of the absorbance. The subscripts s and ref refer to the sample and reference, respectively.
Φ f = Φ r e f G r a d s G r a d r e f × η s 2 η r e f 2
Fluorescence lifetime measurements were made using a time-correlated single photon counting system (TCSPC) with a pulsed picosecond LED (EPLED-380) as the excitation source. Collecting scattered light from a Ludox silica suspension measured the instrument response function. Fluorescence lifetimes were calculated from intensity decay analyses. Fluorescence decay was acquired at a level of 1 × 10⁴ counts at the peak and was fitted to a sum of exponentials:
I ( t ) = i = 1 n α i exp ( t / τ i )
with amplitudes, αi, and decay lifetimes τi. Average lifetimes (τ) for multiexponential fluorescence decay were calculated from decay times and pre-exponential factors using the following:
( τ ) = α i τ i 2 α i τ i

3.5. X-Ray Diffraction Experiments

The colorless crystals of 2a were mounted on a SuperNova 4-circle X-ray diffractometer equipped with an Atlas CCD detector and used for data collection. X-ray intensity data were collected with mirror monochromated CuKα radiation (λ = 1.54184 Å) at a temperature of 150(1) K with ω scan mode.
Controlling the measurement procedure and data reduction were performed using the CrysAlisPro software Version 1.171.38.41q [47]. The same program was used to determine and refine the lattice parameters.
The structure was solved by direct methods and subsequently completed by the difference Fourier methods. All the non-hydrogen atoms were refined using a full-matrix, least-squares technique with anisotropic displacement parameters. The hydrogen atoms were treated as riding on their parent carbon atoms with isotropic displacement parameters (equal to 1.2 or 1.5 times the value of carbon displacement parameters). The SHELXS-2013 and SHELXL-2019/2 [48] programs were used for all the calculations.
One of the carbonyl oxygens from the carboxylic group is disordered over two positions in 0.796(6):0.204(6) ratio.
Details concerning crystal data and refinement are gathered in Table 1.
CCDC 2355007 contains the supplementary crystallographic data for this paper. These data can be obtained free of charge via www.ccdc.cam.ac.uk/structures (or from the CCDC, 12 Union Road, Cambridge CB2 1EZ, UK; Fax: +44 1223 336033; E-mail: deposit@ccdc.cam.ac.uk).

3.6. Quantum Chemical Computations

The molecular structures of the 3a, 3b, 3c, and 3d in the ground singlet state (S0) were optimized using density functional theory (DFT), and the B3LYP/6-311++G(d,p) [49,50,51] with Grimme’s D3 dispersion correction approach [52,53]. We have also tested the range-separated hybrid cam-B3LYP-GD3 functional with Grimme’s D3 dispersion correction, long-range corrected hybrid density functional wB97XD [54], which includes empirical dispersion corrections (D2), as well as the highly parametrized hybrid meta-GGA functional M06-2X [55], which incorporates 54% Hartree–Fock (HF) exchange with the 6-311++G(d,p) basis set (Figure S3). The minimal structural changes (0.010–0.015Å) found during testing of these functionals confirm that the B3LYP/6-311++G(d,p) level of theory is adequate to describe the key structural features of our systems.
Transition states (TS) for 3b, 3c, and 3d were found using the QST3 [56] and Berny [57] optimization methods realized in Gaussian 16 [58]. The presence of one imaginary frequency in the TS indicates that the structure corresponds to a saddle point on the potential energy surface. This imaginary frequency represents the bond rotation of the C2-C3 and C3-C4 bonds responsible for the cis–trans isomerization process. For the TSs, intrinsic reaction coordinate (IRC) analysis was further performed to ensure that the obtained TS connects the minima. The TSs were calculated using the same B3LYP/6-311++G(d,p) [49,50,51] with Grimme’s D3 dispersion correction approach [52,53].
The first excited singlet (S1) state and the UV-visible absorption spectra of 3a, 3c, and 3d were calculated using the time-dependent (TD) DFT formalism with the polarizable continuum model (PCM), employing TDDFT/B3LYP/6-31G(d,p) level of theory [59,60]. For the UV-visible absorption spectra of 3a, 3c, and 3d, the lowest 20 vertical electronic transitions were computed. We tested the effect of diffuse functions on absorption spectra using the trans-isomer 3a as an example. The absorption spectrum for the trans rotamer of 3a was calculated with B3LYP functional using both the 6-31G(d,p) and 6- 31+G(d,p) basis sets (Figure S4). Both spectra have the same overall shape. Small shifts (~2–7 nm, red shift, Figure S4) were found, which are within the typical range of basis set effects when adding diffuse functions. This demonstrates that the diffuse functions only introduce minor corrections to the calculated electronic excitation energies. We have also calculated the optimized geometry of the trans rotamer of 3a, both in the gas phase and with DMSO solvent effects included (Figure S5). The comparison shows only negligible changes in bond lengths (0.001Å, Figure S5), which supports the decision to perform geometry optimizations in the gas phase.
To analyze the intermolecular interactions in 2a, Hirshfeld surfaces were calculated using Crystal Explorer 21.5 [61]. The procedure follows the approach detailed in Refs [62,63].

3.7. Synthesis of Vinyl Derivatives of 1,10-Phenanthroline (Neocuproine) 1a

Neocuproine 1a (1.04 g, 5.0 mmol) was dissolved in Ac2O (100 mL), followed by the addition of 2,4-dihydroxybenzaldehyde (2.76 g, 20.0 mmol). The reaction was heated under reflux for 24 h. Then, the volatiles were removed in vacuo (16 mmHg). The crude product was purified by crystallization from a mixture of THF/Et2O and dried over P4O10 to yield precipitates as follows:
((1E,1′E)-(1,10-phenanthroline-2,9-diyl)bis(ethene-2,1-diyl))bis(benzene-4,1,3-triyl) tetraacetate (2a) beige; DSC m.p. = 188.54 °C; 3.0 g (4.8 mmol, 96%), 1H-NMR (DMSO-d6; 500.2 MHz) δ = 2.31 (s, 6H, CH3), 2.45 (s, 6H, CH3), 7.15 (d, 3JH,H = 2.3 Hz, 2H, aromatic), 7.20 (dd, 3JH,H = 8.5 Hz, 4JH,H = 2.4 Hz, 2H, aromatic), 7.65 (d, 3JH,H = 16.3 Hz, 2H, vinyl), 7.95 (s, 2H, aromatic), 7.95 (d, 3JH,H = 16.3 Hz, 2H, vinyl), 8.06 (d, 3JH,H = 8.7 Hz, 2H, aromatic), 8.12 (d, 3JH,H = 8.4 Hz, 2H, aromatic), 8.48 (d, 3JH,H = 8.3 Hz, 2H, aromatic); 13C{1H}-NMR (DMSO-d6; 125.8 MHz) δ = 20.8, 20.9, 117.1, 120.2, 121.7, 125.9, 126.2, 126.6, 127.2, 128.0, 131.2, 136.9, 145.2, 148.8, 150.8, 154.7, 168.9, 169.1; HRMS (ESI TOF): m/z Calcd for C36H29N2O8 (M + H)+ = 617.1924, Found 617.1921. CCDC 2355007.
2a (3.08 g, 5.0 mmol) was added to a water solution of hydrochloric acid (10%) and stirred under further reflux for 16 h. Next, a water solution of sodium hydroxide (10%) was added, and the red precipitate was filtered off and purified by crystallization from methanol and dried over P4O10 to yield precipitates as follows:
4,4′-((1E,1′E)-(1,10-Phenanthroline-2,9-diyl)bis(ethene-2,1-diyl))bis(benzene-1,3-diol) (3a) red 1.9 g (4.6 mmol, 91.0%), DSC m.p. = 264.26 °C; 1H-NMR (DMSO-d6/KOD; 500.2 MHz) δ = 6.31 (d, 3JH,H = 8.4 Hz, 2H, aromatic), 6.36 (d, 3JH,H = 2.4 Hz, 2H, aromatic), 7.42 (d, 3JH,H = 16.4 Hz, 2H, vinyl), 7.50 (d, 3JH,H = 8.4 Hz, 2H, aromatic), 7.78 (s, 2H, aromatic), 7.92 (d, 3JH,H = 8.5 Hz, 2H, aromatic), 8.02 (d, 3JH,H = 16.4 Hz, 2H, vinyl), 8.32 (d, 3JH,H = 8.3 Hz, 2H, aromatic); 13C{1H}-NMR (DMSO-d6/KOD; 125.8 MHz) δ = 103.4, 108.2, 115.5, 121.1, 125.4, 126.1, 127.8, 129.3, 130.8, 137.3, 145.6, 157.2, 158.0, 160.0; HRMS (ESI TOF): m/z Calcd for C28H21N2O4 (M + H)+ = 449.1501, Found 449.1496.

3.8. Synthesis of Vinyl Derivatives of Quinoline

The synthesis of vinyl quinolines followed our procedure described in the literature [24,64,65]:
2-Methyl-8-(trifluoromethyl)quinoline (1b) or 8-isopropyl-2-methyl-5-nitroquinoline (1c) (10.0 mmol) was partially dissolved in Ac2O (100 mL), followed by the addition of 2-hydroxybenzaldehyde, 2,4-dihydroxybenzaldehyde or 3,4,5-trihydroxybenzaldehyde (20.0 mmol). The reaction was heated under reflux for 16 h. Then, the volatiles were evaporated from the resulting solution, and the residue was acidified by a water solution of hydrochloric acid (10%), and the reaction was stirred for 16 h, followed by the addition of CHCl3, and was filtered off. The crude product was dissolved in a water solution of NaOH (10%), and next was neutralized with an aqueous solution of hydrochloric acid (10%), and the solid was filtered. The crude product was purified by crystallization from methanol and dried over P4O10 to yield residues as follows:
(E)-2-(2-(8-(Trifluoromethyl)quinolin-2-yl)vinyl)phenol (3b) Yield: 2.14 g (6.8 mmol, 68.0%); DSC = 276.65 °C; 1H-NMR (DMSO–d6; 400.2 MHz) δ = 6.86 (td, 3JH,H = 7.5 Hz, 4JH,H = 1.2 Hz, 1H, aromatic), 7.00 (dd, 3JH,H = 8.1 Hz, 4JH,H = 1.2 Hz, 1H, aromatic), 7.19 (ddd, 3JH,H = 8.1 Hz, 3JH,H = 7.2 Hz, 4JH,H = 1.7 Hz, 1H, aromatic), 7.49 (d, 3JH,H = 16.3 Hz, 1H, vinyl), 7.60 (t, 3JH,H = 7.7 Hz, 1H, aromatic), 7.66 (d, 3JH,H = 7.8 Hz, 4JH,H = 1.6 Hz, 1H, aromatic), 7.89 (d, 3JH,H = 8.6 Hz, 1H, aromatic), 8.10 (d, 3JH,H = 7.4 Hz, 1H, aromatic), 8.16 (d, 3JH,H = 7.6 Hz, 1H, aromatic), 8.17 (d, 3JH,H = 16.1 Hz, 1H, vinyl), 8.41 (d, 3JH,H = 8.7 Hz, 1H, aromatic), 10.12 (s, 1H, OH); 13C{1H}-NMR (DMSO–d6; 100.6 MHz) δ = 116.1, 119.5, 121.1, 122.9, 123.3, 124.6, 125.6 (q, 1JC,F = 28.6 Hz CF3), 127.3, 127.7, 127.8, 128.3 (q, 2JC,F = 5.5 Hz CF3), 130.1, 131.4, 132.8, 137.0, 144.0, 156.1, 157.0; 19F{1H}-NMR (DMSO–d6; 470.55 MHz) δ = −58.48; 19F-NMR (DMSO–d6; 470.55 MHz) δ = −58.48; LCMS-IT-TOF [M+H]+ = 316.0950 (100%), HRMS (IT TOF): m/z Calcd for C18H13F3NO [M+H]+: 316.0949, Found 316.0950.
(E)-4-(2-(8-Isopropyl-5-nitroquinolin-2-yl)vinyl)benzene-1,3-diol (3c) red Yield: 2.75 g (7.9 mmol, 78.6%); DSC = 213.12 °C; 1H-NMR (DMSO–d6; 500.2 MHz) δ = 1.37 (d, 3JH,H = 6.9 Hz, 6H, 2CH3), 4.40 (hept, 3JH,H = 6.9 Hz, 1H, CH), 6.70 (s, 2H, aromatic), 7.13 (d, 3JH,H = 16.2 Hz, 1H, vinyl), 7.69 (d, 3JH,H = 16.1 Hz, 1H, vinyl), 7.78 (d, 3JH,H = 8.1 Hz, 1H, aromatic), 8.08 (d, 3JH,H = 9.2 Hz, 1H, aromatic), 8.30 (d, 3JH,H = 8.1 Hz, 1H, aromatic), 8.78 (d, 3JH,H = 9.1 Hz, 1H, aromatic), 9.61 (bs, 1H, OH); 13C{1H}-NMR (DMSO–d6; 100.6 MHz) δ = 23.0, 27.6, 102.7, 107.7, 114.4, 118.8, 122.3, 123.4, 123.7, 124.3, 129.2, 132.0, 132.2, 143.4, 144.8, 153.9, 156.7, 157.7, 159.9; LCMS-IT-TOF [M+H]+ = 351.1340 (100%), HRMS (IT TOF): m/z Calcd for C20H19N2O4 [M+H]+: 351.1345, Found 351.1340.
(E)-5-(2-(8-isopropyl-5-nitroquinolin-2-yl)vinyl)benzene-1,2,3-triol (3d) black Yield: 0.9 g (24.6%); DSC = 213.12 °C; 1H-NMR (DMSO–d6; 500.2 MHz) δ = 1.38 (d, 3JH,H = 7.0 Hz, 6H, 2CH3), 4.40 (hept, 3JH,H = 6.9 Hz, 1H, CH), 6.69 (s, 2H, aromatic), 7.12 (d, 3JH,H = 16.2 Hz, 1H, vinyl), 7.68 (d, 3JH,H = 16.3 Hz, 1H, vinyl), 7.78 (d, 3JH,H = 8.1 Hz, 1H, aromatic), 8.07 (d, 3JH,H = 9.2 Hz, 1H, aromatic), 8.30 (d, 3JH,H = 8.1 Hz, 1H, aromatic), 8.78 (d, 3JH,H = 9.1 Hz, 1H, aromatic), 9.61 (bs, 1H, OH); 13C{1H}-NMR (DMSO–d6; 125.8 MHz) δ = 23.01, 27.7, 106.9, 118.9, 122.3, 123.6, 124.4, 124.5, 126.4, 132.1, 135.2, 136.9, 143.4, 144.8, 146.3, 154.0, 156.0; LCMS-IT-TOF [M-H] = 365.1142 (100%), HRMS (IT TOF): m/z Calcd for C20H17N2O5 [M-H]: 365.1137, Found 365.1142.

4. Conclusions

Biological activity is believed to arise from the metal-chelating properties of the compounds toward various metal cations. This study tested the ability to chelate metal ions using selected water-soluble ligands based on the styryl derivatives of quinoline and 1,10-phenanthroline. These ligands were synthesized via standard Perkin condensation. Hydrophilic properties were introduced by incorporating phenol or polyphenol groups. The proton transfer reactions between the pyridine and phenol functional groups, or the generally simple protonation/deprotonation of pyridine rings in the 1,10-phenanthroline constitution, could be used as a pH indicator. The absorption spectra of compounds 3c and 3d at a concentration of 20 µM in various solvents confirmed that their spectral properties are influenced by basic media. For example, compound 3d decomposed in CD3OD/KOD under aerobic conditions, due to oxidation.
The studied compounds were further characterized using analytical methods and rationalized based on quantum chemical DFT and TDDFT calculations using the B3LYP functional. The TDDFT/B3LYP/6-31G(d,p) calculations performed in DMSO confirm the experimental absorption and emission behavior of compounds 3a, 3c, and 3d. For 3c and 3d, both trans and cis rotamers show absorption maxima in the near-UV region (364–366 nm), with the dominant transition being HOMO→LUMO+1. A weak, longer-wavelength absorption band corresponds to a low-intensity HOMO→LUMO transition (S0→S1). In the case of 3a, the absorption and fluorescence properties are more complicated due to the presence of six rotamers. The observed weak absorption in the 520–430 nm region arises primarily from S0→S1 transitions in rotamers 13, especially trans rotamer 2, which shows the strongest oscillator strength (f = 0.5993). The emission of 3a originates from the S0→S1 transition (LUMO→HOMO) and is contributed by all six rotamers. Trans rotamer 2 exhibits the most intense fluorescence (λem = 521 nm, f = 0.8771), making it the dominant species in the emission spectrum. Overall, the DFT and TDDFT calculations highlight the role of molecular conformation (rotamerism) in tuning the photophysical properties of 3a–3d and explain the complex nature of their UV-Vis and fluorescence spectra. The strong correlation between computed and experimental results validates the use of TDDFT for designing and understanding such metal-sensing systems.
((1E,1′E)-(1,10-phenanthroline-2,9-diyl)bis(ethene-2,1-diyl))bis(benzene-4,1,3-triyl)tetraacetate (2a) was structurally characterized by the single-crystal X-ray diffraction method. The X-ray crystal structure analysis of 2a showed the presence of the weak π···π stacking interactions between phenanthroline cores placed one above the other in neighboring molecules of 2a. The 1H and 13C NMR spectra of the presented compounds displayed distinctively diagnostic signals from the vinyl (styryl) functional group. The analysis of the value of coupling constants for vinyl protons confirmed the sole presence of the E conformer.
In this work, we also developed a tandem UV-Vis and fluorescence spectroscopy method to detect metal ions. Compound 3a, in DMSO:H2O (9:1, v/v), formed complexes with various metal cations, enabling their detection using colorimetric and fluorometric responses. This approach allowed sensitive detection of Hg2+, Ni2+, Cu2+, and Ag+ ions, with detection limits down to 1 mM, and 0.1 mM for Cu2+.

Supplementary Materials

The following supporting information can be downloaded at https://www.mdpi.com/article/10.3390/molecules30122659/s1, Part I. Quantum chemical data, Figure S1: The optimized molecular structure and bond lengths (Å) of trans and cis rotamers of 3b, 3c, and 3d in the ground singlet state; Figure S2: The optimized molecular structure and bond lengths (Å) of spatial trans, cis, and cis-trans rotamers of 3a in the ground singlet S0 state and the first excited S1 state; Figure S3: The optimized geometry of the trans rotamer of 3a with different functionals B3LYP-GD3, cam-B3LYP-GD3, wB97XD, and M06-2X; Figure S4: TDDFT calculated absorption spectra of the trans rotamer of 3a calculated with B3LYP functional using both 6-31G(d,p) and 6-31+G(d,p) basis sets; Figure S5: The B3LYP-GD3/6-311++g(d,p) optimized geometry of the trans rotamer of 3a in the gas phase and with the dimethylsulfoxide solvent effects included; Figure S6: TDDFT calculated absorption spectra of the complexes of the trans rotamer of 3a with Li+, K+, Mg2⁺, and Ca2⁺ ions calculated with B3LYP/6-31G(d,p) method; Table S1: Molecular orbitals and corresponding energy levels for 3a (rotamers 1–6), 3c, and 3d are calculated at the DFT/B3LYP/6-31G(d,p) level of theory; Table S2: Wavelengths (λ), oscillator strengths (f), and orbital assignment of the selected electronic transitions in the absorption spectra of the 3a rotamers 1–6, trans and cis 3c, and 3d calculated at the TDDFT/B3LYP/6-31G(d,p) level of theory; Table S3: Spectroscopic data of the S1→S0 transitions for the 3a (rotamers 1–6) calculated at the TDDFT/B3LYP/6-31G(d,p) level. Part II. Experimental data, Figure S7: The fluorescence decay profiles of compound 3a in different solvents with excitation at 376.2 nm; Figure S8: Modified logarithmic-type Stern-Volmer plot for 3a in the presence of various concentrations of Cu2+; Figure S9: Job’s plots for 3a in the presence of various concentrations of Cu2+; Figure S10: The calibration curves of fluorescence intensity at 505 nm as a function of metal ion concentration for derivative 3a (a) Cu2+, (b) Ag+, (c) Hg2+, (d) Ni2+ and NMR experimental data including 1H, 13C{1H}, 19F, 19F{1H} NMR, MS, and HRMS spectra of the compounds.

Author Contributions

J.E.N. and J.K. (Jolanta Kolińska) did the experiments. N.K.-K. performed DFT studies and computational analysis. J.E.N., J.K. (Jolanta Kolińska), N.K.-K. and T.C. designed the experiment project, discussed the mechanism, and wrote the manuscript. M.K. and J.K. (Joachim Kusz): single-crystal X-ray diffraction measurements and analysis; all authors: investigation, visualization, and writing manuscript. All authors have read and agreed to the published version of the manuscript.

Funding

Research activity financed from funds allocated to the European City of Science Katowice 2024.

Institutional Review Board Statement

Not applicable.

Informed Consent Statement

Not applicable.

Data Availability Statement

The data set presented in this study is available in this article.

Conflicts of Interest

The authors declare no conflicts of interest.

Abbreviations

B3LYPBecke, 3-parameter, Lee–Yang–Parr hybrid functional
DFTdensity-functional theory
DMSOdimethyl sulfoxide
DSS (NMR standard)sodium trimethylsilylpropanesulfonate
HOMOhighest occupied molecular orbital
LUMOlowest occupied molecular orbital
MSmass spectrometry
ESIelectrospray ionization
HFHartree–Fock
HRMShigh-resolution mass spectrometry
THFtetrahydrofuran
TStransition state
SOCspin–orbit coupling

References

  1. Balzani, V.; Credi, A.; Venturi, M. Molecular Devices and Machines: Concepts and Perspectives for the Nanoworld; Wiley-VCH: Weinheim, Germany, 2008. [Google Scholar] [CrossRef]
  2. Brandt, W.W.; Dwyer, F.P.; Gyarfas, E.D. Chelate complexes of 1,10-phenanthroline and related compounds. Chem. Rev. 1954, 54, 959–1017. [Google Scholar] [CrossRef]
  3. Summers, L.A. The phenanthrolines. Adv. Heterocycl. Chem. 1978, 22, 1–69. [Google Scholar] [CrossRef]
  4. Sammes, P.G.; Yahioglu, G. 1,10-Phenanthroline: A versatile ligand. Chem. Soc. Rev. 1994, 23, 327–334. [Google Scholar] [CrossRef]
  5. Bencini, A.; Lippolis, V. 1,10-Phenanthroline: A versatile building block for the construction of ligands for various purposes. Chem. Soc. Rev. 2010, 254, 2096–2180. [Google Scholar] [CrossRef]
  6. Andries, K.; Verhasselt, P.; Guillemont, J.; Göhlmann, H.W.H.; Neefs, J.-M.; Winkler, H.; Van Gestel, J.; Timmerman, P.; Zhu, M.; Lee, E.; et al. A Diarylquinoline Drug Active on the ATP Synthase of Mycobacterium tuberculosis. Science 2005, 307, 223–227. [Google Scholar] [CrossRef]
  7. Tsien, R.Y. New calcium indicators and buffers with high selectivity against magnesium and protons: Design, synthesis, and properties of prototype structures. Biochemistry 1980, 19, 2396–2404. [Google Scholar] [CrossRef]
  8. Staderini, M.; Aulić, S.; Bartolini, M.; Ngoc, H.; Tran, A.; Gonzaíez-Ruiz, V.; Perez, D.I.; Cabezas, N.; Martínez, A.; Martin, M.A.; et al. A Fluorescent Styrylquinoline with Combined Therapeutic and Diagnostic Activities against Alzheimer’s and Prion Diseases. ACS Med. Chem. Lett. 2013, 4, 225–229. [Google Scholar] [CrossRef]
  9. Li, X.; Gao, X.; Shi, W.; Ma, H. Design Strategies for Water-Soluble Small Molecular Chromogenic and Fluorogenic Probes. Chem. Rev. 2014, 114, 590–659. [Google Scholar] [CrossRef]
  10. Roberts, B.F.; Zheng, Y.; Cleaveleand, J.; Lee, S.; Lee, E.; Ayong, L.; Yuan, Y.; Chakrabarti, D. 4-Nitro styrylquinoline is an antimalarial inhibiting multiple stages of Plasmodium falciparum asexual life cycle. Int. J. Parasitol. Drugs Drug Resist. 2017, 7, 120–129. [Google Scholar] [CrossRef]
  11. Fair, R.J.; Tor, Y. Antibiotics and Bacterial Resistance in the 21st Century. Perspect. Med. Chem. 2014, 6, 25–64. [Google Scholar] [CrossRef]
  12. Schwarcz, R.; Whetsell, W.O., Jr.; Mangano, R.M. Quinolinic Acid: An Endogenous Metabolite That Produces Axon-Sparing Lesions in Rat Brain. Science 1983, 219, 316–318. [Google Scholar] [CrossRef] [PubMed]
  13. Wang, M.; Cao, R.; Zhang, L.; Yang, X.; Liu, J.; Xu, M.; Shi, Z.; Hu, Z.; Zhong, W.; Xiao, G. Remdesivir and chloroquine effectively inhibit the recently emerged novel coronavirus (2019-nCoV) in vitro. Cell Res. 2020, 30, 269–271. [Google Scholar] [CrossRef] [PubMed]
  14. Dondorp, A.M.; Nosten, F.; Yi, P.; Das, D.; Phyo, A.P.; Tarning, J.; Lwin, K.M.; Ariey, F.; Hanpithakpong, W.; Lee, S.J.; et al. Artemisinin resistance in Plasmodium falciparum malaria. N. Engl. J. Med. 2009, 361, 455–467. [Google Scholar] [CrossRef] [PubMed]
  15. Desjardins, R.E.; Canfield, C.J.; Haynes, J.D.; Chulay, J.D. Quantitative assessment of antimalarial activity in vitro by a semiautomated microdilution technique. Antimicrob. Agents Chemother. 1979, 16, 710–718. [Google Scholar] [CrossRef]
  16. Alreja, P.; Kaur, N. Recent advances in 1,10-phenanthroline ligands for chemosensing of cations and anions. RSC Adv. 2016, 6, 23169–23217. [Google Scholar] [CrossRef]
  17. Queffélec, C.; Pati, P.B.; Pellegrin, Y. Fifty Shades of Phenanthroline: Synthesis Strategies to Functionalize 1,10-Phenanthroline in All Positions. Chem. Rev. 2024, 124, 6700–6902. [Google Scholar] [CrossRef]
  18. Wantulok, J.; Sokolova, R.; Degano, I.; Kolivoska, V.; Nycz, J.E.; Fiedler, J. Spectroelectrochemical Properties of 1,10-Phenanthroline Substituted by Phenothiazine and Carbazole Redox-active Units. ChemElectroChem 2021, 8, 2935–2943. [Google Scholar] [CrossRef]
  19. Sehlangia, S.; Nayak, N.; Garg, N.; Pradeep, C.P. Substituent-Controlled Structural, Supramolecular, and Cytotoxic Properties of a Series of 2-Styryl-8-nitro and 2-Styryl-8-hydroxy Quinolines. ACS Omega 2022, 7, 24838–24850. [Google Scholar] [CrossRef]
  20. Hu, Z.-Q.; Hu, H.-Y.; Chen, C.-F. Phenanthroline dicarboxamide-based helical foldamers: Stable helical structures in methanol. J. Org. Chem. 2006, 71, 1131. [Google Scholar] [CrossRef]
  21. Hu, H.-Y.; Xue, W.; Hu, Z.-Q.; Xiang, J.-F.; Chen, C.-F.; He, S.-G. Probing the dynamic environment-associated conformational conversion from secondary to supersecondary structures in oligo(phenanthroline dicarboxamide)s. J. Org. Chem. 2009, 74, 4949. [Google Scholar] [CrossRef]
  22. Galis, Z.S.; Sukhova, G.K.; Lark, M.W.; Libby, P. Increased Expression of Matrix Metalloproteinases and Matrix Degrading Activity in Vulnerable Regions of Human Atherosclerotic Plaques. J. Clin. Investig. 1994, 94, 2493–2503. [Google Scholar] [CrossRef] [PubMed]
  23. Carter, M.T.; Rodriguez, M.; Bard, A.J. Voltammetric Studies of the Interaction of Metal Chelates with DNA. 2. Tris-Chelated Complexes of Cobalt(III) andiron(II) with 1,10-Phenanthroline and 2,2/-Bipyridine. J. Am. Chem. Soc. 1989, 111, 8901–8911. [Google Scholar] [CrossRef]
  24. Nycz, J.E.; Martsinovich, N.; Wantulok, J.; Chen, T.; Książek, M.; Kusz, J. Synthesis and Spectroscopic Characterization of Selected Water-Soluble Ligands Based on 1,10-phenanthroline Core. Molecules 2024, 29, 1341. [Google Scholar] [CrossRef] [PubMed]
  25. Nycz, J.E.; Karaush-Karmazin, N.; Minaev, B.; Minaeva, V.; Małecki, J.G.; Książek, M.; Swoboda, D.; Kusz, J. Syntheses and Spectroscopic Characterization of Selected Methyl Quinolinylphosphonic and Quinolinylphosphinic Acids; Rationalized Based on DFT calculation. Curr. Org. Chem. 2024, 28, 545–557. [Google Scholar] [CrossRef]
  26. Kaur, N.; Alreja, P. A novel 1,10-phenanthroline based chemosensor for differential metal ion sensing and constructing molecular logic gates. Tetrahedron Lett. 2015, 56, 182–186. [Google Scholar] [CrossRef]
  27. Aatif, A.M.; Kumar, S.K.A. Phenanthroline-benzothiazole conjugate an “On-Off” fluorescent sensor for Hg(II) and its bioimaging applications. Polyhedron 2023, 232, 116276. [Google Scholar] [CrossRef]
  28. Farhi, A.; Firdaus, F.; Saeed, H.; Mujeeb, A.; Shakir, M.; Owais, M. A quinoline-based fluorescent probe for selective detection and real-time monitoring of copper ions—A differential colorimetric approach. Photochem. Photobiol. Sci. 2019, 18, 3008–3015. [Google Scholar] [CrossRef]
  29. Zhou, C.; Liu, H.; Zhang, Y. A novel quinoline-based fluorescent sensor for imaging Copper(II) in living cells. Main Group Chem. 2018, 17, 53–61. [Google Scholar] [CrossRef]
  30. Zeng, S.-M.-Z.; Zhang, Q.; Li, Q.; Yuan, L.-C.; Abbas, M.; He, Z.-X.; Zhu, H.-L.; Wang, Z.-C. A novel quinoline-based fluorescent probe for real-time monitoring of Cys in glioma. Analyst 2022, 147, 4257–4265. [Google Scholar] [CrossRef]
  31. Fernandes, S.; Tlemçani, M.; Bortoli, D.; Feliciano, M.; Lopes, M.E. A Portable Measurement Device Based on Phenanthroline Complex for Iron Determination in Water. Sensors 2023, 23, 1058. [Google Scholar] [CrossRef]
  32. Gorai, S.; Ghosh, A.; Chakraborty, S.; Retailleau, P.; Ghanty, T.K.; Patro, B.S.; Mula, S. Fluorescent Cu2+ sensor based on phenanthroline-BODIPY conjugate: A mechanistic study. Dyes Pigm. 2022, 203, 110343. [Google Scholar] [CrossRef]
  33. Massaro, M.; Borrego-Sánchez, A.; Viseras-Iborra, C.; Cinà, G.; García-Villén, F.; Liotta, L.F.; Lopez Galindo, A.; Pimentel, C.; Sainz-Díaz, C.I.; Sánchez-Espejo, R. Hectorite/Phenanthroline-Based Nanomaterial as Fluorescent Sensor for Zn Ion Detection: A Theoretical and Experimental Study. Nanomaterials 2024, 14, 880. [Google Scholar] [CrossRef] [PubMed]
  34. Song, H.; Zhou, Y.; Li, Z.; Zhou, H.; Sun, F.; Yuan, Z.; Guo, P.; Zhou, G.; Yu, X.; Hu, J. Inner filter effect between upconversion nanoparticles and Fe(ii)–1,10-phenanthroline complex for the detection of Sn(ii) and ascorbic acid (AA). RSC Adv. 2021, 11, 17212–17221. [Google Scholar] [CrossRef]
  35. Gazizadeh, M.; Dehghan, G.; Soleymani, J. A ratiometric fluorescent sensor for detection of metformin based on terbium—1,10-phenanthroline—Nitrogen-doped-graphene quantum dots. RSC Adv. 2022, 12, 22255–22265. [Google Scholar] [CrossRef] [PubMed]
  36. Desiraju, G.R.; Steiner, T. The Weak Hydrogen Bond in Structural Chemistry and Biology; Oxford University Press: New York, NY, USA, 1999. [Google Scholar]
  37. Poronik, Y.M.; Sadowski, B.; Szychta, K.; Quina, F.H.; Vullev, V.I.; Gryko, D.T. Revisiting the Non-Fluorescence of Nitroaromatics: Presumption versus Reality. J. Mater. Chem. C 2022, 10, 2870–2904. [Google Scholar] [CrossRef]
  38. Mewes, J.-M.; Jovanović, V.; Marian, C.M.; Dreuw, A. On the molecular mechanism of non-radiative decay of nitrobenzene and the unforeseen challenges this simple molecule holds for electronic structure theory. Phys. Chem. Chem. Phys. 2014, 16, 12393–12406. [Google Scholar] [CrossRef]
  39. Bursa, B.; Wróbel, D.; Barszcz, B.; Kotkowiak, M.; Vakuliuk, O.; Gryko, D.T.; Kolanowski, Ł.; Baraniak, M.; Lota, G. The impact of solvents on the singlet and triplet states of selected fluorine corroles—Absorption, fluorescence, and optoacoustic studies. Phys. Chem. Chem. Phys. 2016, 18, 7216–7228. [Google Scholar] [CrossRef]
  40. Jara-Cortés, J.; Resendiz-Pérez, A.; Hernández-Trujillo, J.; Peón, J. Relaxation and Photochemistry of Nitroaromatic Compounds: Intersystem Crossing through 1ππ* to Higher 3ππ* States, and NO Dissociation in 9-Nitroanthracene—A Theoretical Study. J. Phys. Chem. A 2025, 129, 3220–3230. [Google Scholar] [CrossRef]
  41. Chen, M.-C.; Chen, D.-G.; Chou, P.-T. Fluorescent Chromophores Containing the Nitro Group: Relatively Unexplored Emissive Properties. ChemPlusChem 2021, 86, 11–27. [Google Scholar] [CrossRef]
  42. Li, H.; Wang, X.; Yuan, K.; Lv, L.; Liu, K.; Li, Z. Fluorescent Mechanism of a Highly Selective Probe for Copper(II) Detection: A Theoretical Study. ACS Omega 2023, 8, 17171–17180. [Google Scholar] [CrossRef]
  43. Irving, H.M.; Williams, R.J.P. The stability of transition-metal complexes. J. Chem. Soc. 1953, 3192–3210. [Google Scholar] [CrossRef]
  44. Lakowicz, J.R. Principles of Fluorescence Spectroscopy, 3rd ed.; Springer: New York, NY, USA, 2006. [Google Scholar]
  45. Meng, Z.; Yang, F.; Wang, X.; Shan, W.-L.; Liu, D.; Zhang, L.; Yuan, G. Trefoil-Shaped Metal−Organic Cages as Fluorescent Chemosensorsfor Multiple Detection of Fe3+, Cr2O72−, and Antibiotics. Inorg. Chem. 2023, 62, 1297–1305. [Google Scholar] [CrossRef] [PubMed]
  46. Melhuish, W.H. Quantum efficiencies of fluorescence of organic substances: Effect of solvent and concentration of the fluorescent solute. J. Phys. Chem. 1961, 65, 229–235. [Google Scholar] [CrossRef]
  47. Rigaku Oxford Diffraction. CrysAlisPro Software System, Version 1.171.38.41q; Rigaku Corporation: Wroclaw, Poland, 2015. [Google Scholar]
  48. Sheldrick, G.M. Crystal structure refinement with SHELXL. Acta Cryst. 2015, 71, 3–8. [Google Scholar]
  49. Becke, A.D. Perspective: Fifty years of density-functional theory in chemical physics. J. Chem. Phys. 2014, 140, 18A301. [Google Scholar] [CrossRef]
  50. Lee, C.; Yang, W.; Parr, R.G. Development of the Colle-Salvetti correlation-energy formula into a functional of the electron density. Phys. Rev. B 1988, 37, 785–789. [Google Scholar] [CrossRef]
  51. Francl, M.M.; Petro, W.J.; Hehre, W.J.; Binkley, J.S.; Gordon, M.S.; DeFrees, D.J.; Pople, J.A. Self-consistent molecular orbital methods. XXIII. A polarization-type basis set for second-row elements. J. Chem. Phys. 1982, 77, 3654–3666. [Google Scholar] [CrossRef]
  52. Antony, J.; Grimme, S. Density functional theory including dispersion corrections for intermolecular interactions in a large benchmark set of biologically relevant molecules. Phys. Chem. Chem. Phys. 2006, 8, 5287–5293. [Google Scholar] [CrossRef]
  53. Grimme, S.; Hansen, A.; Brandenburg, J.G.; Bannwarth, C. Dispersion-Corrected Mean-Field Electronic Structure Methods. Chem. Rev. 2016, 116, 5105–5154. [Google Scholar] [CrossRef]
  54. Chai, J.-D.; Head-Gordon, M. Long-range corrected hybrid density functionals with damped atom-atom dispersion corrections. Phys. Chem. Chem. Phys. 2008, 10, 6615–6620. [Google Scholar] [CrossRef]
  55. Zhao, Y.; Truhlar, D.G. The M06 suite of density functionals for main group thermochemistry, thermochemical kinetics, noncovalent interactions, excited states, and transition elements: Two new functionals and systematic testing of four M06-class functionals and 12 other functionals. Theor. Chem. Acc. 2008, 120, 215–241. [Google Scholar] [CrossRef]
  56. Halgren, T.A.; Lipscomb, W.N. The synchronous-transit method for determining reaction pathways and locating molecular transition states. Chem. Phys. Lett. 1977, 49, 225–232. [Google Scholar] [CrossRef]
  57. Suleimanov, Y.V.; Green, W.H. Automated Discovery of Elementary Chemical Reaction Steps Using Freezing String and Berny Optimization Methods. J. Chem. Theory Comput. 2015, 11, 4248–4259. [Google Scholar] [CrossRef] [PubMed]
  58. Frisch, M.J.; Trucks, G.W.; Schlegel, H.B.; Scuseria, G.E.; Robb, M.A.; Cheeseman, J.R.; Scalmani, G.; Barone, V.; Petersson, G.A.; Nakatsuji, H.; et al. Gaussian 16, Revision, A.03; Gaussian, Inc.: Wallingford, CT, USA, 2016. [Google Scholar]
  59. Runge, E.; Gross, E.K.U. Density-Functional Theory for Time-Dependent Systems. Phys. Rev. Lett. 1984, 52, 997–1000. [Google Scholar] [CrossRef]
  60. Miertuš, S.; Scrocco, E.; Tomasi, J. Electrostatic Interaction of a Solute with a Continuum. A Direct Utilization of Ab Initio Molecular Potentials for the Prevision of Solvent Effects. Chem. Phys. 1981, 55, 117–129. [Google Scholar] [CrossRef]
  61. Spackman, P.R.; Turner, M.J.; McKinnon, J.J.; Wolff, S.K.; Grimwood, D.J.; Jayatilaka, D.; Spackman, M.A. Crystal Explorer: A program for Hirshfeld surface analysis, visualization and quantitative analysis of molecular crystals. J. Appl. Cryst. 2021, 54, 1006–1011. [Google Scholar] [CrossRef]
  62. McKinnon, J.J.; Spackman, M.A.; Mitchell, A.S. Novel tools for visualizing and exploring intermolecular interactions in molecular crystals. Acta Crystallogr. Sect. B Struct. Sci. 2004, 60, 627–668. [Google Scholar] [CrossRef]
  63. Spackman, M.A.; Jayatilaka, D. Hirshfeld surface analysis. CrystEngComm 2009, 11, 19–32. [Google Scholar] [CrossRef]
  64. Gudat, D.; Nycz, J.E.; Polanski, J. A solid state and solution NMR study of the tautomerism in hydroxyquinoline carboxylic acids. Magn. Reson. Chem. 2008, 46, S115–S119. [Google Scholar] [CrossRef]
  65. Nycz, J.E.; Czyż, K.; Szala, M.; Malecki, J.G.; Shaw, G.; Gilmore, B.; Jon, M. Synthesis, spectroscopy and computational studies of some novel π-conjugated vinyl N-alkylated quinolinium salts and their precursor’s. J. Mol. Struct. 2016, 1106, 416–423. [Google Scholar] [CrossRef]
Scheme 1. The synthesis of water-soluble 1,10-phenanthroline 3a and quinolines 3b, 3cand 3d. Aldehyde for 3b 2-hydroxybenzaldehyde; 3c 2,4-dihydroxybenzaldehyde; 3d 3,4,5-trihydroxybenzaldehyde.
Molecules 30 02659 sch001
Figure 1. ORTEP (Oak Ridge thermal ellipsoid plot) drawings of ((1E,1′E)-(1,10-phenanthroline-2,9-diyl)bis(ethene-2,1-diyl))bis(benzene-4,1,3-triyl) tetraacetate (2a) with 50% probability (a), the selected intra- (b) and intermolecular distances (c), packing (d,e) and Hirschfeld dnorm surface (f) of selected dimer configurations with indicated intermolecular distances in Å (gk); shape index map (l) and curvedness map (m).
Molecules 30 02659 g001
Figure 2. The DFT optimized structures using B3LYP/6-311++G(d,p) with Grimme’s dispersion correction approach of trans-, cis-isomers and TS structures of 3b, 3c, and 3d with the intramolecular O···H, and N···H interactions (in Å) indicated.
Molecules 30 02659 g002
Figure 3. Atom numbering in 3b, 3c, and 3d.
Molecules 30 02659 g003
Figure 4. The DFT optimized structures of 3a trans, cis, and cis–trans rotamers and their corresponding energy differences using B3LYP/6-311++G(d,p) with Grimme’s dispersion correction approach. The intramolecular O···H, and N···H interactions (in Å) are indicated.
Molecules 30 02659 g004
Figure 5. Molecular orbital nature of the first S0°→S₁ transition for 3atrans, cis, and cis–transrotamers 16. The S0°→S₁ transition has HOMO→LUMO nature for rotamers 13, and is due to a combination of HOMO→LUMO and HOMO−1→LUMO for rotamers 46. The orbital nature and the electronic transitions are presented in detail in Tables S1 and S2.
Molecules 30 02659 g005
Figure 6. Absorption spectra of the compounds (a) 3c and (b) 3d at a concentration of 20 µM in different solvents.
Molecules 30 02659 g006
Figure 7. TheTDDFT/B3LYP/6-31G(d,p) simulated absorption spectra of the 3c and 3d, taking into account the DMSO solvent effects. The black line in absorption spectra corresponds to the convolution profile as a superposition of both trans and cis rotamer absorptions.
Molecules 30 02659 g007
Figure 8. Frontier molecular orbitals of the trans-isomers of 3c and 3d in neutral form (left) and with the two and three ionized hydroxyl groups (right).
Molecules 30 02659 g008
Figure 9. Optical characteristics of 1,10-phenanthroline (3a). (a) Absorption spectra and (b) excitation and emission spectra in DMSO under 387 nm excitation.
Molecules 30 02659 g009
Figure 10. TDDFT simulated absorption spectra of the 3a, taking into account the DMSO solvent effects. The black line in absorption spectra corresponds to the convolution profile as a superposition of all rotamer absorptions.
Molecules 30 02659 g010
Figure 11. Absorption spectra of the compound 3a (10 µM) in the presence of various ions Hg2+, Co2+, Ni2+, Ca2+, Cd2+, Mn2+, Mg2+, Zn2+, Li+, K+, Ag+(1 mM) and Cu2+, Fe2+, Pb2+ (0.1 mM).
Molecules 30 02659 g011
Figure 12. Frontier molecular orbitals for 3a-Li+, 3a-K+, 3a-Mg2+, 3a-Ca2+, (3a)2-Zn2+, and (3a)2-Cu2+. In the (3a)2-Zn2+ and (3a)2-Cu2+complexes, one of the 3a fragments is depicted in light gray for visual clarity.
Molecules 30 02659 g012
Scheme 2. Proposed binding mode of 3a with Cu2+. Hydrogen atoms near carbon in system of 3a with Cu2+ are omitted for clarity.
Molecules 30 02659 sch002
Figure 13. (a) Fluorescence spectra of the compound 3a (10 µM) in the presence of various ions Hg2+, Co2+, Ni2+, Ca2+, Cd2+, Mn2+, Mg2+, Zn2+, Li+, K+, Ag+, Cu2+, Fe2+, Pb2+ (0.1 mM). (b) Bar graph of fluorescence intensity at 505 nm for derivative 3a in the presence of various metal ions.
Molecules 30 02659 g013
Figure 14. The photographic images under daylight mode (A) and UV light mode (B) of the compound 3a with different metals.
Molecules 30 02659 g014
Figure 15. (a) Fluorescence spectra of the compound 3a (10 µM) in the presence of various concentrations of Cu2+. (b) Stern–Volmer plots for 3a in the presence of various concentrations of Cu2+.
Molecules 30 02659 g015
Table 1. Selected structural parameters of trans- and cis-isomers of 3b, 3c, and 3d and their corresponding energy differences ΔE (reported in kcal mol−1).
CompoundA(C2C3C4)A(C3C4C5)D(C1C2C3C4)D(C2C3C4C5)D(C3C4C5N6)ΔE
3b (trans)129.54125.38−0.002−180.00179.993.81
3b (cis)130.54129.84−137.365.68−157.61
3c (trans)129.74125.290.32−179.87−178.351.61
3c (cis)128.87128.57138.76−8.83−18.77
3d (trans)126.91126.411.44−179.78−178.173.61
3d (cis)129.07129.21143.64−7.33149.47
The energy differences (ΔE) reported in Table 1 correspond to the B3LYP/6-311++G(d,p) with Grimme’s dispersion correction calculated energy differences relative to the most stable trans-isomer. Angles are reported in degrees.
Table 2. Selected structural parameters and energy barrier of the transition states (TS) of 3b, 3c, and 3d.
TSA(C2C3C4)A(C3C4C5)D(C1C2C3C4)D(C2C3C4C5)D(C3C4C5N6)ΔEZPE
3b123.25126.6583.22179.89−175.0913.56
3c123.35126.6084.33179.91−175.914.72
3d123.42126.6785.73179.92−176.125.43
The energy barrier of TSs (ΔEZPE: TS—cis) is in kcal mol−1 (zero-point energies (ZPE) correction included). Angles are reported in degrees. Atom numbering corresponds to Figure 3.
Table 3. Spectroscopic characterization of 3a, 3c, and 3d with different solutions.
λabs [nm]ε [M−1cm−1]λem[nm]Stokes Shift [nm]Φf [%]τ [ns]
3a463 a
351 a
18,700 a
14,400 a
550a87 a<1 a2.75 a
387 c
346 c
19,400 c
18,600 c
500c113 c8.17 c0.99 c
3c350 b21,400 b----
362 c20,300 c----
429 d27,400 d----
3d346 b25,900 b----
359 c23,800 c----
323 d118,00 d----
a EtOH, b MeOH, c DMSO, d 0.1 M KOH.
Table 4. The limit of detection and quantification for derivative 3a with various metal ions.
Metal IonLOD
[µM]
LOQ
[µM]
Cu2+0.972.96
Ag+2.688.12
Hg2+28.887.3
Ni2+29.890.4
Disclaimer/Publisher’s Note: The statements, opinions and data contained in all publications are solely those of the individual author(s) and contributor(s) and not of MDPI and/or the editor(s). MDPI and/or the editor(s) disclaim responsibility for any injury to people or property resulting from any ideas, methods, instructions or products referred to in the content.

