Article

Multisite Fe3+ Luminescent Centers in the LiGaO2:Fe Nanocrystalline Phosphor

1
Institute of Physics, Polish Academy of Sciences, Aleja Lotników 32/46, 02-668 Warsaw, Poland
2
Institute of Physics, University of Tartu, W. Ostwald Str. 1, 50411 Tartu, Estonia
3
Łukasiewicz Research Network—Institute of Microelectronics and Photonics, Aleja Lotników 32/46, 02-668 Warsaw, Poland
4
Institute of Human Nutrition Sciences, Warsaw University of Life Sciences, Nowoursynowska 159c, 02-776 Warsaw, Poland
5
Diamond Light Source, Harwell Science & Innovation Campus, Didcot OX11 DE, UK
6
Institute of Experimental Physics, Faculty of Mathematics, Physics and Informatics, University of Gdansk, Wita Stwosza 57, 80-952 Gdańsk, Poland
7
Department of Electrical and Electronic Engineering, The University of Hong Kong, Hong Kong 999077, China
*
Authors to whom correspondence should be addressed.
Molecules 2025, 30(11), 2331; https://doi.org/10.3390/molecules30112331
Submission received: 20 March 2025 / Revised: 4 May 2025 / Accepted: 19 May 2025 / Published: 27 May 2025
(This article belongs to the Special Issue Chemistry Innovatives in Perovskite Based Materials)

Abstract

:
An extensive experimental study of trivalent iron (Fe3+) ions in orthorhombic lithium gallate nanocrystals was undertaken. Various spectroscopic methods, such as Raman spectroscopy, extended X-ray absorption fine structure, the Mössbauer effect, electron paramagnetic resonance, photoluminescence, thermoluminescence, and cathodoluminescence were used to investigate the synthesized phosphor. This study revealed the existence of multiple Fe3+ sites, out of which the tetrahedral sites are preferentially occupied. Extensive optical studies showed that the Fe3+ doped lithium gallate phosphor is a promising candidate for various luminescence and thermoluminescence-related applications in the near-infrared regime.

1. Introduction

Lithium metagallate (LiGaO2) and lithium pentagallium oxide (LiGa5O8) are the two important ultra-wide-bandgap ternary metal oxides formed by lithium and gallium. Both compounds exhibit different structural and optical properties. LiGaO2 is considered to be one of the best lattice-matched substrate materials for GaN growth and frequency conversion application [1]. It is also important as an anode material in lithium-ion batteries with very good cycling stability [2]. Recently, p-type conductivity was reported for LiGa5O8, which is thus the widest band-gap oxide semiconductor known to date with p-type conductivity [3]. If doped with suitable activator ions, both phosphors exhibit significant mechanoluminescence and thermoluminescence properties at ambient temperatures [4,5]. LiGaO2 crystallizes in the orthorhombic phase with space group Pna21, which is a distorted wurtzite-like structure. LiGa5O8 mainly crystallizes a cubic primitive phase with the P4332 space group [6].
The near-infrared (NIR) emitting Fe3+-doped LiGaO2 and LiGa5O8 are some of the best phosphor materials for diverse applications, such as a potential alternative to Cr3+ based phosphors in bioimaging, night vision, and optical sensors, and also showing promise as thermoluminescent materials for radiation dosimetry and environmental monitoring [7,8]. Some other studies have also indicated that these types of ceramic phosphors are well applicable in several biological fields due to their biocompatible nature [7,9]. Both oxides show broadband emission in the near-infrared range at room temperature related to the 4T1(G)→6A1(S) transitions between the two lowest crystal field levels of Fe3+. In a recent publication [10], we investigated the luminescent and mechanoluminescent properties of the dominant Fe3+ emitting center in the LiGaO2:Fe phosphor grown by solid-state reaction. The present work focuses on multi-site occupancy of Fe3+ ions in the sample studied. Special attention is devoted to identifying the nature of different Fe3+ centers and their influence on the optical properties of this material. For this purpose, a few advanced techniques are used, such as extended X-ray absorption fine structure (EXAFS), electron paramagnetic resonance (EPR), and Mössbauer spectroscopies. The thermo-stimulated luminescence (TSL) and cathodoluminescence (CL) properties of the phosphor are also investigated, and the results show the potential of NIR-emission-based applications of the LiGaO2:Fe3+ phosphor. We also studied the anti-bacterial properties of LiGaO2:Fe3+. The results reported in the Supporting Information (Text S1) do not exhibit such potential for this material against the selected types of bacteria.

2. Results and Discussion

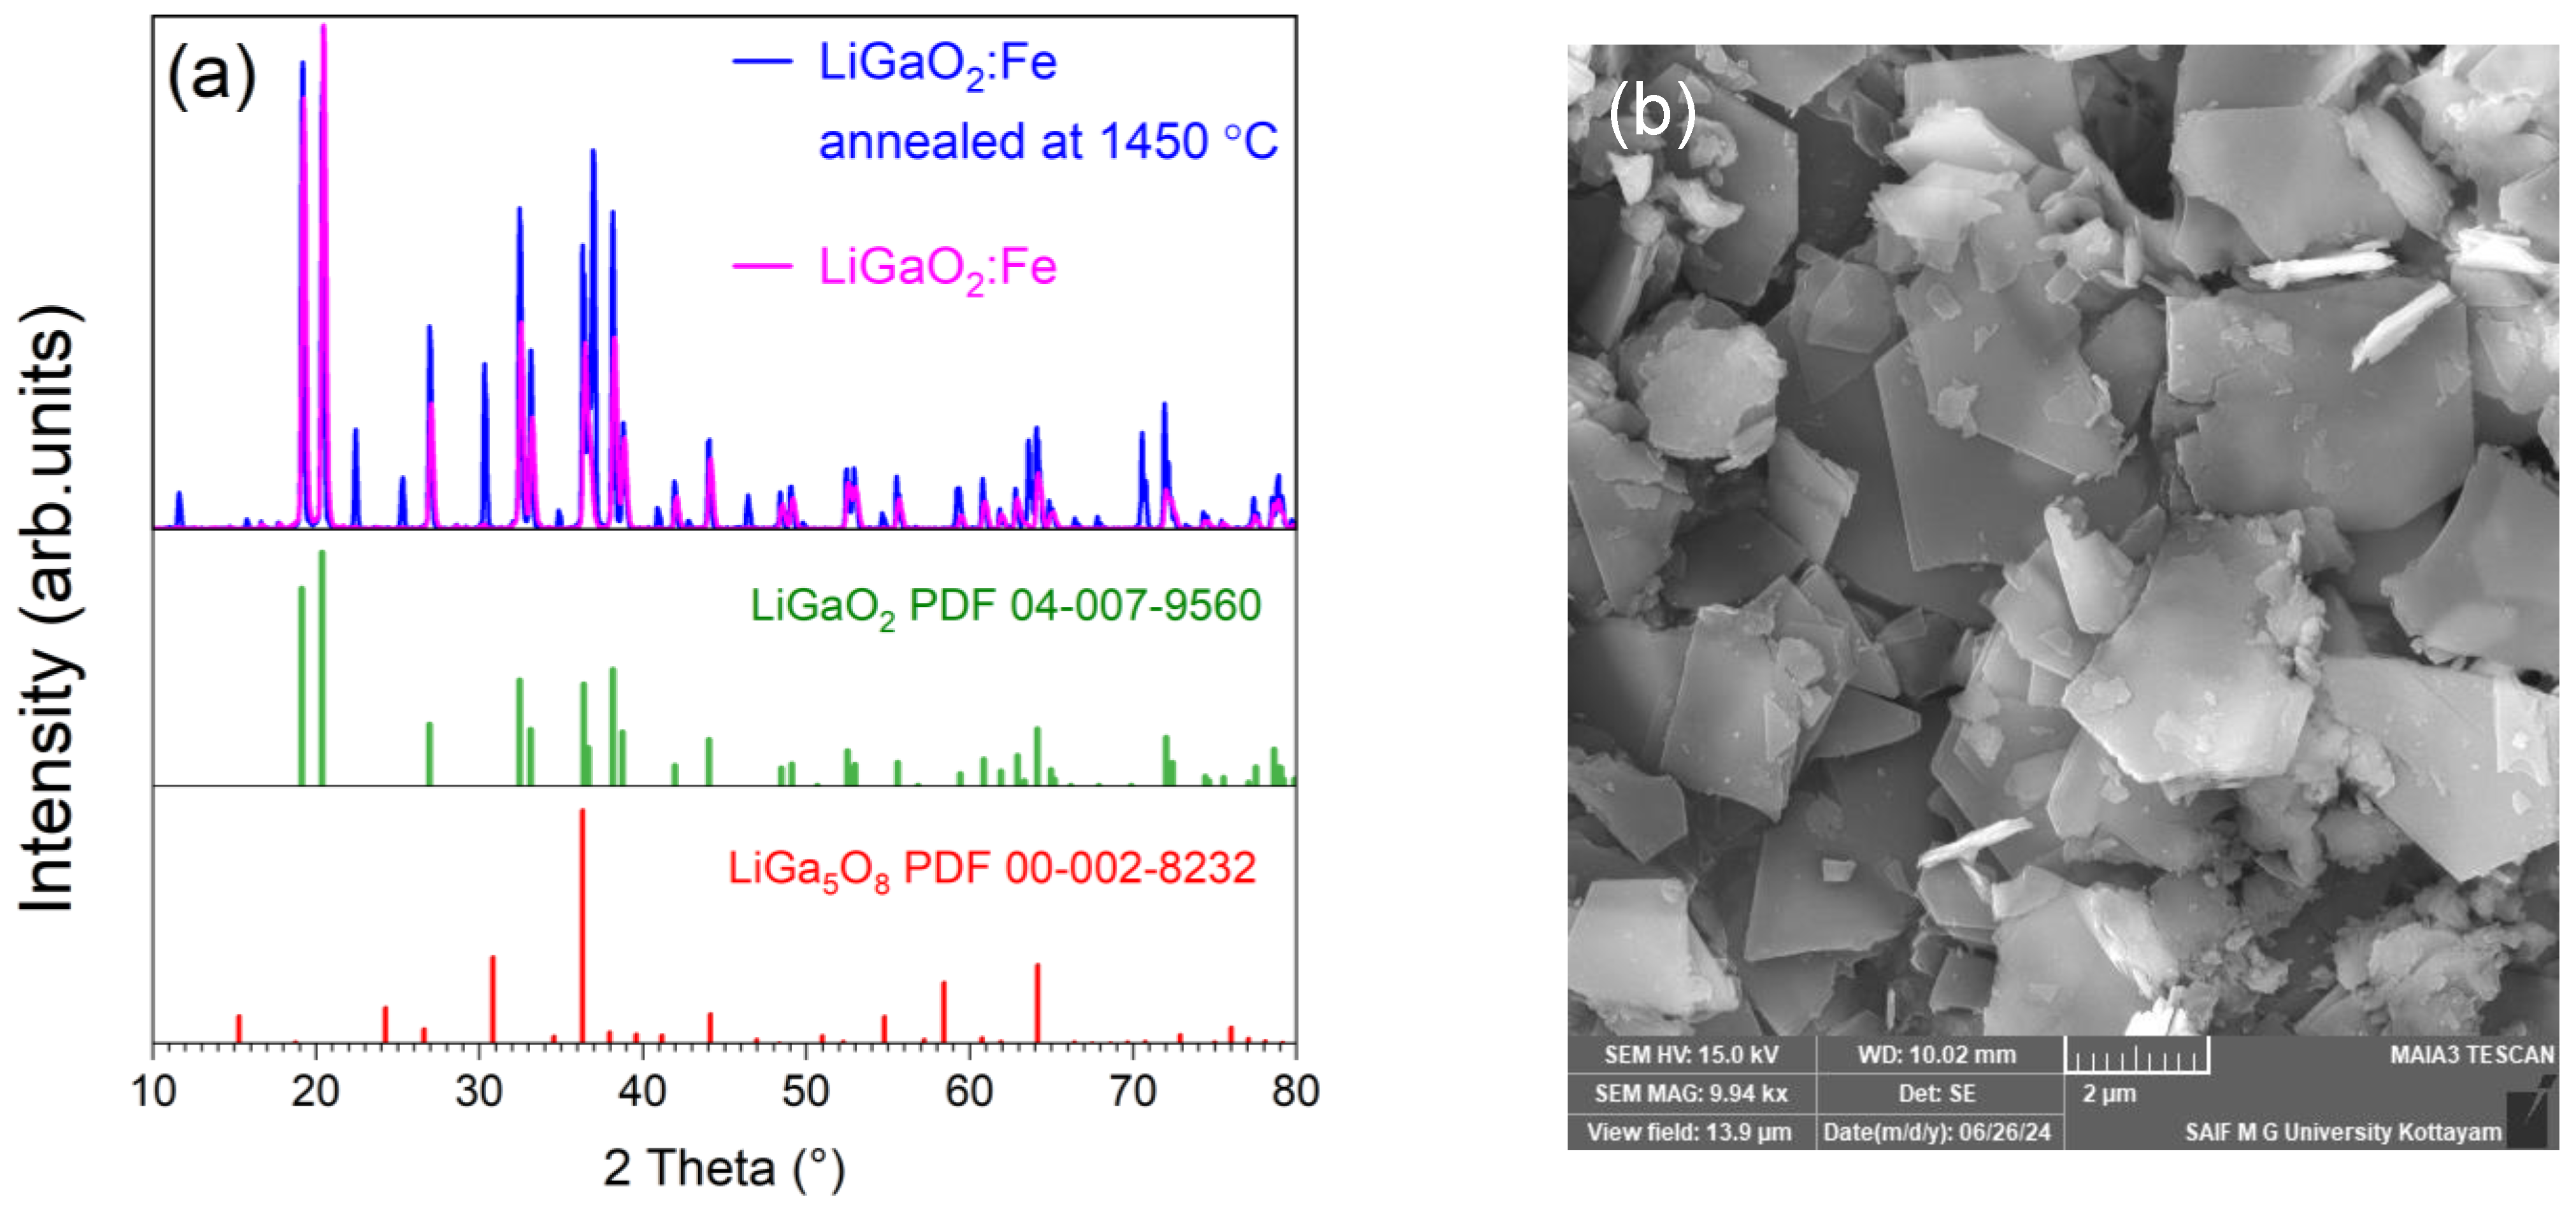
2.1. Structural and Raman Studies

Previous X-ray powder diffraction studies of the synthesized material [10] have shown that the dominant phase is orthorhombic LiGaO2 with the Pna21 space group (card number PDF 04-007-9560), identical to the structure refined by Marezio [11]. In addition, about 0.8% of the LiGa5O8 impurity phase (card number PDF 04-002-8232) was detected. The formation of this phase probably arose due to the relatively high calcination temperature, since the transformation from LiGaO2 to LiGa5O8 was shown to start already at ≈1373 K (1100 °C) [12].
The LiGa5O8 impurity phase has a cubic spinel structure (space group P4332) with a unit cell parameter of a = 8.203 Å (card number PDF 04-002-8232). The LiO6 octahedra share their corners with six GaO4 tetrahedra and their edges with the GaO6 octahedra. The structure is shown in Figure 1 in comparison to that of LiGaO2. The Fe3+ ion replaces Ga3+ in the tetrahedral sites of LiGaO2, while in the LiGa5O8 impurity phase, Fe3+ can replace Ga3+ both in the tetrahedral (A) and the octahedral (B) sites without much change in the structure, since both Fe3+ and Ga3+ have very close Shannon ionic radii in tetrahedral as well as octahedral coordination.
The elemental maps in Figure 2a show a uniform distribution of Ga and O ions in the sample. Due to the very low concentration, iron cannot be visualized in the maps. However, the EDS spectrum shown in Figure 2b confirms its presence.
Figure 3 presents the room temperature Raman spectra of the main LiGaO2:Fe3+ phase (a) and the LiGa5O8:Fe3+ impurity phase (b), respectively. The spectra were collected by focusing the laser beam on two different places of the sample. Both closely match the Raman peaks reported for undoped LiGaO2 [13,14] and LiGa5O8 [14] powder samples, as listed in Table 1. In addition, some weak peaks at 139, 135, 219, 319, 397, 556, and 714 cm−1 are detected, which were not reported previously in the Raman spectra [13,14]. They may be due to local phonons related to Fe doping or defects.

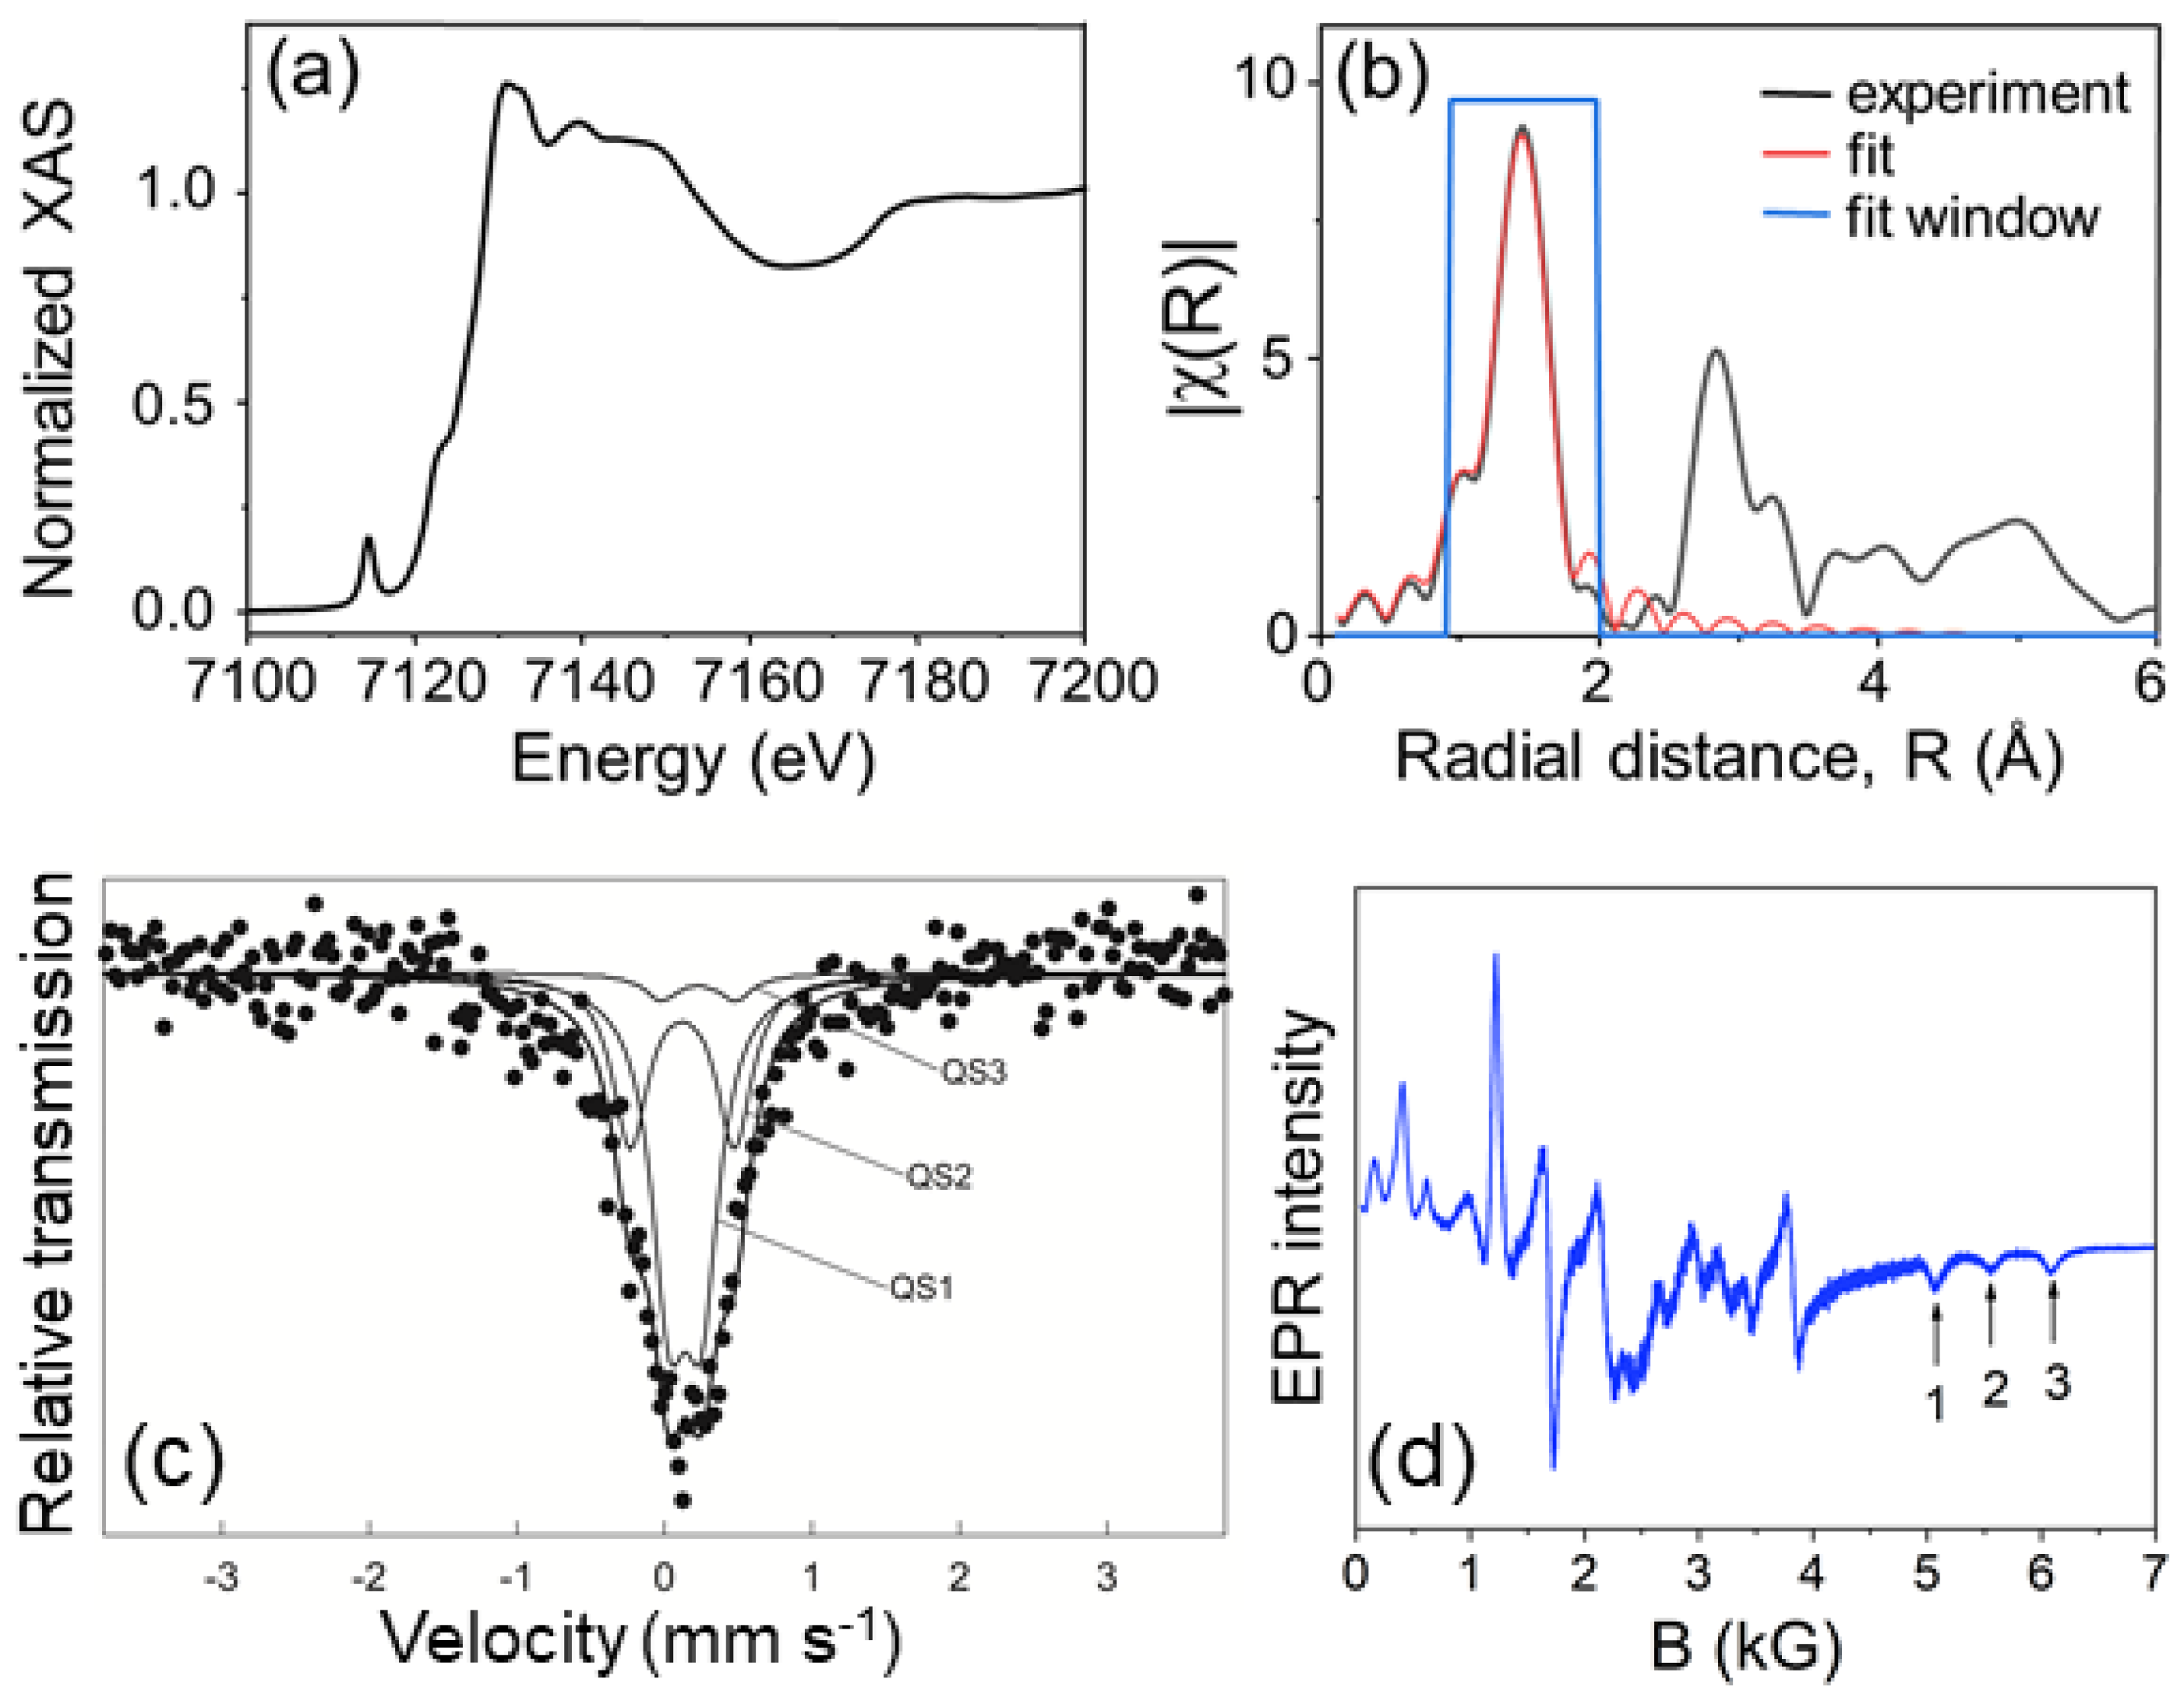
2.2. XAS, EXAFS, Mössbauer & EPR Measurements

To obtain more information on the coordination of Fe ions in the LiGaO2:Fe3+ sample, we performed XAS and EXAFS measurements. The XAS spectrum recorded near the Fe K-edge is shown in Figure 4a. In this region, the data were taken in steps of 0.3 eV with the monochromator calibrated with an iron foil at the Fe K-edge of 7112 eV. The pre-edge feature at 7114.5 eV arises from 1s → 3d transitions. The shape of this single peak and its relatively strong intensity indicate that 4p and 3d orbitals of Fe are mixed, and the local site symmetry of Fe is unlikely to be centrosymmetric [15]. The absorption in the EXAFS region was measured with a constant wavenumber step of 0.04 Å−1. The spectrum was then normalized with Athena software and processed further in Artemis [16]. The obtained EXAFS spectrum is shown in Figure 4b. Only the first shell of the EXAFS data was fitted using the crystalline structure of LiGaO2, with Fe3+ replacing one of the Ga3+ sites. The Ga–O bond length for LiGaO2 has been previously reported to be 1.835 ± 0.004 Å [11]. According to this simple model, the first shell around the Fe atom consists of four oxygen atoms at 1.845 Å. This value is close to the Fe–O bond length of 1.82 ± 0.02 Å reported for LiAlO2 (an isomorphic material to LiGaO2) doped with Fe3+ [15]. The first shell was fitted in the range of 0.95 to 2.0 Å with the wavenumber range of 2.5 to 12.3 Å−1.
The EXAFS data confirm that the local environment around Fe is predominantly tetrahedral. No Fe3+ occupancy in octahedral sites related to the LiGa5O8 impurity phase was detected.
The sample was further analyzed using Mössbauer spectroscopy. The weak absorption (below 1%) in the Mössbauer spectrum shown in Figure 4c is due to the low natural content of the 57Fe isotope. The signal-to-noise ratio was improved by a sufficiently large number of counts per channel. Hence, the spectrum reveals a distinct hyperfine structure originating from several nonequivalent Fe3+ iron sites. The spectrum was fitted with three components. Two substantial quadrupole doublets (QS1 and QS2) reveal a similar isomer shift in the 0.23–0.24 mm/s range. The values below 0.30 mm/s can be connected with Fe3+ ions in tetrahedral coordination, which agree with the substitution of iron ions for Ga3+ in the LiGaO2 structure. It is known that Ga3+ ions occupy only one site in the LiGaO2 structure. The presence of two doublets with a similar isomer shift (IS) but different quadrupole splitting values (QS1 = 0.22 mm s−1, QS2 = 0.70 mm s−1) indicates that Fe3+ ions occupy structural positions with a higher (QS1) and a lower (QS2) local symmetry within the same phase. It is worth noting that the high symmetry Fe3+ ions have the most significant contribution to the total spectral area of about 61%. An additional spectral component, like the QS2 doublet, is often observed in the Mössbauer spectra measured for nanoparticles of different iron-doped oxides. It is associated with a relatively significant contribution of iron ions in distorted surface regions [17]. The third minor quadrupole doublet has an isomer shift of 0.34 mm s−1, typical for Fe3+ ions in octahedral coordination, e.g., in the LiGa5O8 structure, which was reported to have a quadrupole splitting comparable to the present case (QS3 = 0.50 mm s−1) [18]. The relative spectral contribution of this minor component does not exceed 5%.
However, the relatively large noise in the spectrum in Figure 4c is related to a weak absorption effect due to the low natural content of the 57Fe isotope in the sample. At first, the spectrum was fitted with only two QS components. However, the residuum and the distribution of quadrupole splitting values calculated for the entire spectrum revealed that the fit could be improved by introducing the QS3 doublet. Such a fitting of the spectrum gave the best value of the chi-square.
The vast majority of Fe3+ ions substitute for Ga3+ at the tetrahedral sites. A minor contribution of Fe3+ at the octahedral sites was observed, most probably due to the presence of the LiGa5O8 phase. Another Mössbauer study of LiAlO2 doped with iron (Fe3+) also shows a comparable IS value of about 0.16 mm s−1 and a QS value of 0.623 mm s−1 [15]. However, in the case of single crystals, Fe3+ occupies only one tetrahedral site.
The EPR measurements were performed to check whether Fe3+ ions occupy more than one lattice site in the LiGaO2 sample. The powder spectrum collected at 9.5 GHz and 3 K is shown in Figure 4d. Here, the practically temperature-independent broad background was subtracted (the spectrum in Figure 4d is the difference between experimental data collected at 3 and 50 K) to emphasize the narrow, iron-related lines. The spectrum shows a rich number of singularities, already at first glance, exceeding the number expected for a single site. Single site, high spin X band powder spectra have been analyzed before, based on spin Hamiltonian parameters obtained independently from the high frequency (95 GHz) analysis and/or single crystal experimental data [19,20,21]. Because of considerable zero field splitting mixing the spin wave functions for | M S , (MS = −5/2, −3/2,…, 3/2, 5/2) at low magnetic fields, and for B, this additional information was necessary to attribute the observed singularities to the extremes and the crossing points in the angular dependencies of characteristic transitions. Attempts to obtain spin Hamiltonian parameters of single, high-spin centers from X-band powder spectra alone have not been reported. In our case, we cannot rely on the support of single crystal or high-frequency data (at high magnetic fields the wave functions reflect accurate spin projections for | M S ), as both the single crystals and the necessary high-frequency equipment are lacking. Therefore, we only present a qualitative analysis aiming to eliminate impossible interpretations of the experimental data.
The Ga and Li sites in LiGaO2 and the octahedrally coordinated Ga sites in LiGa5O8 have all orthorhombic point symmetry. Therefore, the spin Hamiltonian for Fe3+ (including only the second-order crystal field terms) is given by the following equation:
H = μ B S · g · B + S · D · S ,
where the first term is the Zeeman interaction (here S = 5/2, μ B is the Bohr magneton, and g is the spectroscopic splitting tensor), and the second term describes the second-order crystal field splitting of the energy levels. The components of the D tensor fulfill the relation as follows:
Dx + Dy + Dz = 0.
The tetrahedrally coordinated Ga site in LiGa5O8 has a higher C3 point symmetry, for which Dx = Dy.
The only singularities in the powder spectrum that can be unambiguously assigned are the three negative peaks at high magnetic fields labeled “1”, “2”, and “3” in Figure 4d. For Dz > 0, they correspond to −3/2↔ −5/2 transitions (for Dz < 0 to +3/2↔ +5/2). In the first step, we definitely excluded the possibility that all three belong to the same center, since no choice of parameter signs fulfills Equation (2). Also, ascribing any two of the peaks to one center led to the appearance of a prominent structure in the powder simulation that is not observed in the experimental spectrum. Thus, we conclude that we deal with three different centers of orthorhombic symmetry, which agrees with the findings from the Mössbauer effect investigations. Assuming gz = 2, the only parameters that could be unambiguously determined are: |Dz| = 560, 720, and 896 G for centers “1”, “2”, and “3”, respectively. We assign the most intense center “1” to isolated Fe3+ ions on Ga sites in the LiGaO2 phase and the other two to Fe3+ ions with some defects in their vicinity.

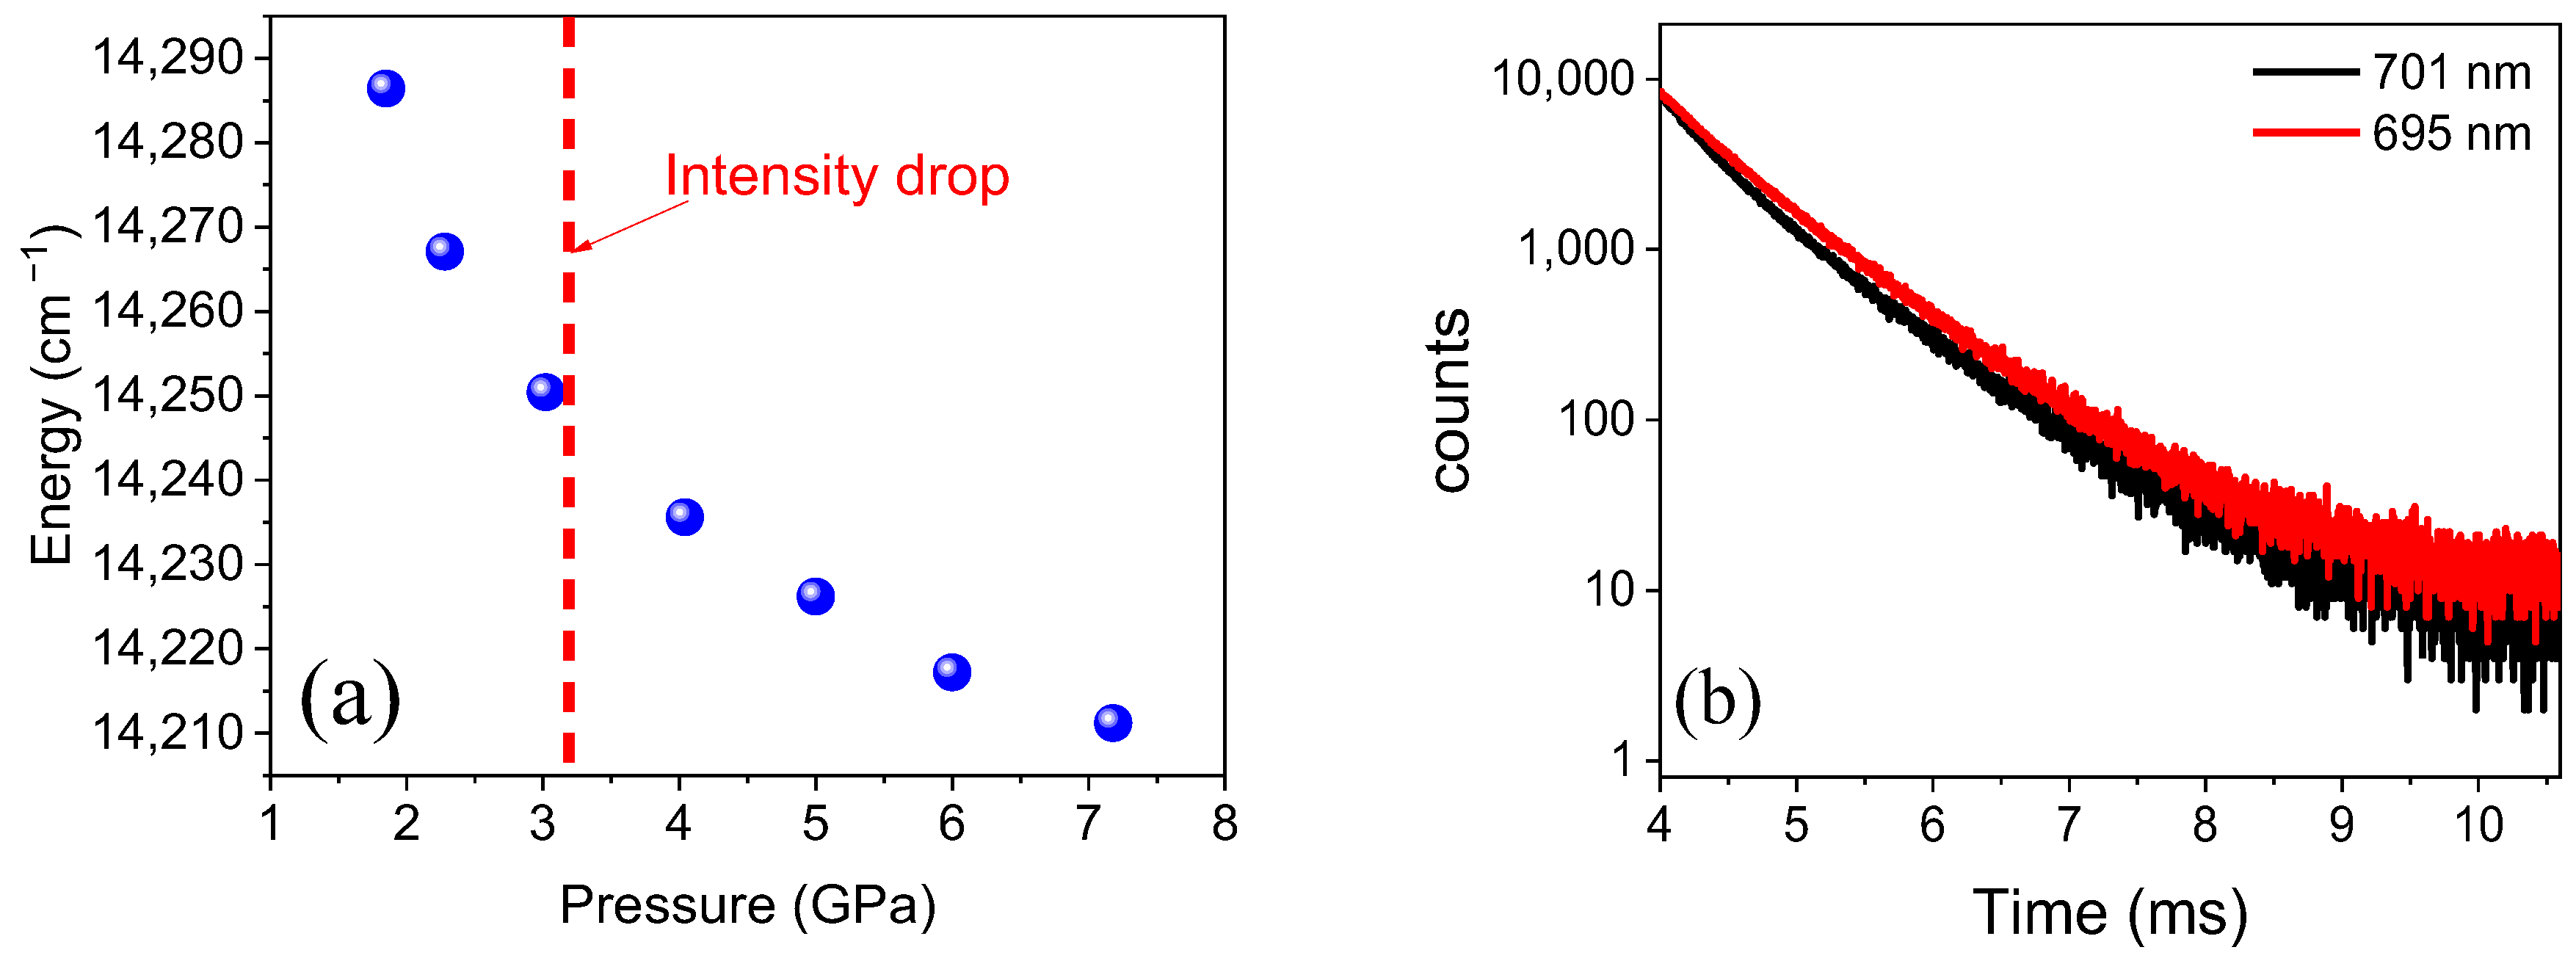
2.3. Low-Temperature Photoluminescence

The luminescence of Fe3+ at 4.5 K is presented in Figure 5a for two excitation wavelengths: 303 nm (blue line) and 265 nm (black line). The dominant spectrum with the peak at 743 nm and the zero phonon line (ZPL) at 709 nm was reported previously and identified as stemming from the 4T1(G)→6A1(S) transition of Fe3+ ions occupying Ga sites in LiGaO2 [10]. Two additional features are observed at shorter wavelengths—a ZPL peak at 695 nm and a phonon replica at 701 nm. The intensity of these peaks increases relative to the 709 nm line under direct excitation to the 4T1g(4P) state (303 nm) as compared to indirect excitation via the charge transfer band (CTB) at 265 nm. This is also visible in the excitation spectra shown in Figure 5b. Apart from the different excitation efficiencies for the 695 and 709 nm emission lines, the positions of the Fe3+ excited states are practically identical, which suggests that we deal with iron ions in only slightly different surroundings. The assignment of the 695 nm center to a tetrahedrally coordinated Fe3+ ion in the LiGa5O8 impurity phase can be excluded, since the ZPL peak should occur at 662 nm [22].
Confirmation that the 695 nm ZPL stems from iron ions in the main LiGaO2 phase is obtained by investigating its behavior under hydrostatic pressure, as shown in Figure 6a. This behavior is identical to that for the isolated Fe3+ center in LiGaO2 reported previously [10]. With increasing pressure, the luminescence peak shifts to lower energy, and its intensity decreases monotonically up to 3 GPa. Above 3 GPa the intensity drastically decreases due to the orthorhombic-to-trigonal phase transition of LiGaO2 [23] (see Figure S3 in the Supplementary Information). The peak disappears above 7 GPa, which we attributed to luminescence quenching due to amorphization of the LiGaO2 phase [10].
Thus, we assign the PL lines at 695 and 701 nm to iron ions with some defects in their vicinity. The low-temperature decay kinetics of the two peaks measured under 303 nm excitation shown in Figure 6b supports such an assignment. The decay times obtained from the fit with a double exponential function yield components with short recombination times of 0.34 ms and 0.31 ms and components with longer times of 0.76 ms and 0.73 ms for the 695 nm and 701 nm peaks, respectively. While the former recombination times are of the same order as those determined for the ZPL at 709 nm and attributed to Fe3+ ions at sites close to the nanocrystal surface, the latter is an order of magnitude shorter than those for isolated Fe3+ ions inside the nanocrystals [10]. Evidently, the presence of defects in the vicinity of iron strongly influences the recombination rate.
Finally, to increase the content of the LiGa5O8 impurity phase, the synthesized sample was annealed at 1450 °C for 4 h under atmospheric conditions. Previous thermal stability studies have shown that LiGaO2 is stable up to 1595 °C [24]. An analysis of the XRD pattern presented in Figure 7a revealed that the content of LiGa5O8 increased from 0.8% [9] to 27%. After annealing, the crystallite sizes estimated using the Debye–Scherrer equation increased from 32 nm [10] to 47.72 nm. Also, the morphology changed from the microrod-like structures in the as-grown material (see Figure S1a) to flake-like shapes of several micrometer diameters, as shown in Figure 7b. However, the shape of the photoluminescence spectrum remained the same as before annealing (see Figure S4 in the Supplementary Information). The slight difference associated with the broader part of the spectrum of the sample annealed at 1450 °C most probably comes from the different morphology of the samples. In particular, no additional emission from Fe3+ in the tetrahedrally coordinated Ga sites in LiGa5O8 was detected. This indicates that Fe3+ preferentially occupies octahedrally coordinated Ga sites in the impurity phase, which agrees with the literature [22]. Such centers only emit very weakly, and no luminescence is observed even for much higher iron concentrations [22].

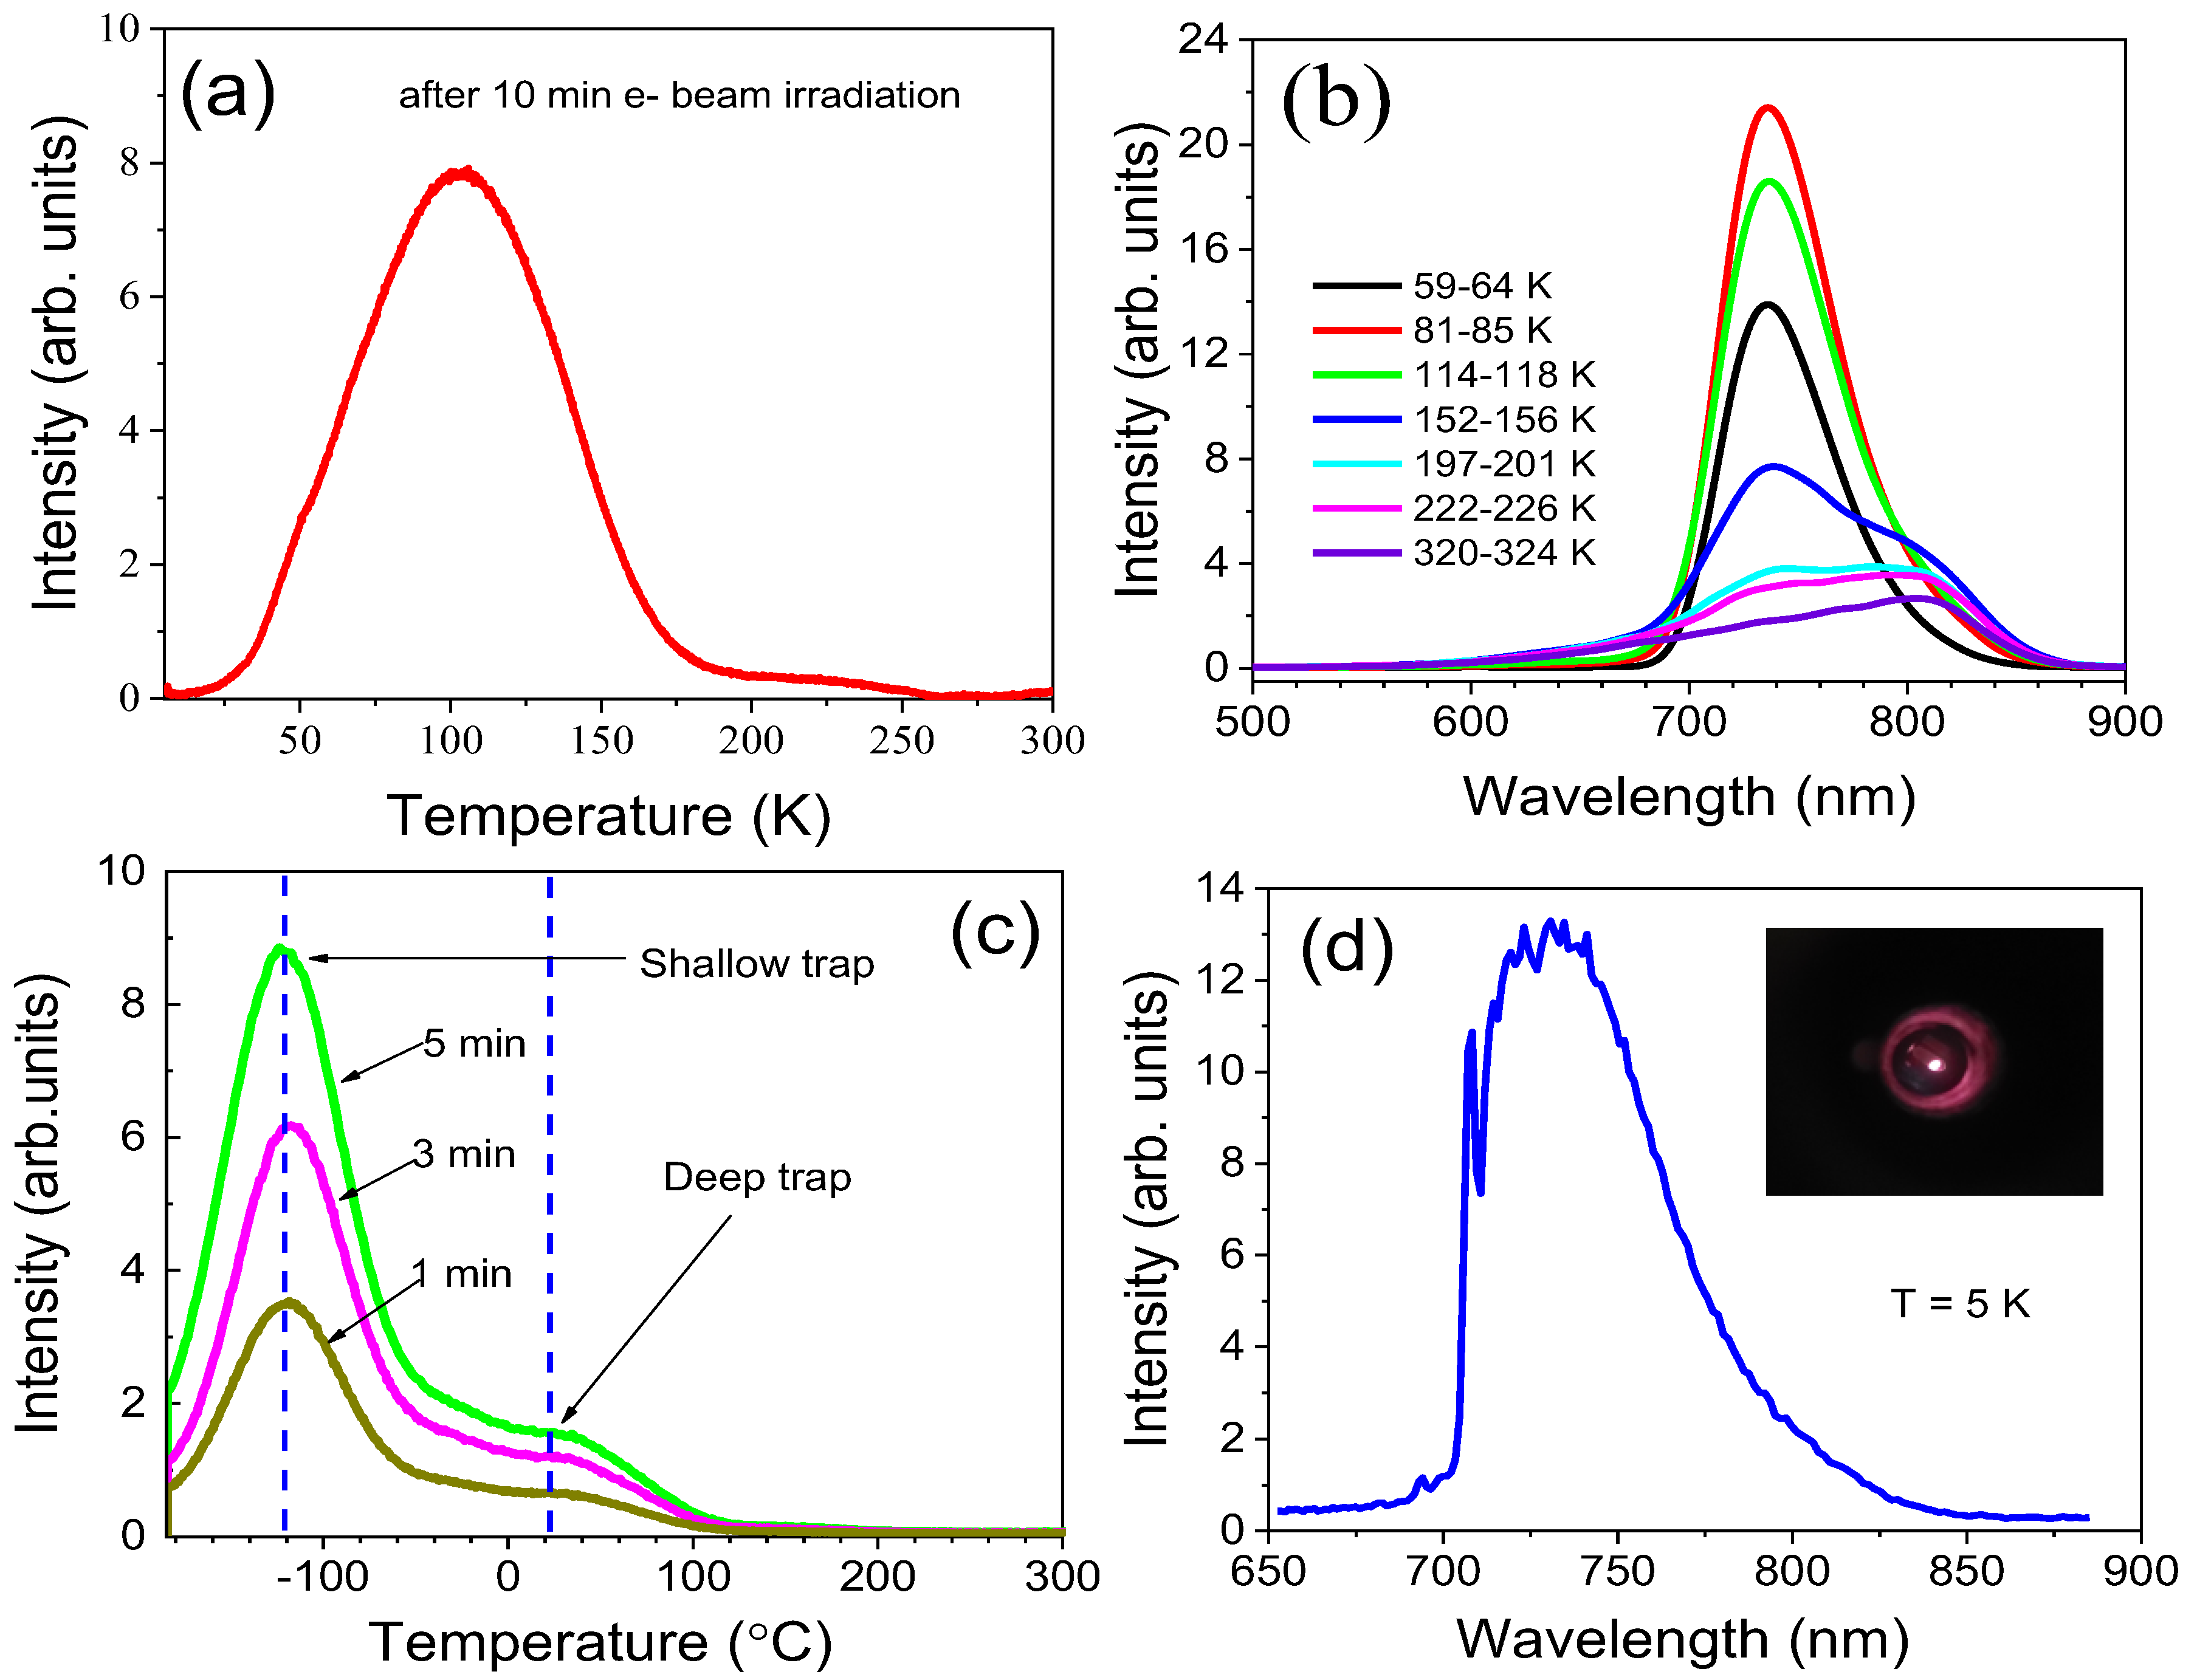
2.4. Thermo-Stimulated Luminescence & Cathodoluminescence

The TSL glow curve monitoring the Fe3+ emission shown in Figure 8a was measured with a heating rate of 0.1 K/s after 10 kV electron beam irradiation. It consists of two peaks, a strong one at 100 K and a weaker one at 220 K, which indicates the existence of at least two kinds of traps in the material. Similar traps were reported in undoped LiGaO2 [25], which suggests their intrinsic origin. Possible candidates are oxygen vacancies and antisite defects [5,7]. Figure 8b presents the emission spectra recorded during warming. As can be seen, in addition to Fe3+ emission, a luminescence band peaked at about 820 nm appears around 150 K. We interpret that this band is due to donor–acceptor recombination of intrinsic defects present in the matrix after electron irradiation. Similar TSL peaks to those shown in Figure 8a are visible after 254 nm excitation (Figure 8c). The peaks are shifted to higher temperatures because of the 10 times higher heating rate of 1 K/s. The increase of TSL intensity after prolonged irradiation (1, 3, and 5 min) indicates that both the shallow and deep traps are not fully populated.
Figure 8d shows the cathodoluminescence spectrum of LiGaO2:Fe3+ at 5 K. Like in low-temperature photoluminescence, the characteristic phonon lines related to the main Fe3+ center are visible in the CL spectrum. The ZPL at 695 nm is very weak compared to the ZPL at 709 nm, confirming that this Fe-defect center is less efficiently excited with the above band-gap irradiation. This is also observed under 160 nm excitation (Figure S2). We note, however, that at high enough excitation energies (Figure 8d and Figure S2), an additional ZPL at 657.6 nm appears, with a similar intensity to that of the 695 nm ZPL. It agrees with the observation of three Fe-related centers in EPR.

3. Experimental Section

3.1. Materials

The 0.25 mol% Fe doped LiGaO2 sample was synthesized by high-temperature solid-state reaction of LiCO3, Ga2O3, and Fe2O3 in stoichiometric ratios. Li2CO3 (99.99%, Aladdin, Shanghai, China), Ga2O3 (99.99%, Aladdin, Shanghai, China), and Fe2O3 (99.99%, Macklin, Shanghai, China) were used as raw materials. The target phosphors were designed in the nominal chemical composition of LiGa1 xO2:xFe3+ (x = 0.0025) considering the preferred occupancy of Ga sites by Fe3+ ions. The starting materials were weighed accurately and mixed thoroughly in an agate mortar. The powdered precursor materials were first heated to 900 °C for two hours in an alumina crucible and then calcined for four hours at 1150 °C, as described in detail in our previous publications [7,10]. The final product contained 99.2% LiGaO2 and 0.8% LiGa5O8 phases [10]. The research reported here is related to the sample containing 0.25% Fe3+, which exhibited the highest luminescence efficiency among the materials with an iron concentration between 0.1 and 2 mol.% [7].

3.2. Experimental Methods

Photoluminescence (PL) excitation, emission, and decay studies were performed on a Horiba fluorolog-3 modular spectrofluorometer with a 450 W xenon lamp as the excitation source. For excitation in the region of vacuum UV (VUV), a 150-W deuterium discharge lamp (Hamamatsu L11798) and a McPherson 234/302 (McPherson Inc, Chelmsford, MA, USA) vacuum monochromator were used. Grating monochromators Andor SR 303i-B (Oxford Instruments, UK) equipped with H8259-02 (Hamamatsu Photonics, Tokyo, Japan) photon counting heads were used for PL detection. Thin pellets were mounted on a sample holder of an ARS closed cycle helium cryostat for measurements in the UV–Vis and vacuum UV (VUV) spectral regions, respectively. All emission spectra were corrected for the monochromator spectral efficiency and spectral sensitivity of the detectors.
The cathodoluminescence equipment included an ARS closed-cycle cryostat (Advanced Research Systems, Macungie, PA, USA) (5–400 K) and two monochromators that cover the spectral range from NIR (1700 nm) to VUV (110 nm): an in-house vacuum double monochromator with a Hamamatsu photomultiplier R6836 and an ARC SpectraPro 2300i monochromator (Princeton Instruments, Teledyne, Waterloo, ON, Canada) with a variety of gratings and detectors. The Kimball Physics EGG-3101 electron gun (Kimball Physics, Wilton, NH, USA) was utilized in both pulsed (10 ns, 5 kHz) and continuous modes.
Thermo-stimulated luminescence measurements were carried out using a liquid nitrogen-cooled FTIR 600 temperature controller from Linkam Scientific (Redhill, UK). Before measurements, the samples were either irradiated at 254 nm with a mercury lamp or electron irradiated at 10 kV.
The Raman spectra were recorded at room temperature with an S&I Gmbh MonoVista CRS+ Raman spectrometer (Anroechte, Germany) with a monochromator from Acton Princeton featuring a holographic grating of 2400 grooves/mm and a nitrogen-cooled CCD detector. The 532 nm laser line was used as the excitation source.
Field Emission Scanning Electron Microscopy (FE-SEM) and Energy Dispersive Spectroscopy (EDS) measurements were performed on a TESCAN setup (model: MAIA3 XMH) equipped with a Schottky FE gun source and ultra-high resolution imaging capabilities with a secondary electron detector (Brno, Czech Republic). The X-ray diffraction (XRD) experiment was performed with a BRUKER D2 PHASER (Preston VIC, Canada) employing Cu Kα radiation and operated at 30 kV and 10 mA. The XRD pattern was collected with a scan step of 0.02° and an acquisition time of 1 s per step. The crystal phase analysis was performed using DIFFRAC.EVA V4.1 evaluating software from BRUKER and ICDD PDF-4 database (2023). Applied semi-quantitative phase analysis is based on comparing the reflection intensities assigned to identified phases and the I/ICOR parameters from cards of PDF standards for these phases.
The X-ray absorption spectroscopy (XAS) and EXAFS measurements at the Fe K-edge were collected in fluorescence mode at the synchrotron I20-scanning Diamond Light Source, Oxfordshire, UK. The beamline is equipped with a four-bounce Si (111) monochromator [26] and a multi-element solid-state Ge detector. The beam size at the sample was 400 × 300 μm2. The spectra were taken at room temperature from a powder LiGaO2:Fe sample pressed into a pellet.
The 57Fe Mössbauer spectroscopy measurement was performed in transmission geometry at room temperature using a 57Co-in-Rh source. The isomer shift values are given relative to the α-Fe standard.
The EPR spectrum was recorded at 3 K with using a BRUKER EMX plus spectrometer operating at 9.5 GHz.
High-pressure measurements were performed in a diamond anvil cell from easyLab Technologies Ltd. (Diksmuide, Belgium) using a mixture of methanol and ethanol (5:1 ratio) as a pressure transmitting medium and ruby as a pressure gauge. The PL spectra were excited with the 275.4 nm Ar-Ion laser line and recorded with a Horiba Jobin-Yvon FHR 1000 monochromator (Glasgow, UK). More details can be found in our previous publications [10,27].

4. Summary and Conclusions

Extensive spectroscopic studies of the 0.25 mol% iron-doped LiGaO2 phosphor were conducted. The EXAFS investigations have shown that the majority of Fe ions are incorporated in tetrahedrally coordinated Ga sites in the lattice. The Mössbauer effect measurements have shown the existence of three kinds of Fe centers, two of them tetrahedrally coordinated in the LiGaO2 phase, the most intense one ascribed to isolated Fe centers within the nanocrystals, and the less intense one to Fe close to the surface. The trace amount of Fe found in octahedral coordination is ascribed to Fe on octahedral Ga sites in the impurity LiGa5O8 phase, detected at 0.8% in X-ray studies.
In photo- and thermo-stimulated luminescence, the dominant emission stems from isolated Fe ions with ZPL at 709 nm. This center is efficiently excited with the above band-gap irradiation, in contrast to the Fe-defect complex with ZPL at 695 nm, for which intra-center excitation is much more efficient. A closer inspection of the PL spectra under high energy excitation reveals the presence of another zero phonon line at 657.6 nm, with an intensity equal to that of the 695 nm ZPL. This finding perfectly agrees with the results of EPR investigations, where three different Fe centers with orthorhombic symmetry were detected. The intensities cannot be directly compared. While the EPR signal intensity is proportional to concentration, the signal intensity depends on excitation efficiency in PL.
Our study also shows the importance of annealing conditions for obtaining a pure LiGaO2 phase. Although only a very small amount of impurity LiGa5O8 was detected after annealing at 1150 °C, there is a chance that even more precisely chosen temperature and time of annealing would lead to a more one-phase composition of the material. Certainly, this could be the subject of further investigations.

Supplementary Materials

The following supporting information can be downloaded at: https://www.mdpi.com/article/10.3390/molecules30112331/s1, Text S1: Antimicrobial properties; Figure S1: a: FE SEM micrograph of the as-grown Fe3+ doped LiGaO2 sample; b. EDS Elemental map of LiGaO2:Fe3+ sample annealed at 1450 °C; Figure S2: Vacuum UV Luminescence and Afterglow; Figure S3: Pressure dependence of the 695 nm emission line intensity; Figure S4: Low temperature luminescence spectra of the sample annealed at 1150 °C, containing mainly LiGaO2 phase, and the sample annealed at 1450 °C, with a large amount of the additional LiGa5O8 phase.

Author Contributions

Conceptualization, A.S., A.K.S. and H.P.; methodology, A.S., P.X., H.P. and Y.Z.; validation, A.G., A.S. and Y.Z.; formal analysis, A.S., H.P. and A.K.S.; investigation, A.K.S., I.R., A.G., M.K., S.H., D.W., J.B., Y.K.E., E.F., P.X., M.T. and H.P.; writing—original draft preparation, A.K.S., H.P. and A.S.; writing—review and editing, A.K.S., H.P. and A.S.; supervision, A.S.; funding acquisition, A.S. and Y.Z. All authors have read and agreed to the published version of the manuscript.

Funding

This work was partially supported by the National Science Centre (NCN), Poland, under grant SHENG 2 number 2021/40/Q/ST5/00336 and NCN projects numbered 2019/33/B/ST8/02142 and 2024/53/B/ST11/01108.

Institutional Review Board Statement

Not applicable.

Informed Consent Statement

Not applicable.

Data Availability Statement

All data regarding this work are included in the main article and the Supplementary Information.

Acknowledgments

We would like to thank the Sophisticated Analytical Instrument Facility (SAIF), Mahatma Gandhi University, Kerala, India, and technical assistant Manju Mohandas for their assistance with the FE SEM measurements, as well as Marek Berkowski of the Institute of Physics, Polish Academy of Sciences, Warsaw, for the high-temperature annealing of the sample, as well as Diamond Light Source for in-house beamtime on I20-Scanning for XAS data collection and to Vitaliy Mykhaylyk for facilitating measurements at Diamond Light Source.

Conflicts of Interest

The authors declare no conflicts of interest.

Abbreviations

The following abbreviations are used in this manuscript:
CTBCharge transfer band
CLCathodoluminescence
EPRElectron paramagnetic resonance
EXAFSExtended X-ray absorption fine structure
EDSEnergy Dispersive Spectroscopy
FE-SEMField Emission Scanning Electron Microscopy
NIRNear-infrared
PLPhotoluminescence
VUVVacuum UV
XASX-ray absorption spectroscopy
XRDX-ray diffraction
ZPLZero phonon line

References

  1. Rashkeev, S.N.; Limpijumnong, S.; Lambrecht, W.R.L. Theoretical evaluation of LiGaO2 for frequency upconversion to ultraviolet. J. Opt. Soc. Am. B 1999, 16, 2217–2222. [Google Scholar] [CrossRef]
  2. Ma, F.; Guan, S.; Wang, Y.J.; Liu, Z.; Li, W. Lithium gallium oxide (LiGaO2): High-performance anode material for lithium-ion batteries. J. Alloys Compd. 2024, 976, 173197. [Google Scholar] [CrossRef]
  3. Zhang, K.; Vangipuram, V.G.T.; Huang, H.L.; Hwang, J.; Zhao, H. Discovery of a Robust p-Type Ultrawide Bandgap Oxide Semiconductor: LiGa5O8. Adv. Electron. Mater. 2023, 11, 2300550. [Google Scholar] [CrossRef]
  4. Tsai, Y.T.; Leśniewski, T.; Majewska, N.; Kamiński, M.; Barzowska, J.; Liu, E.P.; Chen, W.T.; Mahlik, S.; Fang, M.H. Pressure/temperature-assisted crystallographic engineering–A strategy for developing the infrared phosphors. Chem. Eng. J. 2024, 490, 151596. [Google Scholar] [CrossRef]
  5. Lu, X.; Wang, Y.; Yang, J.; Townsend, P.D.; Hreniak, D. LiGa5O8: Fe3+: A novel and super long near-infrared persistent material. Ceram. Int. 2024, 50, 35359–35367. [Google Scholar] [CrossRef]
  6. Riesen, H. On the 6A14T1 luminescence of Fe3+ in disordered nanocrystalline LiGa5O8 prepared by a combustion reaction. Chem. Phys. Lett. 2008, 461, 218–221. [Google Scholar] [CrossRef]
  7. Zhou, Z.; Yi, X.; Xiong, P.; Xu, X.; Ma, Z.; Peng, M. Cr3+-Free near-infrared persistent luminescence material LiGaO2:Fe3+: Optical properties, afterglow mechanism and potential bioimaging. J. Mater. Chem. C 2020, 8, 14100–14108. [Google Scholar] [CrossRef]
  8. Teixeira, V.C.; Manali, I.F.; Gallo, T.M.; Galante, D.; Barbosa, D.A.B.; Paschoal, C.W.A.; Silva, R.S.; Rezende, M.V.D.S. Luminescent properties of Li(Ga1-xCrx)5O8 (LGCO) phosphors. Ceram. Int. 2020, 46, 15779–15785. [Google Scholar] [CrossRef]
  9. Kniec, K.; Tikhomirov, M.; Pozniak, B.; Ledwa, K.; Marciniak, L. LiAl5O8:Fe3+ and LiAl5O8:Fe3+, Nd3+ as a new luminescent nanothermometer operating in 1st biological optical window. Nanomaterials 2020, 10, 189. [Google Scholar] [CrossRef]
  10. Somakumar, A.K.; Bulyk, L.I.; Tsiumra, V.; Barzowska, J.; Xiong, P.; Lysak, A.; Zhydachevskyy, Y.; Suchocki, A. High-Pressure Near-Infrared Luminescence Studies of Fe3+-Activated LiGaO2. Inorg. Chem. 2023, 62, 12434–12444. [Google Scholar] [CrossRef]
  11. Marezio, M. The crystal structure of LiGaO2. Acta Crystallogr. 1965, 18, 481–484. [Google Scholar] [CrossRef]
  12. Rawn, C.J.; Chaudhuri, J. High temperature X-ray diffraction study of LiGaO2. J. Cryst. Growth 2001, 225, 214–220. [Google Scholar] [CrossRef]
  13. Lei, L.; Ohfuji, H.; Qin, J.; Zhang, X.; Wang, F.; Irifune, T. High-pressure Raman spectroscopy study of LiGaO2. Solid State Commun. 2013, 164, 6–10. [Google Scholar] [CrossRef]
  14. Wang, Y.; Jiang, J.; Song, Z.; Zhang, J. Structural characterization &, optical and electrical properties of LiGaO2 & LiGa5O8 micro-nanoparticles-based photodetectors. J. Alloys Compd. 2021, 887, 161438. [Google Scholar] [CrossRef]
  15. Waychunas, G.A.; Rossman, G.R. Spectroscopic standard for tetrahedrally coordinated ferric iron: γ LiAlO2:Fe3+. Phys. Chem. Miner. 1983, 9, 212–215. [Google Scholar] [CrossRef]
  16. Ravel, B.; Newville, M. ATHENA and ARTEMIS: Interactive graphical data analysis using IFEFFIT. Phys. Scr. 2005, 2005, 1007–1010. [Google Scholar] [CrossRef]
  17. Rosowska, J.; Kaszewski, J.; Witkowski, B.S.; Wachnicki, Ł.; Wolska, A.; Klepka, M.T.; Grabias, A.; Kuryliszyn-Kudelska, I.; Godlewski, M. ZnO:Fe nanoparticles with Fe fraction up to 10%mol—Growth and characterization. J. Lumin. 2023, 263, 119944. [Google Scholar] [CrossRef]
  18. Yildirim, B.; Stewart, G.A.; Riesen, H. Structural and Optical Properties of Nanocrystalline LiGa5O8:Fe3+. In Proceedings of the 36th Annual Condensed Matter and Materials Meeting, Wagga Wagga, Australia, 31 January–3 February 2012; pp. 72–75. Available online: https://inis.iaea.org/search/search.aspx?orig_q=RN:49070025 (accessed on 19 March 2025).
  19. Kakazey, M.; Vlasova, M.; Gonzalez-Rodriguez, G.; Salazar-Hernández, B. Fine structure of EPR spectra of Fe3+ in α-Al2O3 crystal, powders, and textured ceramics. Mat. Sci. Eng. B 2002, 90, 114–119. [Google Scholar] [CrossRef]
  20. Koopmans, H.J.A.; Perik, M.M.A.; Nieuwennuijse, B.; Gellings, P.J. The Simulation and Interpretation of the EPR Powder Spectra of Gd3+-Doped LaAlO3. Phys. Status Solidi B 1984, 122, 317–330. [Google Scholar] [CrossRef]
  21. Boldú, J.L.; Muñoz P, E.; Chen, Y.; Abraham, M.M. EPR power pattern analysis for cubic sites of Fe3+ in MgO. J. Chem. Phys. 1984, 80, 574–575. [Google Scholar] [CrossRef]
  22. McShera, C.; Colleran, P.J.; Glynn, T.J.; Imbusch, G.F.; Remeika, J.P. Luminescence study of LiGa5−xFexO8. J. Lumin. 1983, 28, 41–52. [Google Scholar] [CrossRef]
  23. Marezio, M.; Remeika, J.P. High pressure phase of LiGaO2. J. Phys. Chem. Solids 1965, 26, 1277–1280. [Google Scholar] [CrossRef]
  24. Weise, S.; Neumann, H. Thermal Analysis of LiGaO2 and NaGaO2. Cryst. Res. Technol. 1996, 1, 659–664. [Google Scholar] [CrossRef]
  25. Xu, Y.; Wu, J.; Zhang, P.; Yan, Y.; Song, Y.; Yakovlev, A.N.; Hu, T.; Cherkasova, T.G.; Xu, X.; Guo, H.; et al. Employing defect luminescence of LiGaO2 to realize dynamic readout and multiplexing of optical information. Ceram. Int. 2023, 49, 40112–40119. [Google Scholar] [CrossRef]
  26. Hayama, S.; Duller, G.; Sutter, J.P.; Amboage, M.; Boada, R.; Freeman, A.; Keenan, L.; Nutter, B.; Cahill, L.; Leicester, P.; et al. The scanning four-bounce monochromator for beamline I20 at the Diamond Light Source. J. Synchrotron Radiat. 2018, 25, 1556–1564. [Google Scholar] [CrossRef]
  27. Somakumar, A.K.; Zhydachevskyy, Y.; Wlodarczyk, D.; Haider, S.S.; Barzowska, J.; Bindu, K.R.; Edathumkandy, Y.K.; Zayarniuk, T.; Szewczyk, A.; Narayanan, S.; et al. Temperature and pressure dependent luminescence mechanism of a zinc blende structured ZnS:Mn nanophosphor under UV excitation. J. Mater. Chem. C 2024, 12, 7041–7052. [Google Scholar] [CrossRef]
Figure 1. Crystal structures of LiGaO2 and LiGa5O8 phases (blue balls−lithium, yellow−gallium, grey−oxygen).
Molecules 30 02331 g001
Figure 2. EDS maps of oxygen (K-edge) and gallium (L-edge) elements in LiGaO2:Fe3+ (a) and the EDS spectrum (b). Peaks related to C and Au come from the contamination with atmospheric CO2 and the electrical conducting layer of the sample, respectively.
Molecules 30 02331 g002
Figure 3. Raman spectra of the synthesized LiGaO2:Fe sample containing the main, orthorhombic LiGaO2 phase (a) and the cubic LiGa5O8 impurity phase (b).
Molecules 30 02331 g003
Figure 4. (a) Normalized K−edge XAS spectrum of Fe3+ in LiGaO2. (b) Nearest neighbor shell fit (red line) to the Fourier−transform EXAFS data (black line). The fitting range is shown by the blue window. (c) Mössbauer spectrum of LiGaO2:Fe3+ fitted with three quadrupole doublets (QS). (d) EPR spectrum at 3 K after subtraction of the background.
Molecules 30 02331 g004
Figure 5. Emission (a) and excitation (b) spectra of LiGaO2:Fe3+ at 4.5 K. The excitation (λexc) and emission (λem) wavelengths are indicated in the figure. The inset in (a) shows an expanded view of the short wavelength part.
Molecules 30 02331 g005
Figure 6. (a) Pressure dependence of the 695 nm emission line. (b) Decay kinetics recorded at 695 and 701 nm.
Molecules 30 02331 g006
Figure 7. XRD patterns measured for two samples LiGaO2:Fe, as prepared and annealed at 1450 °C, along with reference patterns for the identified phases: LiGaO2 (PDF 04-007-9560) and LiGa5O8 (PDF 00-002-8232) (a) and SEM micrograph (b) of the annealed sample.
Molecules 30 02331 g007
Figure 8. (a) TSL glow curve and (b) TSL spectra after irradiation with an electron beam. (c) TSL glow curves for different times of UV irradiation. (d) CL spectrum of LiGaO2:Fe3+ at 5 K. Inset: image of the NIR CL emission from the phosphor.
Molecules 30 02331 g008
Table 1. Comparison of Raman peaks in the main LiGaO2:Fe3+ and the impurity LiGa5O8:Fe3+ phases with previous Raman studies of undoped LiGaO2 and LiGa5O8 powder samples.
LiGaO2:Fe3+ (cm−1)LiGa5O8:Fe3+ (cm−1)LiGaO2 [13]LiGaO2 [14]LiGa5O8 [14]
129128.4128.7
139.2135.1
202 204.2
219
249.5 252.1252
271.3 270
287.2 289.0289
318.6344 344
397371 372
425 424
435 444.3443
495.3502.8502.1501512
556578 579
605.4 605
640 643.9643
649654653.8655655
714
760760 763763
Disclaimer/Publisher’s Note: The statements, opinions and data contained in all publications are solely those of the individual author(s) and contributor(s) and not of MDPI and/or the editor(s). MDPI and/or the editor(s) disclaim responsibility for any injury to people or property resulting from any ideas, methods, instructions or products referred to in the content.

